200G/400G Transceivers - High Speed test challenges - Kees Propstra - Multilane
←
→
Page content transcription
If your browser does not render page correctly, please read the page content below
200G/400G Transceivers - High Speed test
challenges

Kees Propstra
Outline

▪   Transceiver evolution
▪   Transceiver overview
▪   Introduction test solutions
▪   100G to 200G/400G transition
▪   Measurement challenges
▪   Solutions
Transceiver evolution

      400G                                             OSFP
                                                   QSFP-DD
      100G                               QSFP28

      40G
                                 QSFP+
      10G
                          SFP+

       1G    SFP                         graph for illustrative purposes only

             2000       2005     2010            2015                 2020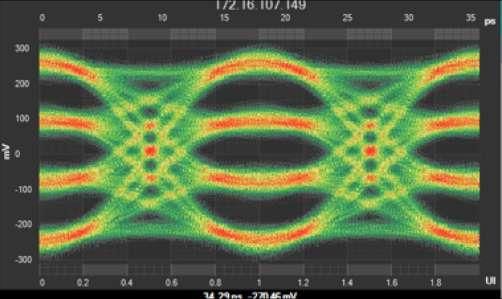
What is next?

                                       Credit: Intel
                                                                             Mid-Board Optics    Co-packaged ASIC & Photonics
                       QSFP28 Module                                         Module

                         Optical                          Embedded optical module
    ASIC    Re-timer     Module                        ASIC                                     ASIC w/ photonics               Fiber
                                                                               Fiber

           PCBA                                                   PCBA                                              PCBA
                        Courtesy: Luxtera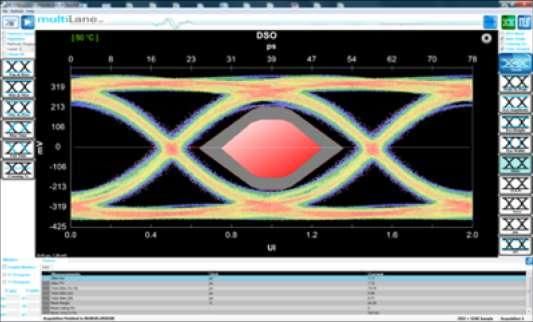
Transceiver overview

 Block diagram for 100G-SR4 PMD   Block diagram for 100G-CWDM4 PMD
 Credit: IEEE 802.3bm-2015        Credit: CWDM4_MSA_Technical_Spec
Introduction test solutions
▪ BERT - Bit Error Rate Tester
▪ DSO – Digital Sampling Oscilloscope
▪ TDR – Time Domain Reflectometry

                                        Tx

                                                DUT
                                        Rx

                TDR                      BERT         DSO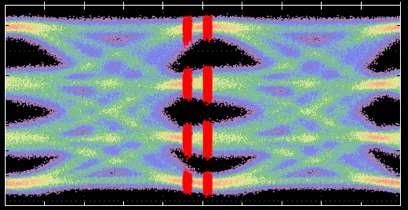
Signal migration from 100G to 200/400G
25G NRZ vs. 50/100G PAM4
                       NRZ
                       ▪ Mask margin is key figure of
                         merit

                       PAM4
                       ▪ 4 levels, 3 eyes, 12 transitions
                       ▪ Simple mask margin probably
                         not a good predictor of link       53GBaud PAM4
                         performance
                       ▪ Effect of fiber link
                       ▪ Receiver equalization
        25G NRZ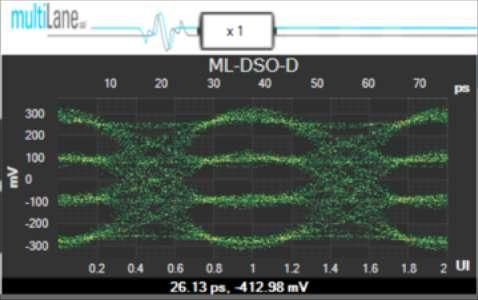
Why PAM4?
Transmission channels are
lossy
▪ 10 dB at 13 GHz typical
Modulator bandwidths are
limited
▪ 40 GHz available today
PAM4 Modulation
▪ Same data throughput at
  half the frequency
▪ Double data rate at the
  same frequency
▪ 2 bits/symbol, data rate = 2
  x symbol rate

                                 one symbol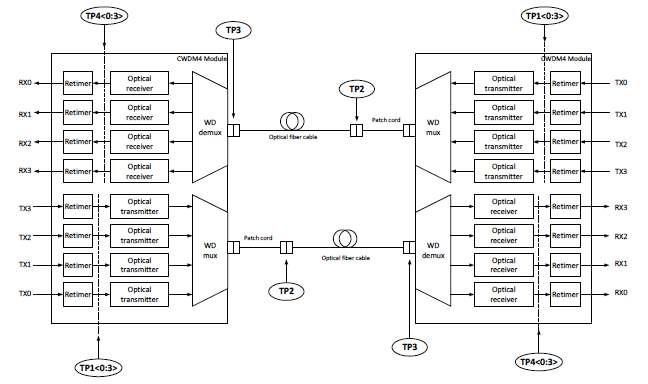
Measurement Challenges - Optical
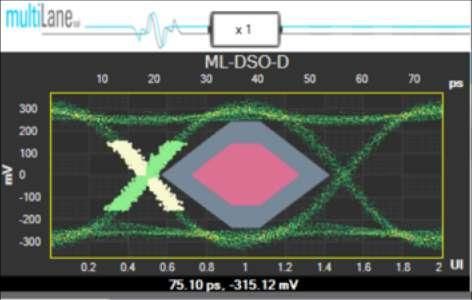
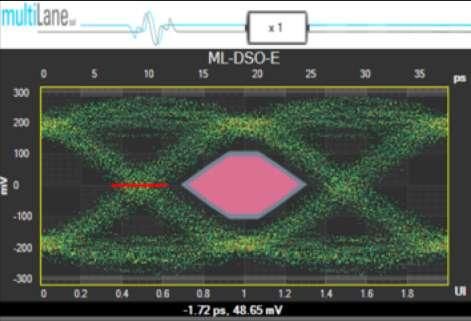
TDECQ - is the new TX metric
Transmitter Dispersion Eye Closure (Quaternary)
 ▪ TDECQ is the “new” mask margin test
   of PAM4, it is a predictor of a system
   performance of a PAM4 transmitter
 ▪ TDECQ Calculates the dB ratio of how
   much noise can be added to the
   transmitter signal while meeting the
   target symbol error ratio
                                            Worst case fiber environment   Reference receiver
 ▪ TDECQ measurements should mimic
   what’s expected for a real receiver
 ▪ There is good correlation between          R is noise margin at a fixed symbol error rate
   TDECQ and link performance
                                              ▪ Higher R is better
                                              ▪ Lower TDECQ is better
TDECQ Measurement Accuracy 0
-5
Transfer [dB]
-10
-15 scope BW
Ideal BT4
-20
It is critical that measurement accuracy is ensured -25
and that multiple test vendors provide identical -30
results 0 1E+10 2E+10 3E+10 4E+10 5E+10
Frequency [GHz]
▪ Measurement equipment correction SIRC
▪ System Impulse Response Correction – compensate the
measurement channel to meet the IEEE defined filter
characteristic
▪ Scope Noise Compensation – TDECQ measurement has a R is noise margin
measurement system noise compensation factor s = O to E and oscilloscope noise
▪ Correlation
▪ Multi-vendor test correlation
▪ IEEE provided standard waveform
(mazzini_3cd_01a_0518)
▪ Correlation typical 0.2 dB
TEK 1.95 dB ML 1.91 dBMeasurement Challenges - Electrical
Typical Test Configuration
                                                       Connector                                                DUT
 ▪ No
   measurements          Instrument
   possible on the
   signal after the
   channel                                             0

   without de-                                        -2

   embedding!                                         -4

                                        dB(S(1,3))
                                                      -6

 ▪ Effect of the                                      -8

   channel must                                      -10

   be de-                                            -12

   embedded.                                         -14
                                                           0   5   10    15       20      25   30   35   40

   This can either                                                            Freq, GHz

   be done using a    Pristine signal                                   Channel                               Distorted signal
   VNA or a DSO
Compensating for Channel Losses
Method 1: DSO De-embedding
▪ Using s-parameters generated in a VNA or a simulation tool
▪ Using s-parameters measured by the DSO
Method 2: FFE taps generated by DSO and used to configure the PPG signal shaper so it
compensates for channel losses (Tx equalization)
Method 3: Error-Detector of the BERT uses an equalizer (FFE, DFE, CTLE) to de-embed
channel losses (Rx equalization)
DUT DSO
Connector
PPG
EDExample of De-embedding using a Scope
Connector
DUT
DSO
DSO measures
and de-embeds
DUT signal
the channel in
after
frequency
Compensating
domain
for the trace
lossesFFE Equalization at 53 GBd using a DSO/PPG
DUT DSO
Connector
PPG
ED
Distorted signal from channel DSO calculates FFE taps FFE taps from DSO loaded
In PPGSolutions
Time
Domain
Analysis
dBm
Frequency
Domain
AnalysisSolutions
ML4035 ML4015D
Cable test, impedance Optical DSO
4 CH 35 GHz 25/40 GHz
SM/MM
ML4039E ML1016D-CR
BERT 4CH Optical Clock
56 GBd, 112 Gbps Recovery
26/53 GBd PAM4
ML4039D/79D ML4015D
BERT 4/8CH Electrical DSO
28 GBd, 56 Gbps 32/50 GHzTHANK YOU
You can also read