A non-genetic, cell cycle-dependent mechanism of platinum resistance in lung adenocarcinoma
←
→
Page content transcription
If your browser does not render page correctly, please read the page content below
RESEARCH ADVANCE

                                     A non-genetic, cell cycle-dependent
                                     mechanism of platinum resistance in lung
                                     adenocarcinoma
                                     Alvaro Gonzalez Rajal1,2,3*, Kamila A Marzec1, Rachael A McCloy4, Max Nobis3,4,
                                     Venessa Chin3,4,5, Jordan F Hastings4, Kaitao Lai1,6, Marina Kennerson1,6,
                                     William E Hughes2,3,7, Vijesh Vaghjiani8, Paul Timpson3,4, Jason E Cain8,9,
                                     D Neil Watkins10,11, David R Croucher3,4†*, Andrew Burgess1†*
                                     1
                                      ANZAC Research Institute, Concord Hospital, Concord, Australia; 2Garvan Institute
                                     of Medical Research, Sydney, Australia; 3St Vincent’s Hospital Clinical School,
                                     University of New South Wales, Sydney, Australia; 4The Kinghorn Cancer Centre,
                                     Garvan Institute of Medical Research, Sydney, Australia; 5St Vincent’s Hospital
                                     Sydney, Darlinghurst, Australia; 6The University of Sydney Concord Clinical School,
                                     Faculty of Medicine and Health, Sydney, Australia; 7Children’s Medical Research
                                     Institute, The University of Sydney, Westmead, Australia; 8Hudson Institute of
                                     Medical Research, Clayton, Australia; 9Department of Molecular and Translational
                                     Medicine, School of Medicine, Nursing and Health Sciences, Monash University,
                                     Clayton, Australia; 10Research Institute in Oncology and Hematology, CancerCare
                                     Manitoba, Winnipeg, Canada; 11Department of Internal Medicine, Rady Faculty of
                                     Health Science, University of Manitoba, Winnipeg, Canada

*For correspondence:
a.rajal@garvan.org.au (AGR);
d.croucher@garvan.org.au (DRC);
                                     Abstract We previously used a pulse-based in vitro assay to unveil targetable signalling
                                     pathways associated with innate cisplatin resistance in lung adenocarcinoma (Hastings et al., 2020).
andrew.burgess@sydney.edu.au
(AB)                                 Here, we advanced this model system and identified a non-genetic mechanism of resistance that
†
                                     drives recovery and regrowth in a subset of cells. Using RNAseq and a suite of biosensors to track
 These authors contributed
                                     single-cell fates both in vitro and in vivo, we identified that early S phase cells have a greater ability
equally to this work
                                     to maintain proliferative capacity, which correlated with reduced DNA damage over multiple
Competing interests: The             generations. In contrast, cells in G1, late S or those treated with PARP/RAD51 inhibitors,
authors declare that no              maintained higher levels of DNA damage and underwent prolonged S/G2 phase arrest and
competing interests exist.           senescence. Combined with our previous work, these data indicate that there is a non-genetic
Funding: See page 24                 mechanism of resistance in human lung adenocarcinoma that is dependent on the cell cycle stage
                                     at the time of cisplatin exposure.
Received: 01 December 2020
Accepted: 11 May 2021
Published: 13 May 2021

Reviewing editor: Maureen E
Murphy, The Wistar Institute,
                                     Introduction
United States                        Lung adenocarcinoma (LUAD) is the most common form of lung cancer and the leading cause of
                                     cancer-related death in Australia. Less than 15% of patients have a targetable driver mutation and
   Copyright Gonzalez Rajal et al.
                                     therefore cannot benefit from targeted therapy (Herbst et al., 2018). Consequently, the overwhelm-
This article is distributed under
                                     ing majority of LUAD patients receive platinum-based chemotherapy as standard of care. The anti-
the terms of the Creative
Commons Attribution License,         tumour abilities of platinum compounds were first identified over 50 years ago with the discovery of
which permits unrestricted use       cisplatin (Kelland, 2007). Since then, cisplatin and its derivatives have become one of the most suc-
and redistribution provided that     cessful groups of chemotherapeutics ever developed. Platinum therapy is essentially curative in tes-
the original author and source are   ticular cancer, with survival rates > 90%, and is also a frontline treatment for small-cell lung cancer,
credited.                            ovarian, head and neck, bladder, and cervical cancers (Gonzalez-Rajal et al., 2020; Kelland, 2007).

Gonzalez Rajal et al. eLife 2021;10:e65234. DOI: https://doi.org/10.7554/eLife.65234                                                    1 of 28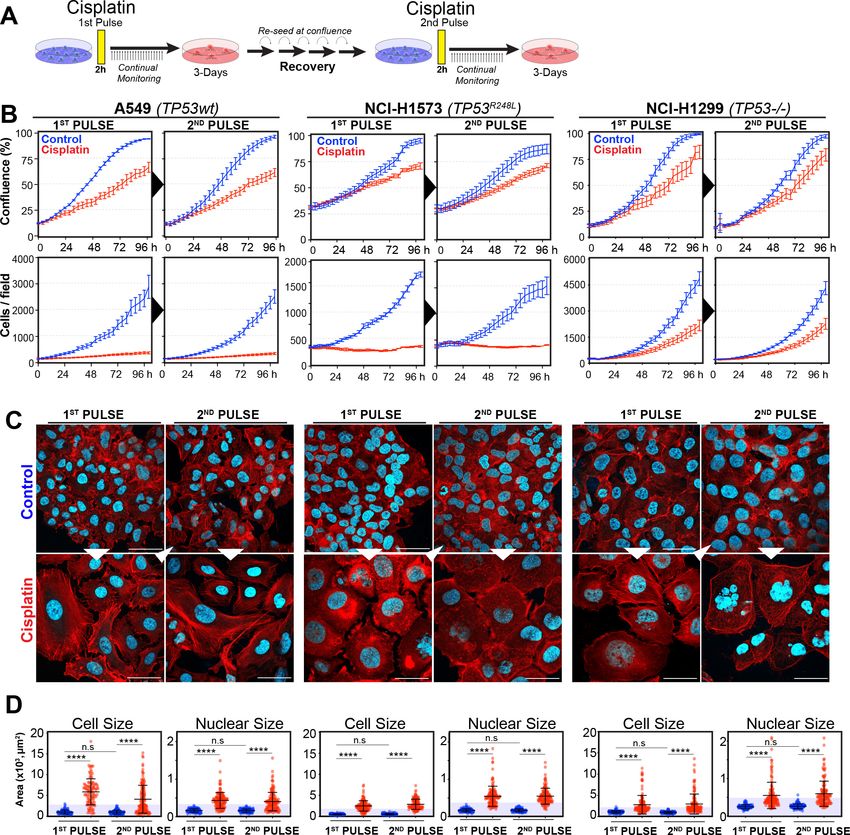
Research advance Cancer Biology Cell Biology
Unfortunately, response rates to platinum in LUAD are below 30%, due primarily to innate resistance
(Herbst et al., 2018). Nearly 150 different mechanisms of platinum resistance have been identified
to date (Stewart, 2007). The vast majority of these mechanisms have been derived from preclinical
models that utilise continuous, high-dose-exposure models, well above what is physiologically
achievable in patients. Unsurprisingly, the majority of these models have failed to translate into
improved clinical outcomes. To overcome this, we recently demonstrated that analysis of an in vitro
assay that accurately models the in vivo drug exposure kinetics for cisplatin could provide therapeu-
tically relevant insights into the signalling dynamics associated with innate resistance
(Hastings et al., 2020). Cisplatin is given to patients as a single bolus dose, reaching a peak plasma
concentration of ~14 mM (5 mg/ml), which is then rapidly cleared by the kidneys within 2–4 hr
(Andersson et al., 1996; Urien and Lokiec, 2004). We therefore mimicked this in vitro by pulsing
cells for 2 hr with the maximum plasma concentration (Hastings et al., 2020).
Once inside cells, platinum compounds can bind to DNA, RNA, and proteins (Gonzalez-
Rajal et al., 2020); however, the binding to DNA, which forms platinum-DNA adducts, is thought to
be the primary mechanism for their tumour-specific killing. Intra-strand DNA-platinum adducts are
repaired by base excision and nucleotide excision repair during G1 (Slyskova et al., 2018). Inter-
strand crosslinks (ICLs) are removed largely by the Fanconi anaemia (FA) pathway (Smogorzew-
ska, 2019), which generates single- and double-strand breaks that are resolved by either the high-
fidelity homologous recombination (HR) pathway during S phase (Karanam et al., 2012) or by the
error-prone non-homologous end joining (NHEJ) pathway during G1 and G2 phase (Enoiu et al.,
2012; Slyskova et al., 2018). Consequently, targeting DNA repair pathways has become a major
focus for enhancing platinum chemotherapies. For example, cells with defective HR repair have been
shown to be highly sensitive to combination therapy with cisplatin and PARP inhibitors in a number
of cancer types, including ovarian and breast (Tutt et al., 2018). However, correlation between cis-
platin sensitivity and impaired DNA repair has often failed to translate clinically in LUAD
(Mamdani and Jalal, 2016). In contrast, we have recently identified TGF-b (Marini et al., 2018) and
P70S6K (Hastings et al., 2020) as key mediators of innate platinum resistance in LUAD. We now
build upon these previous results and identify in this research advance that a sub-population of cells
are capable of continued proliferation despite exposure to pulsed cisplatin. Using a combination of
cell cycle, DNA damage, and replication biosensors together with real-time single-cell fate tracking,
we identified that these proliferative cells were enriched in late G1/early S phase at the time of cis-
platin exposure and were able to sufficiently repair their DNA over multiple generations and rounds
of replication. These results increase our understanding of the complexities underlying non-genetic
resistance and recovery mechanisms in LUAD, while also highlighting mechanistic issues with a num-
ber of current clinical trials focused on combination therapy with cisplatin.
Results
Cells remain equally sensitive upon re-exposure to pulsed cisplatin
In our previous work (Hastings et al., 2020), we identified several targetable signalling pathways
that were associated with resistance to cisplatin in LUAD cells. In this work, our goal was to analyse
the innate mechanisms that enable cell survival after the initial exposure to cisplatin. To assess this,
we analysed how cells respond to a subsequent dose of cisplatin, following recovery from an initial
exposure event. To do this, we pulsed cells with cisplatin (5 mg/ml) and followed their response by
time-lapse imaging. Cells were allowed to recover for 21–42 days (depending on their base rate of
proliferation), before being challenged again with cisplatin, which equates to the approximate time
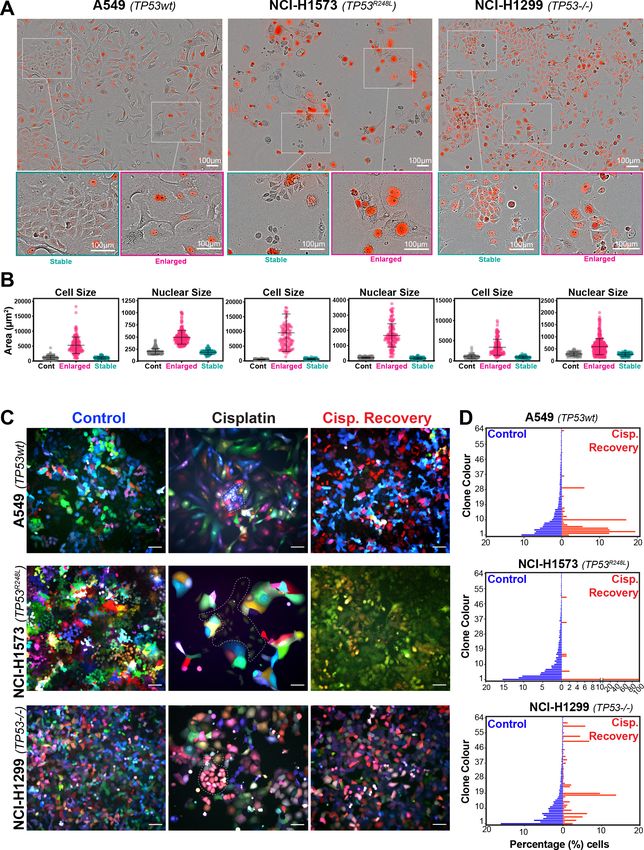
patients normally receive a second dose in the clinic (Figure 1A). We utilised three LUAD cell lines:
A549 (wild-type p53), NCI-H1573 (p53R248L mutant), and NCI-H1299 (p53 null), which were all engi-
neered to stably express histone H2B fused to mCherry, allowing real-time quantitation of cell num-
ber and nuclear size. The initial pulse of cisplatin blocked the proliferation of A549 and NCI-H1573
cells, and significantly reduced NCI-H1299 cell numbers over a 3-day period. This was mirrored in
colony formation assays, with both A549 and NCI-H1573 showing strong suppression of colony out-
growth, while p53-null H1299 cells were impacted to a lesser degree (Figure 1—figure supplement
Gonzalez Rajal et al. eLife 2021;10:e65234. DOI: https://doi.org/10.7554/eLife.65234 2 of 28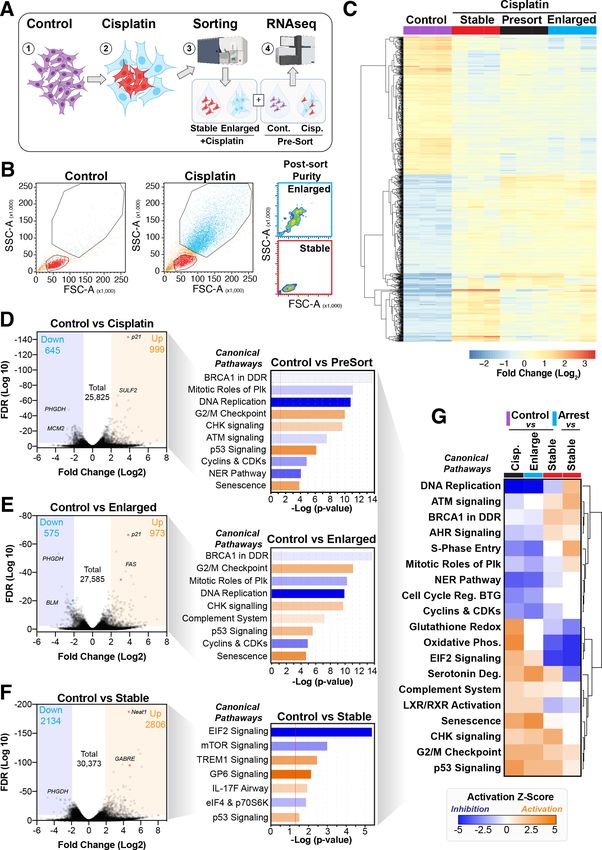
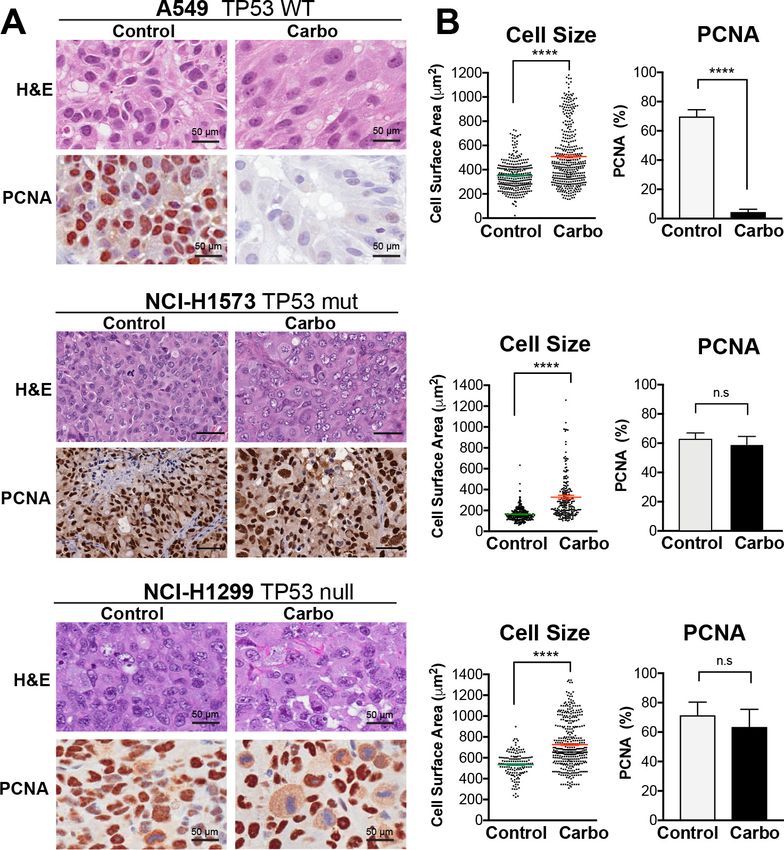
Research advance                                                                                                 Cancer Biology Cell Biology

Figure 1. Rechallenging lung adenocarcinoma (LUAD) cells with cisplatin results in similar response profiles. (A) Schematic of rechallenging
experiments. Briefly, cells stably expressing H2B-mCherry were pulsed with 5 mg/ml cisplatin for 2 hr. Cell proliferation (nuclear number and cell size)
was then tracked for up to 4 days. Cells were then allowed to recover for 21 (A549 and NCI-H1299) or 42 days (NCI-H1573), re-culturing once confluent,
before being re-pulsed with cisplatin. (B) Cell confluence and cell number were tracked for up to 4 days using IncuCyte based time-lapse imaging.
Shown are the mean ± SD of n = 3 biological repeats. (C) Immunofluorescence of cells at 72 hr post-cisplatin treatment. Nuclei: cyan; Phalloidin-Alexa
647: red, scale bar = 10 mm. (D) Quantification of cell size and nuclear size from (A), with a minimum of n = 200 cells analysed per condition. Shown are
the mean ± SD. Statistical significance was determined by one-way ANOVA (****p
Research advance                                                                                          Cancer Biology Cell Biology

                                    1A). Interestingly, there was a less noticeable effect on cell confluence (Figure 1B). Subsequent
                                    visual and quantitative analysis of cells by immunofluorescence revealed a corresponding two- to six-
                                    fold increase in total cell and nuclear area across all three cell lines (Figure 1C, D), accounting for
                                    the reduced impact on confluence. Over the following 7–21 days of recovery (42 days for NCI-H1573
                                    due to slower rate of proliferation), cells eventually recovered to their pre-pulse size and normal cell
                                    cycle distribution (Figure 1C, D, Figure 1—figure supplement 1B). In all three cell lines, subsequent
                                    cisplatin pulse of recovered cultures resulted in a near identical response to the initial pulse, both in
                                    terms of inhibition of cell number, reduced confluence, and increased cell size (Figure 1B–D). Based
                                    on these results, and our previous observation that all cells contained significantly increased levels of
                                    cisplatin-DNA adducts (Hastings et al., 2020), we concluded that cells surviving the first exposure
                                    remained equally sensitive to cisplatin and were therefore unlikely to have acquired resistance or
                                    arisen from an intrinsically resistant sub-clonal population within each cell line.
                                        To assess this, we analysed the variability of cell and nuclear size after the initial pulse of cisplatin
                                    at 3–7 days post exposure. Visual analysis identified several colonies of cells whose size was similar
                                    to that of untreated control cells (Figure 2A, B). We hypothesised that these cells were able to pro-
                                    liferate and outgrow the non-proliferative (arrested) cells over the 21-to-42-day period. In support, a
                                    significant increase in senescence associated beta-galactosidase (b-gal) staining was observed both
                                    visually and by flow cytometry (C12FDG) in A549 and to a lesser extent H1573 and H1299 cell lines
                                    (Figure 2—figure supplement 1A, B). Increased levels of the cyclin-dependent kinase inhibitor p16,
                                    which is commonly linked with senescence, was associated with larger cells in NCI-H1573 and H1299
                                    cells, while in A549 cells, which are null for p16 (Kawabe et al., 2000), p21 was similarly increased
                                    (Figure 2—figure supplement 1C). These data suggest that in each cell line the larger cells have a
                                    lower proliferative capacity and are likely senescent.
                                        To test whether the surviving population arose from a subset of proliferating cells, we utilised the
                                    LeGO RGB colour-guided clonal cell tracking system (Weber et al., 2011). Briefly, each cell line was
                                    co-transfected with three different lentiviral vectors containing either a red, green, or blue fluores-
                                    cent protein. Each cell randomly received a variable amount of each plasmid resulting in a unique
                                    colour code for each cell. Quantitative colour analysis of untreated control cells revealed that up to
                                    64 unique colours could be detected in A549 and NCI-H1299 cells and up to 46 colours in NCI-
                                    H1573 cells (Figure 2—figure supplement 1D). After pulsed exposure to cisplatin, single-colour col-
                                    ony outgrowths were clearly visible in all three cell lines at 3–7 days post exposure, which was main-
                                    tained at 21 for A549 and NCI-H1299 or 42 days for NCI-H1573 cells (Figure 2C, D). Colour
                                    diversity in cisplatin-recovered cells correlated with the colony formation assay data (Figure 1—fig-
                                    ure supplement 1A), with NCI-H1299 (p53 null) cells displaying a greater variability in recovered
                                    clonal colours compared to A549 (p53 wt) and NCI-H1573 (p53 mutant) cells (Figure 2C, Figure 2—
                                    figure supplement 1D). Taken together, these results indicate that repopulation of the culture after
                                    the initial pulse exposure is primarily driven by a small fraction of cells, with the total number of
                                    clones impacted by p53 status.
                                        To confirm these results in vivo, we injected A549, NCI-H1573, or NCI-H1299 cells subcutaneously
                                    into the flanks of nude mice and allowed establishment of tumours (150 mm3) before administering
                                    a single treatment of carboplatin (60 mg/kg). Mice harvested at 3 days post treatment were analysed
                                    by imunohistochemistry (IHC) for cell size and proliferating cell nuclear antigen (PCNA)-positive
                                    staining, with all cell lines showing a significant increase in cell size (Figure 3A, B). Similar to the in
                                    vitro results, active proliferation (PCNA positivity) in A549 cells was strongly suppressed after carbo-
                                    platin exposure, indicating that the majority of cells were not proliferating. In p53 mutant NCI-1573,
                                    there was no significant reduction in PCNA in vivo despite significant reduction in cell numbers in
                                    vitro cells. In contrast, NCI-H1299 cells, which lack p53, did not show any significant decrease in
                                    PCNA staining in vivo (Figure 3A, B). BrdU pulse labelling of in vitro-treated cells showed similar
                                    results, with strong suppression of active BrdU incorporation in A549 cells, with partial and no signifi-
                                    cant inhibition seen in NCI-H1573 and NCI-H1299 cells, respectively (Figure 3—figure supplement
                                    1). In summary, these in vitro and in vivo data suggest that in LUAD cells exposure to pulsed cis-
                                    platin results in a significant proportion of cells increasing in size, with presence of functional p53
                                    correlating with increased senescence and reduced active replication in enlarged cells. Interestingly,
                                    in all three lines, a sub-population of cells remain at a normal (stable) cell size, maintained their pro-
                                    liferative capacity, and drove repopulation of the cell culture. Despite this, these proliferative cells

Gonzalez Rajal et al. eLife 2021;10:e65234. DOI: https://doi.org/10.7554/eLife.65234                                                      4 of 28
Research advance                                                                                                   Cancer Biology Cell Biology

Figure 2. Variable cell size and clonal outgrowth in post-cisplatin-treated cells. (A) Representative images from cells treated as per Figure 1A showing
control (Cont.), proliferative (Prolif.), and arrested (Arrest) cells. Scale bars = 100 mm. (B) Cell and nuclear size were calculated on sub-populations of
cells that appeared to form clonal outgrowths. Quantification of cell size and nuclear size from (A), with a minimum of n = 100 cells analysed per
condition. Shown are the mean ± SD. Statistical significance was determined by one-way ANOVA (****p
Research advance                                                                                                 Cancer Biology Cell Biology

Figure 2 continued
colour-guided clonal cell tracking system was used to track clonal dynamics after cisplatin pulse treatment. Cells were treated as per Figure 1A, with
clonal identification and quantification (D), measured at 3 and 21 days post-cisplatin exposure using Image J/Fiji (42 days post-cisplatin exposure for
NCI-H1573).
The online version of this article includes the following figure supplement(s) for figure 2:
Figure supplement 1. Senescence and LeGo Clonal Recovery of LUAD cells following cisplatin pulse.

                                     remained equally sensitive to subsequent cisplatin treatment, indicating a non-genetic mechanism of
                                     resistance.

                                     Differential RNAseq analysis of cisplatin-treated sub-populations
                                     To better understand the potential mechanism driving the difference between cells that become
                                     enlarged and senescent compared to those that maintain stable size and proliferative capacity, we
                                     performed RNAseq analysis on each unique population. Briefly, A549 cells were pulsed with cis-
                                     platin, harvested at 72 hr, and sorted into stable or enlarged cells based on size. This was deter-
                                     mined by forward scatter (FSC) and side scatter (SSC) parameters, with gates established based on
                                     the size of untreated control cells (Figure 4—figure supplement 1A). Pre- and post-sorted cells
                                     were then processed for RNAseq analysis (Figure 4A, B). Two-way hierarchical clustering indicated
                                     that there were clear differences in gene expression between cisplatin-treated cells that maintained
                                     a stable size compared to untreated control and enlarged cisplatin-treated cells
                                     (Figure 4C, Supplementary files 1–4). To better understand these effects, we undertook a more
                                     detailed bioinformatic analysis using Ingenuity Pathway Analysis (IPA). Strong upregulation of the
                                     CDK inhibitor p21 was present in both pre-sorted cisplatin-treated and post-sorted enlarged cells,
                                     matching the early flow data (Figure 2—figure supplement 1C). This corresponded with upregula-
                                     tion of p53, CHK, and G2/M cell cycle checkpoint signalling, and a corresponding reduction in DNA
                                     replication and increase in senescence pathways (Figure 4D, E), correlating with the increased b-gal
                                     and reduced proliferation observed above (Figure 1B, Figure 2—figure supplement 1B). Impor-
                                     tantly, stable (size) cisplatin-treated cells were significantly different from untreated controls, indicat-
                                     ing that these cells were impacted by cisplatin exposure, similar to our previous reports where all
                                     cells contained detectible cisplatin-DNA adducts post-pulsed exposure (Hastings et al., 2020).
                                     Notably, these stable cells displayed a decrease in EIF2, mTOR, and p70S6K signalling, with a corre-
                                     sponding increase in TREM1, GP6, and IL-17F signalling pathways (Figure 4F, Supplementary files
                                     3 and 4). Four-way comparative analysis further highlighted key differences between each sub-popu-
                                     lation, with stable cells all showing strong upregulation of BRCA1, ATM, and DNA replication signal-
                                     ling pathways, which were heavily suppressed in non-proliferative cells (Figure 4G). Similarly, Gene
                                     Set Enrichment Analysis (GSEA) identified strong enrichment for cell cycle, HR-directed repair, ATR,
                                     and the Fanconi pathway in stable compared to enlarged cells (Figure 4—figure supplement
                                     1B, C). In summary, these data suggest that the cisplatin-treated stable cells are considerably differ-
                                     ent from enlarged and untreated control cells. Specifically, stable cells do not undergo significant
                                     p53/p21-dependent cell cycle checkpoint arrest but do show prominent upregulation of DNA repair
                                     pathways involving HR/BRCA1 and ATM/ATR.

                                     Cell cycle and p53 status at the time of exposure correlates with cell
                                     fate outcomes
                                     The above RNAseq data indicated that there were strong cell cycle-dependent differences between
                                     proliferative and non-proliferative cisplatin-treated cells. To better understand these differences, we
                                     utilised the FUCCI biosensor system to enable real-time cell cycle status of individual cells, as pub-
                                     lished in the previous paper (Hastings et al., 2020). Briefly, asynchronous A549 cells stably express-
                                     ing FUCCI were pulsed with or without cisplatin and then followed by time-lapse microscopy for 72
                                     hr. Individual cells were manually tracked and scored for cell cycle status and cell fate as previously
                                     described (Caldon and Burgess, 2019; Hastings et al., 2020). The majority of control cells divided
                                     at least two times within the 72 hr time period (Figure 5A, Figure 5—video 1). In contrast and as
                                     demonstrated previously (Hastings et al., 2020), cisplatin-treated cells showed a range of cell cycle
                                     perturbations (Figure 5B, Figure 5—figure supplement 1A), including a significant and prolonged

Gonzalez Rajal et al. eLife 2021;10:e65234. DOI: https://doi.org/10.7554/eLife.65234                                                               6 of 28
Research advance                                                                                               Cancer Biology Cell Biology

                                    Figure 3. In vivo validation of cisplatin effects on cell size and proliferation. (A) A549 and NCI-H1299 cells were
                                    injected subcutaneously with 2  106 cells into the flanks of nude mice (n = 5). Carboplatin (60 mg/kg) was
                                    delivered by a single tail-vein injection, and tumours were harvested at 3 days post treatment and analysed by IHC
                                    for cell size and PCNA-positive staining. Scale bar = 50 mm. (B) Quantification of IHC images from (A) (control
                                    n = 300, carbo n = 400). Shown are the mean ± SD. Statistical significance was determined by unpaired two-tailed
                                    Students t-test (****p
Research advance                                                                                              Cancer Biology Cell Biology

Figure 4. Comparative RNAseq analysis of FACS-sorted cisplatin-treated cells. (A) Schematic (created with BioRender.com) describing treatment,
sorting, and analysis pipeline. (B) Representative example of pre- and post-sorted control and cisplatin-treated cells. (C) Hierarchical clustering of
three independent biological repeat experiments of all altered genes identified by RNAseq. (D–F) Volcano plots displaying significantly downregulated
(blue) or upregulated (orange) genes and subsequent Ingenuity Pathway Analysis (IPA) canonical pathway analysis. Predictions of inhibition (blue) or
Figure 4 continued on next page

Gonzalez Rajal et al. eLife 2021;10:e65234. DOI: https://doi.org/10.7554/eLife.65234                                                           8 of 28
Research advance                                                                                            Cancer Biology Cell Biology

Figure 4 continued
activation (orange) or no change (white) states are based on the IngenuityKnowledge Base, which compares the expected change with experimental
observation to all known upstream canonical regulatory pathways. Variable stringent p-value (>1.3) and z-score (>0.5) cut-offs were used to limit
pathways to top 7–8 most significant hits. (G) Hierarchical clustering of IPA comparative canonical pathway analysis.
The online version of this article includes the following figure supplement(s) for figure 4:
Figure supplement 1. FACS sorting and RNAseq analysis of A549 cells pulsed with cisplatin.

                                    data suggest that there is a cell cycle-dependent mechanism driving the ability of A549 cells to con-
                                    tinue to proliferate after cisplatin exposure.
                                        Our above data indicated that loss of p53 increased the number of clones capable of regrowth
                                    after cisplatin exposure. To assess this in greater detail, we analysed asynchronous FUCCI expressing
                                    NCI-H1299 (p53 null) cells pulsed with or without (Control) cisplatin. Treatment with cisplatin signifi-
                                    cantly reduced the number of overall divisions in H1299 cells (Figure 5—figure supplement 2A–C);
                                    however, compared to A549 cells, this reduction was not as pronounced, in line with the cell prolifer-
                                    ation data observed above (Figure 1B). Single-cell fate tracking of NCI-H1299 cells suggested a
                                    small bias for higher rates of division in cells that were in late G1 and early S phase at the time of
                                    treatment (Figure 5—figure supplement 2B, C); however, this trend was not significant (Figure 5—
                                    figure supplement 2D). We further assessed p53 loss by reanalysing our previously published data
                                    on siRNA knockdown of p53 in A549 cells (Hastings et al., 2020). Notably, depletion of p53 in A549
                                    cells resulted in a corresponding increase in the number of divisions completed after pulsed expo-
                                    sure to cisplatin, supporting the NCI-H1299 data (Figure 5—figure supplement 2E).
                                        To validate these results in vivo, we implanted FUCCI expressing A549, NCI-H1573, or NCI-
                                    H1299 cells under optical windows in mice (Figure 5D). Tumours were allowed to establish before
                                    mice were given a single dose of carboplatin. Individual mice were then repeatedly imaged over 7
                                    days post treatment. Notably, prior to cisplatin treatment, approximately 70–80% of cells from each
                                    line were in G1 phase (Figure 5E, F, Figure 5—figure supplement 3A, B). Similar to in vitro results,
                                    we observed an increase in proportion of S/G2 phase cells at day 1 in all cell lines, indicating that
                                    cells were arrested in S/G2. In A549 cells, the percentage of S/G2 cells reduced gradually from day
                                    3 to 7, resulting in over 90% of A549 cells in a G1 like state (red) at 7 days post treatment
                                    (Figure 5E, F). In contrast, the percentage of S/G2 cells in both NCI-H1573 or NCI-H1299 increased
                                    until day 3, before returning to pre-treatment levels by day 7 (Figure 5—figure supplement 3A, B).
                                    This mirrored our above in vitro data, where the presence of wild-type p53 (in A549 cells) corre-
                                    sponded with a higher rate of G2-exit and senescence compared to p53 null and mutant cells
                                    (Hastings et al., 2020), suggesting that the results we observed in vitro are recapitulated in vivo.

                                    Cisplatin treatment during late G1 early S phase correlates with
                                    multiple divisions
                                    The above data indicated that in p53 wild-type cells those in late G1 and early S phase at the time
                                    of exposure had a greater capacity to undergo multiple division compared to cells G1 and S-G2/M
                                    phase. To assess this in greater detail, we synchronised and released FUCCI expressing A549 cells
                                    into either G1 or early S phase using either palbociclib or thymidine, respectively (Figure 6A, B, Fig-
                                    ure 6—video 1, Figure 6—video 2). We combined these synchronisations with pulsed exposure to
                                    cisplatin at various points following release to target G1, early or late S phase populations, which
                                    were then monitored by time-lapse microscopy. To target G1, cells were pulsed with cisplatin upon
                                    release from palbociclib (Cis at G1). This resulted in the majority of cells undergoing a prolonged S/
                                    G2 phase and then exiting back into a G1-like state without undergoing mitosis (G2-exit;
                                    Figure 6C), a state we described previously (Hastings et al., 2020). Notably, only 7/50 cells com-
                                    pleted a single division, and no cells underwent multiple (two or more) divisions during the 72 hr
                                    time period (Figure 6A–D; proliferative). In contrast, targeting cells in G1/S (Cis at G1/S) using either
                                    palbociclib or thymidine synchronisation with cisplatin resulted in significantly more cells (13/50 and
                                    16/50, respectively) completing two or more divisions (Figure 6A–D; proliferative). Finally, nearly all
                                    cells targeted in late S phase (Cis at S) completed the first mitosis and then underwent prolonged S/
                                    G2 arrest and G2-exit, with only 4 out of 50 cells completing two divisions within the 72 hr period

Gonzalez Rajal et al. eLife 2021;10:e65234. DOI: https://doi.org/10.7554/eLife.65234                                                         9 of 28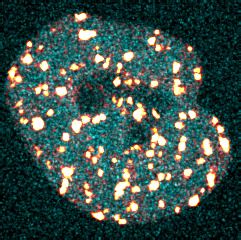
Research advance Cancer Biology Cell Biology
A Control B Cisplatin
M
M
S/G2
S/G2
G1/S
G1
G1/S
0 1000 2000 3000 4000 5000 1 2 3 4
Time (min) # of Mitosis
C Control Cisplatin
** ****
5 n.s
** n.s n.s
**** n.s n.s
# of Divisions
G1
4
3
2
1
0
G1 G1/S Early S-G2 G1 G1/S Early S-G2
S &M S &M
0 1000 2000 3000 4000 5000 1 2 3 4
Time (min) # of Mitosis
D M
G1 F Saline
G2 100
FUCCI
Percentage %
80
S Repeat
Imaging 60
Day 0 1 2 3 5 7 40
MP
z-stack 20
+/- Carboplatin Imaging
(Carbo) 0
E 0 1 3
Time (days)
4 7
Saline Carbo Saline Carbo
Carbo
100
Day 7
Day 1
80
Percentage %
60
40
20
0
0 1 3 4 7
Time (days)
Figure 5. Cell cycle and p53 status at the time of exposure correlates with cell fate outcomes. (A, B) The fate of asynchronously growing FUCCI
expressing A549 individual control (n = 50) and cisplatin pulsed cells (n = 100) was tracked by time-lapse microscopy, with images taken every 30 min
for 72 hr. Cisplatin-treated cell analysis was slightly biased for cells that underwent multiple divisions. (C) Violin plots of the number of divisions from
cells in (A, B), based on the cell cycle phase at the time of cisplatin exposure. Statistical significance was determined by one-way ANOVA with Tukey’s
Figure 5 continued on next page
Gonzalez Rajal et al. eLife 2021;10:e65234. DOI: https://doi.org/10.7554/eLife.65234 10 of 28Research advance Cancer Biology Cell Biology Figure 5 continued correction for multiple comparisons (**p
Research advance Cancer Biology Cell Biology
A Palbo
24h
Cisplatin
@ 0h
Palbo Cisplatin B Cisplatin
@ -2h Release Thy 24h Release
Cisplatin
Release
24h Release @ 6h Thy 24h @ 4h LIVE CELL IMAGING
WASH
WASH
LIVE CELL IMAGING LIVE CELL IMAGING
WASH
LIVE CELL IMAGING
G1 G1/S G1/S G1/S S
G1 Targeting G1/S Targeting G1/S Targeting S Targeting
Mitosis
S/G2
G1/S
G1
0 1000 2000 3000 4000 0 1 2 3 4 0 1000 2000 3000 4000 0 1 2 3 4 0 1000 2000 3000 4000 0 1 2 3 4 0 1000 2000 3000 4000 0 1 2 3 4
# Mitosis # Mitosis # Mitosis # Mitosis
Time (min) Time (min) Time (min) Time (min)
Cell Fates Total Divisions
C D 6 ****
G1 AAM G2 exit DAM
Prolif. ****
G1 ABM G2 Arrest DBM 5
# of Divisions
4 *
Release
Palbo
3
Cis@ G1
2
Cis@ G1/S ****
1
Thymidine
Release
0
Cis@ G1/S
-1
Cis@ G1
Cis@ G1/S
Cis@-G1/S
Release
Release
Cis@ S
Cis@ S
0 20 40 60 80 100
Percentage of Population %
Palbo Thymidine
Figure 6. Cell cycle-dependent regulation of cisplatin response. (A, B) Schematic of palbociclib (Palbo) and thymidine (Thy) protocols used to
synchronise FUCCI expressing A549 cells in G1, G1/S, and S phase prior to 2 hr cisplatin pulse treatment. Specifically, G1 cells were released from
palbociclib and pulsed immediately with cisplatin (Palbo + Cis at G1). G1/S cells were pulsed with cisplatin at 6 hr post release from palbociclib
(Palbo + Cis at G1/S), or alternatively G1/S phase cells targeted by treatment with cisplatin 2 hr prior to release from thymidine (Thy + Cis at G1/S).
Finally, S phase cells targeted by pulsing with cisplatin at 4 hr post-thymidine release (Thy + Cis at S). The fate of individual cells (n = 50) was tracked by
time-lapse microscopy, with images taken every 30 min for 72 hr. (C) Quantification of cell fate outcomes from (A), including G1 arrest before mitosis
(G1 ABM), G1 arrest after mitosis (G1 AAM), death before mitosis (DBM), and death after mitosis (DAM) and proliferative (Prolif.). (D) Quantification of
the total number of cell divisions observed in each condition (n = 50). Mean is shown, statistical significance was determined by one-way ANOVA with
Tukey’s correction for multiple comparisons (****pResearch advance Cancer Biology Cell Biology
A
Max
Mid-S Late-S G2 Anaphase Cytokinesis G1 Early-S Mid-S Late-S
Apple-53BP1trunc
Control
0 min 120 330 450 510 810 1290 1590 1710
NEBD Cytokinesis G1 Early-S Mid-S Late-S G2 Cytokinesis G1
Min
1950 2010 2190 2310 2790 2940 3120 3240 4320
G1 Early-S Mid-S Late-S G2
Max
G1
Min
0 min 180 390 630 1110 1800 2910 4320
Early-S Mid-S Late-S G2 NEBD Cytokinesis Early-S Mid-S Late-S
Apple-53BP1trunc
Early-S
0 min 180 390 840 990 1050 1500 1800 1950
G2 Metaphase Cytokinesis Early-S Mid-S Late-S G2 Cytokinesis G1
2430 2640 2700 3000 3420 3600 3840 4050 4320
Max
Mid-S Late-S G2 NEBD Cytokinesis G1 Early-S
Mid-S
Min
0 min 150 270 360 750 810 990 1740 1890
Mid-S
Apple-53BP1trunc
PCNA
DSB Chromobody
2100 2340 2700 3300 4320 PCNA
B Control G1 Early-S Mid-S
S
G2
M
G1
200 5
53BP1 Number
53BP1-Area
PCNA Foci
150 4
3
100 Checkpoint Threshold
Num
mber Num
mber
2
50
Av.Area 1
Av.Area Av.Area
0
0 1000 2000 3000 4000 0 1000 2000 3000 4000 0 1000 2000 3000 4000 0 1000 2000 3000 4000
C 1470
Time
Time
300
Time
Time
2010
Time
Time
1830
Time
Time
Apple-53BP1trunc
Apple-53BP1trunc
Apple-53BP1trunc
Apple-53BP1trunc
5µm 1µm
1590 390 2070 1980
1650 630 2100 2040
PCNA Chromobody
PCNA Chromobody
PCNA Chromobody
PCNA Chromobody
1680 720 2220 2130
1710 810 2430 2310
Figure 7. Dual DNA replication and damage biosensor analysis of cisplatin-treated cells. (A) Representative maximum image projections of A549 cells
co-expressing a mNeonGreen tagged PCNA chromobody (cyan) and a truncated version of 53BP1 tagged with mApple (trunc53BP1-mApple; red-hot
LUT). Cells were imaged using confocal microscopy, with 10-mm-thick z-stack (1 mm slice) taken every 30 min for 72 hr. Scale bar 10 mm. (B)
Quantification of the size and number of PCNA and 53BP1 foci for each cell shown in (A). (C) 3D volume renders from cells in (A) for the indicated
Figure 7 continued on next page
Gonzalez Rajal et al. eLife 2021;10:e65234. DOI: https://doi.org/10.7554/eLife.65234 13 of 28Research advance Cancer Biology Cell Biology
Figure 7 continued
times, with cropped zoom areas (right image). White arrows indicate 53BP1 foci that reduce in size over time (min). Scale bars 5 mm and 1 mm for left
and right panels, respectively.
The online version of this article includes the following video and figure supplement(s) for figure 7:
Figure supplement 1. Additional analysis of dual DNA replication and damage biosensor analysis of cisplatin-treated cells.
Figure 7—video 1. Dual DNA replication and damage biosensor analysis of cisplatin-treated cells.
https://elifesciences.org/articles/65234#fig7video1
efficient repair in the subsequent daughter and grand-daughter cells. In contrast, cells in G1 had
much greater levels of damage and remained arrested in the first G2 phase. Cells in mid/late S
phase completed the first division while acquiring damage but were unable to sufficiently repair the
damage before mitosis. Consequently, daughter cells with unrepaired damage had increased rates
of mitotic induced breaks as they attempted the second round of DNA replication, leading to a
strong S/G2 phase checkpoint arrest, similar to cells initially exposed during G1.
Based on these results, we hypothesised that cells in early S phase were better able to take
advantage of the high-fidelity HR pathway, whose activity peaks in mid-S phase (Karanam et al.,
2012) compared to G1 or late S phase. To test this, we utilised the PARP inhibitor, olaparib, to trap
PARP at single-strand break sites, leading to increased rates of replication fork stalling and reduced
capacity to repair double strand breaks (DSBs) by HR (Murai and Pommier, 2018). We hypothesised
that this would increase the rate of damage in all cells and reduce the ability of early S phase cells to
repair during the first cell cycle. To test this, A549 FUCCI cells were targeted in G1/S phase with cis-
platin by synchronising with palbociclib or thymidine, as previously described (Figure 6A, B). Cells
were then treated with or without olaparib (PARPi) for 1 hr prior to pulsed cisplatin exposure and
monitored by time-lapse microscopy (Figure 8A). In cells treated with cisplatin, co-treatment with
PARPi significantly reduced the total number of divisions (Figure 8B), indicating that cells were
unable to continue proliferating. This correlated with a trend toward G1 delay in palbociclib and sig-
nificant G1 delay in thymidine-synchronised cells (Figure 8C). Interestingly, although co-treatment
with PARPi decreased the percentage of proliferative (two or more divisions) cells, there was only a
small increase in death observed (Figure 8D), indicating that PARPi alone is not sufficient to drive
increased toxicity to cisplatin in A549 cells. Importantly, inhibition of PARP did increase the rate of
53BP1 foci formation compared to cisplatin alone in asynchronous cells (Figure 8E). Furthermore,
this correlated with a significant increase in both the amount of g-H2AX staining and the size of cells
(Figure 8F). We further validated these results by inhibiting RAD51 with RI-1, to target HR-mediated
repair. RAD51 inhibition (RAD51i) had no significant effect on cell growth compared to untreated
controls (Figure 8—figure supplement 1A). Single-cell fate tracking of FUCCI expressing A549 cells
revealed a small but significant decrease in the number of divisions completed by early S phase cells
treated with RI-1 and cisplatin compared to cisplatin alone. This correlated with a reduction in per-
centage of cells completing two or more divisions (proliferative) and an increase in the percentage
of cells undergoing a G2-exit phenotype (Figure 8—figure supplement 1B–D). Taken together,
these data suggest that targeting DNA repair pathways during the first replication cycle results in
more DSBs and pronounced S/G2 cell cycle checkpoint arrest leading to G2-exit, likely due to a
reduced ability to repair DNA damage. This in turn reduces the ability of cells to undergo further
rounds of replication and division.
Discussion
In this work, we have identified a novel, non-genetic mechanism of resistance to platinum chemo-
therapy, which facilitates continued proliferation in a subset of LUAD cells after pulsed exposure to
cisplatin. These cells eventually outgrow the majority of arrested cells over the course of 3 weeks in
vitro. However, upon re-exposure, they remained equally sensitive, indicating that the mechanism of
resistance is not hard-wired, nor did cells acquire resistance after the first exposure. Quantitative sin-
gle-cell fate tracking revealed that cells in late G1/early S phase at the time of exposure had a
greater proliferative capacity after pulsed cisplatin exposure. This suggests that cell cycle stage at
the time of exposure impacts how cells respond to cisplatin. Interestingly, cisplatin treatment of
Gonzalez Rajal et al. eLife 2021;10:e65234. DOI: https://doi.org/10.7554/eLife.65234 14 of 28Research advance Cancer Biology Cell Biology
Cisplatin Cisplatin
Palbo PARPi 2h Thymidine PARPi 2h
WASH
A
WASH
Release
WASH
G1 S
Release
G1 24 h Release
6h
1h
S 24 h 1h
+ PARPi +PARPi + Cis @ G1/S + PARPi +PARPi + Cis @ G1/S
Mitosis
S/G2
G1/S
G1
0 1000 2000 3000 4000 0 1 2 3 4 0 1000 2000 3000 4000 0 1 2 3 4 0 1000 2000 3000 4000 0 1 2 3 4 0 1000 2000 3000 4000 0 1 2 3 4
# Mitosis # Mitosis # Mitosis # Mitosis
Time (min) Time (min) Time (min) Time (min)
Cell Fates
B Total Divisions C G1 Length after 1st Mitosis D G1 AAM G2 exit DAM
5 5000 ns Prolif.
* *** *** G1 ABM G2 Arrest DBM
**** ** ****
# of Divisions
4 4000 +PARPi
Palbo
***
Time (min)
3 3000 Cis@ G1/S
2 2000 Cis+PARPi
Thymidine
1
1000 +PARPi
0
0 Cis@ G1/S
Cis@ G1/S
Cis@ G1/S
Cis@ G1/S
+PARPi
Cis+PARPi
Cis+PARPi
+PARPi
Cis+PARPi
Cis+PARPi
+PARPi
+PARPi
Cis@ G1/S
Cis+PARPi
0 20 40 60 80 100
Percentage of Population %
Palbo Thymidine Palbo Thymidine
Control PARPi
E 100
Number of 53BP1 Foci/Cell F 10
7
Q1
2.61
Q2
0.41
10
7
Q1
3.77
Q2
1.07
100
***
Control PARPi Cisplatin Cis+PARPi
(%) Population
6 6
10 10
80
5
75 10 10
5
60
4 4
10
Percentage of Population %
10
50 40
3 3
10 10
20
25 0
Q4 Q3
0
Q4 Q3
γ-H2AX
3 94.8 2.19 3 89.7 5.48
15 Foci
10
7
Q1 Q2
10
7
Q1
5.89
Q2
57.6 80
7.40 43.6
40 10
6
10
6
60
30 10
5
10
5
***
20
* 10
4
10
4
40
20
10 10
3
10
3
0 0
Q4 Q3
0
Q4 Q3
0
3 26.5 22.6 3 12.1 24.4
-10 -10
PA rol
Pi
+P tin
C ispl i
C RP
0 4 8 12 16 20 24 0 5.0M 10M 15M 0 5.0M 10M 15M
AR
t
is a
on
Time (h) post Cisplatin Pulse
Cell Size (FSC)
C
Figure 8. Inhibition of PARP reduces ability of early S phase cells to maintain proliferative capacity. (A) Schematic of palbociclib (Palbo) and thymidine
(Thy) protocols used to synchronise FUCCI expressing A549 cells in G1, early and late S phase prior to olaparib (PARPi; 1 mM) and 2 hr cisplatin (5 mg/
ml) pulse treatment. The fate of (n = 50) individual cells was tracked by time-lapse microscopy, with images taken every 30 min for 72 hr. Quantification
of the total number of cell divisions (B) and G1 length after (C) first mitotic division observed in each condition. Statistical significance was determined
Figure 8 continued on next page
Gonzalez Rajal et al. eLife 2021;10:e65234. DOI: https://doi.org/10.7554/eLife.65234 15 of 28Research advance Cancer Biology Cell Biology Figure 8 continued by a one-way ANOVA test with correction for multiple comparisons (****p
Research advance                                                                                       Cancer Biology Cell Biology

                                    time of exposure may have higher levels of cisplatin-DNA adducts. In support, as G1-treated cells
                                    entered S phase, we noted increased numbers and size of 53BP1 foci, indicating widespread DSBs.
                                    This in turn correlated with prolonged S/G2 delays, indicating activation of DNA damage checkpoint
                                    signalling. Furthermore, we previously observed strong phosphorylation and activation of the G2
                                    checkpoint proteins Chk1/2 across all LUAD cell lines after pulsed cisplatin exposure
                                    (Hastings et al., 2020). Similarly, RNAseq data from enlarged A549 cells showed consistent activa-
                                    tion of G2/M checkpoint pathways. Notably, sustained S/G2 DNA damage has been shown to lead
                                    to ATR-mediated checkpoint signalling and sustained p21 expression, blocking CDK activity and pre-
                                    venting FOXM1-dependent G2 transcription required for mitotic entry (Saldivar et al., 2018). Pro-
                                    longed p21 expression can lead to S/G2 checkpoint-arrested cells undergoing a G2-exit and
                                    senescence-like state (Baus et al., 2003; Feringa et al., 2018). This provides an explanation for why
                                    cells with a functional p53/p21 pathway were more likely to undergo G2-exit, had higher rates of
                                    senescence, and reduced numbers of cell divisions compared to those lacking p53.
                                        In contrast, cells in mid-late S or G2/M phase at the time of exposure proceeded through the first
                                    division with minimal delays, although numerous chromatin bridges were observed between separat-
                                    ing daughter cells, which correlated with increased rates of mitotic and post-mitotic death (Figure 9).
                                    Similarly, loss, mutation, or, as we demonstrated previously, suppression of p53 signalling through
                                    inhibition of P70S6K (Hastings et al., 2020) resulted in more cells entering mitosis and undergoing
                                    mitotic and post-mitotic death. This likely explains why cells that lacked p53 were more likely to
                                    undergo multiple aberrant divisions in vitro and maintain positive PCNA staining in vivo as they
                                    lacked the ability to instigate a stable S/G2 cell cycle checkpoint arrest. Notably, chromatin bridges
                                    are often indicative of decatenation failure and increased replication stress (Sarlós et al., 2017), and
                                    are commonly formed after DNA damage caused by chemotherapies such as cisplatin. These
                                    bridges are often repaired by HR during S phase (Chan et al., 2018; Chan and West, 2018), but if
                                    repair is not completed before mitosis, they can lead to increased rates of cytokinesis failure, chro-
                                    mosome instability, and cell death during or post-mitotic division (Bakhoum et al., 2014;
                                    Burgess et al., 2014; Hayashi and Karlseder, 2013). Importantly, chromosome instability has been
                                    linked to cancer heterogeneity, metastasis, and acquisition of chemoresistance (Sansregret et al.,
                                    2018), with single chromosome gains sufficient to reduce cisplatin-mediated cell death by delaying
                                    cells in G1 and slowing proliferation rate (Replogle et al., 2020), highlighting the complexity and
                                    inter-dependence between innate and acquired resistance mechanisms.
                                        Thirdly, cells in late G1 and early S phase showed a greater propensity to undergo multiple divi-
                                    sions following exposure to cisplatin. This correlated with lower levels of 53BP1 foci during the first
                                    round of replication, which reduced further in subsequent daughter and grand-daughter cells. A
                                    likely explanation is that early S phase cells would encounter cisplatin adducts during the first repli-
                                    cation cycle, initiate repair using high-fidelity HR (Figure 9), which peaks during mid-S phase
                                    (Karanam et al., 2012). In contrast, error-prone NHEJ, which is preferred during G1 and G2, is likely
                                    favoured by cells exposed during G1 and late S phase (Karanam et al., 2012). In support, RNAseq
                                    analysis showed enrichment for HR-associated BRCA1-mediated signalling pathways in stable-sized
                                    cells compared to enlarged cisplatin-treated cells. It would be of interest to confirm this through
                                    future analysis of transcriptomes of cell cycle phase sorted cells. Consequently, cells exposed during
                                    early S phase likely have more time and capacity to detect and accurately repair damage, thereby
                                    avoiding chromatin bridges during mitosis compared to those treated later in S phase. In support,
                                    the 53BP1 foci resolved more quickly prior to the first mitosis in early S phase-treated cells. Post-
                                    mitotic G1 phase 53BP1 nuclear bodies increased in size from daughter to grand-daughter cells,
                                    indicating increased efficiency in identification and corralling of unrepaired DNA damage during the
                                    previous replication cycle. These G1 53BP1 nuclear bodies prevent daughter cells from encountering
                                    damaged DNA during replication (Watts et al., 2020), thereby avoiding deleterious fork stalling.
                                    For under-replicated DNA, this provides the cell with a second chance at repair (Spies et al., 2019).
                                    The partial repair in the first cell cycle also likely ensures a pulsed p21 response (Hsu et al., 2019)
                                    with lower levels preventing arrest in the following G1 phase (Barr et al., 2017), helping promote
                                    continued proliferative capacity.
                                        Finally, this work also indicates the potential for complications when co-administering platinum
                                    chemotherapies with other targeted and cell cycle altering therapies such as palbociclib. Specifically,
                                    pre- or co-administration of palbociclib with platinum may inadvertently synchronise cells in late G1/
                                    early S phase, resulting in a higher proportion of cells repairing the damage during the first cell cycle

Gonzalez Rajal et al. eLife 2021;10:e65234. DOI: https://doi.org/10.7554/eLife.65234                                                 17 of 28
Research advance Cancer Biology Cell Biology
and maintaining proliferative capacity. In support, current clinical trials in head and neck cancer
where both agents were given at the same time have resulted in no improvement to cisplatin ther-
apy and resulted in significant treatment-related toxicity (Swiecicki et al., 2020). Conversely, admin-
istering palbociclib after cisplatin (and other chemotherapies) improves response and notably
represses HR-dependent DNA repair (Salvador-Barbero et al., 2020).
In summary, this work increases the understanding of the mechanisms driving recovery from cis-
platin treatment and identifies the need for novel combination therapies that not only enhance cell
death, but also prevent non-genetic, cell cycle-dependent resistance mechanisms.
Materials and methods
Key resources table
Reagent type
(species) or
resource Designation Source or reference Identifiers Additional information
Cell line (Homo A549 ATCC CCL-185, RRID:CVCL_0023
sapiens)
Cell line (Homo NCI-H1299 ATCC CRL-5803, RRID:CVCL_0060
sapiens)
Cell line (Homo NCI-H1573 ATCC CRL-5877, RRID:CVCL_1478
sapiens)
Transfected mVenus-hGeminin Sakaue-Sawano et al., 2008
construct (1/110) (plasmid)
(human)
Transfected mCherry-hCdt1 Sakaue-Sawano et al., 2008
construct (30/120) (plasmid)
(human)
Transfected Cell Cycle- Chromotek ccr Recloned into a pLVX
construct Chromobody plasmid lentiviral backbone with
(human) TagRFP replaced with
mNeonGreen
Transfected 53BP1trunc-Apple Addgene 69531, RRID:Addgene_69531 53BP1 C-terminally
construct fused to
(human) mApple fluorescent
protein Yang et al., 2015
Transfected B_mCherry_IRES_neo3 Addgene 21044, RRID:Addgene_21044 Steigemann et al., 2009
construct
(human)
Transfected LeGO-Cer2 (Cerulean) Addgene 27338, RRID:Addgene_27338 Weber et al., 2008
construct
(human)
Transfected LeGO-V2 (Venus fluorescent protein) Addgene 27340, RRID:Addgene_27340 Weber et al., 2008
construct
(human)
Transfected LeGO-C2 (mCherry) Addgene 27339, RRID:Addgene_27339 Weber et al., 2008
construct
(human)
Antibody Anti-p21 Waf1/Cip1 Cell Signaling Technology 2947, RRID:AB_330945 Flow (1:200)
(Rabbit monoclonal)
Antibody Anti-p16 Ink4a Abcam AB201980, RRID:AB_2891086 Flow (1:200)
(Mouse monoclonal)
Antibody Anti-gamma H2A.X Cell Signaling Technology 9718, RRID:AB_2118009 Flow (1:200)
(phospho S139)
antibody
(Rabbit monoclonal)
Antibody Anti-PCNA Abcam AB29, RRID:AB_303394 IHC (1:500 1:2000)
(Mouse monoclonal)
Continued on next page
Gonzalez Rajal et al. eLife 2021;10:e65234. DOI: https://doi.org/10.7554/eLife.65234 18 of 28Research advance Cancer Biology Cell Biology
Continued
Reagent type
(species) or
resource Designation Source or reference Identifiers Additional information
Antibody Alexa Fluor Plus 647 Thermo Fisher Scientific RRID:AB_A32733, RRID:AB_2633282 Flow (1:500)
Secondary Antibody (Rabbit polyclonal)
Antibody BrdU-FITC BD Biosciences 347583, RRID:AB_400327 Flow (1:20)
(Mouse monoclonal)
Chemical Alexa Fluor 647 Phalloidin Thermo Fisher Scientific RRID:AB_A22287, RRID:AB_2620155 IF (1:40,000)
compound, drug
Chemical Cisplatin Hospira Australia 88S035
compound, drug
Chemical Carboplatin Abcam ab120828
compound, drug
Chemical Olaparib Selleck Chem S1060
compound, drug
Chemical Palbociclib Selleck Chem S1116
compound, drug
Chemical RI-1 Selleck Chem S8077
compound, drug
Chemical PureLink RNase A Thermo Fisher Scientific 12091021
compound, drug
Chemical C12FDG (5- Thermo Fisher Scientific D2893
compound, drug Dodecanoylamino
fluorescein
Di-b-D-Galactopyranoside)
Chemical H33342 Sigma B2261 1 mg/ml
compound, drug
Chemical Propidium Iodide Thermo Fisher Scientific P3566
compound, drug
Chemical Thymidine Selleck Chem S4803
compound, drug
Chemical BrdU Thermo Fisher Scientific B23151
compound, drug (5-Bromo-20 -
Deoxyuridine)
Commercial ImaGene Green Molecular Probes I2904
assay or kit C12FDG lacZ
Gene Expression Kit
Other Matrigel Bio-Strategy BDAA354230
Basement Membrane
Software Fiji/Image J NIH RRID:SCR_002285 https://imagej.net/Fiji
(Schindelin et al., 2012)
Software, FlowJo BD Biosciences RRID:SCR_008520 https://www.flowjo.com
algorithm
Software, GraphPad Prism (v9.1.0) GraphPad RRID:SCR_002798 https://www.graphpad.com
algorithm
Software, Huygens Professional Scientific RRID:SCR_014237 https://svi.nl/
algorithm Volume Imaging (SVI) Huygens-Professional
Software, LAS-X Leica RRID:SCR_013673 https://www.leica-
algorithm microsystems.com/
products/microscope-
software/p/leica-las-x-ls/
Antibodies, plasmids, and reagents
The gH2A.X (S139) (AB26350), p16 (AB201980), and PCNA (AB29) antibodies were from Abcam
(MA, USA), and p21 antibody (2947) was purchased from Cell Signaling Technology (MA, USA).
BrdU-FITC antibody was purchased from BD-Biosciences (BD-347583). Alexa-647 Conjugated Phal-
loidin antibody was purchased from Thermo Fisher Scientific (A22287). The plasmids for FUCCI live-
Gonzalez Rajal et al. eLife 2021;10:e65234. DOI: https://doi.org/10.7554/eLife.65234 19 of 28Research advance Cancer Biology Cell Biology
cell imaging, mVenus-hGeminin(1/110) and mCherry-hCdt1(30/120), were a kind gift from Dr Atsushi
Miyawaki (Riken, Japan). The LeGO plasmids were obtained from Addgene (#27338, #27339,
#27340) (Weber et al., 2008). Thymidine (S4803), olaparib (S1060), palbociclib (S1116), and RI-1
(S8077) were from Selleck Chem (MA, USA). Deoxycytidine (sc-231247) was from Santa Cruz Bio-
technology (TX, USA). BrdU was purchased from Thermo Fisher (B23151). Cisplatin was obtained
from Hospira Australia (B23151) and carboplatin from Abcam (ab120828).
Cell lines
The following LUAD cell lines were used: cell line (Homo sapiens) A549 ATCC CCL-185, RRID:CVCL_
0023. Cell line (H. sapiens) NCI-H1299 ATCC CRL-5803, RRID:CVCL_0060. Cell line (H. sapiens) NCI-
H1573 ATCC CRL-5877, RRID:CVCL_1478. All cell lines were authenticated by short tandem repeat
polymorphism, single-nucleotide polymorphism, and fingerprint analyses, passaged for less than 6
months. All cell lines were confirmed as negative for mycoplasma contamination using the MycoAlert
luminescence detection kit (Lonza, Switzerland).
Stable cell lines expressing the FUCCI biosensor were generated previously (Hastings et al.,
2020). H2B-mCherry cells were generated by lentiviral transfection, followed by FACS sorting of
low-expressing clones. Finally, dual chromobody and 53BP1 A549 cells were generated by lentiviral
transfection with the PCNA chromobody, with low-expressing clones isolated by cell sorting. These
were then subsequently transfected (lentiviral) with truncated form of 53BP1 fused to mApple
(Apple-53BP1trunc), with cells sorted based on both mNeonGreen and mApple to isolate dual
expressing clones.
All LUAD cell lines were cultured in Advanced RPMI (Gibco, 12633012) containing 1% FCS and
1% GlutaMAX (35050-061, Gibco) under standard tissue culture conditions (5% CO2, 20% O2) as pre-
viously described (Hastings et al., 2020; Marini et al., 2018).
Colony formation assay and senescence-associated b-Gal assay
For colony formation assays, cells were seeded on 6-well plates, pulsed with cisplatin (or not), and
1–2 weeks later, colonies were stained with 0.5% crystal violet and counted using ImageJ/Fiji soft-
ware. For b-Gal assays, cells were seeded on 6-well plates, pulsed with cisplatin (or not), fixed and
stained at 3 days, following manufacturer’s protocol (Cell Signaling Technology, #9860). Unpaired
Student’s t-tests along with bar graphs were generated using GraphPad Prism (v9.1.0).
LeGO clonal analysis
A549, NCI-H1573, and NCI-H1299 cells were transfected with LeGO lentiviral particles (Addgene
plasmids #27338, #27339, #27340) Weber et al., 2008 following the method described in
Weber et al., 2012. Cells were treated with/without cisplatin, and images were taken at 3 days and
at 21 days (A549 and NCI-H1299) or 42 days (NCI-H1573) after cisplatin exposure. 100 images were
taken per timepoint and per condition (three replicates), and the experiment was done twice. The
total number of clones (unique colour cues) and the number of cells within each clone was deter-
mined. Briefly, images are opened and converted to 16-bit .tif files. An image is duplicated and con-
verted to RGB overlay. The duplicate has background subtracted using a rolling ball at 250
considering colours separately and using a sliding parabaloid. The image is smoothed using a mean
filter radius 5. Using the ‘find maxima’ function, a point within individual cells is identified and then
enlarged to a circle radius of 5 pixels. These regions of interest (ROI) are then applied as a mask to
the unprocessed, raw, image data and the average red, green, and blue values within these ROI col-
lected and exported in .csv format. RGB values from each of the .csv files for each of the 100 images
are compiled. Data from cells where an R, G, or B value is too high or too low are removed. 512
unique colours were identified, and cells were classified and assigned to each of the 512 colours.
More than 90% of all cells were assigned to one of the 64 most represented colours, with analysis
performed using these 64 groups and positive clonal colour assigned when the colour repre-
sented >0.1% of the population. Graphs were generated using GraphPad Prism (v9.1.0).
Animal experiments
Animal experiments were conducted in accordance with the Garvan/St Vincent’s Animal Ethics Com-
mittee (guidelines ARA 18_17, ARA_16_13) and in compliance with the Australian Code of Practice
Gonzalez Rajal et al. eLife 2021;10:e65234. DOI: https://doi.org/10.7554/eLife.65234 20 of 28Research advance Cancer Biology Cell Biology
for Care and Use of Animals for Scientific Purposes. Mice were kept in standard housing at a 12 hr
daylight cycle and fed ad libitum. Cage enrichment refinement was undertaken with mice implanted
with mammary optical imaging windows, supplying the fully plastic IVC cages with papier-mâché
domes, feeding supplied in trays on the cage floor and soft tissues as nesting material. For in vivo
xenograft models, A549 cells (2 106) were resuspended in 100 ml PBS:Matrigel (1:1) and injected
subcutaneously into the flanks of BALB/c-Fox1nuAusb mice (Australian BioResource). Tumour growth
was assessed twice weekly by calliper measurement, and mice were randomised to treatment arms
when tumours reached 150 mm3 (using the formula: width2 length 0.5). Carboplatin (60 mg/kg)
was delivered by a single i.p injection. Tumours were harvest at 3–7 days post treatment and ana-
lysed by IHC for cell size and PCNA-positive staining.
Implantation of optical imaging windows
BALB/c-Foxn1nu/Ausb mice were injected with 1 106 A549-FUCCI subcutaneously near the ingui-
nal mammary fat pad. Following the development of palpable tumours, mice were engrafted with
titanium mammary imaging windows (Russell Symes & Company) as described previously
(Gligorijevic et al., 2009; Kedrin et al., 2008; Nobis et al., 2017; Ritsma et al., 2013). Briefly, mice
were treated with 5 mg/kg of the analgesic carprofen (Rimadyl) in pH neutral drinking water 24 hr
prior and up to a minimum of 72 hr post surgery. Mice further received subcutaneous injections of
buprenorphine (0.075 mg/kg, Temgesic) immediately prior to and 6 hr post surgery. The titanium
window was prepared 24 hr prior to surgery by gluing a 12 mm glass coverslip (Electron Microscopy
Science) using cyanoacrylate to the groove on the outer rim of the titanium window. Following
anaesthetic induction at 4% isoflurane delivered via a vaporizer (VetFlo) supplemented with oxygen,
mice were kept at a steady 1–2% maintenance anaesthesia for the duration of the surgery on a
heated pad. The incision site was disinfected using 0.5% chlorhexidine/70% ethanol. A straight inci-
sion was made into the skin above the developed subcutaneous tumour and following blunt dissec-
tion of the skin surrounding the incision a purse string suture (5-0 Mersilk, Ethicon) placed. The
windows were then inserted and held in place by tightening the suture, disappearing along with the
skin into the groove of the window and tied off. Mice were allowed to recover for a minimum of 72
hr post surgery, actively foraging, feeding, and grooming within minutes from being removed from
the anaesthesia respirator. A minimum of 24 hr prior to imaging and treatment mice were weaned
off the carprofen analgesic in the drinking water.
In vivo imaging
Mice were imaged under 1–2% isofluorane on a heated stage (Digital Pixel, UK) prior to and 1 day, 2
days, 3 days, and 7 days after i.p. injection of 60 mg/kg carboplatinum (Sigma) or the saline vehicle.
Multi-photon imaging was performed using a Leica DMI 6000 SP8 confocal microscope using a 25
0.95 NA water immersion objective on an inverted stage. For A549-FUCCI imaging the Ti:Sapphire
femto-second laser (Coherent Chameleon Ultra II, Coherent) excitation source operating at 80 MHz
was tuned to 920 nm and the RLD-HyD detectors with 460/40, 525/50, and 585/40 bandpass emis-
sion filters used to detect the second harmonic generation (SHG) of the collagen I, mAzamiGreen,
and mKO2, respectively. Images were acquired at a line rate of 400 Hz, 512 512 pixel, and a line
average of 8.
Flow cytometry analysis and sorting
Samples for flow cytometry were fixed in 20˚C ethanol overnight, and then stained with a primary
antibody against p21 (Cell Signal Technology, 2947), p16 (Abcam, ab201980), or gamma-H2A.X
(S139) (Abcam, ab26350) followed by incubation with an Alexa Fluor 647 secondary antibody (Invi-
trogen). For DNA content analysis, cells were stained with 1mg/ml propidium iodide (PI) and treated
with 0.5mg/ml RNAaseA for at lease 1 h prior to analysis. Flow cytometry was performed using a
Beckman CytoFlex S. For BrdU incorporation analysis, cells were incubated with BrdU at 10 mM for 2
hr before overnight ethanol fixation at 20˚C. An antibody against BrdU coupled with FITC (BD-
347583) was used for staining, and flow cytometry was done using a Beckman CytoFlex S. For senes-
cence assays, we used ImaGene Green C12FDG lacZ Gene Expression Kit (Molecular Probes,
I-2904). Three days after cisplatin exposure, cells were incubated for 30 min with Bafilomycin A1
(Sigma, B1793) in RPMI medium without phenol red (Gibco) supplemented with 1% FBS before
Gonzalez Rajal et al. eLife 2021;10:e65234. DOI: https://doi.org/10.7554/eLife.65234 21 of 28You can also read