Characterization of Coloured Gemstones by X-ray Micro Computed Tomography
←
→
Page content transcription
If your browser does not render page correctly, please read the page content below

minerals
Article
Characterization of Coloured Gemstones by X-ray Micro
Computed Tomography
René Heyn 1, *, Abraham Rozendaal 1 , Anton Du Plessis 2                          and Carene Mouton 1

                                          1   Department of Earth Sciences, Stellenbosch University, Stellenbosch 7602, South Africa; ar@sun.ac.za (A.R.);
                                              18695612@sun.ac.za (C.M.)
                                          2   Department of Physics, Stellenbosch University, Stellenbosch 7602, South Africa; anton2@sun.ac.za
                                          *   Correspondence: rheyn@sun.ac.za

                                          Abstract: The monetary value of gemstones is based on five variables: rarity, cut, weight, color and
                                          clarity. The latter refers to internal impurities and defects. Fashion may also dictate demand and price.
                                          To enhance some of these features and value, gemstones are treated. Disclosure or nondisclosure
                                          thereof has been controversial and affected consumer confidence. Most of these treatments are
                                          difficult to detect with the naked eye and accurately quantify with traditional optical and analytical
                                          methods. X-ray micro computed tomography (micro-CT or µCT) is proposed as a relatively low cost,
                                          physically non-destructive and complementary method to detect and quantify clarity enhancement
                                          and also to provide a unique 3D fingerprint of each gemstone. A collection of 14 cut colored gemstones
                                          was selected. Micro-CT scans allowed fracture detection, their distribution and calculation of filler
                                          volume as well as 3D mapping of inclusions, surface and internal imperfections and artificially
                                          induced modifications. As a result the method allows the construction of a digital twin. X-ray
                                          exposure could however induce unwanted color changes. This effect was minimized or eliminated
                                          by optimizing dosage and exposure time.


                                          Keywords: gemstones; X-ray computed tomography; fingerprinting; quality control
Citation: Heyn, R.; Rozendaal, A.;
Du Plessis, A.; Mouton, C.
Characterization of Coloured
Gemstones by X-ray Micro Computed
                                          1. Introduction
Tomography. Minerals 2021, 11, 178.
                                          1.1. Background
https://doi.org/
10.3390/min11020178                            Due to the limited availability and significant cost of high quality natural gemstones,
                                          the market for more affordable gemstones has expanded. In recent years, major advances
Received: 19 November 2020                in gemstone synthesis and treatment by which the appearance and durability can be
Accepted: 19 January 2021                 enhanced, has become increasingly customary for most major gemstone materials [1–3].
Published: 8 February 2021                The clarity of a gemstone decreases with the presence of small cracks or fractures and
                                          mineral inclusions. The presence of inclusions in a colored gemstone and lately diamonds
Publisher’s Note: MDPI stays neutral      are essential in order to certify the stone as natural [4]. With heat treatment, inclusions may
with regard to jurisdictional claims in   decrease in size or diffuse into the host material, thereby improving its clarity. Low-clarity
published maps and institutional affil-   fractured gemstones are usually enhanced by fracture filling. A variety of fracture filling
iations.                                  materials with refractive indices near that of the gemstone host, can aid to avoid reflection
                                          of the fracture surface and thereby reduces unwanted light scattering [5]. A close match
                                          makes fractures virtually invisible and may significantly increase the value of inherently
                                          poor quality gems. Corundum (Al2 O3 ) for example, a hard and very durable mineral,
Copyright: © 2021 by the authors.         lends itself to many treatments. Ruby, the red most valued color of corundum, is often a
Licensee MDPI, Basel, Switzerland.        prime focus of these treatments. Fractures are commonly filled with a lead-based glass of a
This article is an open access article    high refractive index similar to that of corundum and can alter highly fractured, almost
distributed under the terms and           opaque, red corundum with no gem value into translucent and even transparent gem
conditions of the Creative Commons        rubies. In general, the filler may vary from solids to liquids and are not always stable or
Attribution (CC BY) license (https://     durable. This results in damage to gems and loss of value during jewelry manufacturing or
creativecommons.org/licenses/by/          normal use during its lifetime [6–8].
4.0/).

Minerals 2021, 11, 178. https://doi.org/10.3390/min11020178                                                  https://www.mdpi.com/journal/minerals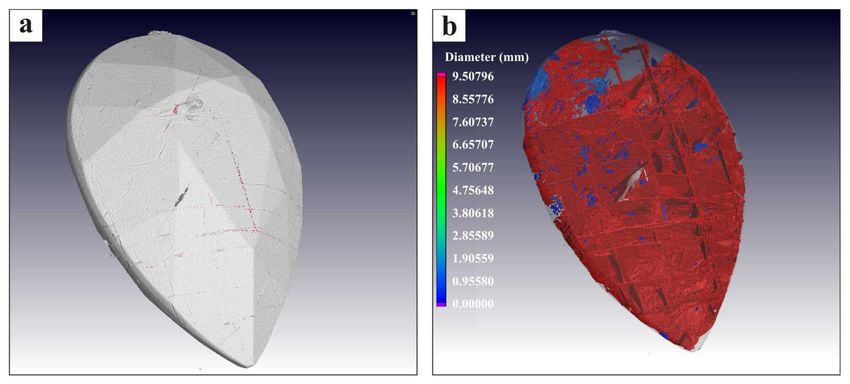
Minerals 2021, 11, 178                                                                                           2 of 16

                         1.2. The Market and Characterization
                               The lack of disclosure or the concealment of gemstone treatment has negatively
                         influenced the gemstone market by decreasing consumer confidence [9]. Greater trans-
                         parency and knowledge of gemstone treatment has however, restored public confidence.
                         Most auction houses have adopted full disclosure policies, informing customers whether
                         gems have been artificially enhanced based on trade disclosure regulations by CIBJO,
                         the World Jewelry Confederation [10,11]. This created a need to apply observational and
                         interpretational skills to detect gemstone enhancements with more sophisticated analytical
                         instruments than an optical microscope or hand held loupe. These include infrared and
                         ultraviolet-visible spectrometers, energy-dispersive X-ray fluorescence, X-ray diffraction
                         and Raman microscopy instrumentation. In addition, the use of techniques providing
                         chemical analysis with low detection limits, such as secondary ion mass spectrometry, laser
                         ablation-inductively coupled plasma-mass spectrometry and laser induced breakdown
                         spectroscopy became essential [3,12]. It remains essential however, that alternative, but
                         complementary methods to all the above are developed that are preferably non-destructive
                         and provide accurate results at reasonable cost.
                               A debate has emerged in the gemstone industry around the amount of artificial
                         material deemed appropriate in a fracture-filled gemstone. Scarratt [13] discussed the
                         discrepancy between the definition of a treated and a manufactured gemstone. If an
                         artificial material (such as glass) becomes the dominant constituent used during a treatment
                         process, then the end-product may not be considered a treated gemstone, but instead as a
                         manufactured product. The challenge for the gemmologist is to quantitatively determine
                         the weight of the dominant constituent to make the distinction. The result could have
                         value implications.
                               In the case of diamonds, a grading report accompanies almost every stone being sold
                         by a reputable seller, with information on its cut, clarity, color and carat weight [14]. The
                         four C’s as it is known provides the consumer with the characteristics of a specific stone.
                         The colored gemstone market has not reached that level of sophistication probably only
                         from the high end of the market. Designers and dealers provide the caratage only, without
                         a laboratory report containing other diagnostic features of the stone. Even if a colored stone
                         identification report is provided, the contents can differ from laboratory to laboratory [15].
                         The results of this study can contribute to more detailed and reliable gemology reports.

                         1.3. X-ray Micro Computed Tomography (µCT)
                              Micro-CT is a non-destructive three-dimensional visualization and characterization
                         method that allows the user to study the external and internal structure of an object
                         with high spatial resolution. It is a fast advancing technology of proven significance in
                         gemological research as evidenced by studies of natural pearls [16–19] and rubies [20–22].
                         Materials or phases with different x-ray densities are depicted in different shades of grey.
                         As a result, the distribution of inclusions, fractures, internal defects, and impurities, as
                         well as surface features of gems can be easily distinguished (Figure 1). Despite the high
                         cost of µCT hardware, it is a technology used in a wide variety of applications such
                         as geosciences [23–25], materials science [26], civil engineering materials [27], biological
                         applications [28], herpetology [29], biomimicry [30] and additive manufacturing [31].
                         This broad application ability has resulted in increased availability in the form of service
                         laboratories all over the world. Small desktop models are also available which could be
                         used by individual gem laboratories.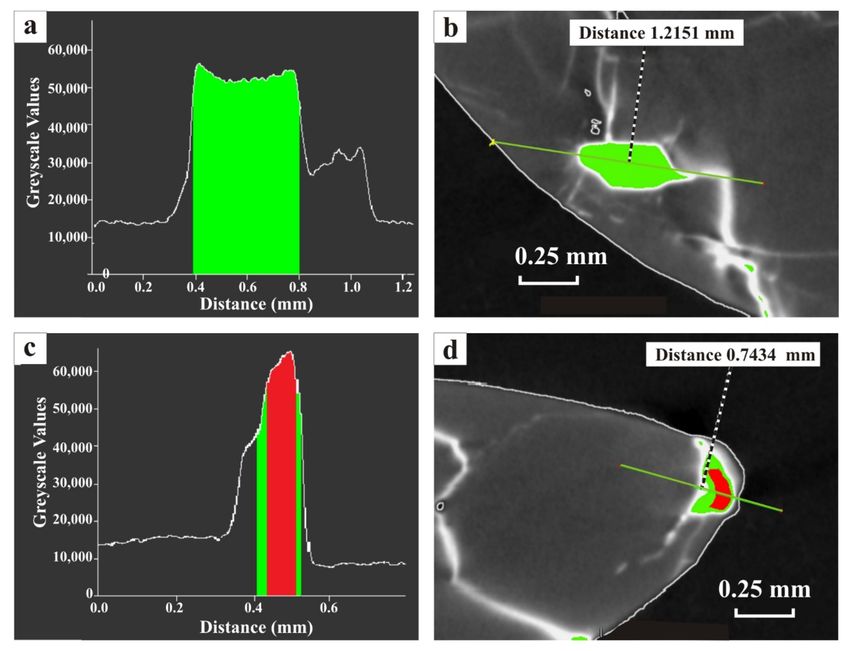
Minerals 2021, 11, 178                                                                                            3 of 16

                         Figure 1. A 3D computed tomography (CT)-scan image of a diamond revealing drill channels and an
                         inclusion, modified after Roux [32].

                               By using µCT, this study attempts to develop a safe and accurate method to character-
                         ize individual colored gemstones by the detection and identification of interior and exterior
                         imperfections as well as the volume calculation of artificial fissure filling material when
                         present in a gemstone. This will allow the presentation of a unique “fingerprint” of each
                         gemstone. A preliminary study on the µCT analysis of cut and polished diamonds [33,34]
                         revealed that temporary discoloration occurred after exposure to relatively high dosages of
                         X-ray radiation. The present study further reports on the safe dosages of X-ray radiation
                         on various colored gemstones during µCT analyses.

                         2. Materials and Methods
                               The present study used fourteen colored gemstones, which have been obtained from
                         the gemstone collection at the University of Stellenbosch, the European Gemological
                         Laboratory (EGL) in South Africa or purchased in the open market (Table 1). In addition to
                         weight in carat the girdle diameter was also specified as an indication of size because of
                         density variations of the gemstones. Gemstones were selected with the specific purpose to
                         experimentally test the effectiveness or otherwise of the µCT method. To this end stones of
                         relatively low monetary value, with extreme fracture distribution and high density filling
                         such as lead glass to ensure high fill-host contrast, were selected for this purpose. Ruby
                         was selected to quantify fracture-filling volume as this is a common treatment method
                         of these gemstones. These include the glass-filled ruby, which is fracture-filled with a
                         highly refractive leaded glass and the EGL ruby which is fracture-filled with a high density
                         (lead) glass substance. A blue diffused sapphire (Sample A, Table 1) together with the
                         abovementioned rubies, was selected to determine their “unique fingerprints”. Twelve
                         gemstones were used to test the effect of X-ray exposure on their color (Table 1).
                               Instrumentation used include a General Electric Phoenix VTomex L240/NF180 and
                         a Nanotom S (General Electric, Wunstorf, Germany). The latter has a lower power X-ray
                         tube that is very stable over long periods and ensures sharper images of small samples
                         (such as gems) [35]. Operating conditions varied depending on the resolution of the images
                         required. To minimize image artifacts such as sample movement during scanning causing
                         blurred images [36], each gemstone was mounted on a small cube of polystyrene. This
                         was fixed onto a glass rod to hold the gemstone in place on the rotation stage. Samples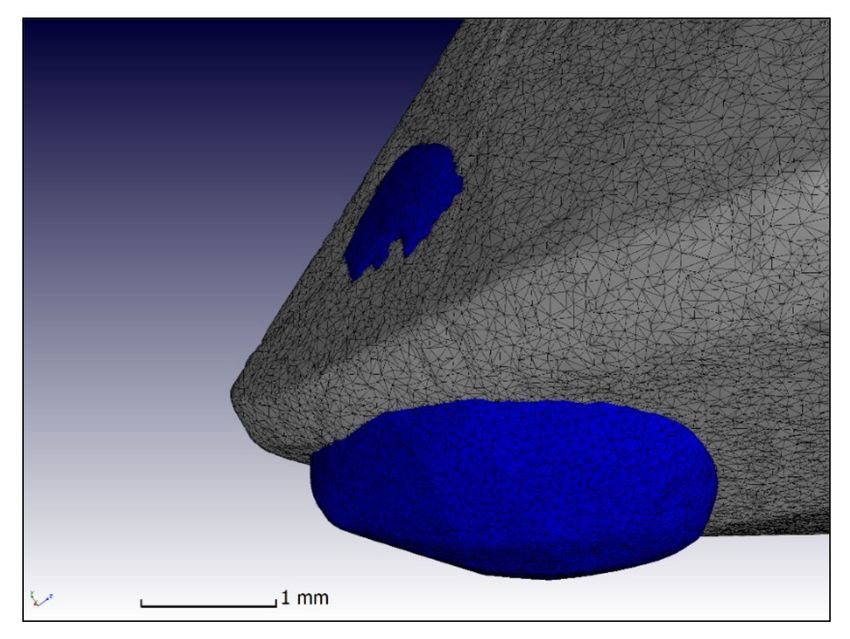
Minerals 2021, 11, 178                                                                                                                        4 of 16

                                    were positioned at a slight angle in the CT scanner to prevent image artifacts and improve
                                    detail [28].

                                                    Table 1. Gemstones used in this study.

      Sample Name                                                    Approximate
                                  Mineral           Diameter                                   Cut               Treatment         Experiment
   (Commercial Name)                                                 Carat Weight
   Pb-glass-filled Ruby         Corundum              5 mm                0.63           Round brilliant       Fracture filled         1,2,3
         EGL Ruby               Corundum           11 × 7 mm              2.65            Pear brilliant       Fracture filled          1,2
     Diffusion treated
                                Corundum              3 mm                0.13           Round brilliant        Heat treated            2,3
        sapphire A
     Diffusion treated                                                                                            Diffusion
                                Corundum              3 mm                0.13           Round brilliant                                 3
        sapphire B                                                                                                treatment
     Diffusion treated                                                                                            Diffusion
                                Corundum              3 mm                0.13           Round brilliant                                 3
        sapphire C                                                                                                treatment
     Yellow sapphire            Corundum            8 × 6 mm              1.36           Round brilliant                                 3
      Indian Ruby A             Corundum              7 mm                1.58           Round brilliant                                 3
      Indian Ruby B             Corundum              7 mm                1.58           Round brilliant                                 3
      Indian Ruby C             Corundum              7 mm                1.58           Round brilliant                                 3
  Emerald (Colombian)              Beryl              7 mm                1.67           Round brilliant                                 3
 Topaz A (London blue)             Topaz              6 mm                0.83               Trillion                                    3
    Topaz B (Sky blue)             Topaz              6 mm                0.83               Trillion                                    3
     Hydro Amethyst               Quartz             12 mm                5.67          Cushion rose cut                                 3
         Tanzanite                Zoisite           8 × 5 mm              2.14             Cabochon                                      3
      Experiment 1 = Quantify the fracture filling volume; Experiment 2 = Determine a “unique fingerprint”; Experiment 3 = Test the effect of
      X-ray exposure on the color of the gemstones.

                                         Images of the EGL ruby were acquired with the nano-CT scanner operating at 130 kV
                                    and 40 µA with a copper beam filtration of 0.1 mm. Voxel size was 5 µm and the image ac-
                                    quisition time set to 500 milliseconds per image. The images were recorded in 4800 rotation
                                    steps during a rotation of 360◦ . To improve image quality, the first image was discarded at
                                    each step and the following three images were averaged. This was standard procedure for
                                    both micro and nano scans.
                                         The glass-filled ruby as well as the blue diffused sapphire A (Table 1) were analysed
                                    also using the nano-CT scanner but applying a voltage of 100 kV, a current of 50 µA and
                                    a copper beam filtration of 0.1 mm. The voxel size was set to 7.5 µm with an image
                                    acquisition time of 500 milliseconds per image and were recorded in 2400 rotation steps
                                    during a 360◦ rotation of the sample.
                                         Ring artifacts typically result due to rotation of the samples during scanning and
                                    are visually encountered as rings around the center of rotation on slice images [28]. The
                                    detector shift was activated in all three scans to minimize these ring artefacts, whereas the
                                    automatic scan optimizer was enabled to eliminate artifacts or blurred images caused by
                                    potential sample movement or X-ray spot drift.
                                         The images generated were used to define 3D images, which allowed mapping of the
                                    natural as well as artificially induced internal imperfections and generating a fingerprint of
                                    each gemstone.

                                    2.1. Fracture Filling
                                         To quantify lead glass fracture-filling, the methodology used by le Roux et al. [37]
                                    to determine tungsten ore grade with micro-CT was used. Image analyses used Volume
                                    Graphics VGStudioMax 3.0 and reconstructions were completed in system-supplied Datos
                                    reconstruction software. For the 3D data analysis, the entire gemstone is selected with a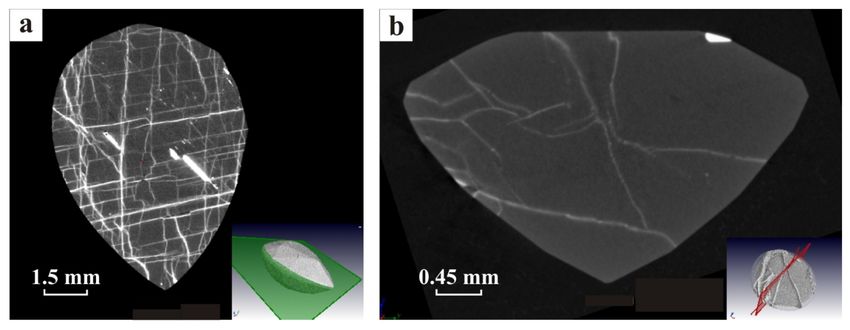
Minerals 2021, 11, 178                                                                                                      5 of 16

                         region growing tool to remove the surrounding air. The resultant histogram in greyscale,
                         contains only two dominant peaks. In interval 1 with low values, the peak represents
                         the bulk host ruby and the peak in interval 2 the denser filling material (Figure 2). The
                         filling material and bulk host ruby is separated by a vertical segmentation line (threshold)
                         positioned at the bottom dip of the histogram, in the middle of the two dominant peaks
                         (a variation of the widely used iso-50 global threshold). A further advanced surface fit is
                         performed on the region of interest (ROI), to ensure the inclusion of all greyscale values
                         from the denser filling material, which uses the global segmentation line as a starting point.
                         A local threshold gradient search is performed in the region of the global threshold, to
                         detect the sharpest change in grey value at the region boundary [37]. The produced fracture
                         filling ROI can be used to make volumetric measurements [37]. Once the percentage of
                         filling material has been calculated, the gemstone can be characterized as either treated
                         or manufactured.

                         Figure 2. Diagram showing the initial segmentation used to select the greyscale values associated
                         with the fracture filling material of the glass-filled ruby. It is a density separation. Interval 1 (grey)
                         peak is the bulk host gem material and Interval 2 (green) peak is the filler. Interval 3 is filler-related
                         denser material.

                         2.2. Fingerprint
                                The same segmentation method as described above was used to produce a unique
                          fingerprint of each gemstone. A surface determination function was applied, and the
                          selected surfaces were converted into 3D triangular polygon mesh (STL) files with the
                         ‘normal with simplification’ parameter. Two separate mesh files were created for the glass-
                          filled ruby, based on slightly different threshold values. This was to determine whether
                          different threshold values, producing slightly different mesh sizes, would influence the
                          overlap. The ‘best fit registration’ tool was used to compare the mesh files.

                         2.3. Colour Change
                             Exposure to X-rays may induce a color change in gemstones, which may enhance or
                         reduce its monetary value. X-ray irradiation affects the crystal structure defects of minerals,
                         which act as color centers. These defects become trap sites for the electrons freed from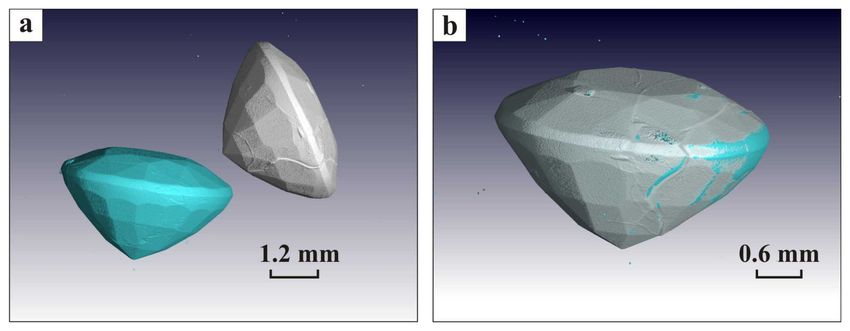
Minerals 2021, 11, 178                                                                                            6 of 16

                         halogen ions after the X-ray exposure. Additional absorption of optical light photons of
                         certain energies then result due to the recharge of these structural defects and the change
                         of valence orbitals [38,39]. In micro-CT studies color change of gemstones should be
                         prevented. To investigate this effect in practice with gemstones, thirteen of the gemstones
                         have been selected from the suite (Table 1). Discoloration was deliberately induced with
                         high dosages. The glass-filled ruby and the Sky Blue topaz A were exposed to high dosage
                         X-rays and ‘harsh’ scanner settings, atypical of regular CT-scans. The glass-filled ruby
                         was scanned with the Direct Tube (General Electric, Wunstorf, Germany), which is a high
                         power microfocus X-ray source (reflection-type source design) in the micro-CT system.
                         It operates at 200 kV, with a current of 200 µA with no filter and a distance of 20 mm
                         between the sample and the X-ray source (ZS-distance) was set. This was done over a
                         period of 10 min. The Sky Blue topaz A was also scanned for 35 min at 200 kV, with a
                         current of 800 µA with no filter and a ZS-distance of 16.3 mm. The induced color changes
                         may regress when exposed to sufficient UV-rays or heat treatment (such as hot water).
                         This is because the induced charges in the irradiated gemstones are usually unstable in the
                         crystal lattice [38,39]. In the present study, the glass-filled ruby and Sky Blue topaz A were
                         submerged in boiling water for 5 min shortly after scanning. This was to determine if the
                         discolorations were almost immediately reversible. The encountered discoloration was also
                         monitored over a seven-month period to determine whether the changes are temporary
                         or permanent.
                              To establish whether gemstone color will be affected by X-ray exposure during a
                         routine CT-scan, various samples from the collection were scanned under ‘typical’ CT
                         conditions, following the guidelines of du Plessis et al. [28]. These included three blue
                         diffused sapphires, three natural Indian rubies, Colombian emerald, London Blue topaz,
                         laboratory-grown hydro amethyst, yellow sapphire and tanzanite (Table 1). Gemstones
                         were scanned at 100 kV, with a current of 200 µA. The smaller the distance between the
                         sample and the source (ZS-distance), the more x-ray irradiation exposure of the sample is
                         achieved. To minimize exposure the ZS-distance was increased to 600 mm and scanned
                         at 10 µm resolution, while the sample rotates through 360◦ to imitate a standard scan.
                         A 0.1 mm copper filter was used on the X-ray beam. A scan time of five minutes was
                         considered sufficient to generate measurable data and acceptable images with minimal
                         X-ray exposure [35].
                              The visible-light reflection spectra of each gemstone was recorded using a calibrated
                         Ocean Optics USB4000 Spectrometer (Ocean Insight, Rochester, New York, USA) before
                         and after exposure to X-rays. All gemstones were mounted on a small block of white
                         polystyrene to prevent interference with the generated spectrum and to ensure that the
                         spectrum is recorded from the approximate same reflection plane, i.e., the table of the
                         gemstone.
                              The samples were irradiated with visible light from an Ocean Optics tungsten halogen
                         light source and optical reflection spectra were recorded with OceanView 1.5.2. spec-
                         troscopy software with an integration time of 100 milliseconds. A bifurcated fiber was used
                         for easy delivery of light to the gemstone in a ~m spot and collected with the same fiber for
                         spectral acquisition of transmitted and reflected light. Due to the simplified setup of the
                         instrumentation, it was only possible to provide reflectance spectra. The method did not
                         allow high quality precise measurements to permit quantification of possible slight color
                         modifications induced in gemstones by X-ray exposure, except in extreme cases such as the
                         Sky Blue topaz. Clearly more research with more advanced instrumentation is required to
                         improve the quality of the data.

                         3. Results
                         3.1. Fracture Fill Detection and Volume Calculation
                               The CT-scan cross-section images and 3D models of the two fracture filled rubies
                         allowed definition of their geometry, surface features and internal fractures. The fracture
                         filling material is clearly visible by its higher density compared to that of the gemstone host.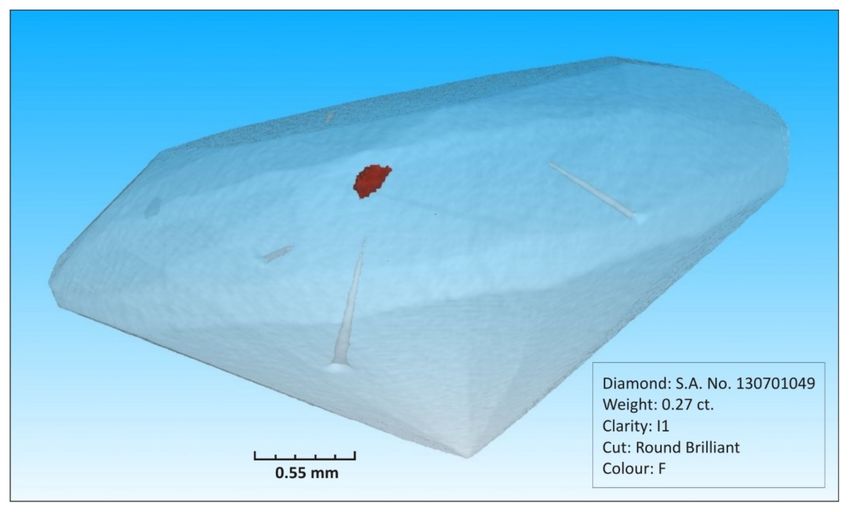
Minerals 2021, 11, 178                                                                                                           7 of 16

                                  This is indicated by the voxel grey scale where high density material is lighter and less dense
                                  material, the gemstone material, is darker (Figure 3a,b). When fractures have not been filled,
                                  the density contrast is reversed. Fracture dimensions in the two rubies varied between
                                  broad and narrow interconnected cracks, cross-cutting the entire stone. There are some
                                  isolated surface imperfections (Figure 3a,b). The EGL ruby reveals a regular fracture grid
                                  pattern that reflects the trigonal crystallographic identity and cleavage/parting directions
                                  of corundum. There are two dominant fracture directions intersecting at approximately
                                  80◦ and are equated with the parting planes {0001} and {10Ī1}. The crown of the ruby
                                  was cut at right angles to these two partings and consequently the c-crystallographic axis
                                  to optimize polish and reflectivity (Figure 3a). Irregular cross-cutting fractures could be
                                  tectonically induced by retrogression and exhumation as well as poorly controlled blasting
                                  during mining. This also enhanced the development of parting planes. Although the EGL
                                  ruby is homogenous to the naked eye, it has been extensively, albeit successfully treated to
                                  conceal its pervasive fracture pattern. The fracture pattern of the glass-filled brilliant cut
                                  ruby sample consists mainly of a few randomly orientated, but significant cracks unrelated
                                  to the natural cleavage and of tectonic origin. It is clearly less fractured than the EGL
                                  ruby (Figure 3b).

      Figure 3. CT-scan section images of the fracture filled rubies, illustrating the less dense host ruby material in grey and
      the more dense filling material in white to light grey. Position of section planes are shown on the 3D image. (a) The 5 µm
      resolution scan of the EGL ruby, displays a regular grid pattern of fractures related to the natural cleavage/parting planes
      of the mineral. (b) The 7.5 µm resolution scan of the m glass-filled ruby displays a random orientation of the fractures.

                                       To quantify fracture dimensions and allow volume calculations, the accurate selection
                                  of the greyscale threshold value is imperative. This is done on a greyscale histogram, which
                                  contrasts dense and less dense material (Figure 4). Segmentation of fractures is challenging
                                  due to the partial volume effect and therefore variations of grey scale values near narrow
                                  fracture regions, this is demonstrated in Figure 4a–d. A line distance profile of filled cavity
                                  1 shows a well-defined outline of a dense material on the greyscale histogram (Figure 4a,b).
                                  When the selected local threshold is applied to the CT-scan image the high-density area
                                  generated, indicated in green, does not fully enclose the filled cavity outline, displaying a
                                  white rim (Figure 4b). This suggests that the selection of threshold was most probably a few
                                  greyscale values too high and the material classified as bulk host ruby includes voxels of
                                  the denser filling substance and results in a small gradient edge (0.8 to 1.1 mm, Figure 4a).
                                  As a result, it will under-estimate the volume of the filled cavity. A second filled cavity
                                  shows a more complex greyscale histogram (Figure 4c,d). The first conservative iteration
                                  (red area) completely under-estimated the threshold positions. When the lower greyscale
                                  values are included (green area), it showed an improved fit with the CT image. Similarly,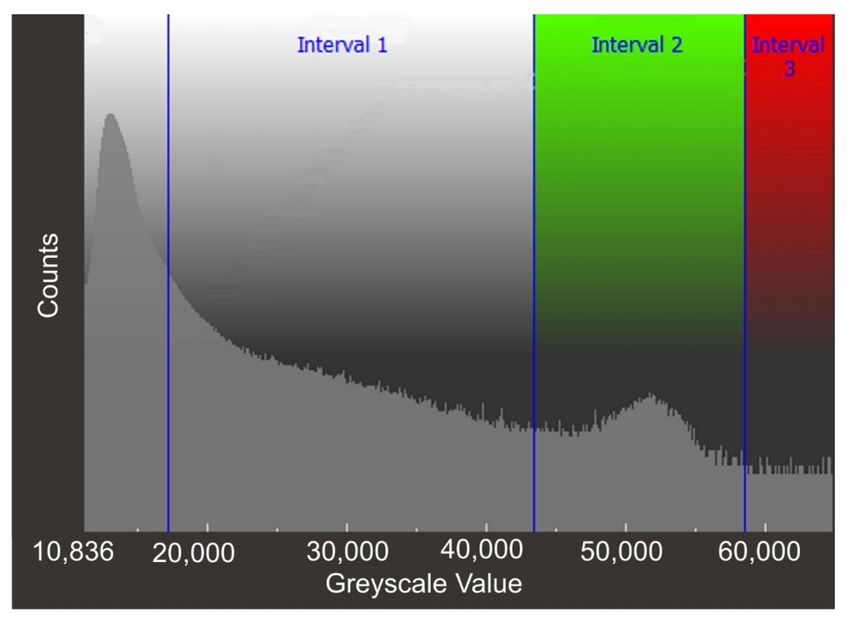
Minerals 2021, 11, 178                                                                                                                  8 of 16

                                    the white rims surrounding the green filling areas (Figure 4b), revealed as peaks adjacent
                                    to the classified greyscales (0.3 to 0.4 mm, Figure 4a) should also be included as filling
                                    material, but, once again, the threshold value was set a few greyscale values too high. More
                                    iterations are required to optimize the threshold values, secure a best fit and minimize
                                    subjectivity with respect to volume calculations.

      Figure 4. Line distance profile of filled cavity 1 (a) and filled cavity 2 (c) with their respective CT scan images of the cavities
      (b,d) in the m glass-filled ruby. Different densities are indicated on the greyscale histograms. Cavity 1 displays only one
      denser filling material (green) while cavity 2 displays two different greyscale density filling materials (red and green) due to
      the under-estimation of the threshold position.

                                        The volume of the filler within the highly fractured EGL ruby was automatically
                                   calculated on the ROIs produced from the global segmentation method following the basic
                                   principles discussed above. To compare resolution sensitivity both the 5 µm and 10 µm
                                   scans were used (Table 2).

                                   Table 2. Fracture filling volume calculations obtained from the µm CT scans of the European
                                   Gemological Laboratory (EGL) ruby.

                                                                 Volume of Entire          Volume of Fracture         Percentage Fracture
                                      CT-Scan Resolution
                                                                   Stone (mm3 )          Filling Material (mm3 )        Filling Material
                                           10 µm Scan                148.03137                   19.18086                    12.957%
                                            5 µm Scan                148.24036                   10.15460                     6.85%

                                        Figure 5 displays the 3D CT-scan images of the EGL ruby (5 µm scan) and the extracted
                                    ROI produced by the segmentation method. The distribution and dimensions of the
Minerals 2021, 11, 178 9 of 16
fractures are enhanced with a color-coded fracture filling diameter analysis. The most
extensive fractures with the largest diameter are indicated in red and the smaller, isolated
fractures representing the cavities, are indicated in blue (Figure 5b). Table 2 contains the
volume estimates obtained from the two different resolution scans. The significant variation
between the fracture filling volumes of the two different scans indicate that resolution
does indeed influence the results. This is expected for small features such as fractures.
A volumetric proportion of 13% was obtained from the 10 µm scan, compared to the 7%
produced from the 5 µm scan. This difference can be ascribed to overestimation of the
fracture size with the 10 µm scan due to increased voxel size. The subjectivity of the
analyst in selecting thresholds could also play a role. Segmentation and interpolation of
greyscale values between voxels will introduce some error when delineating fractures and
cavities above a particular threshold value. Cracks that are smaller than the voxel spacing
will not be observed, whereas the segmentation line will overestimate more extensive
fractures because of finite voxel size and the resultant overlap (Figure 6). Consequently,
this method can only be applied to cracks wider than the resolution size. The accuracy
of the volume quantification thus increases with the resolution of the scan. To classify
gemstones as: gemstone with filling, composite or clarity enhanced, the calculated filler
volume range of 7–13% for the EGL ruby is probably acceptable. As a result, the EGL
ruby can be classified as a corundum with glass-filled fissures and cavities (category F1;
C1) and not a manufactured product according to the Laboratory Manual Harmonization
Committee, responsible for the harmonization of gemological report language [40].
Although a CT-scan is able to provide a detailed 3D-image of both surface and internal
features of a gemstone it cannot analyze the chemistry of inclusions or fillers. Density
calibration however, allows for specific density determinations, which can be used for
identification purposes and hardness determination [41]. The CT-scans can be used to
identify surface-reaching fractures and energy dispersive X-ray fluorescence (EDXRF) or
scanning electron microscope (SEM) analyses can then subsequently identify the various
filler types.
Figure 5. 3D CT-scan images of the EGL ruby (5 µm scan), showing the surface (a) and the results of a color coded fracture
filling diameter analysis (b). The largest, interconnected fractures are indicated in red, whereas the smaller, isolated fractures
and cavities are shown in blue.Minerals 2021, 11, 178 10 of 16
Figure 6. Images of the fracture filled EGL ruby (5 µm scan) depicting the segmentation method used for various sized
fractures (light grey/white). Position of section image is shown on 3D image insert. (a). Various sized fractures are
segmented and blue lines show areas selected as ROIs (b). The smaller fractures are not segmented, but for the larger
fractures the volume is overestimated by including more pixels. The selected areas are extracted as ROIs and color
coded according to their volume (c). The blue represents smaller filled areas with red more extensive, interconnected
filled fractures.
The X-ray µCT approach is considered complementary to the more conventional
methods to determine the geometry and quantity of fractures and quantity of fissure
filler such as the gemological microscope and dark field illumination. These traditional
methods require examination by a gemological expert and may be unproductive as certain
filling materials are difficult to locate and the appearance of some fillers are modified over
time [42]. CT analysis does require expert 3D image analysis experience, but analysis
procedures can be standardized [8]. Scan times as short as five minutes, despite being noisy,
can produce adequate resolution scans and be successfully analysed [43]. Guelpa et al. [41]
reported that it is possible to reduce acquisition time and cost further by scanning multiple
objects at the same time at a reduced resolution. The resultant scans may still allow for
reliable volume and porosity analysis, when these requirements are not critical.
3.2. Producing a Gemstone Fingerprint
Although other methods are available to produce surface and volume meshes [44,45]
the present method allowed creating 3D triangular polygon mesh (STL) files of the surface
exteriors of gemstones. As a result, a unique fingerprint of each gem was produced. The
best-fit registration method was used to study the overlap of the surface meshes of firstlyMinerals 2021, 11, 178 11 of 16
two totally different stones to validate the method and secondly between two meshes
of the same stone to confirm precision. The best-fit registration method automatically
inspects meshes for similarities and then aligns these areas for the meshes to overlay. As
demonstrated by the lack of overlap between the differing surface meshes of the diffused
sapphire A and the EGL ruby the method proved to be robust (Figure 7). The same stone,
in this case, the glass-filled ruby was scanned twice to test the method. The method
has been demonstrated to be threshold sensitive and analyst subjectivity may incur a
deviation between the two 3D images produced (Figure 8). The results show that only
minor deviations in the overlap of the two wireframes (Figure 8b) were observed and
indicate a slight difference in size. The characteristic features however, remained visible
after registration. Thus, mesh files created by different analysts of the same stone, will show
the same unique features. When mesh files are generated to illustrate the internal features
(defects, inclusions) of a gemstone, the same results are expected. The best-fit registration
method will automatically overlay these defining features and confirm their similarity.
Figure 7. The best-fit registration of the diffused sapphire A exterior surface mesh (blue) with that of
the EGL ruby exterior surface mesh (grey) illustrates the dissimilarities between the two stones.
The methodology discussed above is an original procedure and can be developed into
a powerful tool to define the unique fingerprint of a gemstone in 3D. It can be done with
precision and will be able to confirm the authenticity of a particular stone. The 3D image
and fingerprint, the so-called “digital twin” can be a valuable addition to the report that
defines the characteristics such as type, origin, treatments, cut, shape, weight and color
of a gemstone [46]. A 3D mesh file can also be used to generate a 3D-printed replica of
the gemstone.
The CT-scan generated fingerprint can form part of a database for future reference
as a digital record or “digital twin”. The GIA database, with information on more than
100,000 individual colored gemstones, is an example of such a reference system which
contains the identification records of gems from around the globe [46]. The CT-scan
fingerprint complements existing methods and could be an important addition to the GIA
database or alternatively, a global standardized fingerprinting record of colored gemstones
could be created. Such a digital database can be used to confirm authenticity of stolen/lost
gemstones for forensic and insurance purposes by the use of a CT-scan.Minerals 2021, 11, 178 12 of 16
Figure 8. Images of the 3D mesh files created on the exterior surface of the glass-filled ruby. (a) Two iterations at slightly
different threshold values produced mesh files indicated in blue and grey. (b) The overlap of the two mesh files after using
the best-fit registration method. Slight deviations between the two wireframes are shown where the blue mesh protrudes
the grey mesh. Distinct features and their overlap remain visible.
The drawback of this method however, is that the mesh files can be large and their
production is time consuming and hence expensive. In the case of the EGL ruby the STL
file generated 5µm scan is 5.5 gigabytes compared to 34 megabytes of the 10 µm scan.
These are examples illustrating challenges, all of which can be overcome with appropriate
guidelines. For example, lower resolution scans are recommended and de-noising image
filters are suggested to create a reasonably-sized mesh file. If a stone is recut or polished,
the newly generated surface exterior mesh would not fit the older version because of
these modifications. The internal features such as inclusions and fractures will however
remain preserved and confirm the pre-polish fingerprint. Heat-treatment to recrystallize
the internal structure such as cavities or ablated to dissolve inclusions will potentially
destroy the internal fingerprint, but surface features may be discernible [2].
3.3. Colour Change Detection
The primary aim of the study is to introduce X-ray µCT to the gemstone industry
as a non-destructive method to characterize gemstones. Consequently, it is essential to
prevent potential damage or color changes, due to formation of color centers, to stones
caused by the exposure to X-rays [39,47]. To examine this effect, a series of gemstones
were exposed to different X-ray dosages and scan times (Table 1). The results show
that reflection spectra, before and after the scans under standard conditions with scan
times of five minutes, produces insignificant alteration of the primary color. High X-ray
dosages and long scanning times however, resulted in semi-permanent discoloration. The
experiment deliberately exposed the m glass-filled ruby and the Sky Blue topaz (B) to
severe X-ray dosages. The color of the ruby changed from the original pinkish red to a
brighter shade of red (Figure 9a,b). This color change persisted after treatment in boiling
water. After seven months remnants of the bright red color were still visible. The Sky Blue
topaz (B) lost its color and became smoky grey. As with the ruby, boiling water had no
effect and only after seven months did some of the blue shades return (Figure 9c–e). The
changes observed in the visible light reflection spectra for the Sky Blue topaz indicated
that reflection peaks in the blue range (455–492 nm) were eliminated by the high X-ray
dosage (Figure 10) [37]. Consequently, X-ray exposure induced the absorption of photons
with energies corresponding to the wavelengths of blue light, which is approximately
2.5–2.7 eV [38,48].Minerals 2021, 11, 178 13 of 16
Figure 9. The m glass-filled ruby shows color change after exposure to extreme X-ray dosage (a,b).
The Skye Blue topaz (a) lost most of its color during extreme radiation (c,d) and despite hot water
treatment and a seven-month recovery period the color was not fully restored (e).
Minimal to no color changes were observed after subjecting various colored gemstones
to five-minute scans with typical CT-scanner settings. It was previously demonstrated that
such scans can produce dependable results for the purpose of gemstone classification with
minimal exposure to X-rays [34]. The resolution of the visible light reflection spectra was
not high enough to reliably quantify the before and after radiation exposure differences.Minerals 2021, 11, 178 14 of 16
Figure 10. Visible light reflection spectra of the Sky Blue topaz before and after X-ray exposure.
Reflection peaks in the blue range (455–492 nm) were eliminated.
4. Discussion
This study demonstrates that X-ray micro computed tomography can make a positive
contribution to the characterization and classification of colored gemstones. It has the
ability to image by means of 3D polygon mesh files, both external and internal features.
These include surface imperfections, poor cut and poor polish. Internally the shape and
size of natural and induced fractures and partings, laser holes to ablate inclusions as
well as inclusions and cavities, can be detected. In addition, a CT-scan and supporting
software allows the detection of fracture filling material and their volumetric determination,
provided the density difference between the host stone and the filling material is adequate
such as for example lead glass filler. This allows the classification of a gemstone either as
treated or manufactured. The combination of external and internal 3D image characteristics
defines the unique properties or fingerprint ID of each individual gemstone. This has been
defined as the “digital twin”. These attributes of X-ray CT can find its application in the
classification of a gemstone and the 3D files as an addendum, which is complementary to
the methods (e.g., microscopy) used in the more traditional gemstone report. It is able to
identify subsequent modifications to a classified stone or accidental/wilful replacement by
means of the best fit registration method.
X-ray micro computed tomography applied to gemstones is however, in its develop-
ment stage. Permanent to semi-permanent color changes are induced by exposure to severe
x-ray bombardment. The preliminary results of this study demonstrate that by limiting
the exposure time to five minutes under standard operating conditions, insignificant or no
color damage has been detected. This renders the method as safe for gemstone analyses
with respect to loss or enhancement of color. Admittedly a larger and more diverse suite of
gemstones should be investigated to confirm the results of the preliminary study. Aspects
such as the safe X-ray dosage range and distance between source and sample should be
calibrated. In addition, the use of a more sensitive method to detect subtle discoloration is
advised, in order to make precise observations of the color changes after X-ray exposure.
The averaging of spectral signatures obtained by several iterations would improve the
quality of the data. The absorption of the blue region of the spectrum during irradiation
for all gemstones, should also be studied.
The precision of the method has been demonstrated to be excellent. The resolution of
the 3D images is a function of voxel size selection. Very large files are however created at
low voxel size and can be cumbersome to work with. It is recommended that the selected
resolution should be dictated by the minimum requirements of the particular study.Minerals 2021, 11, 178 15 of 16
Subjectivity of the operator, particularly in the selection of fractures and segmentation
as it influences the threshold values, could induce a bias in the volume calculation of filler
material as it is done by visual inspection of the material. Several iterations may be required
to obtain precise results however, operator experience with the method plays an equally
important role. Subjectivity may prompt the development of an algorithm to standardize
the selection process in the future.
X-ray micro computed tomography is a time-efficient, physically non-destructive,
relatively low cost procedure to characterize external and internal features of gemstones
and provide a 3D unique fingerprint. It is able to provide the gemstone industry, from
mine to market, with a new method which complements existing procedures that can be
routinely applied in the precise, non-biased characterization of gemstones. The benefits
include the generation of a digital twin for record, insurance and forensic purposes.
Author Contributions: Conceptualization, A.R., R.H. and A.D.P.; Methodology, A.R., R.H. and
A.D.P.; Software, A.D.P. and C.M.; Validation, A.R., A.D.P., R.H. and C.M.; Formal analysis, A.D.P.
and C.M.; Investigation, C.M., R.H. and A.D.P.; Resources, A.D.P. and R.H.; Data curation, C.M. and
A.D.P. All authors have read and agreed to the published version of the manuscript.
Funding: This research received no external funding.
Data Availability Statement: The data presented in this study are available on request from the
corresponding author. The data are not publicly available due to large size of 20Gb per CT scan.
Acknowledgments: The CT scans were done at Stellenbosch University’s CT Scanner Facility, an
open access laboratory providing non-destructive X-ray computed tomography and a high per-
formance image analysis services as part of the Central Analytical Facilities of the university [37].
Special thanks to the European Gemmological Laboratory South Africa for the lending a ruby on
which analysis could be conducted. All participants in this project are gratefully acknowledged for
their support in this effort. The constructive comments by the two reviewers greatly enhanced the
quality of the manuscript. This is much appreciated.
Conflicts of Interest: The authors declare no conflict of interest.
References
1. Kammerling, R.C.; Koivula, J.I.; Kane, R.E. Gemstone enhancement and its detection in the 1980s. Gems Gemol. 1980. [CrossRef]
2. McClure, S.F.; Smith, C.P. Gemstone enhancement and detection in the 1990s. Gems Gemol. 2000. [CrossRef]
3. Breeding, C.; Shen, A.; Eaton-Magaña, S.; Rossman, G.; Shigley, J.; Gilbertson, A. Developments in gemstone analysis techniques
and instrumentation during the 2000s. Gems Gemol. 2010. [CrossRef]
4. Barone, G.; Bersani, D.; Lottici, P.P.; Mazzoleni, P.; Raneri, S.; Longobardo, U. Red gemstone characterization by micro-Raman
spectroscopy: The case of rubies and their imitations. J. Raman Spectrosc. 2016. [CrossRef]
5. Kiefert, L.; Hänni, H.A.; Chalain, J.-P.; Weber, W. Identification of filler substances in emeralds by infrared and Raman spectroscopy.
J. Gemmol. 2000. [CrossRef]
6. Shigley, J.E. Treated and synthetic gem materials. Curr. Sci. 2000, 79, 1566–1571.
7. McClure, S.F.; Smith, C.P.; Wang, W.; Hall, M. Identification and durability of lead glass-filled rubies. Gems Gemol. 2006. [CrossRef]
8. Pardieu, V.; Lomthong, P.; Sturman, N. Lead Glass-Filled Star Rubies Reportedly from Madagascar. Available online:
https://www.gia.edu/UK-EN/ongoing-research/lead-glass-filled-star-rubies-reportedly-from-madagascar (accessed on 31
October 2020).
9. Lowry, S. Using FTIR spectroscopy to analyze gemstones. Am. Lab. 2008, 40, 28–31.
10. Chen, V. Coloured Gemstones Rise in Demand among Jewellers and Investors as the Supply Dwindles. Available online: https://
www.scmp.com/magazines/style/article/1873766/coloured-gemstones-rise-demand-among-jewellers-and-investors-supply
(accessed on 31 October 2020).
11. CIBJO–The World Jewellery Confederation. Available online: http://www.cibjo.org/code-of-ethics/ (accessed on 19
December 2020).
12. Ho, S.K. Analysis of impurity effects on the coloration of corundum by laser-induced breakdown spectroscopy (LIBS). Appl.
Spectrosc. 2015. [CrossRef]
13. Scarratt, K. A Discussion on Ruby-Glass Composites & Their Potential Impact on the Nomenclature in Use for Fracture-Filled or
Clarity Enhanced Stones in General. Available online: https://www.gia.edu/UK-EN/gia-news-research-nr41009 (accessed on 2
November 2020).
14. Clark, D. A Consumer’s Guide to Gem Grading. Available online: https://www.gemsociety.org/article/a-consumers-guide-to-
gem-grading/ (accessed on 31 October 2020).Minerals 2021, 11, 178 16 of 16
15. Branstrator, B. Analysis: The State of the Colored Stone Market. Available online: https://www.nationaljeweler.com/diamonds-
gems/supply/4803-the-state-of-the-colored-stone-market (accessed on 31 October 2020).
16. Soldati, A.L.; Jacob, D.E.; Wehrmeister, U.; Hofmeister, W. Structural characterization and chemical composition of aragonite and
vaterite in freshwater cultured pearls. Mineral. Mag. 2008. [CrossRef]
17. Wehrmeister, U.; Goetz, H.; Jacob, D.E.; Soldati, A.; Xu, W.; Duschner, H.; Hofmeister, W. Visualization of the internal structures
of cultured pearls by computerized X-ray microtomography. J. Gemmol. 2008. [CrossRef]
18. Kawano, J. Observation of the internal structures of pearls by X-ray CT technique. Gemmology 2009, 40, 2–4.
19. Krzemnicki, M.; Friess, S.; Chalus, P.; Hänni, H.; Karampelas, S. X-ray computed microtomography: Distinguishing natural pearls
from beaded and non-beaded cultured pearls. Gems Gemol. 2010. [CrossRef]
20. Hänni, H.A. How much glass is in the ruby? Ssef Facet. 2009, 16, 8–9.
21. Bouts, A. Detection of Ruby Crystals in Marble Host Rock by X-ray Computed Tomography. J. Gemmol. 2014. [CrossRef]
22. Sahoo, R.K.; Singh, S.K.; Mishra, B.K. Surface and bulk 3D analysis of natural and processed ruby using electron probe micro
analyzer and X-ray micro CT scan. J. Electron Spectrosc. Relat. Phenom. 2016. [CrossRef]
23. Cnudde, V.; Boone, M.N. High-resolution X-ray computed tomography in geosciences: A review of the current technology and
applications. Earth-Sci. Rev. 2013, 123, 1–17. [CrossRef]
24. Rozendaal, A.; le Roux, S.G.; du Plessis, A.; Philander, C. Grade and product quality control by microCT scanning of the world
class Namakwa Sands Ti-Zr placer deposit West Coast, South Africa: An orientation study. Miner. Eng. 2018, 116, 152–162.
[CrossRef]
25. Rozendaal, A.; le Roux, S.G.; du Plessis, A. Application of microCT scanning in the recovery of endo-skarn associated scheelite
from the Riviera Deposit, South Africa. Miner. Eng. 2018, 116, 163–178. [CrossRef]
26. Maire, E.; Withers, P.J. Quantitative X-ray tomography. Int. Mater. Rev. 2014, 59, 1–43. [CrossRef]
27. Du Plessis, A.; Boshoff, W.P. A review of X-ray computed tomography of concrete and asphalt construction materials.
Constr. Build. Mater. 2019, 199, 637–651. [CrossRef]
28. Du Plessis, A.; Broeckhoven, C.; Guelpa, A.; Le Roux, S.G. Laboratory x-ray micro-computed tomography: A user guideline for
biological samples. GigaScience 2017, 6, 1–11. [CrossRef] [PubMed]
29. Broeckhoven, C.; du Plessis, A. X-ray microtomography in herpetological research: A review. Amphib. Reptil. 2018. [CrossRef]
30. Du Plessis, A.; Broeckhoven, C. Looking deep into nature: A review of micro-computed tomography in biomimicry.
Acta Biomaterialia 2019, 85, 27–40. [CrossRef]
31. Du Plessis, A.; Yadroitsev, I.; Yadroitsava, I.; le Roux, S.G. X-ray Microcomputed Tomography in Additive Manufacturing:
A Review of the Current Technology and Applications. 3D Print. Addit. Manuf. 2018. [CrossRef]
32. Roux, J. Classification of Diamonds by Microfocus X-Ray Computed Tomography. Unpublished Thesis, BSc honors, Department
of Earth Sciences, Stellenbosch University, Stellenbosch, South Africa, 2012.
33. Du Plessis, A.; le Roux, S.G.; Rozendaal, A.; Tolken, A. X-ray tomography of cut and polished diamonds. Gems Gemol.
Under review.
34. Du Plessis, A.; le Roux, S.G.; Rozendaal, A.; Tolken, A. X-ray tomography of cut and polished diamonds and gemstones.
In Proceedings of the 35th International Geological Congress, Cape Town, South Africa, 27 August–4 September 2016.
35. Du Plessis, A.; le Roux, S.G.; Guelpa, A. The CT Scanner Facility at roux University: An open access X-ray computed tomography
laboratory. Nucl. Instrum. Methods Phys. Res. Sect. B Beam Interact. Mater. At. 2016, 384, 42–49. [CrossRef]
36. Boas, F.E.; Fleischmann, D. CT artifacts: Causes and reduction techniques. Imaging Med. 2012, 4, 229–240. [CrossRef]
37. Le Roux, S.G.; du Plessis, A.; Rozendaal, A. The quantitative analysis of tungsten ore using X-ray microCT: Case study.
Comput. Geosci. 2015. [CrossRef]
38. Nassau, K. Gemstone Enhancement, 2nd ed.; Butterworth-Heineman: Oxford, UK, 1984.
39. Pough, F.H.; Rogers, T.H. Experiments in X-ray irradiation of gem stones. Am. Mineral. J. Earth Planet. Mater. 1947, 32, 31–43.
40. The Laboratory Manual Harmonisation Committee LMHC Information Sheet # 3-Corundum. Available online: https://static1
.squarespace.com/static/5bfbb7e6cc8fed3bb9293bf3/t/5bfe9219f950b7627afb4cb0/1543410205254/LMHC+Information+
Sheet_3_V9_2012.pdf (accessed on 21 December 2020).
41. Guelpa, A.; du Plessis, A.; Kidd, M.; Manley, M. Non-destructive Estimation of Maize (Zea mays L.) Kernel Hardness by Means of
an X-ray Micro-computed Tomography (µCT) Density Calibration. Food Bioprocess Technol. 2015, 8, 1419–1429. [CrossRef]
42. McClure, S.F.; Moses, T.M.; Tannous, M.; Koivula, J.I. Classifying emerald clarity enhancement at the GIA Gem Trade Laboratory.
Gems Gemol. 1999, 35, 176–185. [CrossRef]
43. du Plessis, A.; Olawuyi, B.J.; Boshoff, W.P.; le Roux, S.G. Simple and fast porosity analysis of concrete using X-ray computed
tomography. Mater. Struct./Mater. Et Constr. 2016, 49, 553–562. [CrossRef]
44. OGI Systems Ltd. Scanox CAD. Available online: http://www.ogisystems.com/scanoxcad.html (accessed on 21 December 2020).
45. OGI Systems Ltd. Clearex Gem. Available online: http://www.ogisystems.com/clearexgem.html (accessed on 21 December 2020).
46. Gemological Institute of America Colored Gemstone and Pearl Reports. Available online: https://4cs.gia.edu/en-us/colored-
gemstone-pearl-reports/ (accessed on 31 October 2020).
47. De Chiffre, L.; Carmignato, S.; Kruth, J.P.; Schmitt, R.; Weckenmann, A. Industrial applications of computed tomography.
Cirp Ann. Manuf. Technol. 2014, 63, 655–677. [CrossRef]
48. Nassau, K. The Physics and Chemistry of Color: The Fifteen Causes of Color. Color Res. Appl. 1984, 12, 4–26. [CrossRef]You can also read