Contribution of traffic-originated nanoparticle emissions to regional and local aerosol levels
←
→
Page content transcription
If your browser does not render page correctly, please read the page content below

Research article
Atmos. Chem. Phys., 22, 1131–1148, 2022
https://doi.org/10.5194/acp-22-1131-2022
© Author(s) 2022. This work is distributed under
the Creative Commons Attribution 4.0 License.

       Contribution of traffic-originated nanoparticle emissions
                  to regional and local aerosol levels
               Miska Olin1 , David Patoulias2,3 , Heino Kuuluvainen1 , Jarkko V. Niemi4 , Topi Rönkkö1 ,
                             Spyros N. Pandis2,3 , Ilona Riipinen5 , and Miikka Dal Maso1
                         1 Aerosol  Physics Laboratory, Tampere University, 33014 Tampere, Finland
                     2 Department   of Chemical Engineering, University of Patras, 26504 Patras, Greece
       3 Institute of Chemical Engineering Sciences, Foundation for Research and Technology, 26504 Patras, Greece
                       4 Helsinki Region Environmental Services Authority (HSY), 00066 HSY, Finland
                   5 Department of Environmental Science (ACES) and Bolin Centre for Climate Research,

                                       Stockholm University, 10691 Stockholm, Sweden
                                     Correspondence: Miska Olin (miska.olin@tuni.fi)

                                     Received: 3 June 2021 – Discussion started: 20 July 2021
                      Revised: 6 November 2021 – Accepted: 13 December 2021 – Published: 24 January 2022

      Abstract. Sub-50 nm particles originating from traffic emissions pose risks to human health due to their high
      lung deposition efficiency and potentially harmful chemical composition. We present a modeling study using an
      updated European Aerosol Cloud Climate and Air Quality Interactions (EUCAARI) number emission inventory,
      incorporating a more realistic, empirically justified particle size distribution (PSD) for sub-50 nm particles from
      road traffic as compared with the previous version. We present experimental PSDs and CO2 concentrations,
      measured in a highly trafficked street canyon in Helsinki, Finland, as an emission factor particle size distribu-
      tion (EFPSD), which was then used in updating the EUCAARI inventory. We applied the updated inventory
      in a simulation using the regional chemical transport model PMCAMx-UF over Europe for May 2008. This
      was done to test the effect of updated emissions at regional and local scales, particularly in comparison with
      atmospheric new particle formation (NPF). Updating the inventory increased the simulated average total particle
      number concentrations by only 1 %, although the total particle number emissions were increased to a 3-fold
      level. The concentrations increased up to 11 % when only 1.3–3 nm sized particles (nanocluster aerosol, NCA)
      were considered. These values indicate that the effect of updating overall is insignificant at a regional scale dur-
      ing this photochemically active period. During this period, the fraction of the total particle number originating
      from atmospheric NPF processes was 91 %; thus, these simulations give a lower limit for the contribution of
      traffic to the aerosol levels. Nevertheless, the situation is different when examining the effect of the update closer
      spatially or temporally or when focusing on the chemical composition or the origin of the particles. For example,
      the daily average NCA concentrations increased by a factor of several hundred or thousand in some locations
      on certain days. Overall, the most significant effects – reaching several orders of magnitude – from updating
      the inventory are observed when examining specific particle sizes (especially 7–20 nm), particle components,
      and specific urban areas. While the model still has a tendency to predict more sub-50 nm particles compared to
      the observations, the most notable underestimations in the concentrations of sub-10 nm particles are now over-
      come. Additionally, the simulated distributions now agree better with the data observed at locations with high
      traffic densities. The findings of this study highlight the need to consider emissions, PSDs, and composition
      of sub-50 nm particles from road traffic in studies focusing on urban air quality. Updating this emission source
      brings the simulated aerosol levels, particularly in urban locations, closer to observations, which highlights its
      importance for calculations of human exposure to nanoparticles.

Published by Copernicus Publications on behalf of the European Geosciences Union.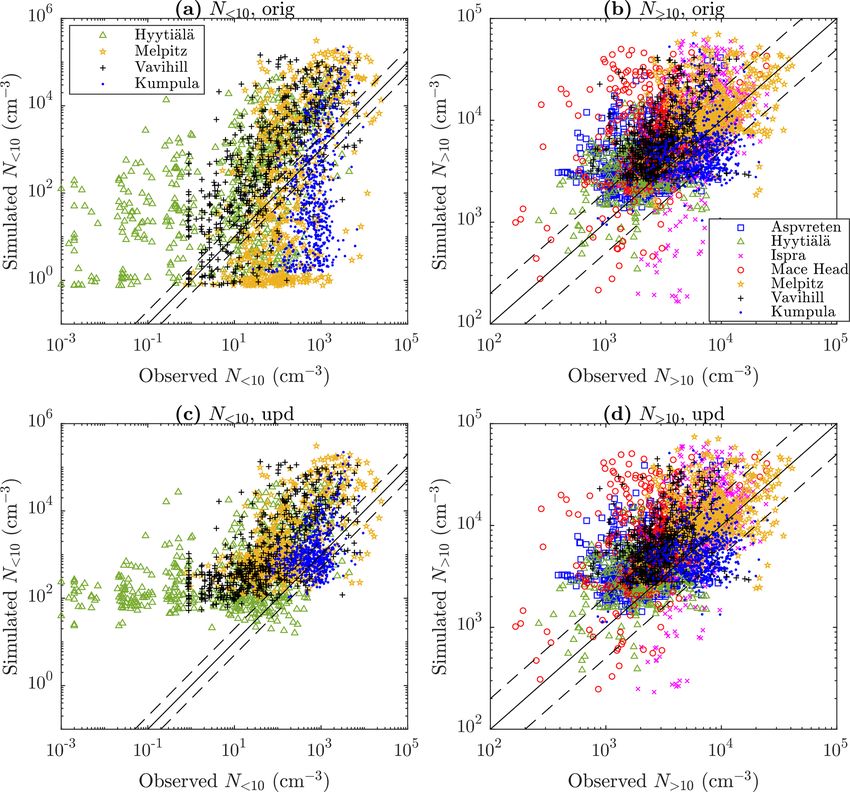
1132             M. Olin et al.: Contribution of traffic-originated nanoparticle emissions to regional and local aerosol levels

1   Introduction                                                    they are modeled similarly to primary emissions in regional
                                                                    or global models because the grid sizes can be kilometers,
                                                                    but the nucleation processes occurring in exhaust plumes oc-
Detailed emission inventories are necessary for predictions         cur at scales of a few meters at most. In addition to the high
of air quality and atmospheric composition in general. At           level of variation in the concentrations of the smallest par-
present, very few of the standard inventories focus in enough       ticles in vehicle exhaust, PSD measurements with a differ-
detail on particle number concentrations and size distri-           ential mobility particle sizer (DMPS) or scanning mobility
butions of particles from various sources. Several model-           particle sizer (SMPS) typically underestimate the concentra-
ing studies using the regional chemical transport model             tions in the sub-10 nm size range (Kangasluoma et al., 2020).
PMCAMx-UF (Jung et al., 2010) over Europe (Fountoukis               Furthermore, particles smaller than 3 nm have remained un-
et al., 2012; Ahlm et al., 2013; Baranizadeh et al., 2016;          detected until recent advances of measurement techniques,
Julin et al., 2018; Patoulias et al., 2018) have relied on the      such as the introduction of the particle size magnifier (PSM),
pan-European particle number emission (Denier van der Gon           which is capable of detecting particles down to ∼ 1 nm (Van-
et al., 2009; Kulmala et al., 2011) and carbonaceous aerosol        hanen et al., 2011). Traffic has recently been shown to be a
(Kulmala et al., 2011) inventories developed in the EU-             major source of those previously undetected particles (nan-
CAARI (European Aerosol Cloud Climate and Air Quality               ocluster aerosol, NCA) in traffic-influenced areas (Rönkkö
Interactions) project (the combination of these inventories is      et al., 2017).
referred to here as the EUCAARI inventory). The EUCAARI                Sub-50 nm or sub-23 nm particles originating from traffic
inventory includes emissions from electricity production, in-       are not negligible in terms of human health effects: they have
dustry, road and non-road transport, waste disposal, and agri-      higher deposition efficiency in the human respiratory system
culture. Paasonen et al. (2016) estimated future projections        as compared with larger particles and can even translocate to
of particle number concentrations at a global scale using           the brain (Oberdörster et al., 2004). They also overlap with
emission inputs based partially on the same inventory but,          the sizes of particles formed and grown during atmospheric
for example, traffic emissions based on the EU FP7 project          new particle formation (NPF) events and therefore have the
TRANSPHORM database (Vouitsis et al., 2013).                        potential to contribute to the climate effects of aerosols (Ker-
   While road transport is a significant particle source in ar-     minen et al., 2018). Such particles form a complex exter-
eas affected by vehicles, such as in urban environments (Shi        nal aerosol mixture influenced by local co-pollution, mete-
et al., 2001; Kumar et al., 2014), the EUCAARI inventory,           orology, and atmospheric processes (Rönkkö and Timonen,
however, does not fully consider the traffic-originated emis-       2019). Anthropogenic emissions overall can also greatly af-
sions of the smallest (especially sub-50 nm in diameter, Dp )       fect the frequency and intensity of NPF events in urban air
particles. This results partially from the fact that only non-      (Saha et al., 2018). Additionally, emissions of diesel vehicles
volatile particles larger than 23 nm have been selected as          can include metal-containing particles, which can be found in
the regulated ones in current road transport number emis-           a separate size mode from non-volatile particles near 10 nm
sion standards (Giechaskiel et al., 2012) because measuring         (Kuuluvainen et al., 2020). Metallic combustion-originated
them is far more reproducible than measuring volatile ones.         nanoparticles have also been found to exist in the brains (Ma-
Many of the components of the smallest particles do, how-           her et al., 2016).
ever, evaporate when heated. Hence, there are also emissions           In this study, the EUCAARI inventory has been updated
of particles larger than 23 nm (volatile ones), which are cur-      for more realistic, measurement-derived PSDs originating
rently unregulated. The emission factors (EFs) of the small-        from road transport. PSDs between 1.2 and 800 nm particles
est particles are quite variable across the vehicle fleet due       measured in a traffic-influenced street canyon in Helsinki,
to the nature of the nucleation process – their main origin at      Finland, were incorporated into the inventory in order to
least in diesel exhaust – which is very sensitive to several fac-   better represent real-world particle emissions from vehicles.
tors, e.g., fuel properties, driving parameters, exhaust after-     The updated inventory was then applied in the PMCAMx-UF
treatment technology, and environmental parameters (Kesk-           model, and the effects of updating were studied at different
inen and Rönkkö, 2010). Only emissions of particles larger          spatial and temporal scales, compared to the observational
than 10 nm were estimated in the EUCAARI inventory be-              data, and contrasted with NPF. The simulated period (May
cause emissions of especially sub-10 nm particles for many          2008) was photochemically relatively active, which elevates
emission sources have not been determined with high enough          NPF to the major source of new particles. This period was
certainty or not determined at all.                                 chosen because the same period has been simulated in several
   Particles formed via a nucleation process are typically ob-      other related studies as well, providing plenty of comparable
served as a different mode – called nucleation mode – in the        data and pre-defined input files for emissions and meteorol-
particle size distribution (PSD) of the exhaust. Although the       ogy. Since the street canyon measurements were performed
nucleation mode particles are formed from primary gaseous           in 2017 – using more recent technologies for PSD measure-
emissions after the exhaust is released from the exhaust pipe,

Atmos. Chem. Phys., 22, 1131–1148, 2022                                              https://doi.org/10.5194/acp-22-1131-2022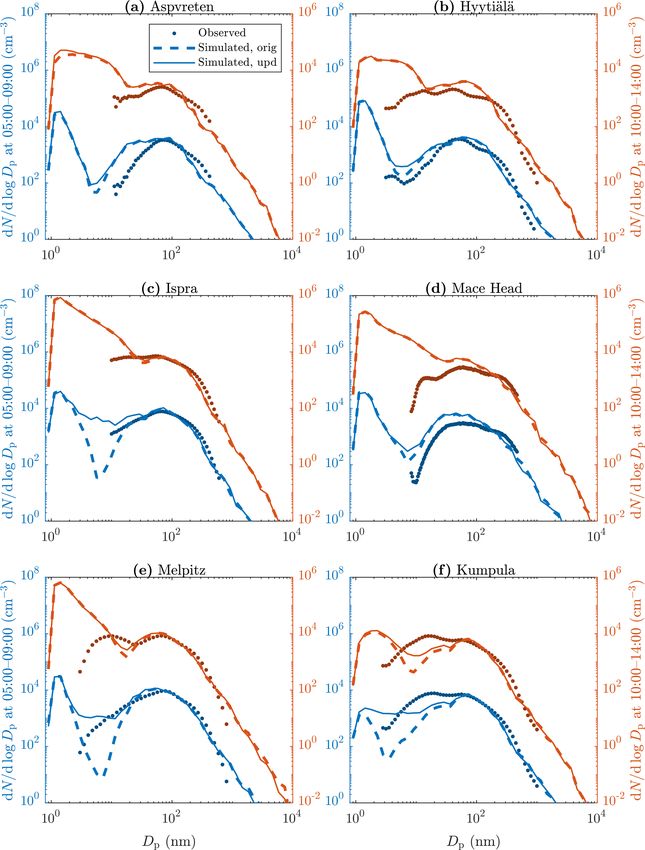
M. Olin et al.: Contribution of traffic-originated nanoparticle emissions to regional and local aerosol levels                1133

ments – trends of urban aerosol and vehicle emissions were          ples shown in Fig. S1 in the Supplement) in 1 min time reso-
used to scale the determined emissions from 2017 to 2008.           lution, as was done for the NCA concentration by Olin et al.
                                                                    (2020). To express all data in a similar time resolution, the
2     Experimental data                                             PSDs measured with the DMPS at 9 min resolution were
                                                                    interpolated to 1 min resolution before calculating the EFs.
The original EUCAARI inventory was updated using PSDs               Whereas NCA measured at the curbside probably originates
and CO2 concentrations measured at the Mäkelänkatu super-           from the studied street or via atmospheric NPF, larger parti-
site, located in a highly trafficked street canyon in Helsinki,     cles – having longer atmospheric lifetime – can be originated
Finland. The street canyon measurements were performed in           also from larger areas, including nearby streets or the whole
May 2017 and in May 2018. PMCAMx-UF simulations were                urban area. Nevertheless, due to the fact that linear fitting
done for May 2008 as in the previous PMCAMx-UF stud-                of the particle concentrations from every size bin against the
ies over Europe (Fountoukis et al., 2012; Ahlm et al., 2013;        CO2 concentration is possible (Fig. S1), their relation to the
Baranizadeh et al., 2016; Julin et al., 2018). More recent          traffic is evident, although all particle sizes may not be orig-
measurements for determining traffic emissions were used            inated from the studied street. The calculated EFs are here
because PSD measurements down to ∼ 1 nm were unavail-               represented as an emission factor particle size distribution
able in 2008. Hourly PSD data are also available for several        (EFPSD; dn/d log Dp ), presented later in Sect. 3.2.2.
atmospheric measurement stations across Europe for May
2008.
                                                                    2.2    Atmospheric measurement stations

2.1    Determining traffic emission factors                         Simulation results are compared with the observations from
                                                                    several atmospheric measurement stations across Europe.
The Mäkelänkatu supersite is a continuous measurement site          PSD data from six measurement stations from the EU-
operated by the Helsinki Region Environmental Services Au-          SAAR (European Supersites for Atmospheric Aerosol Re-
thority (HSY). It is located at a curbside of a highly traf-        search) network and from the SMEAR (Station for Measur-
ficked (28 000 vehicles per workday) street canyon about            ing Ecosystem–Atmosphere Relations) III station in Helsinki
3 km north of the city center of Helsinki, Finland. About           were utilized in the model evaluation.
1/10 of the traffic is comprised of heavy-duty vehicles. The           The selected EUSAAR stations (Kulmala et al., 2011) rep-
detailed information on the supersite and the measurements          resent different types of locations: Aspvreten, Sweden, and
performed in May 2017 can be found elsewhere (Kuulu-                Mace Head, Ireland, are located in coastal areas; Hyytiälä,
vainen et al., 2018; Hietikko et al., 2018; Olin et al., 2020).     Finland, and Vavihill, Sweden, are located in rural conti-
Additionally, the composition of NCA (volatile and non-             nental areas; Ispra, Italy, and Melpitz, Germany, are not in
volatile fractions), measured at the Mäkelänkatu supersite in       close vicinity of pollution sources but are still affected by
May 2018 (Lintusaari et al., 2022), and the particle composi-       traffic emissions. The SMEAR III station in Kumpula, in
tions (black carbon (BC), sulfate (SO4 ), and primary organic       Helsinki, Finland, is located in an urban background area,
aerosol (POA) fractions) in diluted exhaust of a diesel bus,        and the nearest busy road (50 000 vehicles per day) is sep-
obtained from a simulation with an aerosol dynamics model           arated from it by a 150 m band of deciduous forest (Järvi
coupled with a computational fluid dynamics (CFD) model             et al., 2009). The Kumpula station is less than 1 km away
(Olin, 2013), were used in splitting the EFs further into           from the Mäkelänkatu station; thus, they are quite compa-
chemical compound categories specified by the EUCAARI               rable. However, the Mäkelänkatu station is much more af-
inventory.                                                          fected by traffic because it is located at a curbside of a busy
   PSDs (dN/d log Dp ) were determined with the combina-            street canyon (Okuljar et al., 2021). They fall inside the same
tion of a particle size magnifier (PSM), two condensation           computational grid cell of the PMCAMx-UF model in this
particle counters (CPCs), and a differential mobility particle      regional-scale application.
sizer (DMPS), as described by Olin et al. (2020). In addition
to the study by Olin et al. (2020), taking only a large-particle
dilution ratio (DR = 8.2) of the used bridge diluter into ac-       3     Simulations
count, DR is now afterward corrected for very small parti-
cles. The correction was done using a DR vs. Dp curve de-           Simulations were performed with the PMCAMx-UF model
termined in an inverse modeling study with CFD (Olin et al.,        for 1–29 May 2008, similarly to Julin et al. (2018). The re-
2019). The corrected DRs for the first two size bins (1.2–3         sults from the first 2 d were omitted from the analysis to min-
and 3–7 nm) are 10.7 and 8.8 instead of the constant value of       imize the effects of uncertain initial conditions. The model
8.2.                                                                was run with the original and with the updated emission
   The concentrations (N in cm−3 ) of every size bin of the         inventory. The effects of traffic emissions and atmospheric
determined PSDs were converted to EFs (n in kg−1       fuel ) us-   NPF were also examined by performing the model runs also
ing simultaneous CO2 concentration measurements (exam-              without NPF.

https://doi.org/10.5194/acp-22-1131-2022                                            Atmos. Chem. Phys., 22, 1131–1148, 2022
1134             M. Olin et al.: Contribution of traffic-originated nanoparticle emissions to regional and local aerosol levels

3.1     Model description                                         tors, according to the decrease in the normalized error while
                                                                  increasing the number of factors. Due to an inexact nature
The three-dimensional regional chemical transport model
                                                                  of PMF, the optimal solution was not obtained with 15 fac-
PMCAMx-UF simulates both the size-dependent particle
                                                                  tors even though the inventory has been constructed with
number and chemically resolved mass concentrations (Jung
                                                                  15 sources. Figure S2 presents maps of the monthly mean
et al., 2010). Vertical and horizontal advection and disper-
                                                                  abundances of all 16 PMF factors. The factors 5, 6, 7, 11,
sion, wet and dry deposition, and gas-phase chemistry de-
                                                                  and 12 have features reflecting real traffic patterns. However,
scriptions are based on the publicly available CAMx (Com-
                                                                  Fig. S3 presenting means of diurnal variations in the abun-
prehensive Air Quality Model with Extensions) air quality
                                                                  dances of the PMF factors in Kumpula and Mäkelänkatu as
model. Aerosol dynamics processes in PMCAMx-UF, NPF,
                                                                  well as Melpitz displays that reasonable diurnal cycles for
condensation, and coagulation are modeled using the DMAN
                                                                  both stations are seen only with the factors 6, 7, and 11. Of
(Dynamic Model for Aerosol Nucleation) by Jung et al.
                                                                  these, only the PSD from the factor 6 (Fig. S4) corresponds to
(2006). DMAN tracks the aerosol mass and number distri-
                                                                  the on-road diesel exhaust PSD, presented by Denier van der
butions using the TOMAS (two-moment aerosol sectional)
                                                                  Gon et al. (2009), which is also a bimodal distribution hav-
algorithm (Adams and Seinfeld, 2002), in which particles are
                                                                  ing the modes at 23 and 57 nm. The road-transport-related
logarithmically divided into 41 size bins between 0.8 nm and
                                                                  source in the original EUCAARI inventory was available as
10 µm.
                                                                  the total particle mass emission rate. Thus, the map of and
   This study used the most recent version of the PMCAMx-
                                                                  diurnal variation in the particle mass emission rate from the
UF model, used also by Julin et al. (2018). In this version,
                                                                  factor 6 were compared with the ones from the EUCAARI
particles contain 15 chemical components: POA, BC, SO4 ,
                                                                  inventory (Fig. S5). It can be seen that the map features, di-
ammonium (NH4 ), five secondary organic aerosol (SOA)
                                                                  urnal variations, and the level of the values overall are very
components separated according to their volatility, crustal
                                                                  comparable with some exceptions, such as some ship routes
material, nitrate, sodium, chloride, a surrogate amine species,
                                                                  in the factor 6, due to inexactness of PMF. However, marine
and water (H2 O). The model predicts NPF rate from the
                                                                  areas were omitted from the following emission updates.
sum of the rates of three included NPF mechanisms: sulfuric
                                                                     Finally, the PMF factor 6 was selected to represent the
acid (H2 SO4 )–ammonia–H2 O and H2 SO4 –dimethylamine–
                                                                  road-transport-related sub-category updated in this work. Al-
H2 O mechanisms based on the cluster kinetic model ACDC
                                                                  though the road-transport-related emissions in the inventory
(Atmospheric Cluster Dynamics Code; McGrath et al., 2012;
                                                                  consist of four sources, only the factor 6, which is presum-
Olenius et al., 2013) and the classical-nucleation-theory-
                                                                  ably only diesel-related, was used in updating the inventory
based H2 SO4 –H2 O mechanism (Vehkamäki et al., 2002).
                                                                  because it was connected to road emission with high cer-
The used computational grid covered the European domain
                                                                  tainty. Omitting the other sub-categories (gasoline, liquefied
with a 36 km × 36 km horizontal grid resolution and 14 verti-
                                                                  petroleum gas, and non-exhaust emissions) is not significant
cal layers, reaching an altitude of 6 km. More detailed infor-
                                                                  because the abundances of the other factors are lower com-
mation of the used model version can be found in Julin et al.
                                                                  pared to the factor 6 and because using this factor already
(2018).
                                                                  slightly overestimates the mass emissions (Fig. S5).

3.2     Updating the emission inventory
                                                                  3.2.2   Emission factor particle size distribution
3.2.1    Extracting the road-transport-related particle
                                                                  Figure 1 presents the EFPSD derived from the PSD measure-
         emissions from the EUCAARI inventory
                                                                  ments in Mäkelänkatu. Its shape agrees well with the shape
Hourly gridded particle emissions in the EUCAARI emis-            of the difference PSD (background PSD subtracted from the
sion inventory are separated into 15 source categories and        PSD measured when wind blew from the road) from the
sub-categories. One of the categories is for road transport,      same experiment reported by Hietikko et al. (2018), with the
and it is further separated to four sub-categories: gasoline,     exception of a slightly higher soot mode in the difference
diesel, liquefied petroleum gas, and non-exhaust (e.g., from      PSD. The agreement implies that deriving an EFPSD from
tires or brakes) emissions. Because the particle number emis-     bin-by-bin calculation of EFs using CO2 concentrations is
sion rates in 41 size bins in a source category level were not    an acceptable method. The concentration at the first size bin
openly available, updating only road-transport-related emis-      (1.2–3 nm) is calculated as the average (circled dot) of two
sions was not straightforward. The road-transport-related         values: the value (dot) derived from the experiment in 2017
emissions were extracted from the inventory – reporting the       and the value (circle) derived from the experiment in 2018
particle number emissions as a sum of all 15 sources (sepa-       (Lintusaari et al., 2022). This was due to a reason that the
rated in all size bins and components) – through a positive       concentration of the first bin was lower than the next bin (3–
matrix factorization (PMF) analysis.                              7 nm) with the year 2017 data. This is unexpected and pos-
   The most optimal solution from the PMF analyses was            sibly caused by uncertainties involved in the detection and
obtained when the inventory was represented with 16 fac-          penetration efficiency corrections for the particles in the first

Atmos. Chem. Phys., 22, 1131–1148, 2022                                             https://doi.org/10.5194/acp-22-1131-2022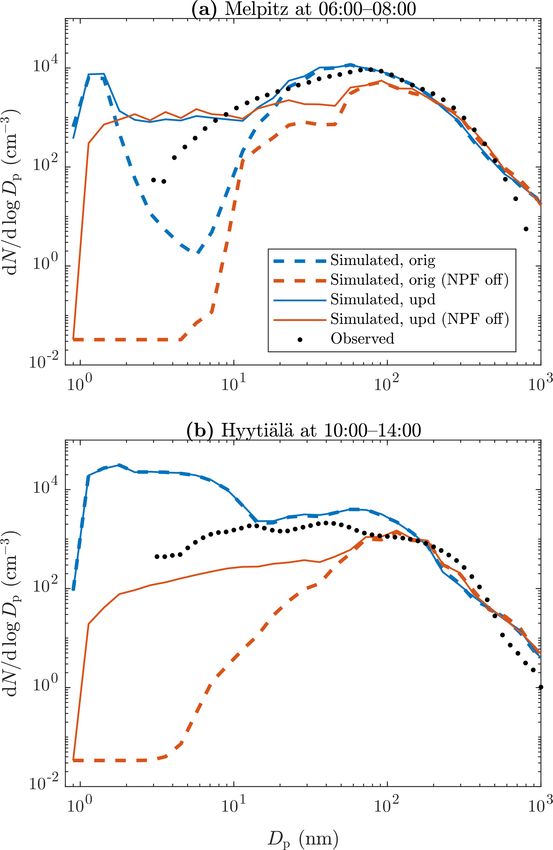
M. Olin et al.: Contribution of traffic-originated nanoparticle emissions to regional and local aerosol levels                   1135

                                                                      2008 using the yearly decrease rate of PM2.5 , 7.1 % a−1 (Lu-
                                                                      oma et al., 2021), resulting in the EF of 0.87 g kg−1 fuel . That
                                                                      leads to the value of 4.9 × 10⁷ g h−1 for the simulation do-
                                                                      main. This value is the same for the hourly emission of PM2.5
                                                                      obtained from the PMF factor 6, which leads to the levels of
                                                                      EFPSD and the PSD from PMF matching with each other at
                                                                      Dp of 57 nm. The yearly decrease rate of PM2.5 (7.1 % a−1 )
                                                                      was, however, reported as statistically not a significant trend
                                                                      (Luoma et al., 2021), and also it only covers the trend be-
                                                                      tween the years 2015 and 2018. Thus, a trend was also es-
                                                                      timated with the data from Kumpula, which fully cover the
                                                                      years between 2008 and 2017. Applying a seasonal Mann–
                                                                      Kendall test and Sen’s slope estimator – as done by Luoma
                                                                      et al. (2021) – to the particle number concentration at 56 nm
                                                                      gives the yearly decrease rate of 4.4 % a−1 for the years be-
                                                                      tween 2008 and 2017. Since this trend is for Kumpula, the
                                                                      trend for Mäkelänkatu could be around 7.1 % a−1 because the
Figure 1. PSD from PMF factor 6 and EFs measured at
                                                                      trends of other quantities for Mäkelänkatu were found to be
Mäkelänkatu as PSD (EFPSD) together with the trimodal fit on it.
                                                                      approximately 2-fold the trends for Kumpula in the study by
The vertical line at 57 nm denotes the highest Dp considered in the
updating process and is also the size where the PSDs overlap. The     Luoma et al. (2021). Additionally, the PM2.5 trend was cal-
shape of the difference PSD measured at Mäkelänkatu (Hietikko         culated from the data of yearly (1990–2019) road transport
et al., 2018) is also shown for comparison (the data are scaled so    emissions (without road, tire, and brake wear) in Finland, re-
that they can be easily compared with the EFPSD data).                ported by EMEP (2021). The decreasing trend calculated for
                                                                      the years between 2008 and 2017 is 6.0 % a−1 , which corre-
                                                                      sponds relatively well to the trend applied here (7.1 % a−1 ).
bin (NCA-sized). The efficiencies of NCA are very low and                Because fuel efficiency has developed during the years,
thus prone to high relative uncertainty. The EF of NCA from           CO2 emissions from road transport were at different levels
the study by Lintusaari et al. (2022) – which, in that case, is       in 2008 and in 2017. The method of determining EFs using
higher than the EF of the next bin – was utilized because             CO2 concentrations gives the EFPSD with respect to kilo-
more sophisticated efficiency calculations were performed             grams of fuel combusted. Therefore, it can be applied to any
there, and it is thus considered to be more accurate. Parti-          year. However, the total amount of combusted fuel in the
cles in the first two size bins simulated with the PMCAMx-            computational grid with respect to time has changed, leading
UF model (0.8–1.3 nm) originate only from NPF processes;              to the need of scaling the time-based particle emission rates
such particles also cannot be measured using aerosol instru-          – which is the form of the emission input of the model – up-
mentation.                                                            wards from the year 2017 to the year 2008. This scaling has,
   The EFPSD, expressed in the unit of kg−1       fuel , was con-     however, already been performed when the EFs were scaled
verted to correspond to the emission source input of the              using the trends of PM2.5 because ambient PM2.5 concentra-
model, expressed in the unit of m−2 h−1 in the follow-                tions have decreased not only due to equipping vehicles with
ing way. The yearly CO2 emissions from road transport                 a DPF but also due to the fact that the total amount of fuel
in the EU were 7.9 × 10¹¹ kg in 2008 (European Environ-               combusted has decreased.
ment Agency, 2021). It corresponds to the fuel combustion                The shapes of the PSD from PMF factor 6 and the esti-
of 2.5 × 10¹¹ kgfuel a−1 , which was further corrected with           mated EFPSD beyond 57 nm agree relatively well, suggest-
the factor of the population count within the simulation do-          ing that the soot mode was estimated quite accurately already
main and in the EU, resulting in the fuel combustion of               in the original EUCAARI inventory. Because the PSDs of
5.7 × 10⁷ kgfuel h−1 . The EFPSD, determined for the year             the soot modes lie at similar levels, the emitted particle mass
2017, expressed as PM2.5 is 0.31 g kg−1  fuel . However, due to       was affected only marginally in the update. The soot mode is
tightened emission regulations, which have led to the in-             assumed to be already estimated well also because exhaust
troduction of vehicles emitting fewer soot particles (Diesel-         soot measurements have a much longer history than mea-
Net, 2021), e.g., by equipping vehicles with a diesel par-            surements of smaller particles. Additionally, the soot particle
ticulate filter (DPF) (Wihersaari et al., 2020), the EF of            concentration is not as sensitive to driving and environmental
PM2.5 was higher in 2008 (EMEP, 2021). Decreasing BC                  parameters as the concentration of smaller particles. A value
and PM2.5 concentrations in Mäkelänkatu have also been ob-            of 57 nm was selected as the upper limit for which the up-
served from the long-term measurements since 2015 (Bar-               dating process was applied; i.e., no changes to the original
reira et al., 2021; Luoma et al., 2021). The determined EF of         inventory for Dp > 57 nm were made.
PM2.5 was thus estimated to correspond to the EF for the year

https://doi.org/10.5194/acp-22-1131-2022                                              Atmos. Chem. Phys., 22, 1131–1148, 2022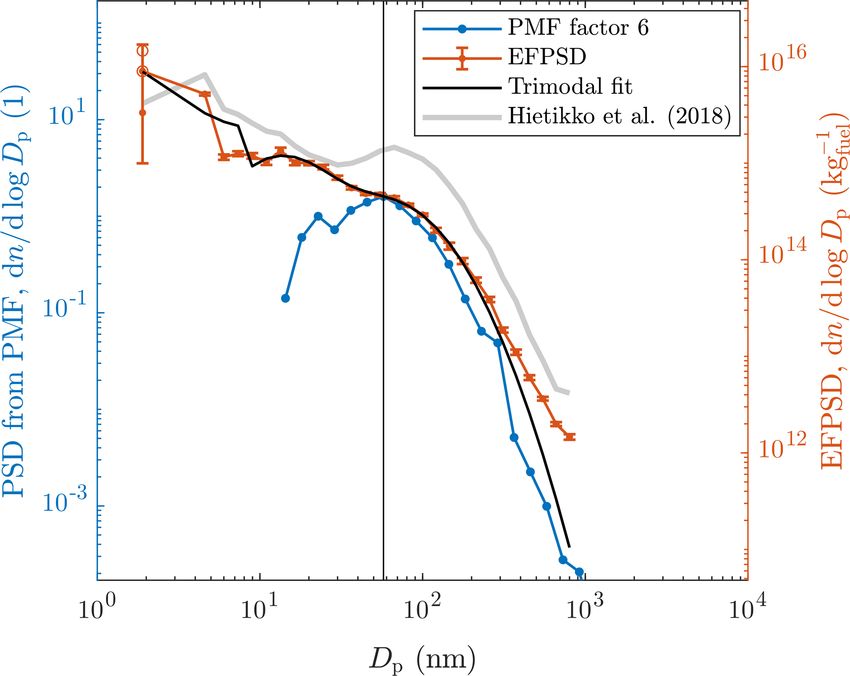
1136             M. Olin et al.: Contribution of traffic-originated nanoparticle emissions to regional and local aerosol levels

3.2.3   Uncertainties involved in updating the emission             Mäkelänkatu, near the measurement site, also providing data
        inventory                                                   for emissions with higher engine loads during accelerations.
                                                                       Particle emissions depend also on environmental param-
                                                                    eters, such as temperature (Mathis et al., 2004; Olin et al.,
Here we elaborate further on the uncertainties involved in          2019) and radiation (Olin et al., 2020). Therefore, particle
representing the road-transport-related emissions Europe-           emissions can differ between nighttime and daytime. Here,
wide with a single EFPSD determined from the measure-               we aim for a first-level approximation of PSDs of the emis-
ments in Mäkelänkatu in 2017.                                       sions using a single EFPSD – for the most representative av-
   Estimating the level of the EFPSD for the year 2008 from         erage covering the whole vehicle fleet, driving parameters,
the measurements performed in 2017 includes high uncer-             and environmental parameters in May. Despite this simpli-
tainty because the used yearly decrease rate of PM2.5 by Lu-        fication, it is a useful first step in determining the impor-
oma et al. (2021) was determined from the measurements              tance of these particles. To our knowledge, in addition to the
not beginning until 2015 and includes its own uncertainty           Mäkelänkatu site, no other location with simultaneous CO2
(including statistically not a significant result). Nevertheless,   and PSD measurements down to ∼1 nm is available.
the scaling of the soot modes was a primary objective here             Number-based EFs of especially sub-30 nm particles could
because, hence, the update of the inventory considers only          be quite different if the emissions were determined from
updating the shape of the emitted PSD (below 57 nm) but not         measurements performed at a different location, on a dif-
its level overall. Additionally, estimating the possible change     ferent road-type, and at a different time. In contrast, EFs
in the shape of the PSD during the years was not possible.          of particles larger than 30 nm – mainly soot – would pos-
It is, nevertheless, expected that while equipping vehicles         sibly differ much less with differing location or time. Nev-
with DPFs, soot particle concentrations are decreased, but          ertheless, the approach in this study still represents the most
also the smaller particles may have been decreased. That is         realistic approximation currently available, and it improves
because a DPF can filter small particles also – if they are         the representation of the road traffic emissions in the origi-
primarily emitted – and because fuel sulfur content has been        nal inventory, which excluded all sub-10 nm particles. Emis-
reduced (DieselNet, 2021), leading to fewer particles formed        sions of sub-10 nm particles have also been applied in the
via sulfur-driven nucleation (Maricq et al., 2002; Kittelson        study by Paasonen et al. (2016), who included a size bin for
et al., 2008). It should, however, be noted that while the par-     3–10 nm particles, based on the TRANSPHORM database
ticle emissions from diesel vehicles have been decreased over       (Vouitsis et al., 2013). However, they did not include any
the last few years, the gasoline vehicle fleet has begun to emit    modes smaller than 10 nm; thus, this size bin was only an
more particles due to the increased favoring of gasoline direct     extension from PSDs with larger modes. Kontkanen et al.
injection technologies (Awad et al., 2020). On one hand, this       (2020) compared annual size-binned particle emissions be-
increases the uncertainty in estimating the EFPSD for 2008          tween their estimations from ambient data measured in ur-
using the data from 2017; but on the other hand, it provides        ban Beijing and the model by Paasonen et al. (2016). They
better estimation on the air quality affected by the modern         observed that the ambient data suggest significantly more
vehicle fleet.                                                      particles in the sub-60 nm size range. This is due to the fact
   Vehicle fleets differ among countries, e.g., by fuel selec-      that the ambient data represent emissions from a more local-
tion and by the ages of the vehicles. The average vehicle age       ized – traffic-influenced – area but also because the small-
in Finland is similar to the European average, while diesel         est particles are omitted from the traffic emissions in the
vehicles are on average slightly less popular in Finland than       TRANSPHORM database.
in the rest of Europe (Eurostat, 2021). It should, however, be
noted that averaging of vehicle ages or fuel types over Eu-         3.2.4   Parameters of the emission factor particle size
rope is not the most representative in terms of the average                 distribution utilized in updating the emission
emissions or particle exposure because there are countries                  inventory
with old vehicle fleets with mostly diesel vehicles – a com-
bination with a plenty of soot emissions – but also countries       To utilize the determined EFPSD within PMCAMx-UF, it
with new vehicle fleets also with mostly diesel vehicles – a        was transformed to the model size bins through a continuous
combination with the fewest particle emissions. In addition,        fit (Fig. 1). A trimodal fit consisting of a power law distri-
there are countries with other possible mixtures of fleet ages      bution and two log-normal distributions (see the Supplement
and fuel types of vehicles as well.                                 for the detailed equation) is used because there seems to be
   Particle emissions depend on driving parameters, such as         features of two log-normal distributions – as typical in vehi-
on engine load (Rönkkö et al., 2006). Therefore, particles          cle exhaust – but the smallest particles cannot be fitted very
emitted on an urban street, such as Mäkelänkatu, do not             well to any log-normal distribution. A power law distribution
fully represent the particles emitted on other road types,          fits moderately and is suggested by the theory of simultane-
such as on motorways, where higher engine loads are uti-            ous nucleation and growth processes (Olin et al., 2016). The
lized. However, there are signal-controlled intersections on        parameters of the fit are presented in Table 1. It is interest-

Atmos. Chem. Phys., 22, 1131–1148, 2022                                              https://doi.org/10.5194/acp-22-1131-2022
M. Olin et al.: Contribution of traffic-originated nanoparticle emissions to regional and local aerosol levels 1137
Table 1. Mode parameters of the trimodal fit on the measured EF- cle exhaust does not always require H2 SO4 -driven formation
PSD and the estimated particle composition. process.
To add particles to the original road-transport-related PSD,
Mode name Power law Nucleation Soot a selection for their chemical composition was needed. Be-
n (1014 /kgfuel ) 115 17.2 6.44 cause measuring chemical composition for sub-50 nm parti-
D1 (nm) 1.2 – – cles is challenging, this study relies on CFD simulations of
D2 (nm) 8.0 – – particle composition 10 m behind a diesel-fueled bus by Olin
α −1.2 – – (2013). They consist of a situation where a Euro III bus is
CMD (nm) – 13.4 59.0 driving at a speed of 40 km h−1 with an engine power of 40 %
GSD – 1.8 1.9 of the maximum (see the Supplement for a more detailed de-
BC mass fraction 0.158 0 0.688 scription). The CFD simulations give mass fractions of BC,
SO4 mass fraction 0.128 0.152 0.064 SO4 , POA, and H2 O for the nucleation and soot modes. The
POA mass fraction 0.714 0.848 0.248 road transport emissions in the original EUCAARI inventory
D1 and D2 : diameters of the smallest and largest particles of the mode, consist solely of BC, SO4 , POA, and crustal material. Thus,
respectively; α : slope parameter; CMD: count median diameter; GSD: the CFD-simulated mass fractions can be directly utilized in
geometric standard deviation.
the inventory, with the exception of H2 O, which is not in-
cluded in the emissions due to an equilibrium-type behavior
of H2 O dynamics in the model. The chemical composition
for the power law mode is determined by, firstly, assuming
ing that trimodal size distributions of non-volatile particles a fraction of 16 % of non-volatile particles (the non-volatile
– with quite similar particle sizes to the ones found in this fraction of NCA; Lintusaari et al., 2022) and, secondly, as-
study – were also detected in diesel exhaust by Kuuluvainen suming the nucleation mode composition for the remaining
et al. (2020). They conclude that the mode in the middle is volatile part. The non-volatile part is here lumped together
originated from lubricating oil, whereas it is associated here with BC due to the lack of more specific information on its
with nucleation-originated particles. composition and because adding an extra component would
The contribution of the road-transport-related particle have required several modifications to the model code. BC
number emissions (from the PMF factor 6, which is presum- together with the unknown non-volatile part is abbreviated
ably related only to diesel vehicles) to the total emissions here to BC*. Figure 2 presents the particle chemical com-
from all emission sources was averagely 8 % in the origi- position of the traffic-emitted particles as a function of Dp
nal inventory. In updating the inventory, these road-transport- in the original and in the updated inventory. The composi-
related particle number emissions were increased to a 26- tion between 10 and 57 nm is modified to contain more POA
fold level, resulting in the increase in the total number emis- and less BC because nucleation mode particles – consist-
sions to a 3-fold level. Hence, in the updated inventory, the ing mainly of POA – were considerably added. Nucleation-
contribution of these road-transport-related particle number mode-sized particles were also in a relatively low SO4 con-
emissions (from diesel vehicles) to the total emissions be- centration in the original inventory, but more SO4 is included
comes 69 %. Due to the lack of all sub-10 nm particle emis- in the updated inventory. No particles below 10 nm were in-
sions in the original EUCAARI inventory, sub-10 nm par- cluded in the original inventory. Importantly, the inventory
ticle emissions in the updated one come exclusively from does not include metallic ash particles, which have been re-
road transport. By considering only the number concentra- ported to contribute particle emissions especially in the ultra-
tions of ultrafine particles (UFPs; sub-100 nm particles), the fine particle size range.
road-transport-related emissions were increased to a 28-fold The selection of the CFD simulations of a diesel-fueled
level. This resulted in the total UFP number emissions in- bus for determining chemical composition of particles was
creasing by a factor of 3.1. further elaborated by examining other related studies as
Vehicle-emitted particles originate primarily via three well. Kostenidou et al. (2021) measured chemical compo-
routes: in-cylinder processes (soot mode, ash particles, non- sition of particles emitted by different gasoline- and diesel-
volatile core), nucleation after the exhaust pipe (nucleation fueled Euro 5 light-duty vehicles over different transient
mode), and a less-known source of NCA (power law mode). driving cycles on a dynamometer. Calculated from the re-
Therefore, a trimodal fit suits well in separating particle com- ported EFs, the mass fractions of BC, SO4 , and POA in the
position between the three sources. However, it should be total aerosol were 0.58–0.98, 0.00–0.30, and 0.02–0.15, re-
noted that the vehicle exhaust particle formation is a complex spectively. Similarly, Pirjola et al. (2019) measured a diesel-
process, and this approach is only an approximate. Studies fueled Euro 4 light-duty vehicle and reported BC, SO4 , and
such as Kuuluvainen et al. (2020) and Alanen et al. (2020) POA mass fractions of 0.81–0.88, 0.00–0.03, and 0.11–0.18,
divide the non-volatile PSDs of internal combustion engine respectively. These mentioned mass fractions are compara-
emissions into three categories, based on PSDs and particle ble to the mass fractions in the soot mode from the CFD
morphology studies, and nucleation mode observed in vehi- simulations (Table 1). However, it should be noted that in
https://doi.org/10.5194/acp-22-1131-2022 Atmos. Chem. Phys., 22, 1131–1148, 20221138 M. Olin et al.: Contribution of traffic-originated nanoparticle emissions to regional and local aerosol levels
the mentioned studies, SO4 and POA were measured using
aerosol mass spectrometers, which do not efficiently detect
particles smaller than ∼ 50 nm. Therefore, the composition
of the nucleation mode, or especially of the power law mode,
is barely covered in the measured compositions, and stud-
ies related to these compositions are very scarce. According
to the formation principle of nucleation mode particles, they
do not contain BC; thus, POA dominates in the mass frac-
tions of the nucleation mode (Table 1) as it dominates in the
mass fractions of the volatile (SO4 and POA) part of the soot
mode. Hao et al. (2019) collected PM2.5 particle samples on
filters from a highway tunnel in China and reported BC, SO4 ,
and POA mass fractions of 0.12, 0.09, and 0.34, respectively.
These values lie in the range between the mass fractions of
the nucleation and soot modes from the CFD simulations. In
conclusion, due to the scarcity of studies on chemical com-
position of vehicle-emitted particles and because the CFD-
simulated mass fractions (of a diesel bus only) are reason-
able according to the other studies (including tailpipe emis-
sions of both gasoline- and diesel-fueled light-duty vehicles
and emissions from a real traffic mixture from a road tunnel),
the CFD-simulated ones were used here to cover the whole
vehicle fleet. In addition, this study primarily focuses on the
updating of the shape of the PSD but not on the exact chem-
ical composition of emitted particles, which was, however,
required to be estimated for running the model with the up-
dated inventory.
3.3 Simulation results
3.3.1 Comparing simulated particle number
concentrations with observations
Figure 2. Particle chemical composition (a) of the PMF factor 6
Particle number concentrations from the PMCAMx-UF sim- and (b) after updating the emission inventory. The composition of
ulations were first compared to the ones observed at the mea- the emitted particles larger than 57 nm (vertical lines) remains un-
surement stations. Figure 3 presents hourly means of num- changed, and particles larger than 300 nm are not shown due to their
ber concentrations of particles smaller than 10 nm (N10 ) with the original (orig) and
updated (upd) emission inventories. The data of N10 , no notable differences can be seen between the origi-
ments in the sub-10 nm size range. The lower Dp limit in nal (Fig. 3b) and updated emission inventories (Fig. 3d) ex-
N10 for the simulated and cept slightly increased – but still underestimated – concen-
the observed values depend on the corresponding limits of trations at the lowest end of the simulated concentrations.
the PSD measurements and vary slightly between the sta- The agreement and the correlation with the hourly ob-
tions. There are overestimations in simulated concentrations servations and the scatter for N10 , and N>100 are
of particles between 10 and 50 nm and slight underestima- also presented in Table 2 in terms of normalized mean bias
tions for particles larger than 100 nm (N>100 ) in the previ- (NMB), correlation coefficient (R), and normalized mean er-
ous studies (Baranizadeh et al., 2016; Julin et al., 2018) with ror (NME), respectively. Whereas the values remain nearly
the PMCAMx-UF model, possibly due to missing condens- constants for N>100 after updating the inventory, NMB val-
able vapors and particle growth mechanisms (Baranizadeh ues for N>10 are further increased. The most significant
et al., 2016). Even higher overestimations but also underesti- differences after updating the inventory are observed with
mations are seen in NM. Olin et al.: Contribution of traffic-originated nanoparticle emissions to regional and local aerosol levels 1139 Figure 3. Simulated versus observed number concentrations of particles (a, c) smaller than 10 nm (N10 ) at selected measurement stations with (a, b) the original and (c, d) updated emission inventory. All data correspond to hourly means for May 2008. The solid diagonal lines represent 1 : 1 lines and the dashed ones 1 : 2 and 2 : 1 lines. See Fig. S6 for a clearer presentation of the data from the stations with the highest traffic influences only (Melpitz and Kumpula). the possibility of overestimated NPF rates. On the other Table 2. Normalized mean bias (NMB), correlation coefficient (R), hand, overestimation of the simulated N
1140             M. Olin et al.: Contribution of traffic-originated nanoparticle emissions to regional and local aerosol levels

3.3.2   Effect of updating emission inventory on relative
        particle concentrations

Figure 4 presents how much the concentrations of 1.3–3 nm
(NNCA ), 7–20 nm (N7−20 ), and all particles (Ntot ) change af-
ter updating the inventory. The concentrations remain nearly
unchanged, especially Ntot , but are also stretched out in both
directions, toward decreased and toward increased concen-
trations. However, all the histograms are slightly displaced
from the ratio of 1 so that increased concentrations are more
common. There are also notable extremes in the concentra-
tion ratios, especially for NCA (min: 0.0003; max: 4225),
denoting that NNCA was decreased or increased with factors
of up to several thousand in certain locations on certain days.
Although updating the inventory increases emissions for all
particle sizes, it also leads to decreased concentrations at cer-
tain times in certain areas having a high NPF rate. This re-
sults via increased primary emissions of particles increasing
the condensation and coagulation sinks, which can reduce
nucleating gaseous precursors and newly formed particles,
respectively, and thus lead to fewer small particles. Due to a
complex relationship between the increases in the sinks and
the appearance of small particles, updating the emission in-
ventory can change the particle concentrations in both direc-
tions. It is clear that decreased concentrations are related to
the connection between NPF and emissions because simulat-
ing with NPF processes switched off results in the situation
in which updating the inventory only increases the concen-
trations.
   Figure 5 presents the ratios of the concentration change
as maps. In contrast to the histograms in Fig. 4, the ratios
on the maps are calculated from the monthly mean values,
representing the total aerosol exposure of people living in
certain areas. The roughest extremes of the ratios do not exist
when examining monthly means, but there are still sporadic
areas in which concentrations were decreased or increased by
a factor of ∼ 2 (not shown on the maps). The monthly mean
concentrations, especially of N7−20 , were increased by tens
of percent in densely populated areas, especially in western
Europe, but there are also areas with ratios far below or above
1 over marine areas, such as over the Mediterranean Sea.
   The ratios of the concentration change calculated from
the monthly means are also presented as mean and median
values in Table S1. The values for N
M. Olin et al.: Contribution of traffic-originated nanoparticle emissions to regional and local aerosol levels 1141
can be interpreted as meaning that half of the people within
this European domain are, on average, at least 4 % more ex-
posed to N7−20 compared to what would have been estimated
using the original inventory.
3.3.3 Comparing simulated particle size distributions
with observations
The results so far have displayed that the particle concen-
trations were slightly increased after updating the inven-
tory when the concentrations are averaged over long times
and wide areas. The effect of updating the inventory is ex-
amined locally and more temporally next, first by com-
paring PSDs simulated with the original and with the up-
dated inventory together with the observations. Figure 6
presents monthly means of PSDs at selected measurement
stations separately for mornings (05:00–09:00 LT) and day-
time (10:00–14:00 LT). Daytime typically experiences the
highest NPF rates due to the solar radiation cycle but also
high traffic densities. Mornings, instead, have typically even
more traffic but not yet solar-radiation-ignited NPF. PSDs in
the daytime do not differ notably between the original and
the updated inventories, with the exception of slightly higher
concentrations with the updated inventory in Melpitz and
Kumpula for ∼ 5–30 nm particles. Agreement of the daytime
PSDs with the observations is fairly good for particles larger
than 10 nm, but the overestimation of the simulated particles
(or underestimation of the measured particles) smaller than
10 nm can be seen. Melpitz and Kumpula are again different,
having higher observed concentrations than the simulated
ones. These are locations affected by road traffic, especially
Kumpula, and the results hence indicate that traffic emissions
may still be underestimated even with the updated inventory.
However, it should be noted that the grid cell including the
Kumpula station consists of not only urban areas but rural
and marine areas too. Therefore, the average concentrations
within the grid cell are, indeed, expected to be lower than the
concentrations within urban areas only. Additionally, there
are busy harbor areas and a busy airport within a radius of
15 km from the Kumpula station. It is certainly possible that,
in addition to road transport, other activities, such as aviation
and shipping, can also involve underestimated particle emis-
sions. Hence, other anthropogenic particle emission sources
may also need to be addressed better in emission inventories
in order to have the simulated PSDs agree with the measured
Figure 5. Ratios of monthly means of (a) the NCA concentration ones.
(NNCA ), (b) the concentration of 7–20 nm particles (N7−20 ), and In the case of the morning PSDs, differences between the
(c) the total particle concentration (Ntot ) simulated with the updated emission inventories are more notable. The updated inven-
and with the original emission inventory. tory predicts levels of sub-30 nm particles up to 3 orders of
magnitude higher in areas affected by road traffic (Ispra, Mel-
pitz, and Kumpula) than the original inventory. The use of the
sized particles are considered. The highest differences are original inventory fails to predict PSDs for sub-30 nm parti-
observed when considering particles between 7 and 20 nm, cles for the mornings. The updated inventory, instead, gives
for which the population density weighting gives a mean in- fairly good agreements for the PSDs when the possible un-
crease of 10 % and a median increase of 4 %. The latter value derestimation of PSD measurements for sub-10 nm particles
https://doi.org/10.5194/acp-22-1131-2022 Atmos. Chem. Phys., 22, 1131–1148, 20221142 M. Olin et al.: Contribution of traffic-originated nanoparticle emissions to regional and local aerosol levels
Figure 6. Monthly means of PSDs at selected measurement stations (a–f) from observations (markers) and from simulations using the
original (dashed lines) and the updated (solid lines) emission inventory in the mornings (blue) and in the daytime (red). All times represent
local times. Note different axis limits for morning and daytime data.
is taken into consideration. People exposed to outdoor air in ficiencies (> 30 % for 6–50 nm particles; ICRP, 1994) and
the mornings in urban areas are exposed to sub-30 nm parti- can thus end up in the human body, even in the brain via the
cles remarkably more than would have been predicted using olfactory nerve (Maher et al., 2016). Therefore, they are of
the original inventory. Furthermore, the differences could be high importance, especially in urban areas and if their ori-
even higher within the urban centers, but the used coarse grid gin is traffic because emissions from fossil fuel combustion
resolution cannot capture the effect at more localized scales. include harmful substances. Simulated particle composition
is examined in Fig. 7 as instantaneous composition in Mel-
3.3.4 Change in particle composition after updating the pitz on 24 May 2008 at 09:00–10:00 LT. The selection of
emission inventory this location and time is made to demonstrate how particle
composition changes due to updating the inventory, while
Sub-30 nm particles may carry potential health issues be- PSD and particle concentration do not significantly change
cause they lie in the range of the highest lung deposition ef-
Atmos. Chem. Phys., 22, 1131–1148, 2022 https://doi.org/10.5194/acp-22-1131-2022M. Olin et al.: Contribution of traffic-originated nanoparticle emissions to regional and local aerosol levels 1143 upd orig upd orig (Ntot /Ntot = 0.93, N
1144             M. Olin et al.: Contribution of traffic-originated nanoparticle emissions to regional and local aerosol levels

Figure 7. Simulated particle composition in Melpitz, on 24 May 2008 at 09:00-10:00 LT, using (a) the original and (b) the updated emission
inventory and simulated particle (c) number and (d) mass size distributions using the original and the updated emission inventory. Others
denote the sum of the remaining components, i.e., crustal material, nitrate, sodium, chloride, and the surrogate amine species.

particle concentrations from the PSD measurements, which               ing to fewer small particles. Examining the ratios from the
are known to become inaccurate for particle sizes below                monthly mean concentrations revealed that, although the to-
∼ 10 nm. At least the overestimations of sub-10 nm parti-              tal anthropogenic particle number emissions were increased
cles using the updated inventory are not caused by overes-             to a 3-fold level, the total particle count in Europe for the
timating their emissions because the overestimations were              whole month was increased by only 1 % and the total hu-
observed also using the original inventory, in which all sub-          man exposure to particle number by 2 %. The highest mean
10 nm particle emissions were excluded. Nevertheless, the              ratios were observed when considering only 1.3–3 nm parti-
greatest underestimations of the model for sub-10 nm par-              cles (11 % increase) and the highest human exposures when
ticles were overcome, and the correlation between the sim-             considering only 7–20 nm particles (10 % mean increase and
ulated and the observed concentrations was increased when              4 % median increase). The highest increases were observed
the updated emission inventory was used.                               in densely populated areas, especially in western Europe.
   Ratios of simulated particle concentrations after and be-              The updated inventory predicts sub-30 nm particle con-
fore updating the inventory were examined from daily and               centrations up to 3 orders of magnitude higher during the
monthly means of local concentrations. The ratios over and             mornings than the original one in traffic-influenced locations.
below 1 were observed, while the mean and median values                In those urban locations, simulated PSDs also agree notably
were slightly over 1: the predicted concentrations were in-            better with the observed PSDs.
creased or decreased with a factor of up to several thousand,             Because sub-30 nm particles deposit efficiently in the hu-
depending on the examined particle size range, in certain              man respiratory system, they pose a significant health risk,
locations and at certain times after updating the inventory.           especially if their origin is combustion processes emitting
Although particle emissions were only increased in updat-              harmful substances. Even in cases in which the simulated
ing the inventory, it also resulted in decreased concentrations        particle number concentrations did not change markedly, par-
due to increased condensation and coagulation sinks, lead-             ticulate mass of potentially harmful components can increase

Atmos. Chem. Phys., 22, 1131–1148, 2022                                                   https://doi.org/10.5194/acp-22-1131-2022
M. Olin et al.: Contribution of traffic-originated nanoparticle emissions to regional and local aerosol levels                        1145

                                                                       as aviation and shipping activities, may need to be addressed
                                                                       better in emission inventories because they may involve un-
                                                                       derestimated particle emissions as well. Furthermore, esti-
                                                                       mating long-term particle exposure requires the simulations
                                                                       to also be done for seasons with less photochemical activity,
                                                                       in which the role of traffic emissions may be even more high-
                                                                       lighted. The results of this study denote only a lower limit of
                                                                       the contribution of traffic to local aerosol levels due to the
                                                                       coarse grid resolution and due to the selection of the simula-
                                                                       tion period during which the NPF processes are dominating
                                                                       the particle formation.

                                                                       Code and data availability. The used model code is down-
                                                                       loaded from https://github.com/bnmurphy/PMCAMx-UF (last
                                                                       access: 16 November 2020) (PMCAMx-UF community, 2020).
                                                                       The data measured at the Mäkelänkatu supersite are freely
                                                                       available at https://doi.org/10.5281/zenodo.3558852 (Olin,
                                                                       2019). The used data from the Kumpula station is accessible at
                                                                       https://doi.org/10.23729/a581f36b-4305-4f52-922a-7a8618567540
                                                                       (Aalto et al., 2019). The used data from the other measurement
                                                                       stations are downloaded from http://ebas-data.nilu.no (last access:
                                                                       3 March 2021) (EBAS, 2021).

                                                                       Supplement. The supplement related to this article is available
                                                                       online at: https://doi.org/10.5194/acp-22-1131-2022-supplement.

                                                                       Author contributions. MDM, IR, MO, SNP, TR, and JVN de-
                                                                       signed the research. HK performed the measurements. HK and MO
                                                                       analyzed the measurement data. MO and DP updated the emission
                                                                       inventory. MO ran the simulations. MO, IR, and MDM analyzed the
Figure 8. Monthly means of PSDs (a) in Melpitz at 06:00–08:00 LT
                                                                       simulation data. MO prepared the paper with contributions from all
and (b) in Hyytiälä at 10:00–14:00 LT according to the simulations     co-authors.
using the original and the updated emission inventory, both with the
NPF processes kept on and switched off. The observed distributions
are also shown.
                                                                       Competing interests. The contact author has declared that nei-
                                                                       ther they nor their co-authors have any competing interests.

substantially in the sub-10 nm size range. This results from
the substitution of NPF with traffic as the main origin of those       Disclaimer. Publisher’s note: Copernicus Publications remains
particles.                                                             neutral with regard to jurisdictional claims in published maps and
   In conclusion, it is important to consider the emissions            institutional affiliations.
of sub-50 nm particles from traffic in more detail in chem-
ical transport models because the previous underestimations
(with the original EUCAARI inventory) of particles are lo-             Acknowledgements. We thank the CSC for computational re-
cated mainly in populated areas and are the greatest for the           sources. We also thank the authors of the measurement station
most efficiently lung-depositing particle sizes. Additionally,         observation data downloaded from the EBAS and SmartSMEAR
the underestimations are especially for particle components            databases. Harri Portin and Anu Kousa from the Helsinki Re-
having possibly harmful effects on human health. Further in-           gion Environmental Services Authority (HSY) as well as the
                                                                       HSY’s AQ measurement team are acknowledged for their valuable
vestigations of traffic-emitted particles are needed at more
                                                                       work related to the data quality control and measurements at the
local scales than with the coarse grid resolution used in this
                                                                       Mäkelänkatu supersite.
study. The used model can be operated with a grid resolu-
tion of down to, for example, 1 km2 , provided that an emis-
sion inventory for that resolution is available. In addition to
road transport, other anthropogenic emission sources, such

https://doi.org/10.5194/acp-22-1131-2022                                                Atmos. Chem. Phys., 22, 1131–1148, 2022
You can also read