Cycling Past 50: A Closer Look into the World of Older Cyclists - Carol Kachadoorian
←
→
Page content transcription
If your browser does not render page correctly, please read the page content below
Project 2112 April 2021

Cycling Past 50: A Closer Look into the World of Older Cyclists
Carol Kachadoorian

                                                                      transweb.sjsu.edu
M I N E TA T R A N S P O RTAT I O N I N S T I T U T E         dbltildecollaborative.com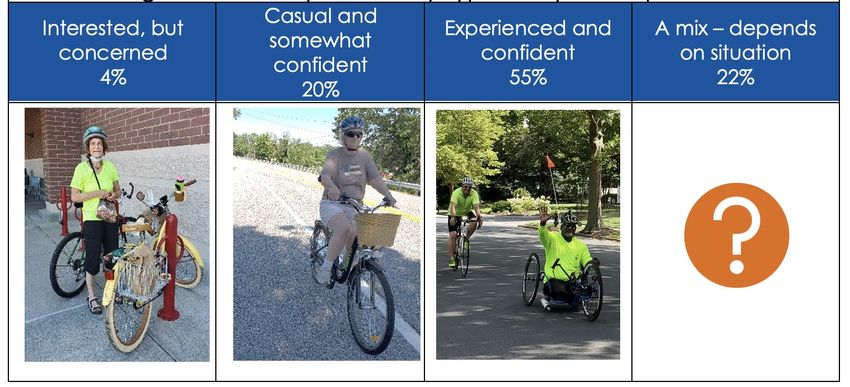
MINETA TRANSPORTATION INSTITUTE MTI FOUNDER
Hon. Norman Y. Mineta
Founded in 1991, the Mineta Transportation Institute (MTI), an organized research and training unit in partnership with the Lucas MTI BOARD OF TRUSTEES
College and Graduate School of Business at San José State University (SJSU), increases mobility for all by improving the safety,
efficiency, accessibility, and convenience of our nation’s transportation system. Through research, education, workforce development,
Founder, Honorable Grace Crunican** Diane Woodend Jones Takayoshi Oshima
and technology transfer, we help create a connected world. MTI leads the Mineta Consortium for Transportation Mobility (MCTM) Norman Mineta* Owner Principal & Chair of Board Chairman & CEO
funded by the U.S. Department of Transportation and the California State University Transportation Consortium (CSUTC) funded by Secretary (ret.), Crunican LLC Lea + Elliott, Inc. Allied Telesis, Inc.
US Department of Transportation
the State of California through Senate Bill 1. MTI focuses on three primary responsibilities: Donna DeMartino David S. Kim* Paul Skoutelas*
Chair, Managing Director Secretary President & CEO
Abbas Mohaddes Los Angeles-San Diego-San Luis California State Transportation American Public Transportation
President & COO Obispo Rail Corridor Agency Agency (CALSTA) Association (APTA)
Econolite Group Inc.
Nuria Fernandez** Therese McMillan Beverley Swaim-Staley
Research Information and Technology Transfer Vice Chair, General Manager & CEO Executive Director President
MTI conducts multi-disciplinary research focused on surface MTI utilizes a diverse array of dissemination methods and Will Kempton Santa Clara Valley Metropolitan Transportation Union Station Redevelopment
Executive Director Transportation Authority (VTA) Commission (MTC) Corporation
transportation that contributes to effective decision making. media to ensure research results reach those responsible Sacramento Transportation Authority
Research areas include: active transportation; planning and policy; for managing change. These methods include publication, John Flaherty Bradley Mims Jim Tymon*
Executive Director, Senior Fellow President & CEO Executive Director
security and counterterrorism; sustainable transportation and seminars, workshops, websites, social media, webinars, Karen Philbrick, PhD* Silicon Valley American Conference of Minority American Association of
land use; transit and passenger rail; transportation engineering; and other technology transfer mechanisms. Additionally, Mineta Transportation Institute Leadership Form Transportation Officials (COMTO) State Highway and Transportation
San José State University Officials (AASHTO)
transportation finance; transportation technology; and MTI promotes the availability of completed research to
William Flynn * Jeff Morales
workforce and labor. MTI research publications undergo expert professional organizations and works to integrate the Winsome Bowen President & CEO Managing Principal Larry Willis*
peer review to ensure the quality of the research. research findings into the graduate education program. Chief Regional Transportation Amtrak InfraStrategies, LLC President
Strategy Transportation Trades
MTI’s extensive collection of transportation-related Facebook Rose Guilbault Dan Moshavi, PhD* Dept., AFL-CIO
Board Member Dean, Lucas College and
Education and Workforce Development publications is integrated into San José State University’s
David Castagnetti Peninsula Corridor Graduate School of Business * = Ex-Officio
To ensure the efficient movement of people and products, we world-class Martin Luther King, Jr. Library. Co-Founder Joint Powers Board San José State University ** = Past Chair, Board of Trustees
must prepare a new cohort of transportation professionals Mehlman Castagnetti
Rosen & Thomas Ian Jefferies* Toks Omishakin*
who are ready to lead a more diverse, inclusive, and equitable President & CEO Director
transportation industry.To help achieve this, MTI sponsors a suite Maria Cino Association of American Railroads California Department of
Vice President Transportation (Caltrans)
of workforce development and education opportunities. The America & U.S. Government
Institute supports educational programs offered by the Lucas Relations Hewlett-Packard Enterprise
Graduate School of Business: a Master of Science in Transportation
Management, plus graduate certificates that include High-Speed
and Intercity Rail Management and Transportation Security
Management. These flexible programs offer live online classes
Directors
so that working transportation professionals can pursue an
advanced degree regardless of their location. Karen Philbrick, PhD
Executive Director
Hilary Nixon, PhD
Deputy Executive Director
Asha Weinstein Agrawal, PhD
Education Director
National Transportation Finance
Center Director
Brian Michael Jenkins
National Transportation Security
Disclaimer Center Director
The contents of this report reflect the views of the authors, who are responsible for the facts and accuracy of the information presented herein.
This document is disseminated in the interest of information exchange. MTI’s research is funded, partially or entirely, by grants from the U.S.
Department of Transportation, the U.S. Department of Homeland Security, the California Department of Transportation, and the California
State University Office of the Chancellor, whom assume no liability for the contents or use thereof. This report does not constitute a standard
specification, design standard, or regulation.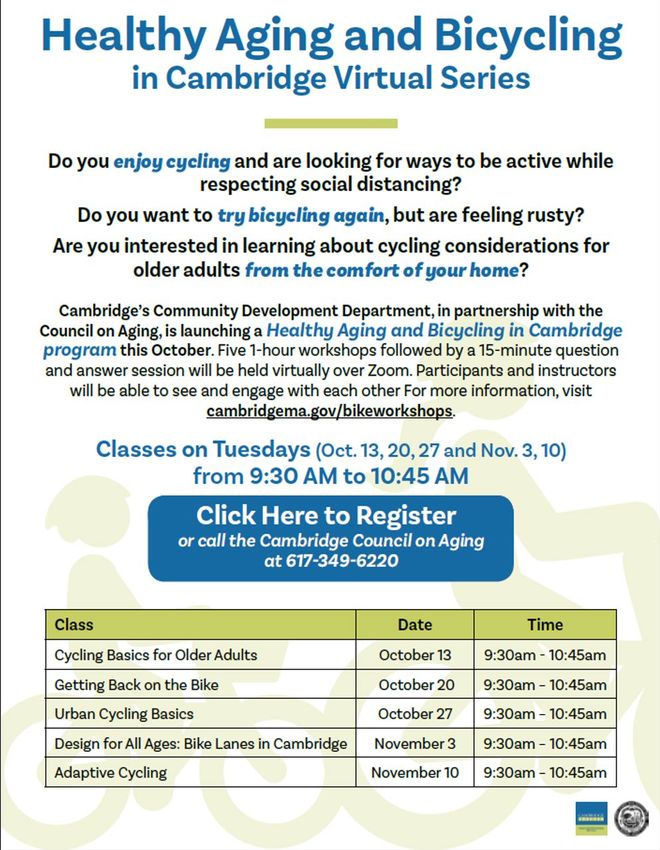
REPORT 21-09

CYCLING PAST 50: A CLOSER LOOK INTO THE WORLD
              OF OLDER CYCLISTS

                 Carol Kachadoorian

                     April 2021

                                      A publication of
                                      Mineta Transportation Institute
                                      Created by Congress in 1991

                                      College of Business
                                      San José State University
                                      San José, CA 95192-0219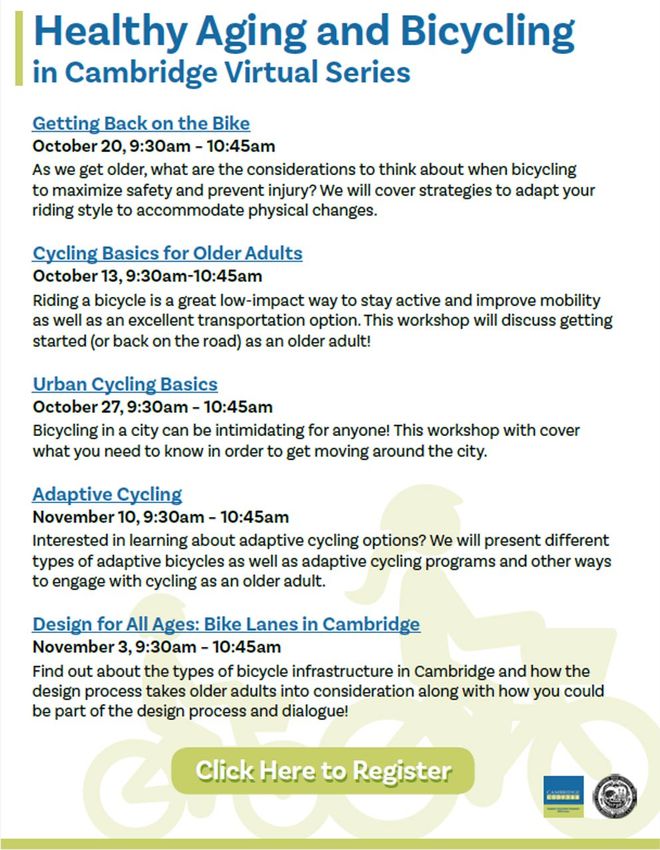
TECHNICAL REPORT DOCUMENTATION PAGE
 1. Report No.                                   2. Government Accession No.                     3. Recipient’s Catalog No.
    21-10
 4. Title and Subtitle                                                                           5. Report Date
    Cycling Past 50: A Closer Look into the World of Older Cyclists                                 April 2021
                                                                                                 6. Performing Organization Code

 7. Authors                                                                                      8. Performing Organization Report
    Carol Kachadoorian                                                                              CA-MTI-2112

 9. Performing Organization Name and Address                                                     10. Work Unit No.
    Mineta Transportation Institute
    College of Business                                                                          11. Contract or Grant No.
    San José State University                                                                        69A3551747127
    San José, CA 95192-0219
 12. Sponsoring Agency Name and Address                                                          13. Type of Report and Period Covered
    U.S. Department of Transportation                                                                Final Report
    Office of the Assistant Secretary for Research and Technology
    University Transportation Centers Program                                                    14. Sponsoring Agency Code
    1200 New Jersey Avenue, SE
    Washington, DC 20590

 15. Supplemental Notes
     DOI: 10.31979/mti.2021.2112

 16. Abstract
     This document reports on 2,300 responses to a nationwide survey of older adults who cycle. The survey, open from February
     through September 2020, includes questions about a rider’s cycling history, current cycling habits, and falls. It includes a visual
     preference survey of various cycling facilities and an online journaling option for two rides subsequent to completing the survey
     (results of the online journals will be available in the summer 2021). Responses reflect the impact of COVID-19 on older adults’
     cycling habits, the impact of aging on ability and agility, the impact of the built environment, types of bicycles, and opportunities to
     cycle with others. Responses were analyzed by gender and age. Questions such as cycling frequency and falls were compared
     to a modified version of Geller’s four types of cyclists. Key take-aways include: Many older adults will need to adapt to their
     changing cycling abilities with a different bicycle, a different expectation about their cycling experience, and local programs to
     encourage sustained cycling. A fair number of respondents learned to cycle as an adult which suggests that local programs can
     also encourage older adults to learn to ride and how to select a bicycle. Lower cycling rates may result from not having a bikeable
     or proper-fitting bicycle, or the money to fix or purchase a bike. Questions posed for further consideration include: Can education
     and outreach help reduce near misses? Can planning and engineering help reduce near misses, especially in areas where more
     older adults cycle? How can falls due to poor infrastructure or maintenance or the actions of others be reduced?

 17. Key Words                                   18. Distribution Statement
     Bicycling, older adults, surveys                No restrictions. This document is available to the public through
                                                     The National Technical Information Service, Springfield, VA 22161

 19. Security Classif. (of this report)          20. Security Classif. (of this page)            21. No. of Pages        22. Price
     Unclassified                                    Unclassified                                    85

Form DOT F 1700.7 (8-72)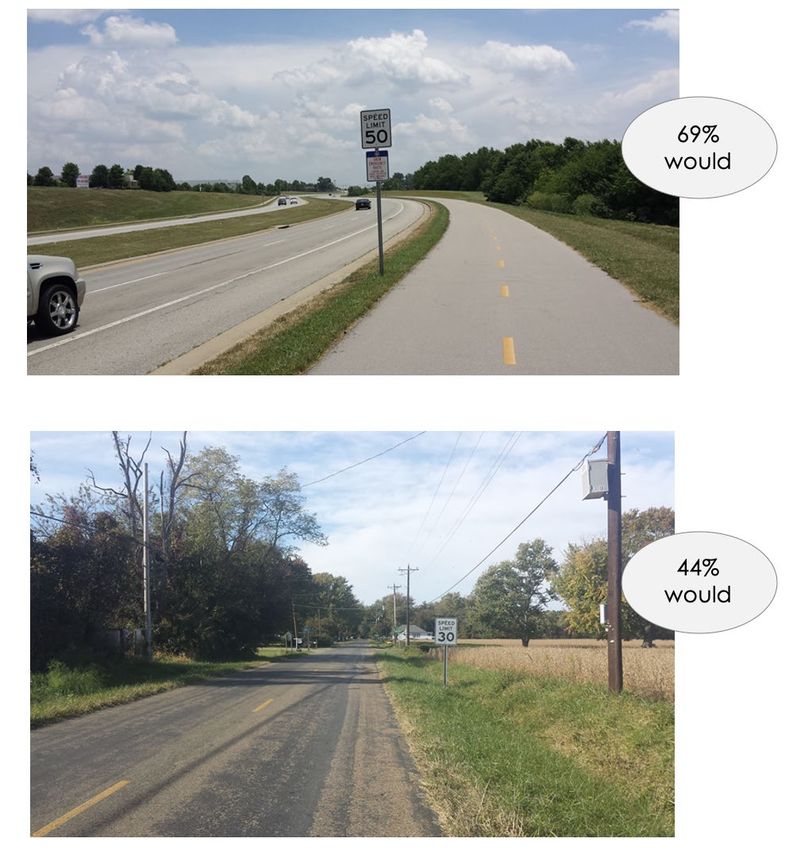
Copyright © 2021
by Mineta Transportation Institute
        All rights reserved

   DOI: 10.31979/mti.2021.2112

     Mineta Transportation Institute
          College of Business
       San José State University
      San José, CA 95192-0219

           Tel: (408) 924-7560
          Fax: (408) 924-7565
    Email: mineta-institute@sjsu.edu

           transweb.sjsu.edu

                                       042021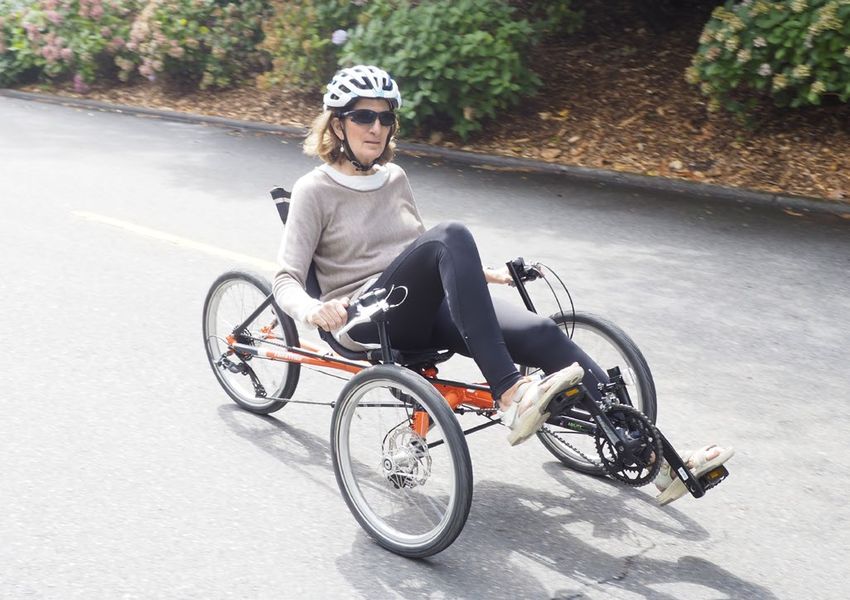
iv

                              ACKNOWLEDGMENTS
The author would like to thank everyone who responded to the survey; Danielle Arigoni and
Melissa Stanton from AARP’s Livable Communities program for distributing the survey;
Christine Lee of Cal Media Consulting for report layout assistance; Tony Hull of Civil
Streets and Kristin Gladwin from Florida State University for their review and guidance;
and MTI staff, including Executive Director Karen Philbrick, PhD, Deputy Executive Director
Hilary Nixon, PhD, Graphic Designer Alverina Eka Weinardy, and Communications and
Operations Manager Irma Garcia.

Cover image source (top): https://bicycledutch.wordpress.com/2013/10/31/elderly-peo-
ple-on-a-cycle-tour/

M i neta Transp o rta tio n Institute                                           Project 2112
                                                                                March 2021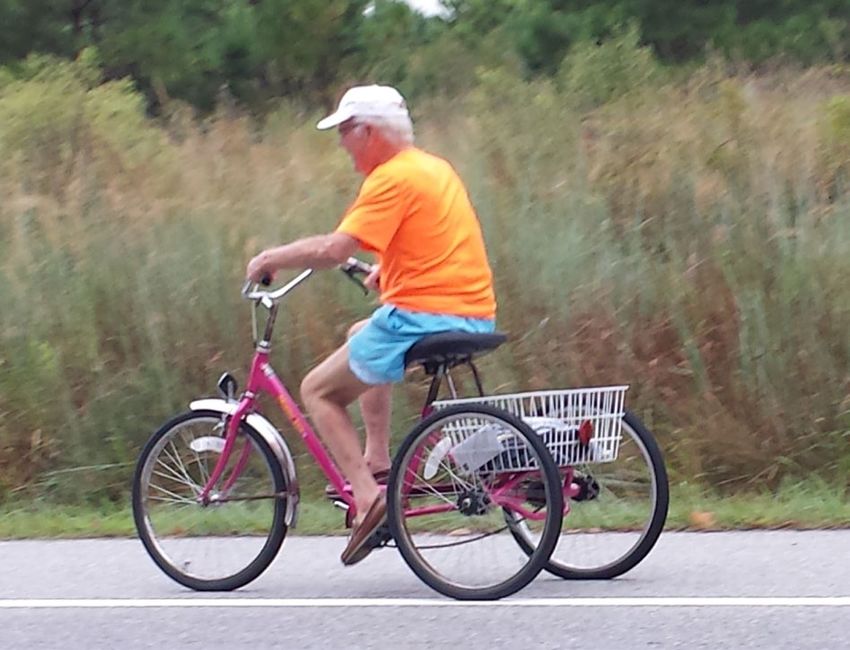
v

                              TABLE OF CONTENTS

   I. Characteristics of Survey Respondents                      2
     Overview                                                   2
     Gender, Age, Income, and Ethnicity                         2
     Learned to Cycle                                           5

  II. Cycling Habits & Preferences                               6
     Cycling Frequency                                          6
     Type of Cyclist                                         10
     Changes in Cycling                                      13
     Factors Affecting Cycling                               16
     Age and Cycling Habits                                  19
     eBikes and Trikes                                       21
     Visual Preference Survey                                27

 III. Safety: Near Misses and Falls                           31
     Near Misses                                             31
     Falls                                                   38

Excerpt from AARP Article                                    53
     How Local Leaders Can Support Safe Bicycling            53
     How Individuals Can Support Safe Cycling                54

Appendix A - Cycling Survey                                  56

Appendix B - Cambridge, MA Flyers                            64

Appendix C - Visual Survey                                   66

Appendix D - Detailed Charts of Falls                        74

Appendix E – Resources                                       82
     Cycling and Older Adults                                82
     Cycling and Gender                                      83
     Cycling and Safety                                      83
     Cycling Types and Behavior                              83
     e-Bikes and Trikes                                      84
     Physical Activity and Wellness                          84

About the Author                                             85

M i neta Transp o rta tio n Institute                Project 2112
                                                     March 2021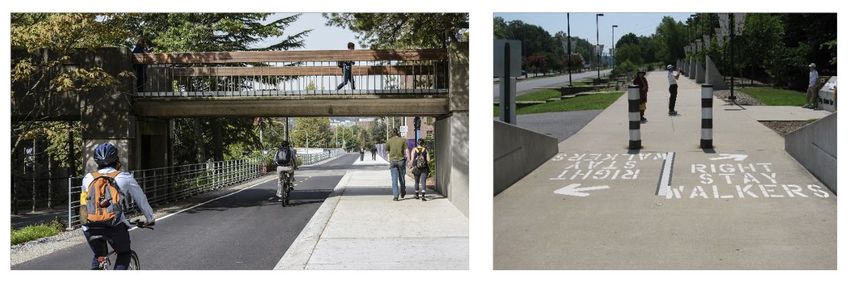
vi

                                 LIST OF FIGURES
 1. Map of Survey Responses                                                  2

 2. Responses by Gender                                                      3

 3. Percent Respondents by Age and Gender                                    3

 4. Percent Responses by Household Income                                    4

 5. Percent Respondents by Ethnicity                                         4

 6. When Did You Learn to Cycle? by Age Group                                5

 7. Do You Cycle Regularly? Total by Gender                                  6

 8. Do You Cycle Regularly? Totals by Age Group                              7

 9. Do You Cycle Regularly? Women by Age Group                               7

10. Do You Cycle Regularly? Men by Age Group                                 7

11. Frequency of Cycling for Cyclists Who Cycle Regularly                    8

12. Frequency of Cycling for Women Who Cycle Regularly                       8

13. Frequency of Cycling for Men Who Cycle Regularly                         9

14. Sampling of Reasons to Cycle, Non-Regular Cyclists, N=149            10

15. Typical Distribution Among Four Types of Cyclists                    11

16. 50+ Cyclist Survey Type of Cyclist Responses                         12

17. Type of Cyclist by Gender                                            12

18. Type of Cyclist Compared to if Cycle Regularly                       13

19. Photo from Survey Respondent Completing Online Journal               13

20. Cycling More in Past Year, Women, Men, Total N=1521                  14

21. Why More Cycling in Past Year, Age Group, N=1533                     14

22. Why Cycling Less in Past Year, N=554                                 15

23. Specific COVID-19 Reasons for Cycling Less, N=70                     16

M i neta Transp o rta tio n Institute                            Project 2112
                                                                 March 2021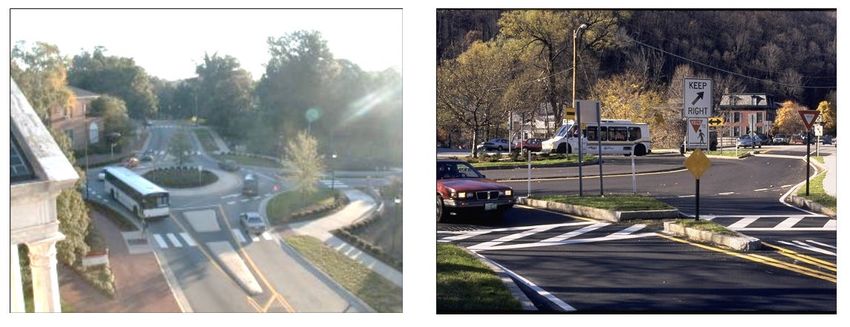
vii

24. What Affects Where You Ride? Women, Men, Total N=13,413                          17

25. What Affects Where You Ride? Age Group, N=10,959                                 18

26. Older Cyclists Value Things such as Benches, Pleasant Vistas, and
      Someone to Ride with                                                           18

27. Reasons Would Stop Cycling, Women, Men, N=3857                                   19

28. Reasons I Would Stop Cycling, Age Group, Total N=3380                            20

29. Parisian Cyclists During COVID-19 Restrictions                                   20

30. Do You Own an eBike? by Age Group                                                21

31. Do You Own an eBike? by Gender                                                   21

32. What Motivated You to Buy an eBike? Women, Men, Total, N=406                     22

33. What Motivated You to Buy an eBike? Age Group, N=366                             23

34. Expected Reason for Future eBike Purchase, Women, Men, N=2620                    24

35. Expected Reason for Future eBike Purchase, Responses within Each Age
      Group                                                                          25

36. Anticipated Reason to Purchase a Trike N=2692                                    26

37. Standard Adult Trike with Basket (left); Recumbent Trike with Two Front
      Wheels (right)                                                                 26

38. Image of Visual Preference Survey from 50+ Cycling Survey                        28

39. Along the Roadway Example Photos from Visual Preference Survey                   29

40. Across the Roadway Example Photos from Visual Preference Survey                  30

41. Photo Provided by Survey Respondents of Neighborhood Street to
      Include in Next Visual Preference Survey                                       30

42. Near Miss Rates by Mode                                                          32

43. Reported Near Misses, Gender and Age, N=2280                                     33

44. Survey Responses, All Questions, Gender and Age N=2297                           33

45. Near Miss Rates by Mode and Age                                                  34

M i neta Transp o rta tio n Institute                                         Project 2112
                                                                              March 2021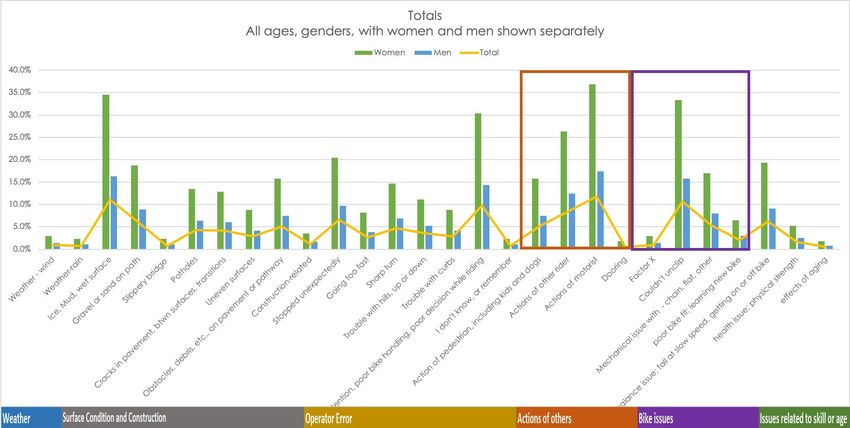
viii

46. Near Misses with Other Cyclists, Gender, Age Group                            34

47. Near Misses with Scooters, Gender, Age Group                                  34

48. Near Misses with Walkers, Gender, Age Group                                   35

49. Near Misses with Joggers, Gender, Age Group                                   35

50. Near Misses with Motorists, Gender, Age Group                                 35

51. How Do eScooters Affect Older Adults?                                         37

52. Examples of Separate Pathways for Cyclists and Pedestrians                    38

53. Percent Reporting Fall, Gender, N=2223                                        39

54. Percent Reporting Fall, by Total, Gender and Age Group; by Age Group
      and Total Survey Responses                                                  39

55. Percent Reporting Fall, by Gender and Age Group                               39

56. Fall and No Fall, Women, Type of Cyclist, Women N=824                         46

57. Fall and No Fall, Men, Type of Cyclist, Men N=1381                            46

58. Women Fall Rates, Age Group and Type of Cyclist                               47

59. Men Fall Rates, Age Group and Type of Cyclist                                 47

60. Cyclists Who Cycling 3 or More Times a Week, Age Group                        48

61. Fall Rates for Those Cycling 3 or More Times per Week, Age Group              48

62. Comparison of Fall Rates and eBike Ownership, N=2251                          49

63. Comparison of Fall Rates for eBike Owners, Women N=194, Men N=448             49

64. Comparison of Fall Rates, eBike Owners to All Cyclists, Age Group             50

65. Driveway Gravel Impacts Surface Quality for Cyclists                          51

66. Bike Lane Widens and Narrows, with On-Again/Off-Again Buffer                  52

M i neta Transp o rta tio n Institute                                      Project 2112
                                                                           March 2021
ix
LIST OF TABLES
1. Grouping of Factors Drawn from Fall Descriptions 41
2. Differences in Fall Factors between Women and Men 43
3. Unable to Unclip Factor by Age Group 43
4. Sample Fall Descriptions by Factor Group 43
5. Noticeable Differences in Fall Rates and Type of Cyclist 47
M i neta Transp o rta tio n Institute Project 2112
March 20211
Cycling is a powerful and
fulfilling experience
I used to ride a bike when I was teenager now that I am
old and alone, I wish to ride again.
I used to cycle regularly (2 or 3 times a week) but my
‘riding buddy’ moved away & my motivation left with her!
Five years ago, we moved to a large city from a small
city where I regularly cycled to work and to do errands. Daily
cycling does not feel safe in my current city though I live
close enough to work to cycle easily. Just got a new old bike
so am cautiously sticking a toe back into cycling but will
probably only be on our city’s protected bikeways or around
my neighborhood. Also, wind is an ever-present barrier to
cycling in OK, if not for the sheer force of it, for the allergens
it stirs up.
M i neta Transp o rta tio n Institute Project 2112
March 20212
I. CHARACTERISTICS OF SURVEY RESPONDENTS
OVERVIEW
At least two responses from each U.S. state except Mississippi (plus some from Canada),
as shown in the map below.
Results in this Databook are for just under 2,300 separate responses. This number does
not include duplicate responses. Further, results by question or comparison of questions
include those responding. For example, percentages showing how frequently respondents
cycle are based on those who answered the question, not all who responded to the survey.
Figure 1. Map of Survey Responses
GENDER, AGE, INCOME, AND ETHNICITY
Figure 2 shows responses by gender, including those who did not provide a gender. The
largest group responding were men, with just over 60%. Figure 3 shows the response rate
by age group drops off at the 71–75 age group, however, 16.3% of responses are from
those 71+.
M i neta Transp o rta tio n Institute Project 2112
March 2021Characteristics of Survey Respondents 3
Figure 2. Responses by Gender
Figure 3. Percent Respondents by Age and Gender
As shown in Figures 4 and 5, respondents were primarily white and of higher household
income. This is a recognized weakness of the survey. AARP’s involvement in promoting
the survey in 2020 increased the number of other ethnicities. However, there is a strong
need to expand the future surveys to specifically target underrepresented populations of
all ethnicities and household income, so survey results reflect national demographics.
M i neta Transp o rta tio n Institute Project 2112
March 2021Characteristics of Survey Respondents 4
Figure 4. Percent Responses by Household Income
Figure 5. Percent Respondents by Ethnicity
M i neta Transp o rta tio n Institute Project 2112
March 2021Characteristics of Survey Respondents 5
LEARNED TO CYCLE
While the largest percent of respondents for each age group learned to cycle as a child,
learning to ride as an adult, including after age 50 was not uncommon, as shown in Figure 6.
Figure 6. When Did You Learn to Cycle? by Age Group
Take-away. Non-cycling adults can and do learn to ride. Some communities offer
programs to encourage older adults to learn to ride, including options for a good-fitting
bicycle. These programs can be developed by a local health or recreation department, the
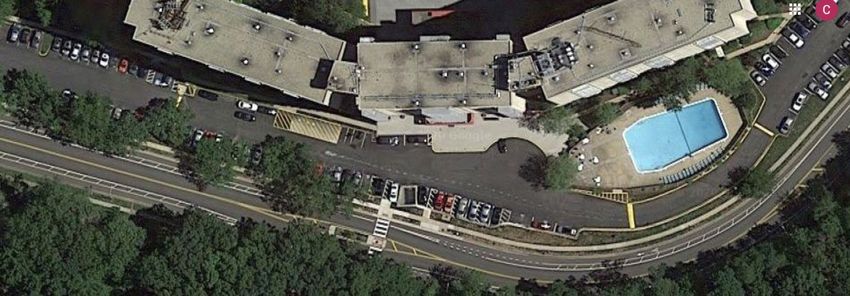
local area agency on aging, or by a local bicycle shop. For example, Cambridge, MA is
developing a multi-part program for older adult to learn or re-learn to cycle, and to enhance
their cycling agility. While the pandemic has shifted the original program plan, staff held
a webinar series in the fall 2020, posting the recordings on their YouTube channel. They
followed-up the webinar series with monthly virtual meetups and will launch a virtual
exercise and strength training program in March 2021 to help prepare older adults for
spring riding. The program promotional flyers in Appendix B provides more information.
M i neta Transp o rta tio n Institute Project 2112
March 20216
II. CYCLING HABITS & PREFERENCES
CYCLING FREQUENCY
Respondents answered the question about whether they cycled regularly using their own
definition of the term ‘regularly’ – a type of self-assessment – with a follow-up question to
provide frequency details. Those who responded that they do not cycle regularly answered
a subsequent question on circumstances prompting them to ride.
Regardless of gender or age, most respondents cycle regularly, as shown in Figure 7, with
higher rates of regular cycling for men than women.1
Figure 7. Do You Cycle Regularly? Total by Gender
The rate of regular cycling habits is consistent by age group, however, declines for women
between 76 to 85. See Figures 8, 9 and 10. The low number of responses from women
and men 85+ affects the rate of regular cycling for this gender and age group.
1
It is important to note that this group is mostly comprised of older adults who remain active as
they age, which provides an understanding of how aging influences their cycling behavior and
safety more than what may encourage people as they age to take up cycling.
M i neta Transp o rta tio n Institute Project 2112
March 2021Cycling Habits & Preferences 7
Figure 8. Do You Cycle Regularly? Totals by Age Group
Figure 9. Do You Cycle Regularly? Women by Age Group
Figure 10. Do You Cycle Regularly? Men by Age Group
When regular cyclists were asked about the frequency, many cycle three to five times a
week, which may be comparable to younger, regular cyclists. Overall, the frequency of
weekly cycling increases with age. See Figure 11.
M i neta Transp o rta tio n Institute Project 2112
March 2021Cycling Habits & Preferences 8
Figure 11. Frequency of Cycling for Cyclists Who Cycle Regularly
There are few differences in cycling rates between women and men by age group, as
shown in Figures 12 and 13. Weather was not a strong indicator of cycling frequency for
most age groups, except for 71-75.
Figure 12. Frequency of Cycling for Women Who Cycle Regularly
M i neta Transp o rta tio n Institute Project 2112
March 2021Cycling Habits & Preferences 9
Figure 13. Frequency of Cycling for Men Who Cycle Regularly
Circumstances prompting non-regular cyclists to ride varied, as shown in Figure 14. Some
common reasons include:
• Good weather
• Having a bikeable bike
• The desire for exercise or a different type of exercise
• When there is time or when motivated
• Where errands are bikeable
• Where there are safe places, such as trails and separated facilities
Take-away. Based on the number of reasons related to not having a bikeable bike, it
appears that bicycle shops can be a valuable resource. Bike shops have experienced a
renaissance due to COVID-19, as more people return to cycling. Shops could consider
doing more outreach to let older cyclists know of their COVID-19 safety protocols, allowing
them to offer in-neighborhood pop-up shops to repair bikes and sell new or used bikes.
M i neta Transp o rta tio n Institute Project 2112
March 2021Cycling Habits & Preferences 10
Figure 14. Sampling of Reasons to Cycle, Non-Regular Cyclists, N=149
TYPE OF CYCLIST
This question is based on the four types of cyclists developed by Roger Geller from
Portland, OR.2 The typology, based on a study of 3,000 cyclists in Portland, has been used
to support designing and building cycling facilities that are ‘low stress’, i.e., offer increased
safety and comfort for cyclists. The four types, which include non-cyclists, and typical
percent of people self-identifying in each are defined below and shown in Figure 15:
2
https://www.portlandoregon.gov/transportation/article/264746
M i neta Transp o rta tio n Institute Project 2112
March 2021Cycling Habits & Preferences 11
Strong and Fearless: People willing Interested but Concerned: People
to bicycle with limited or no bicycle- willing to bicycle if high-quality bicycle
specific infrastructure. infrastructure is in place.
Enthused and Confident: People No Way, No How: People unwilling
willing to bicycle if some bicycle- to bicycle even if high-quality bicycle
specific infrastructure is in place. infrastructure is in place.3
Figure 15. Typical Distribution Among Four Types of Cyclists
Towards the end of the 50% Cycling Survey, respondents were asked to select the type
of cyclists with which they associated. Because the 50+ Cycling Survey is for those who
cycle, the survey question replaced the No way, No how type with A mix -- depends on
circumstances type.4 The results differ from the typical Geller percentage distribution in
two significant ways. First, twenty percent (20%) of respondents identified as Enthused
and confident (Geller) cum Casual and somewhat confident (50+ Cycling Survey); and
fifty-five percent (55%) of respondents identified as Enthused and confident (Geller) cum
Experienced and confident (50+ Cycling Survey).5 The new type, A mix – depends on the
circumstances, was selected by 22% of respondents, suggesting that this type may be
needed, as it resonates as accurate for many cyclists. See Figure 16.
3
https://altago.com/understanding-the-four-types-of-cyclists/
4
Type names differed from the Geller type names. Also, a handful of respondents said they do
not cycle, primarily due to health or balance issues, or concerns for safety while cycling.
5
The difference in names may have affected which type respondents chose.
M i neta Transp o rta tio n Institute Project 2112
March 2021Cycling Habits & Preferences 12
Figure 16. 50+ Cyclist Survey Type of Cyclist Responses
As noted in the introduction to this section, Geller’s typology is used to support developing
low stress bicycle networks. The analysis for determining Level of Traffic Stress (LTS)
identifies various conditions that create comfort or discomfort for cyclists.6 Geller’s typology
which typically results in a 57% share of Interested but concerned cyclists, becomes the type
to design for. The distribution of 50+ Cycling Survey respondents varies significantly from
the typical distribution of Geller’s typology; the 55% Experienced and confident should not
suggest that older adults can tolerate higher stress networks. Instead, low stress networks
are needed for older adults, as much as they are needed for all other cyclists.
There are noticeable differences in type of cyclists by gender, as shown in Figure 17.
Women were more evenly distributed among the four types, with the lowest identification
with Interested but Concerned, while nearly 70% of men identified as Experienced and
Confident and very few as Interested but Concerned.
Figure 17. Type of Cyclist by Gender
6
https://transweb.sjsu.edu/research/Low-Stress-Bicycling-and-Network-Connectivity
M i neta Transp o rta tio n Institute Project 2112
March 2021Cycling Habits & Preferences 13
Not surprisingly, those who said they cycle regularly were more likely to consider themselves
as Experienced and confident riders, while those who do not cycle regularly were more
likely to consider themselves as Casual and Somewhat Confident, as shown in Figure
18. Regardless of whether they cycle regularly, cyclists chose the Mix – Depends on the
situation type second most often.
Figure 18. Type of Cyclist Compared to if Cycle Regularly
CHANGES IN CYCLING
Changes in the frequency and
length of cycling from year-to-
year occurs because of many
factors. The rate of change
in 2020 reflects the usual
factors, however, the most
significant factor was COVID-19.
Respondents both cycled more
often or reduced the amount of
cycling because of COVID-19.
Cycling more. Cycling for
exercise during COVID-19
restrictions was the most
common response for those Figure 19. Photo from Survey Respondent
whose cycling increased in the Completing Online Journal
past year, as shown in Figure
20. It is difficult to speculate if the cycling increases will continue, so focusing on the
other reasons for increased cycling may be more useful. Importantly, having someone
to cycle with and good places to cycle rated second in affecting increased cycling, as
well as shifting to cycling from a different sport. Responses by age group (see Figure 21)
shown that maintaining exercise during the pandemic was a strong motivator for most age
M i neta Transp o rta tio n Institute Project 2112
March 2021Cycling Habits & Preferences 14
groups. In addition, those between 50 and 60 seemed to use the COVID-19 time to train
for a long-distance ride. Acquiring an eBike was less of a factor, but this could be due to
the relatively low rate of eBike ownership among respondents.
Figure 20. Cycling More in Past Year, Women, Men, Total N=1521
Figure 21. Why More Cycling in Past Year, Age Group, N=1533
M i neta Transp o rta tio n Institute Project 2112
March 2021Cycling Habits & Preferences 15
Cycling less. Those cycling less did so for fewer days and/or for shorter distances. As
shown in Figure 22, the most frequently noted reason for cycling less was safety concerns.
When considered alongside responses to other questions such as near misses and falls,
safety concerns may be related to actions of others as well as a lower level of confidence
in their own cycling agility. Changes in home or work responsibilities and health issues
were also cited as reasons for cycling less. COVID-19-related reasons for less cycling
was not as strong a reason for this group, however some reasons are based on changes
to daily schedules due to the pandemic. See Figure 23 for a breakout of specific COVID-
19-related reasons for cycling less provided by 70 respondents.
Figure 22. Why Cycling Less in Past Year, N=554
M i neta Transp o rta tio n Institute Project 2112
March 2021Cycling Habits & Preferences 16
Figure 23. Specific COVID-19 Reasons for Cycling Less, N=70
FACTORS AFFECTING CYCLING
Figure 24 shows responses to the question about factors affecting where older adults ride,
such as a mix of good infrastructure, end of- and during-trip facilities, and destinations.
Group rides were more important for men than women. There do not appear to be age-
based differences in factors, however, as shown in Figure 25.
M i neta Transp o rta tio n Institute Project 2112
March 2021Cycling Habits & Preferences 17
Figure 24. What Affects Where You Ride? Women, Men, Total N=13,413
M i neta Transp o rta tio n Institute Project 2112
March 2021Cycling Habits & Preferences 18
Figure 25. What Affects Where You Ride? Age Group, N=10,959 (multiple answers
allowed)
Figure 26. Older Cyclists Value Things such as Benches, Pleasant Vistas, and
Someone to Ride with
M i neta Transp o rta tio n Institute Project 2112
March 2021Cycling Habits & Preferences 19
AGE AND CYCLING HABITS
The amount of cycling typically changes at different times in a person’s life. While a portion
of respondents intend to continue cycling as long as possible, some anticipate a time
when they would stop cycling. Top reasons for discontinuing cycling, regardless of gender
or age group, are a physical condition or a move to a place with no safe places to ride.
Many older cyclists responded that they could not envision a time or circumstances that
they would stop riding – in fact, this response was the third highest for all ages, especailly
among men. See Figures 27. The ranking of these reasons were similar by age group, as
shown in Figure 28.
Figure 27. Reasons Would Stop Cycling, Women, Men, N=3857 (multiple answers
allowed)
M i neta Transp o rta tio n Institute Project 2112
March 2021Cycling Habits & Preferences 20
Figure 28. Reasons I Would Stop Cycling, Age Group, Total N=3380 (multiple
answers allowed)
Take-away. Older adults’ desire to
continue riding means that planners
and designers need to include this
demographic in network planning,
design, and maintenance. Planning for
older adult communities should also be
design to support cycling both within and
with connections to the adjacent bicycle
network. The worldwide COVID-19
pandemic has increased cycling rates
in many countries and cities, which may Figure 29. Parisian Cyclists During
continue as the pandemic fades. Some COVID-19 Restrictions
U.S. cities are taking the advice of Paris’s Source: https://www.bbc.com/news/world-
mayor who in a piece published by The europe-52483684
Economist speaks to trusting Parisians for
teling their government what they want:
We trusted Parisians by opening new cycle lanes, and with their bikes they are bringing
this transformation to life.7
7
“The City of fight,” The World in 2021, The Economist, pg. 94.
M i neta Transp o rta tio n Institute Project 2112
March 2021Cycling Habits & Preferences 21
EBIKES AND TRIKES
eBikes
eBikes have grown in popularity for people of all ages. AARP encourages older adults
to remain physically active, including cycling. A 2018 AARP article by Jay Walljasper
begins with this assessment: By providing a boost to get up hills or give older bones and
weary muscles a bit of a break, electric-assist bicycles make cycling a practical option
for getting around.8
The 50+ Cycling Survey showed an eBike ownership rate of 8.2%, with the greatest
ownership rate among those 76 and older. See Figure 30. Slightly more men than women
own an eBike. See Figure 31.
Figure 30. Do You Own an eBike? by Age Group
Figure 31. Do You Own an eBike? by Gender
8
https://www.aarp.org/livable-communities/getting-around/info-2018/e-bikes-energize-bicycling.
html
M i neta Transp o rta tio n Institute Project 2112
March 2021Cycling Habits & Preferences 22
Regardless of gender or age group, survey respondents reported “to make it easier to ride
up hills” as the most popular reason for purchasing an eBike. The next two most common
reasons were to satisfy their curiosity about eBikes, to make it more comfortable to ride in
hot weather, and to ride farther. See Figure 32.
Figure 32. What Motivated You to Buy an eBike? Women, Men, Total, N=406
(multiple answers)
Figure 33 shows reasons for owning an eBike by age group. Hill-riding was especially
important for the 61-65 age group, as was a desire to cycle farther and to ride with stronger
fellow cyclists for those over 70.
M i neta Transp o rta tio n Institute Project 2112
March 2021Cycling Habits & Preferences 23
Figure 33. What Motivated You to Buy an eBike? Age Group, N=366 (multiple
answers)
The majority of those who do not own an eBike either do not anticipate purchasing one or
will do so when they experience a physical limitation to riding a regular pedal bicycle. See
Figure 34. While questions that ask what someone will do in the future are hypothetical,
answers to this question convey the strength of conviction to remaining an able cyclist.
The sense is that purchasing an eBike denotes an unwelcome change in physical ability.
M i neta Transp o rta tio n Institute Project 2112
March 2021Cycling Habits & Preferences 24
Figure 34. Expected Reason for Future eBike Purchase, Women, Men, N=2620
(multiple answers)
Figure 35 shows how answers differ somewhat by age group, with the reason, “When I
have a physical limitation” as the most common response for all but those 76 and older.
This age group was also uninterested in getting an eBike just to have one. Instead, ease
of riding and ability to ride with others were highly rated reasons.
M i neta Transp o rta tio n Institute Project 2112
March 2021Cycling Habits & Preferences 25
Figure 35. Expected Reason for Future eBike Purchase, Responses within Each
Age Group (multiple answers)
Take-away. Ebikes will continue to grow in popularity, especially as more models are
introduced in the market. It is likely that some older cyclists will resist purchasing one until
they feel it is necessary, such as the desire to keep cycling. When advising older adults
on what bicycle to purchase, it is more useful to discuss the full range of options, such
as number of wheels, sitting position, and propelling choices, rather than to immediately
recommend an eBike. For example, the analysis of Falls in this Databook includes
respondent-provided information on balance issues, which is important to consider when
selecting a bicycle.
M i neta Transp o rta tio n Institute Project 2112
March 2021Cycling Habits & Preferences 26
Trikes
Far fewer respondents own a trike – just 2.7%. More men than women own them. The
majority are recumbent trikes; few are e-assist. Reasons for purchasing a trike range from
wanting more stability and ease of getting on and off the bike. Figure 36 shows anticipated
reasons for a future trike purchase, including when respondents have a physical limitation
or health issue. Some will get one when they can afford it.
Figure 36. Anticipated Reason to Purchase a Trike N=2692 (multiple answers)
Affordability affects an older cyclist’s ability to purchase both an eBike (10.7%) or trike
(2%). While this Databook does not cross-reference these affordability answers with
household income, affordability does affect the type of bicycle people own. A bicycle that
does not fit the rider or a rider’s type of cycling may reduce the amount of riding if a proper
fitting bicycle is not affordable.
Figure 37. Standard Adult Trike with Basket (left); Recumbent Trike with Two Front
Wheels (right)
M i neta Transp o rta tio n Institute Project 2112
March 2021Cycling Habits & Preferences 27
An older cyclist’s desired cycling experience can change as they age. For example,
12 responses conveyed the sentiment, “I’m not in a hurry and having this bike helps me
be more leisurely.” Conversely, some cyclists may ride with others to help maintain their
cycling fitness. One group of 70+ cyclists asked how they compared with others taking the
survey. As shown in the text box below, the answer is keeping them cycling and talking.
I have looked at your website and participated in your survey. I am a 70-year-old
male and a fairly active cyclist (~4500 miles /year). I ride with a group of men
all about the same age and we constantly debate a question that I hope you can
help us with: Among 70-year-old men and older, who own a road bike and
primarily do road cycling, what would be the average mileage for 1-year and
the average speed?
Based on data provided from respondents in early 2020 (speed and type of two-
wheel normal pedal bike information in NOT part of the survey), these cyclists
concluded,
In general, I think it appears that at our age and riding > 40 miles/week (2080 miles/
year) puts us in the top 10% of cyclist distance regardless of “purpose of activity
i.e., social, exercise, or competitive.”
You should know the 4 of us argue about this frequently which is excellent
fodder/discussion for our longer rides and a source of great amusement.
VISUAL PREFERENCE SURVEY
This portion of the 50+ Cycling Survey asked respondents to identify which bicycling
facilities and conditions they would feel comfortable using. Photos of a variety of facilities
and conditions were divided into two groups: Along the Roadway and Across the Roadway.
Respondents clicked on photos of facilities they would use based on the conditions shown.
See Figure 38.
This report shows the results of the Visual Preference Survey from high to low preference.
The Visual Preference Survey was optional, with about 75% of respondents completing it.
This portion of the survey provides direct cyclist information for specific conditions, similarly
to portions of the Online Journal that some respondents completed.9
9
An analysis of the Online Journals will be available in early Spring 2021.
M i neta Transp o rta tio n Institute Project 2112
March 2021Cycling Habits & Preferences 28
Figure 38. Image of Visual Preference Survey from 50+ Cycling Survey
Some facilities that are generally considered desirable for all types of cyclists were not
selected as ‘would feel comfortable using.’ Image bias may have affected respondents’
reactions to the photos. For example, as shown in Figure 39, only 69% of respondents said
they would feel comfortable using a sidepath next to a major arterial. The 50MPH speed
limit sign may have affected this rate, as it could convey undesirable conditions such as a
high noise level and stress from traveling close to fast-moving vehicles. Conversely, only
44% of respondents would use a road in a rural setting with no visible traffic and a posted
speed limit of 30MPH.
M i neta Transp o rta tio n Institute Project 2112
March 2021Cycling Habits & Preferences 29
Figure 39. Along the Roadway Example Photos from Visual Preference Survey
Similarly, photos of roundabouts shown in Figure 40 received different reactions, perhaps
because of the different context or perspective of each. The image of the left is an aerial of
the entire roundabout, while the image on the right provides a user-level view of one piece
of the roundabout. Respondents may have interpreted these two Across the Roadway
examples as different facilities, even though they both were roundabouts with a bus and
vehicle in each image.
M i neta Transp o rta tio n Institute Project 2112
March 2021Cycling Habits & Preferences 30
The visual preference survey will be revised for the 2021 survey, including different
photos and a way to determine why respondents would or would not use the facility. One
respondent asked that the survey include cycling conditions more familiar to him, such as
the neighborhood street shown in the photograph to the right that he provided.
Figure 40. Across the Roadway Example Photos from Visual Preference Survey
See Appendix C for the full Visual
Preference Survey results.
Figure 41. Photo Provided by Survey
Respondents of Neighborhood Street
to Include in Next Visual Preference
Survey
M i neta Transp o rta tio n Institute Project 2112
March 202131
III. SAFETY: NEAR MISSES AND FALLS
The survey includes questions about Near Misses and Falls. The questions are intended
to show any changes in cycling agility and balance as people age, as well as how
adequately facilities can accommodate more users and those of different modes. The
analysis shows respondents by gender, by age by gender, and with whom the near
misses occurred. The table below provides a hyperlinked sub-table of contents for the
analysis of these two questions.
Near Misses Falls Fall Comparisons with Other
Questions
Near Misses by Mode, Typical Falling Incidents Fall Rates and Type of Cyclist
Gender, and Age Group
Are Fewer Near Misses Unpacking Fall Descriptions Fall Rates and Frequency of
Possible? Cycling
Can Education and Outreach Results and Typical Fall Rates for Cyclists with
Help? Combination of Factors eBikes
Can Planning and Engineering Noticeable Differences Are Fewer Falls Possible?
Help? between Genders
Noticeable Differences by Age
Sampling of Fall Descriptions
NEAR MISSES
Just over 62% of those responding to the survey reported at least one near miss with
another cyclist, scooter, walker, jogger, or motorist. This section parses response data
based on gender, age group, and mode. Speculative narrative attempts to understand the
responses provided and identify potential mitigations.10
The top two modes were motorists at 50% and other cyclists at 21%. See Figure 42. The
survey did not ask for details on the near miss.11 Near misses with scooters were the lowest
reported, perhaps due to an increasing understanding between cyclists and scooterists
about each other, i.e. they are cross-over modes traveling at comparable speed.
10
NOTE: Some of the falls reported cite a near miss as causing the fall. Because of the
connection between the two, these two questions for the 2021 survey will be combined.
11
Because some of this information was provided in descriptions of falls, these two questions
will be consolidated for the 2021 survey.
M i neta Transp o rta tio n Institute Project 2112
March 2021Safety: Near Misses and Falls 32
Figure 42. Near Miss Rates by Mode
Both genders and all age groups reported near misses in rates similar to the overall survey
response rates. In other words, a particular age group or gender was not more or less
likely to report a near miss. See Figures 43 and 44 to compare response rates.
M i neta Transp o rta tio n Institute Project 2112
March 2021Safety: Near Misses and Falls 33
Figure 43. Reported Near Misses, Gender and Age, N=2280
Figure 44. Survey Responses, All Questions, Gender and Age N=2297
However, there are differences among age groups with respect to the near miss mode,
as shown in Figure 45. The rate of near misses with motorists decreases with age, while
the rate of near misses with other cyclists increases noticeably beginning with the 76-
80 age group. Near miss rates with joggers and scooters was relatively level for all age
groups. The low rate of near misses with scooters may be a result of the presence of fewer
scooters and may increase in subsequent surveys as scooter use increases.
M i neta Transp o rta tio n Institute Project 2112
March 2021Safety: Near Misses and Falls 34
Figure 45. Near Miss Rates by Mode and Age (total responses by age compared to
number near misses)
Near Misses by Mode, Gender, and Age Group
Individual charts of near misses by mode, age and gender shown below, Figures 46
through 50.
Other Cyclists
27%
Figure 46. Near Misses with Other Cyclists, Gender, Age Group
Scooters
4.8%
Figure 47. Near Misses with Scooters, Gender, Age Group
M i neta Transp o rta tio n Institute Project 2112
March 2021Safety: Near Misses and Falls 35
Walkers
16.2%
Figure 48. Near Misses with Walkers, Gender, Age Group
Joggers
8.2%
Figure 49. Near Misses with Joggers, Gender, Age Group
Motorists
50.2%
Figure 50. Near Misses with Motorists, Gender, Age Group
Question to Consider: Are Fewer Near Misses Possible?
Determining why near misses occur can help identify mitigations. This section speculates
about potential ways to reduce near misses through education and outreach, and with
planning and design strategies. It is presented here to invite others to provide their
experience on effective strategies.
M i neta Transp o rta tio n Institute Project 2112
March 2021Safety: Near Misses and Falls 36
Some initial observations from the 50+ Cycling Survey are:
• While most near misses do not appear to make many older adults reluctant to cycle,
the frequency of those with motorists may.
• The general increase in cycling, with more eBikes and eScooters sharing space
designed for cyclists can create stress and uncertainty for older cyclists. See the
text box labeled Figure 51 for information on a conversation on this topic convened
by the Safe Routes Partnership.
Question to Consider: Can Education and Outreach Help?
Providing information about multi-modal transportation systems and how people can travel
successfully within them may reduce some near misses. This strategy requires people to
adopt strong habits of situational awareness, i.e., be aware of others traveling where they
are, and a desire or willingness of people to change their behavior. It relies on effective
communication and opportunities for discussion, along with established safety campaigns.
For example, hosting community conversations among people with varying primary travel
modes is one tactic. Others include ad campaigns showing people of all ages and abilities
walking, bicycling, scootering, etc.; and education and skill-building programs such as the
one Cambridge, MA is developing (see Appendix B).
M i neta Transp o rta tio n Institute Project 2112
March 2021Safety: Near Misses and Falls 37
In the winter 2020, the Safe Routes Partnership brought together diverse
stakeholders to better understand the potential opportunities and challenges
facing older adults due to the advent of shared eScooters. The group explored
how scooters affect walking, cycling, physical activity, and other public heal goals,
including safe, convenient mobility for people of all ages, and began to identify
potential policy needs and implications. The effort is related to larger policy
agendas through collaborations such as with the American Heart Association and
Robert Wood Johnson Foundations’ Voices for Health Kids initiative.
The group’s work was paused due to the pandemic, but a final set of findings and
recommendations will be issued in 2021. The discussion included several items
with respect to the impact of eScooters on older adults and their mobility needs:
• It is not clear to what extent older adults want to ride eScooters, but in some
cities, there is organized opposition to them with participation by older adults.
• There are a variety of devices entering the eScooter market, including those
with seats and larger devices that provide more stability, which may be attractive
to some older adults
• While cycling or walking, older adults may experience a ‘startle effect’ when
someone on an eScooter passes them, causing some instability for older adults.
• Among people with disabilities, the sidewalk clutter increased by eScooter use
presents barriers to access curb ramps and present tripping hazards for people
with vision impairment.
• Increased education and outreach would benefit eScooters users and those
who travel with them within cycling facilities.
Figure 51. How Do eScooters Affect Older Adults?
Question to Consider: Can Planning and Engineering Help?
Just over half the near misses were with motorists. While the survey did not ask for details
of the near miss, based on comments in open-ended question, we can conclude that the
near miss occurred while cyclists were riding in the roadway in either an unbuffered bike
lane or in the regular travel lane, through in an intersection, or entering the roadway.
The second and third most frequently occurring near misses were with other cyclists and
walkers. One effective solution is to create separate space for cyclists and walkers or
joggers, like portions of the Burke Gillman Trail in Seattle, WA, or guidance to walkers
provided on the lead-up to the Big Dam Bridge in Little Rock, AR. See Figure 52.
M i neta Transp o rta tio n Institute Project 2112
March 2021Safety: Near Misses and Falls 38
Figure 52. Examples of Separate Pathways for Cyclists and Pedestrians
Source: https://place.la/project/burke-gilman/ (left image)
FALLS
The survey asked respondents if they had fallen or nearly fallen in the past year. Those that
had, were asked to describe the circumstances about the fall. The questions are intended
to show changes in cycling agility and balance as people age, as well as built environment
conditions that may contribute to falls.
As Figure 53 shows, just under 29% of respondents reported a fall. These 641 falls are
comprised of 193 women and 448 men.12 When looking at all survey respondents by
gender, the fall rate for men was 32.4%, compared to the rate for women of 23.0%. This
nearly 10% difference may be explained by women having better risk-adverse attitudes
and behavior, especially with respect to route and facility choice.13
12
Some falls occurred when mountain biking, which respondents noted in the description of the
fall. The 2021 survey will be clearer about its focus on road and trail (Shared Use Path) riding,
rather than mountain biking.
13
https://nacto.org/wp-content/uploads/2012/02/Dill-and-Gliebe-2008.pdf, page 52.
M i neta Transp o rta tio n Institute Project 2112
March 2021Safety: Near Misses and Falls 39
Figure 53. Percent Reporting Fall, Gender, N=2223
When looking at fall rates for women and men compared to all survey respondents, rates
peak at age group 56 to 60, with overall higher rates for men. See Figure 54. However, a
different pattern emerges when looking at those who fell by gender within each age group.
Fall rates are greater for women than men in age groups 50 to 65. This trend reverses at
age 66, with greater fall rates for men. See Figure 55.
Figure 54. Percent Reporting Fall, by Total, Figure 55. Percent Reporting Fall, by
Gender and Age Group; by Gender and Age Group
Age Group and Total Survey
Responses
M i neta Transp o rta tio n Institute Project 2112
March 2021Safety: Near Misses and Falls 40
Typical Falling Incidents
Totals of riders above include those riding on paved and unpaved surfaces, including
mountain biking. Because the 50+ Cycling Survey in 2020 was not intended to include
mountain biking, the description of falls included here does not include mountain biking.14 As
a result, 433 people are included in this analysis. This represents those who provided both
their gender and age group, and who provided a description of a non-mountain-biking fall.15
Unpacking Fall Descriptions
Each fall description by gender and age was reviewed to identify common factors – 27
factors in all – further organized into six groups, as shown in Table 1. The groups are
intended to help identify potential ways to reduce falls, such as through infrastructure
design or maintenance changes, education, and outreach, etc. The results were sorted in
various ways, including by totals, age, and age and gender. See the Appendix D for charts
of falls by gender, age, and factor.
The last section of the report on falls compares fall rates to three other questions: Type of
Cyclist, Frequency of Cycling, eBike Ownership.
14
Many who described a fall while mountain biking stated that it came with mountain biking,
i.e., they expect to fall. One cyclist said, “Regarding mountain biking: I mountain bike and
sometimes falls happen. I still love it. I don’t fall much anymore.”
15
A couple of notes. First, only 3 respondents indicated ‘other’ as gender, so they were not
included in these calculations. Second, responses were a mix of a few words to several
sentences, hence some descriptions only have one factor noted, while others have 2 or 3.
M i neta Transp o rta tio n Institute Project 2112
March 2021Safety: Near Misses and Falls 41
Table 1. Grouping of Factors Drawn from Fall Descriptions
Group Factors
Rationale
Weather • Rain
On-going weather conditions while riding,
• Wind
rather than residual impacts of weather
Surface condition & Construction • Ice, mud, wet surface
Residual impacts of weather and other
• Gravel or sand on surface or pathway
existing conditions which could suggest
maintenance needs; construction logistics • Slippery bridge surface
that impacted riding.
• Potholes
• Cracks in pavement, between surfaces, transitions
• Uneven surface
• Obstacles, debris, etc., on pavement or pathway
• Construction-related
Operator error • Stopped unexpectedly
Actions by cyclists that contributed to the
• Going too fast
fall
• Sharp turn
• Trouble with hills – up or down
• Inattention, poor bike handling, poor decision
while riding
• I don’t know or remember
Actions of others • Action of pedestrian/s, including kids and dogs
Actions by other traveling on the same
• Action of another cyclist
pathway, driveway, intersection, etc., that
contributed to the fall. • Action of motorists
• Dooring
Bike issues • Factor X (unusual circumstance that did not fit
Poorly fitting bicycles or a mechanical into another group)
issue caused or contributing to falls. In
• Could not unclip
many cases, cyclists could not unclip to
avoid a crash due to another precipitating • Mechanical issue such as chain, flat, other
factor.
• Poor bike fit; learning new bike
Issues related to skill or age • Balance issue; fall at slow speed, getting on or
This group of factors are most directly off bike
related to age.
• Health issue; physical strength
• Effects of aging
M i neta Transp o rta tio n Institute Project 2112
March 2021Safety: Near Misses and Falls 42
Results and Typical Combination of Factors
Of the 27 factors, the following four were noted at least 10% of the time as contributing
to the fall:
• Actions of motorists – 12%
• Slippery surface conditions due to ice, mud, or water – 11%
• Cyclist couldn’t unclip – 11%
• Cyclist inattention, including poor decisions – 10%
Responses often included a sequence of factors, such as those shown below. The first
one shows how the actions of a motorists or another cyclist results in a fall when the older
cyclist is a bit inattentive, needs to stop unexpectedly, and unable to unclip.
• Inattention
Action of motorist or another cyclist • Stopped unexpectedly
• Unable to unclip
• Sharp turn
Slippery Road conditions
• Stopped unexpectedly
Actions of motorists • Stopped unexpectedly
Noticeable Difference between Genders
There are several noticeable differences between women and men with respect to factors
attributable to falls. Some studies show that aging does not necessarily affect the postural
balance of women between 65 and 74;16 and that women are more likely than men to
retain postural balance as they age.17 However, survey responses indicate a difference, as
shown in Table 2. Women had higher rates of falls due to stopping unexpectedly, inattention
or poor decisions, the actions of other riders, and various balance issues. Only falls for
men due to the actions of motorists were higher. This is surprising, given a recent study
showing motorists to be more likely to encroach on cycling space for women than men.18
16
https://www.sciencedirect.com/science/article/pii/S1873959812001548
17
https://www.ncbi.nlm.nih.gov/pmc/articles/PMC5955023/
18
https://genderpolicyreport.umn.edu/bicycles-gender-and-risk/
M i neta Transp o rta tio n Institute Project 2112
March 2021You can also read