Dalton Transactions - Royal Society of Chemistry
←
→
Page content transcription
If your browser does not render page correctly, please read the page content below
Volume 49
                                                                                           Number 29
                                                                                           7 August 2020

Dalton
                                                                                           Pages 9903-10280

Transactions
An international journal of inorganic chemistry
rsc.li/dalton

                                 ISSN 1477-9226

                                 PAPER
                                 Artur Kasprzak et al.
                                 Tris(ferrocenylmethidene)sumanene: synthesis,
                                 photophysical properties and applications for efficient
                                 caesium cation recognition in water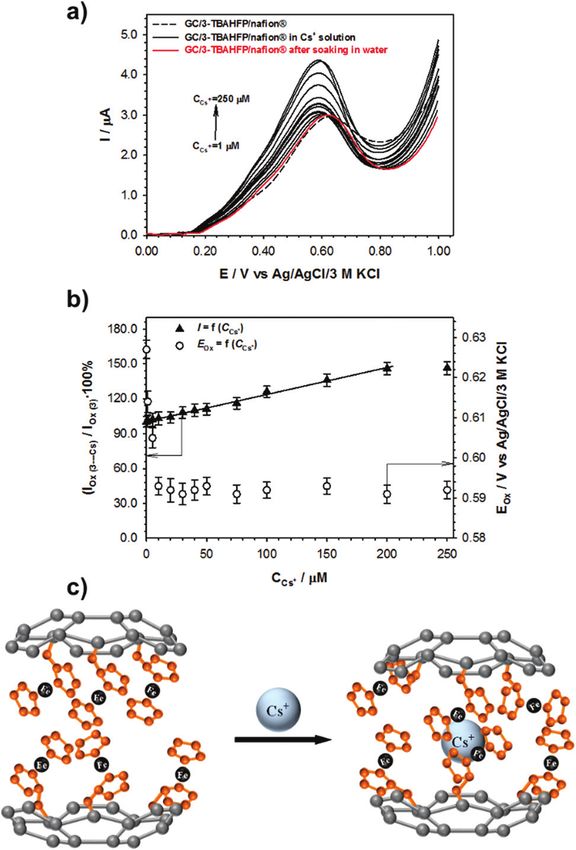
Dalton
Transactions
This article is licensed under a Creative Commons Attribution-NonCommercial 3.0 Unported Licence.
View Article Online
PAPER View Journal | View Issue
Tris(ferrocenylmethidene)sumanene: synthesis,
Cite this: Dalton Trans., 2020, 49,
photophysical properties and applications for
Open Access Article. Published on 15 June 2020. Downloaded on 12/5/2020 9:08:43 AM.
9965 efficient caesium cation recognition in water†
Artur Kasprzak, *a Agata Kowalczyk, b Agata Jagielska, c
Barbara Wagner, c
Anna M. Nowicka b and Hidehiro Sakurai d
Received 24th April 2020, The synthesis of a sumanene derivative bearing three ferrocenyl substituents is presented. This conjugated
Accepted 15th June 2020
compound is solution-processable, shows red-light emission with high fluorescence quantum yield and
DOI: 10.1039/d0dt01506g can be used for the construction of the first buckybowl-based sensor for the selective and effective reco-
rsc.li/dalton gnition of caesium cations (Cs+) in aqueous solution.
Ferrocene (Fc) is a metallocene with various applications.1 Fc design of functional organic materials. The unique properties
is a good candidate for the construction of redox sensors and of sumanene result from the presence of a curvature in its
acts as a reference system in voltammetric measurements.2 Fc- structure giving rise to unusual assembling properties or
bearing systems are chemically inert, electrochemically and dynamic behaviours, e.g., bowl-to-bowl inversion. Recently, we
thermally stable, and dissolve well in a wide range of solvents, have reported the synthesis of various sumanene-tethered fer-
and their redox processes are reversible and single-electron in rocenes7 and the applications of selected conjugates7b for
nature and have a high electron transfer rate. The redox pro- caesium cation (Cs+) recognition in organic solvents. The
perties of Fc originate from the presence of a ferrocene/ferroce- driving force responsible for this recognition was the site-selec-
nium cation (Fc/Fc+) couple. Ferrocene derivatives having an tive cation-π-interaction with the inclusion of sumanene’s
aryl substituent are of great interest for the design of func- concave site.6d,8 Sumanene was found to act as a Cs+ reco-
tional molecules with tuned red-ox properties. For instance, gnition material in its neutral state. It is worth noting that the
the reports deal with the applications of Fc-pyrene3 or Fc-por- detection of Cs+ is of the highest environmental importance.
phyrin4 probes for the electrochemical detection of ions. Significant concentrations of Cs+ were found in nuclear plant
Interestingly, a study on the synthesis of conjugated Fc oligo- waste and in post-disaster areas, especially in the case of the
mers bearing several metallocene units, was also reported.5 nuclear plant accident in Fukushima in 2011.9 Importantly,
Such oligomers exhibited intriguing interactions between red- from the viewpoint of public health and environmental moni-
ox sites. In fact, the electrochemical profile of Fc-bearing toring, special attention should be paid to Cs+ detection in
materials strongly depends on the compound structure, e.g., water.
its symmetry, distance between Fc residues and their elec- Herein, we report the synthesis of tris(ferrocenylmethidene)
tronic communication.1,2 sumanene (3) and its photophysical and electrochemical pro-
Sumanene (1), a fullerene fragment, belongs to the class of perties. To our delight, this compound is readily soluble in
the so-called buckybowls featuring a bowl-shaped motif many organic solvents together with very efficient red-light
(Fig. 1a).6 This molecule is a promising candidate for the emission properties. What is more, electrochemical studies
revealed the promising redox properties of this derivative.
Encouraged by this finding, 3 was employed to construct a
a
sensor that showed remarkably effective and selective Cs+
Faculty of Chemistry, Warsaw University of Technology, Noakowskiego Str. 3,
detection in water. This is the first example of using a bucky-
00-664 Warsaw, Poland. E-mail: akasprzak@ch.pw.edu.pl
b
Faculty of Chemistry, University of Warsaw, Pasteura Str. 1, 02-093 Warsaw, Poland bowl compound for the construction of a sensor and its appli-
c
Biological and Chemical Research Centre, Faculty of Chemistry, University of cation towards the recognition of an analyte in aqueous
Warsaw, Zwirki i Wigury Str. 101, PL-02-093 Warsaw, Poland solution.
d
Division of Applied Chemistry Graduate School of Engineering, Osaka University, The synthesis of 3 was carried out starting from sumanene
2-1 Yamadaoka, Suita, Osaka 565-0871, Japan
(1) and ferrocenecarboxaldehyde (Fc-CHO; 2) according to the
† Electronic supplementary information (ESI) available: Experimental section,
compound characterization data, and electrochemical data. See DOI: 10.1039/ reported procedure10 which gave excellent yield (88%;
D0DT01506G Fig. 1b).11 The combination of NMR spectroscopy, Fourier-
This journal is © The Royal Society of Chemistry 2020 Dalton Trans., 2020, 49, 9965–9971 | 9965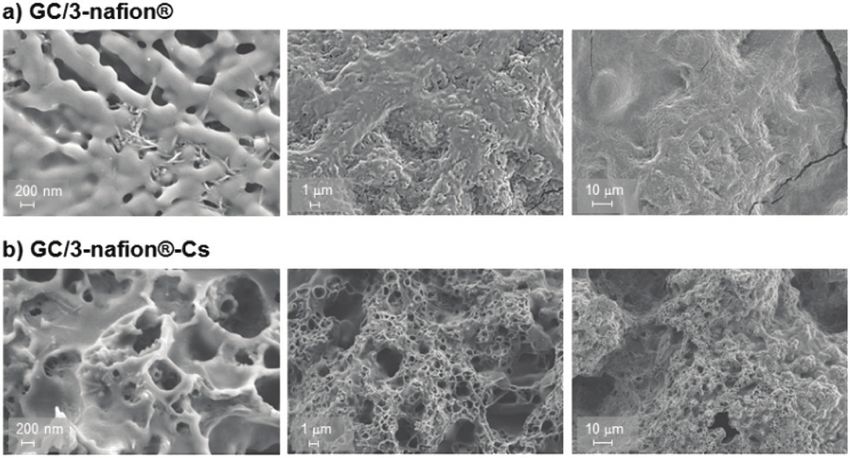
View Article Online
Paper Dalton Transactions
On the other hand, the colour of 3 in solution was comparable
to those of fullerenes (C70 or C60). We anticipate that these fea-
tures of 3 resulted from the π-conjugation. UV-Vis spectroscopy
analysis revealed the absorption maxima of 3 at 345 and
This article is licensed under a Creative Commons Attribution-NonCommercial 3.0 Unported Licence.
530 nm (Fig. 1d). A red-shift was observed in comparison with
similar sumanenes substituted with benzene derivatives.14 A
Strong red-light emission (λmax = 620 nm; excitation wave-
length 530 nm) was observed for 3 (Fig. 1d).15 The fluorescence
quantum yield (ΦF) was estimated by a relative method to be
0.81, a very high value.16 It is worth noting that such a satisfac-
tory ΦF value was not reported for pristine sumanene (ca.
Open Access Article. Published on 15 June 2020. Downloaded on 12/5/2020 9:08:43 AM.
0.03)17 or many buckybowl-based compounds (commonly
lower than 0.57).18 ΦF for 3 is comparable with the respective
values for highly conjugated pyrenylsumanene (0.82)17b and
some corannulenes bearing a push–pull architecture (0.76,
0.93 or 0.98).18g
Next, the cyclic voltammograms (CV) of 3 were recorded in
two solvents with different dielectric constants: dichloro-
methane (DCM) and dimethyl sulfoxide (DMSO) at various
scan rates (Fig. 2). In both solvents 3 exhibited one well-
defined oxidation peak and two- or three reduction peaks. The
presence of a linker between Fc and the benzene core resulted
in more independent electrochemical properties and electron
transfers. The lack of peak separation suggested a lack of elec-
tronic communication between the redox units. The Fc moi-
Fig. 1 (a) Structure of sumanene (1), together with the graphical repre-
sentation of its crystal structure and fullerene origin; (b) synthesis of 3;
(c) comparison between the solution colours (2 × 10⁻⁴ M), from left to
right: 3 in CH2Cl2 (F1), 3 in PhMe (F2), 3 in CH3CN (F3), fullerene C70 in
PhMe (F4), fullerene C60 in PhMe (F5), sumanene in PhMe (F6), Fc in
PhMe (F7), and Fc-CHO in PhMe (F8); (d) absorbance (violet curve) and
emission (red curve; excitation wavelength 530 nm) spectra of 3 (PhMe,
2 × 10⁻⁵ M).
transform infrared spectroscopy (FT-IR) and high-resolution
mass spectrometry (HRMS) confirmed the formation of 3.12 As
expected,10 the 1H NMR analysis revealed the presence of dia-
stereomers (C3 symmetrical and unsymmetrical).
Compound 3 was found to be air-stable both in solution
and in the solid state at a significant time interval.13 In
addition, 3 is solution-processable, because of its excellent
solubility in many commonly used organic solvents, both
polar and non-polar, including dichloromethane, chloroform,
hexane, benzene, toluene, tetrahydrofuran, acetonitrile and
acetone. The colour of 3 in each solvent was deep purple-red Fig. 2 Cyclic voltammograms of 3 recorded in DCM (a) and DMSO (b)
(Fig. 1c). It is noteworthy that the solutions of pristine suma- at various scan rates. Experimental conditions: C3 = 0.77 mM; CTBAHFP =
nene, Fc and Fc-CHO did not exhibit such optical properties. 100 mM; T = 21 °C.
9966 | Dalton Trans., 2020, 49, 9965–9971 This journal is © The Royal Society of Chemistry 2020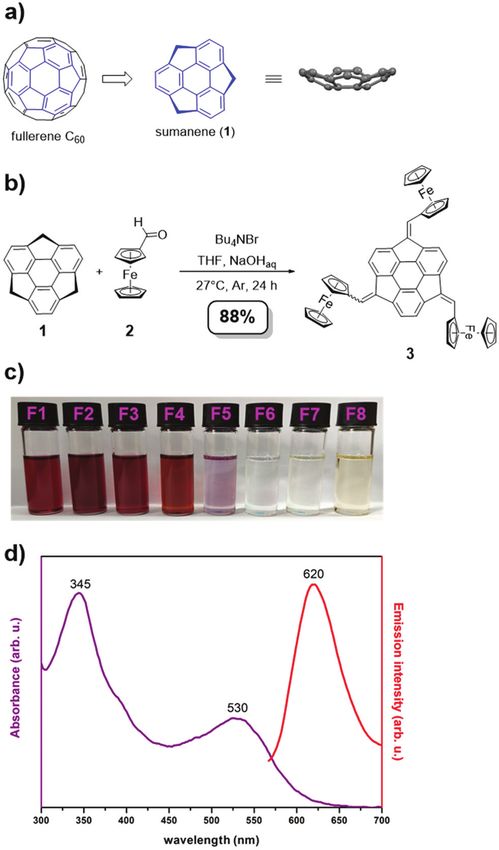
View Article Online
Dalton Transactions Paper
eties are electrochemically equivalent, and, thus, were oxidized
at the some potential. The oxidation process of the Fc units
leads to the formation of a positively charged product in the
solution, which can interact with the solution components.
This article is licensed under a Creative Commons Attribution-NonCommercial 3.0 Unported Licence.
DCM belongs to the solvents with a very low dielectric constant
(∼8.9). It is well known that the lower the dielectric constant of
a solution, the greater the tendency to form ionic pairs with
different stoichiometries. Thus, the presence of two cathodic
peaks is most likely the result of the existence of ion pairs in
the solution. In addition, the shape of the reduction peak (a
drastic decrease in the current value, see Fig. 2a) indicates the
Open Access Article. Published on 15 June 2020. Downloaded on 12/5/2020 9:08:43 AM.
accumulation of the oxidation product of 3 on the electrode Fig. 3 SEM images of the recognition layer before (a) and after (b) inter-
surface. To examine if the above hypotheses were correct, we action with Cs+.
conducted additional experiments with a solvent (DMSO)
characterized by a dielectric constant 5 times greater than that
for DCM. The issue of product accumulation on the electrode sensor formed from the DCM solvent, see Section S8 in the
surface has been eliminated; however, ion pairs are still ESI†.
formed, as evidenced by the cathodic signals of 3 (see Fig. 2b). Before the experiments with Cs+ recognition the sensor was
The calculations of the diffusion coefficients of 3 were per- cycled between −0.5 and 1 V in water with tetrabutyl-
formed on the basis of the linear relationship of anodic peak ammonium bromide (TBAB) until a stable voltammogram was
current (Ip) versus square root of the scan rate (v0.5), because obtained and voltammetrically characterised. The cyclic vol-
the shape of this signal indicated the clear diffusion character tammograms of the recognition surface (Fig. 4), recorded at
of the electrode process.19a The calculated diffusion coeffi- scan rates from 5 to 500 mV s−1, show well-defined oxidation
cients for 3 equal to (3.96 ± 0.36) × 10−5 and (1.91 ± 0.14) × and reduction peaks corresponding to the Fc/Fc+ redox couple.
10−5 cm2 s−1 in DCM and DMSO, respectively.19b For compari- The CV redox peak currents scale linearly with the square root
son, we obtained the coefficient diffusion of native Fc in DCM of the scan rate (Fig. 4, inset), indicating the semi-infinite
which is 7.72 × 10⁻⁵ cm2 s−1.20 The diffusion coefficient diffusional charge transport within the redox film at these
describes the diffusional transport and is an important para- scan rates.21a,b
meter of the species that are involved in the electrochemical The representative differential pulse voltammograms (DPV)
process. The comparable diffusion coefficient values for 3 and plotted as a function of the concentration of Cs+ are presented
native Fc testify to the lack of a significant effect of sumanene in Fig. 5a. Along with an increase in the concentration of Cs+
on the mobility of its derivative with Fc. in aqueous solution, an increase in the current signal of the Fc
We envisioned that 3 can be used for the selective reco- unit electrooxidation was observed, see Fig. 5b. In addition,
gnition of Cs+. This hypothesis was based on the literature this increase in the concentration range of 1–50 μM was
examples reporting highly specific interactions between suma- linear.21c At the concentrations of Cs+ higher than 50 μM, the
nene-based molecules and Cs+.6d,7b However, the detection of
Cs+ in water by buckybowl-based molecules was never studied
before, despite the fact that the detection of Cs+ in aqueous
solutions is crucial in terms of public health and environ-
mental monitoring. Thus, our ultimate goal in the light of this
work was to design a novel probe for Cs+ detection in water
samples. The 3-based sensor specific versus Cs+ was success-
fully constructed. The procedure was very simple. A droplet
containing 0.77 mM of 3 and 100 mM of TBAHFP in DMSO
was placed on the electrode surface and let to dry. After the
construction step and after the interaction with Cs+, the reco-
gnition layer was also inspected using scanning electron
microscopy (SEM). The obtained SEM images are presented in
Fig. 3. The SEM image showed that the rather homogeneous
surface experienced a significant increase of the porosity after
the interaction with Cs+.
The analytical characteristics of this sensor bearing the 3-
based receptor (GC/3-TBAHFP/Nafion®) were determined on
Fig. 4 Cyclic voltammograms of the recognition surface (GC/3-
the basis of the changes in the oxidation current signal of 3. TBAHFP/Nafion®) recorded in water with the addition of 100 mM TBAB,
For the preparation of the GC/3-TBAHFP/Nafion® sensor, see at various scan rates: 5 ÷ 1000 mV s−1. Experimental conditions: poten-
Section S1.5, ESI† and for the analytical characteristics of the tial window: 0.05 ÷ 0.85 V; potential step: 0.0024 V; T = 21 °C.
This journal is © The Royal Society of Chemistry 2020 Dalton Trans., 2020, 49, 9965–9971 | 9967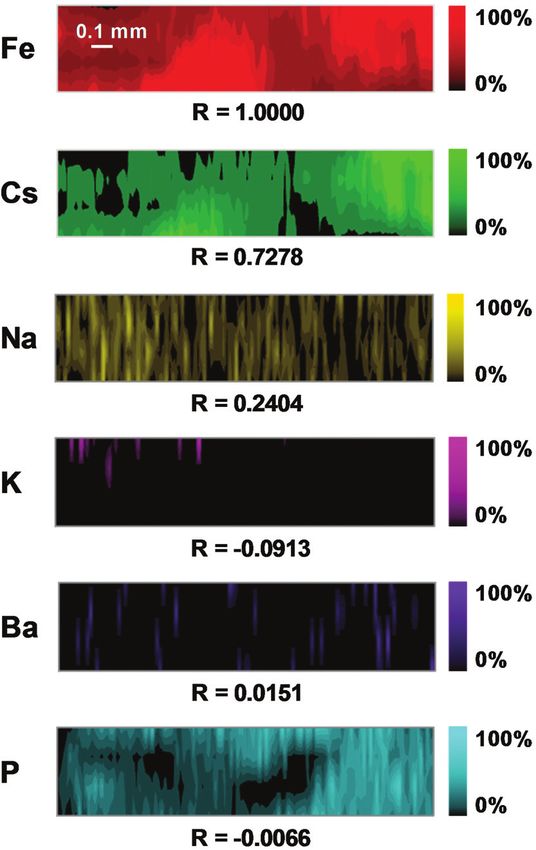
View Article Online
Paper Dalton Transactions
Table 1 Comparison between the LOD values for various Cs+ reco-
gnition materials
Material LOD [μM] Ref.
Tris(ferrocenylmethidene)sumanene 0.02 This work
This article is licensed under a Creative Commons Attribution-NonCommercial 3.0 Unported Licence.
Sumanenylferrocenes 12–70 7b
Squaraine 0.096 25a
Calixarenes 0.096–0.770 25b–d
Boron-dipyrromethene (BODIBY) 0.273 25e
Zeolite 7.3 25f
tion.23 It is worth emphasizing that the receptor layer was con-
Open Access Article. Published on 15 June 2020. Downloaded on 12/5/2020 9:08:43 AM.
structed from a mixture consisting of compound 3 and
TBAHFP in a ratio of 1 : 130. Hexafluorophosphate ions (PF6−)
belong to the group of strongly coordinating anions. They are
therefore strongly bonded to ferrocenium cations. It is known
that the ion-pairing strength of such anions with ferrocenium
cations or other cations shields their positive charge, thus low-
ering the E1/2 values of multiply charged cations.22
Compound 3 is electrically neutral; therefore, the formation
of a sandwich complex with Cs+ within the Nafion® polymer
network is possible. The driving force for the formation of
such a unique sandwich complex (Fig. 5c) shows a perfect
match of Cs+ with the sumanene concave cavity. The suma-
nene moiety remains neutral throughout the complexation;
therefore, the driving force for wrapping was the site-selective
cation–π interaction between the concave face of sumanene
and Cs+. The calculated limit of detection (LOD) equalled to
0.02 μM.24 This LOD value is remarkably satisfactory and is
better than the respective values for the previously reported
Cs+ receptors (Table 1). In addition, the herein presented
Fig. 5 (a) DPV voltammograms of GC/3-TBAHFP/Nafion® in the pres-
ence of Cs+ ions in water with the addition of 100 mM TBAB; (b) plots of sensor may be potentially useful in the analyses of real
the oxidation current and the position of the oxidation peak of GC/3- samples from post-disaster areas; for example, the contami-
TBAHFP/Nafion® versus concentration of Cs+. Experimental conditions: nation of Mano River in Japan (north-west from the
modulation time: 0.002 s; interval time: 0.1 s; modulation amplitude: Fukishima-Daiichi plant) with active cesium (Cs137) was
0.04995 V; step potential: 0.00495 V; (c) graphical representation of the
reported to be ca. 0.06 mM.9c,26
proposed interaction between 3 and Cs+.
It is also worth emphasizing that the regeneration of the
herein presented sensor is very easy; it can be achieved by just
dipping it into water for 10 minutes and the sensor is then
changes in the intensity of the peak current were negligible. In ready to work, see Fig. 5a. Furthermore, to prove the Cs+
addition, some changes in the position of the current signal selectivity, control experiments with other cations, namely
were observed; the signal successfully shifted towards less Na+, K+ and Ba2+ (100 μM), were performed. No changes in the
positive values with increasing concentrations of Cs+ in Fc oxidation signal, and its position were observed (see Fig. 6).
solution. This means that Na+, K+ and Ba2+ neither form complexes with
Shifting the signal towards less positive potential values 3 nor obstruct the Cs+ complexation, and that the constructed
indicated a simpler exchange of electrons between the elec- GC/3-TBAHFP/Nafion® sensor is highly selective towards the
trode surface and Fc units. However, an increase in the signal Cs+ recognition. High stability is a very important parameter
intensity may point to a greater number of Fc units involved in defining the sensor’s functionality. The stability of the pro-
the electrode process. Most likely, the formation of sandwich posed sensor was examined by measuring the changes in the
complexes between 3 and Cs+ led to a rearrangement of the Fc value of oxidation current of the Fc units in water with
units; the Fc units were closer to each other and closer to the 100 mM TBAB as a function of time elapsed since the for-
electrode surface, making the electron exchange easier mation of the recognition layer (GC/3-TBAHFP/Nafion®). After
(Fig. 5c). It is known from the literature that Nafion® (fluoro- the preparation step, the sensor was kept under the cover at
carbon polymer) does not significantly limit the mobility of room temperature for 2 months. The proposed sensor was
electrically neutral compounds; only the existence of some characterized by very good stability for the first 5 weeks. The
attractive interactions between the SO3− functional groups of difference in the intensities of the Fc oxidation current signal
Nafion® and specific cations might lead to the mobility restric- was smaller than 5%. For the longer storage time (>5 weeks)
9968 | Dalton Trans., 2020, 49, 9965–9971 This journal is © The Royal Society of Chemistry 2020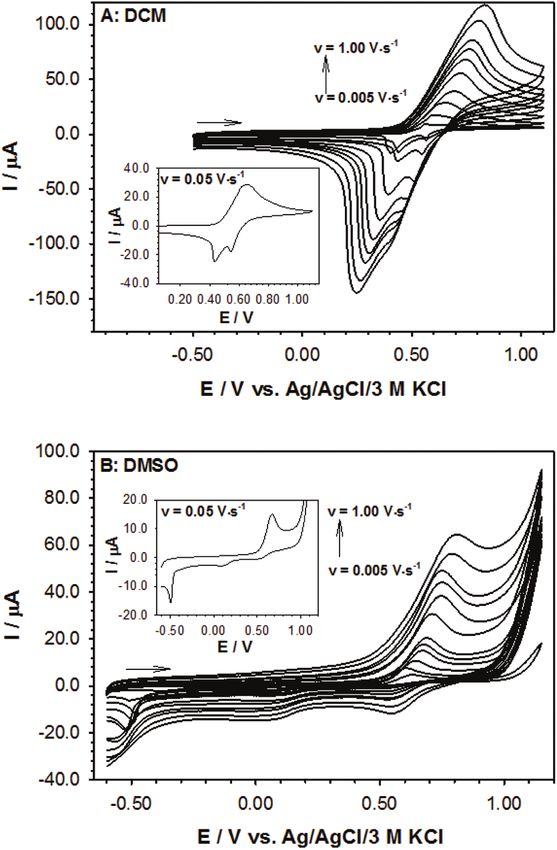
View Article Online
Dalton Transactions Paper
This article is licensed under a Creative Commons Attribution-NonCommercial 3.0 Unported Licence.
Open Access Article. Published on 15 June 2020. Downloaded on 12/5/2020 9:08:43 AM.
Fig. 6 DPV voltammograms of GC/3-TBAHFP/Nafion® in the absence
(the dashed line) and presence of different interfering cations (the solid
line). Experimental conditions: modulation time: 0.002 s; interval time:
0.1 s; modulation amplitude: 0.04995 V; step potential: 0.00495 V. The
recognition layer was formed from DMSO solution.
the current decreases by 10% compared to the initial value
(the sensor used just after the formation of the recognition
layer).
To further support the selective interaction between 3 and
Cs+, UV-Vis analyses and inductively coupled plasma mass
spectrometry measurements with laser ablation (LA-ICP-MS)
were performed.27 The UV-Vis spectrum of 3 showed an Fig. 7 Relative distribution maps reconstructed for the selected
increase in the absorbance intensity after the addition of elements over the surface of the substrate. The Pearson correlation
further portions of Cs+. This feature was ascribed to the non- coefficients R between Fe and the given element signal intensities from
covalent, site-selective interaction between 3 and Cs+.7b In con- the ablation area are listed below each element.
trast, no changes were observed in the UV-Vis spectra of 3
measured in the presence of Na+, K+ and Ba2+. These trends
clearly elucidate the selective binding of Cs+ with 3. Job’s plot dance for each element and averaged from the 5 subsequent
analysis revealed the 2 : 1 stoichiometry of the 3:Cs+ system.27 data. The registered signal intensities were independently
This analysis indicates the formation of anticipated sandwich- recalculated for each monitored isotope with respect to the
type complexes.7b The interactions between 3 and the selected highest signal intensity (normalization to 100%). The relative
ions: Cs+, Na+, K+, and Ba2+ were also analysed with distribution patterns of Fe and Cs were evaluated for the elec-
LA-ICP-MS. In the experiments a gold substrate modified with trodes before and after rinsing with mili-Q water (Fig. 7).
the layer 3-TBAHFP/Nafion® was immersed in a water solution The correlation coefficient values were calculated and are
containing an appropriate anion at the 100 µM level. After given below the images of a particular element distribution to
3 hours, the substrate with the 3-TBAHFP/Nafion® layer was support the information about the co-presence of Fe and Cs
gently washed with water and analysed. The multiline laser relative to the other observed species (Na, P, K, and Ba). It
ablation (n = 4 lines per each map; ca. 0.75 mm2) was per- should be noted that the presence of P is a consequence of
formed on the surface of the samples with a constant speed using a supporting electrolyte, tetrabutylammonium hexa-
(25 µm s−1) followed by ICP-MS measurements. Transient fluorophosphate (TBAHFP), during the formation of the layer.
signals were registered for the selected isotopes during each It is clearly visible that although it is influenced by the hetero-
measurement cycle. The intensities of blank signals were regis- geneity of the electrode, still the correlation between the Fe
tered for carrier gas (Ar) only and averaged for each isotope and Cs distribution is much higher (R ca. equal to 0.7) than
individually from the signals registered during 20 s before the that between the other elements. The averaged signal intensi-
start of ablation. The blank values were subtracted from the ties are equivalent to 1%. The abundance of each element was
transient signals registered during the ablation of the samples. calculated to estimate the ratio between Fe and Cs which
Spikes, defined as single raw intensity data higher than the resulted in an approximated value of 10 ± 4. No exact quantifi-
mean of two neighboring data, were removed and replaced by cation has been carried out, but based on this approach, a
the mean of the neighbouring values. The results obtained for rough conclusion can be drawn about an order of magnitude
the isotopes were recalculated to the equivalent of 1% abun- greater content of Fe than that of Cs.
This journal is © The Royal Society of Chemistry 2020 Dalton Trans., 2020, 49, 9965–9971 | 9969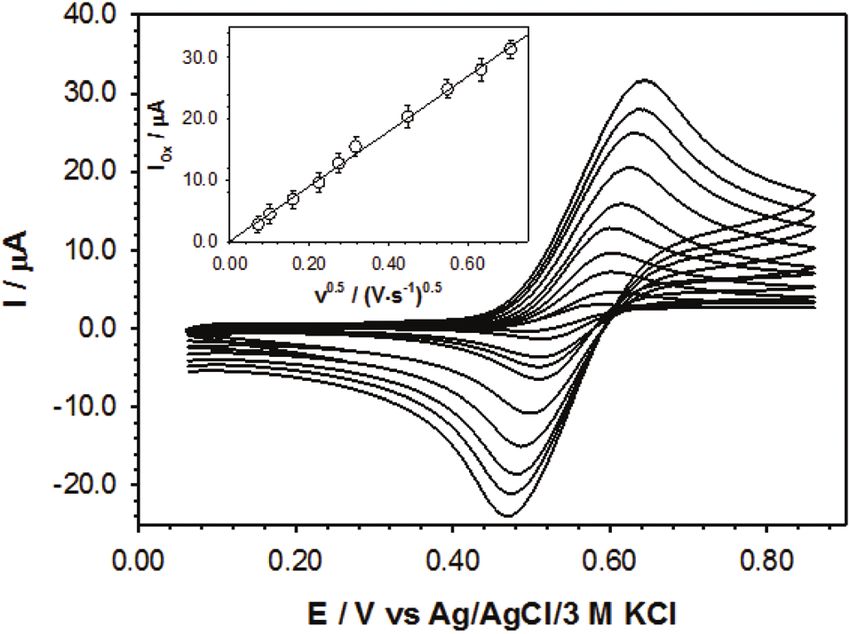
View Article Online
Paper Dalton Transactions
Conclusions 6 (a) H. Sakurai, T. Daiko and T. Hirao, Science, 2003, 301,
1878; (b) T. Amaya and T. Hirao, Chem. Rec., 2015, 15, 310–
In conclusion, 3, bearing a buckybowl motif, showed encoura- 321; (c) M. Saito, H. Shinokubo and H. Sakurai, Mater.
ging photophysical and electrochemical properties, which Chem. Front., 2018, 2, 635–661; (d) S. N. Spisak, Z. Wei,
This article is licensed under a Creative Commons Attribution-NonCommercial 3.0 Unported Licence.
shed light on its prospective applications. In addition, 3 was A. Y. Rogachev, T. Amaya, T. Hirao and M. A. Petrukhina,
used for the preparation of a Cs+-selective sensor. This is the Angew. Chem., Int. Ed., 2017, 56, 2582–2587; (e) H. Toda,
first example of the construction of a buckybowl-based sensor, Y. Uetake, Y. Yakiyama, H. Nakazawa, T. Kajitani,
since in comparison with our previous work on sumanenylfer- T. Fukushima and H. Sakurai, Synthesis, 2019, 4576–4581.
rocenes for Cs+ recognition in an organic solvent,7b here we 7 (a) B. Topolinski, B. M. Schmidt, S. Higashibayashi,
constructed a reusable analytical device for the Cs+ recognition H. Sakurai and D. Lentz, Dalton Trans., 2013, 42, 13809–
in water. The Cs+ detection in water was found to be highly 13812; (b) A. Kasprzak and H. Sakurai, Dalton Trans., 2019,
Open Access Article. Published on 15 June 2020. Downloaded on 12/5/2020 9:08:43 AM.
selective and remarkably effective (LOD = 0.02 μM). The regen- 48, 17147–17152.
eration of the sensor is also easy to perform. We anticipate 8 (a) D. Vijay, H. Sakurai, V. Subramanian and G. N. Sastry,
that this work will stimulate further progress in the chemistry Phys. Chem. Chem. Phys., 2012, 14, 3057–3065;
and applications of metallocene-based buckybowls. (b) U. D. Priyakumar and G. N. Sastry, Tetrahedron Lett.,
2003, 44, 6043–6046; (c) U. D. Priyakumar, M. G. P. Krishna
and G. N. Sastry, Tetrahedron Lett., 2004, 60, 3037–3043.
Conflicts of interest 9 (a) H. Kaeriyama, Fish. Oceanogr., 2017, 26, 99–113;
(b) T. J. Yasunari, A. Stohl, R. S. Hayano, J. F. Burkhart,
There are no conflicts to declare. S. Eckhardt and T. Yasunari, Proc. Natl. Acad. Sci. U. S. A.,
2011, 108, 19530–19534; (c) T. Mizuno and H. Kubo, Sci.
Rep., 2013, 3, 1742; (d) Y. Masumoto, Y. Miyazawa,
Acknowledgements D. Tsumune, T. Tsubono, T. Kobayashi, H. Kawamura,
Financial support from the Warsaw University of Technology is C. Estournel, P. Marsaleix, L. Lanerolle, A. Mehra and
acknowledged. H. S. acknowledges the financial support by a Z. D. Garraffo, Elements, 2012, 8, 207–212.
Grant-in-Aid for Scientific Research on Innovative Area “π 10 T. Amaya, K. Mori, H.-L. Wu, S. Ishida, J.-i. Nakamura,
Space Figuration” from MEXT (no. JP26102002), and JSPS K. Murata and T. Hirao, Chem. Commun., 2007, 1902–1904.
KAKENHI (19H00912). 11 For the experimental details, see Experimental section
(Section S1), ESI.†
12 For the analytical data, see Sections S1–S6 in the ESI.†
Notes and references 13 It was tracked with 1H NMR. For the spectra, see Section
S2, ESI.†
1 (a) D. Astruc, Eur. J. Inorg. Chem., 2017, 6–29; (b) K. Heinze 14 λmax for such derivatives was found to be between 278 and
and H. Lang, Organometallics, 2013, 32, 5623–5625. 485 nm, see reference no. 10.
2 (a) R. Sun, L. Wang, H. Yu, Z. ul-Abdin, Y. Chen, J. Huang 15 The fluorescence intensity varied depending on the exci-
and R. Tong, Organometallics, 2014, 33, 4560–4573; tation wavelength (λexc). The strongest fluorescence inten-
(b) A. Scozzari, in Algal Toxins: Nature, Occurrence, Effect sity with 3 was found for λexc = 530 nm (tested λexc ranged
and Detection, ed. V. Evangelista, L. Barsanti, between 330 and 510 nm). Therefore, λexc of 530 nm was
A. M. Frassanito, V. Passarelli and P. Gualtieri, 2008; used for the estimation of ΦF with 3.
(c) O. B. Sutcliffe, A. Chesney and M. R. Bryce, J. Organomet. 16 This is a relative quantum yield in PhMe solution (1 × 10⁻⁶
Chem., 2001, 637–639, 134–138; (d) N. G. Tsierkezos, M) with cresyl violet perchlorate as a standard. For details
J. Solution Chem., 2007, 36, 289–302; (e) A. Lewandowski, on estimating ΦF, see Subsection S1.3, ESI.† .
L. Waligora and M. Galinski, Electroanalysis, 2009, 21, 17 (a) S. Kunishige, M. Kawabata, M. Baba, T. Yamanaka,
2221–2227. Y. Morita, S. Higashibayashi and H. Sakurai, J. Chem. Phys.,
3 (a) T. Romero, A. Caballero, A. Tarraga and P. Molina, Org. 2013, 139, 044313; (b) B. B. Shrestha, S. Higashibayashi
Lett., 2009, 11(15), 3466–3469; (b) L. Zhou, X.-T. Fan, and H. Sakurai, Beilstein J. Org. Chem., 2014, 10, 841–847;
Y.-D. Xu and Q.-Y. Cao, New J. Chem., 2015, 39, 8087–8092; (c) S. Hishikawa, Y. Okabe, R. Tsuruoka, S. Higashibayashi,
(c) A. Kasprzak, K. Fateyeva, A. Kowalczyk and H. Ohtsu, M. Kawano, Y. Yakiyama and H. Sakurai, Chem.
A. M. Nowicka, Anal. Chim. Acta, 2020, 1108, 10–20. Lett., 2017, 46, 1556–1559.
4 (a) L. Lvova, P. Galloni, B. Floris, I. Lundström, R. Paolesse 18 (a) R. Renner, M. Stolte and F. Würthner, ChemistryOpen,
and C. Di Natale, Sensors, 2013, 13, 5841–5856; 2020, 9, e190029; (b) J. Mack, P. Vogel, D. Jones, N. Kavala
(b) C. Bucher, C. H. Devillers, J.-C. Moutet, G. Royal and and A. Suttona, Org. Biomol. Chem., 2007, 5, 2448–2452;
E. Saint-Aman, Chem. Rev., 2009, 253, 21–36. (c) J. Dey, A. Y. Will, R. A. Agbaria, P. W. Rabideau,
5 M. S. Inkpen, S. Scheerer, M. Linseis, A. J. P. White, A. H. Abdourazak, R. Sygula and I. M. Warner, J. Fluoresc.,
R. F. Winter, T. Albrecht and N. J. Long, Nat. Chem., 2016, 1997, 7, 231–236; (d) E. M. Muzammil, D. Halilovic and
8, 825–830. M. C. Stuparu, Commun. Chem., 2019, 2, 58; (e) X. Gu,
9970 | Dalton Trans., 2020, 49, 9965–9971 This journal is © The Royal Society of Chemistry 2020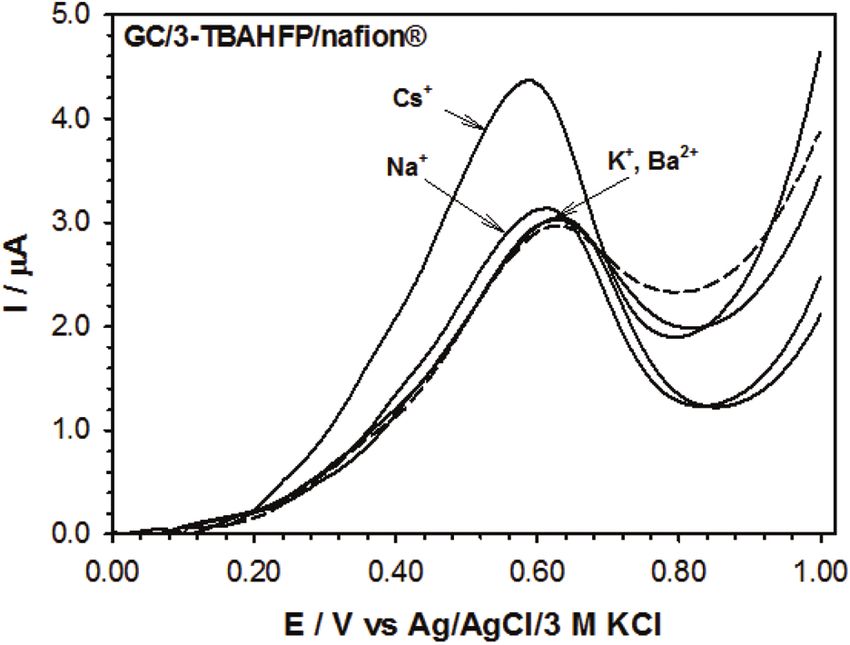
View Article Online

                                                                                                               Dalton Transactions                                                                                                                 Paper

                                                                                                                    X. Zhang, H. Ma, S. Jia, P. Zhang, Y. Zhao, Q. Liu, J. Wang,      23 A. Yamauchi, K. Togami, A. M. Chaudry and A. M. El Sayed,
                                                                                                                    X. Zheng, J. W. Y. Lam, D. Ding and B. Z. Tang, Adv. Mater.,         J. Membr. Sci., 2005, 249, 119–126.
                                                                                                                    2018, 30, 1801065; (f ) P. Liu, Y. Hisamune, M. D. Peeks,         24 LOD was determined from the low concentration linear-
                                                                                                                    B. Odell, J. Q. Gong, L. M. Herz and H. L. Anderson, Angew.          ity range of the calibration curve according to the
           This article is licensed under a Creative Commons Attribution-NonCommercial 3.0 Unported Licence.

                                                                                                                    Chem., Int. Ed., 2016, 55, 8358–8362; (g) Y.-L. Wu,                  equation: LOD = 3σ·a−1, where σ is the standard deviation
                                                                                                                    M. C. Stuparu, C. Boudon, J.-P. Gisselbrecht, W. B. Schweizer,       of the response and a is the slope of the calibration
                                                                                                                    K. K. Baldridge, J. S. Siegel and F. Diederich, J. Org. Chem.,       curve.
                                                                                                                    2012, 77, 11014–11026.                                            25 (a) B. Radaram, T. Mako and M. Levine, Dalton Trans.,
                                                                                                               19   (a) For the plots of the anodic peak heights as a function of        2013, 42, 16276–16278; (b) N. Kumar, Q. Pham-Xuan,
                                                                                                                    the scan rate and square root of the scan rate, see Section          A. Depauw, M. Hemadi, N.-T. Ha-Duong, J.-P. Lefevre,
                                                                                                                    S6, ESI;†; (b) For details on calculation of this diffusion           M.-H. Ha-Thi and I. Leray, New J. Chem., 2017, 41, 7162–
Open Access Article. Published on 15 June 2020. Downloaded on 12/5/2020 9:08:43 AM.

                                                                                                                    coefficient, see Section S6, ESI.†                                     7170; (c) V. Souchon, I. Leray and B. Valeur, Chem.
                                                                                                               20   N. S. Neghmouche and T. Lanez, Int. Lett. Chem., Phys.               Commun., 2006, 4224–4226; (d) X. Q. Pham,
                                                                                                                    Astron., 2013, 4, 37–45.                                             L. Jonusauskaite, A. Depauw, N. Kumar, J. P. Lefevre,
                                                                                                               21   (a) R. J. Forster and J. G. Vos, Macromolecules, 1990, 23,           A. Perrier, M.-H. Ha-Thi and I. Leray, J. Photochem.
                                                                                                                    4372; (b) A. J. Bard and L. R. Faulkner, Electrochemical             Photobiol., A, 2018, 364, 355–362; (e) E. Özcan and B. Çoşut,
                                                                                                                    methods: Fundamentals and Applications, Wiley, New York,             ChemistrySelect, 2018, 3, 7940–7944; (f ) M. Arvand,
                                                                                                                    1980; (c) linear regression equation is as follows: I = (1.17 ±      M. Moghimi and M. A. Bagherinia, Anal. Lett., 2009, 42,
                                                                                                                    0.06)CCs+ + (102.9 ± 1.3). R2 = 0.993.                               393–408.
                                                                                                               22   (a) R. J. LeSuer and W. E. Geiger, Angew. Chem., Int. Ed.,        26 This reference value in mM was estimated according to the
                                                                                                                    2000, 39, 248–250, (Angew. Chem., 2000, 112, 254);                   data in Bq kg−1 presented in ref. 9c and taking into
                                                                                                                    (b) F. Barrière, N. Camine and W. E. Geiger, J. Am. Chem.            account that 1000 mg of Cs137 has an activity of ca. 3.215 ×
                                                                                                                    Soc., 2002, 124, 7262–7263; (c) F. Barrière and W. E. Geiger,        1012 Bq (see: R. L. Bunting, Nucl. Data Sheets, 1975, 15,
                                                                                                                    J. Am. Chem. Soc., 2006, 128, 3980–3989; (d) F. Barrière and         335–369).
                                                                                                                    W. E. Geiger, Acc. Chem. Res., 2010, 43, 1030–1039.               27 For data, see Section S5, ESI.†

                                                                                                               This journal is © The Royal Society of Chemistry 2020                                            Dalton Trans., 2020, 49, 9965–9971 | 9971
You can also read