DATA, REAGENTS, ASSAYS AND MERITS OF PROTEOMICS FOR SARS-COV-2 RESEARCH AND TESTING - MEDIATUM
←
→
Page content transcription
If your browser does not render page correctly, please read the page content below
RESEARCH

Data, Reagents, Assays and Merits of Proteomics for
SARS-CoV-2 Research and Testing
Authors
Jana Zecha, Chien-Yun Lee, Florian P. Bayer, Chen Meng, Vincent Grass, Johannes Zerweck,
Karsten Schnatbaum, Thomas Michler, Andreas Pichlmair, Christina Ludwig, and Bernhard Kuster

Correspondence                      Graphical Abstract
tina.ludwig@tum.de;
kuster@tum.de

In Brief

                                                                                               Downloaded from https://www.mcponline.org at TU MÜNCHEN on January 11, 2021
As the COVID-19 pandemic
continues to spread, research
on SARS-CoV-2 is also rapidly
evolving and the number of
associated manuscripts on pre-
print servers is soaring. To
facilitate proteomic research,
Zecha et al. present protein
expression profiles of four
model cell lines and investigate
the response of Vero E6 cells
to viral infection. Further, they
evaluate the feasibility of pro-
teomic analysis for SARS-CoV-
2 diagnostics and critically dis-
cuss the merits of proteomic
approaches in the context of
the COVID-19 research.

Highlights
 In-depth proteomes of 4 SARS-CoV-2 cell line models (Vero E6, Calu-3, Caco-2, A549).

 Proteomic evidence for thousands of Chlorocebus sabaeus proteins.

 Proteomic response of Vero E6 cells to SARS-CoV-2 infection.

 Synthetic peptides, spectral libraries, and targeted assays for SARS-CoV-2 proteins.

Zecha et al., 2020, Mol Cell Proteomics 19(9), 1503–1522
September 2020 © 2020 Zecha et al. Published by The American Society for Biochemistry and
Molecular Biology, Inc.
https://doi.org/10.1074/mcp.RA120.002164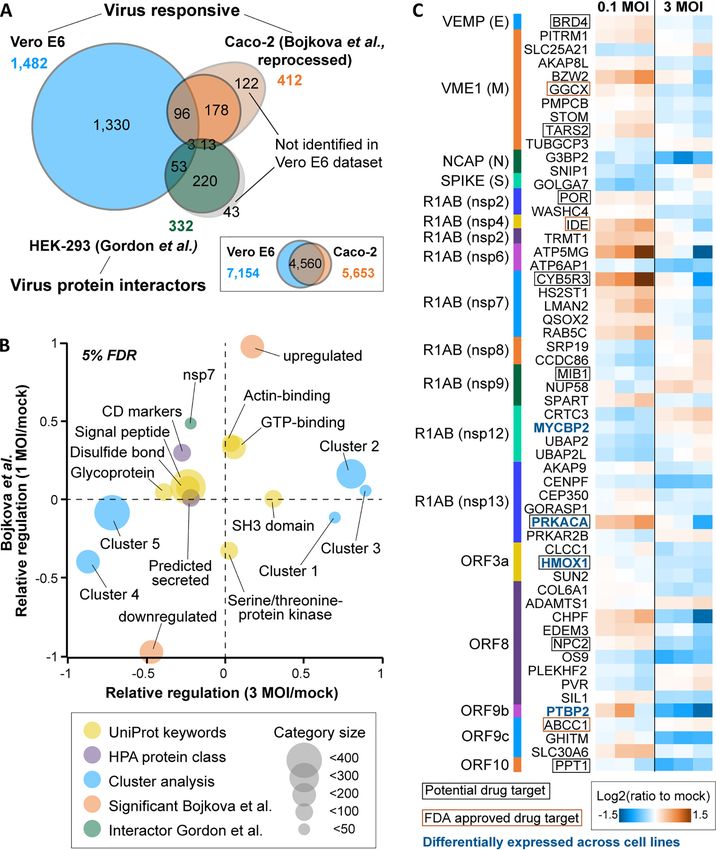
RESEARCH
   Author’s Choice

Data, Reagents, Assays and Merits of
Proteomics for SARS-CoV-2 Research and
Testing
Jana Zecha1,‡ , Chien-Yun Lee1,‡ , Florian P. Bayer1, Chen Meng2 , Vincent Grass3,4,
Johannes Zerweck5, Karsten Schnatbaum5, Thomas Michler3 , Andreas Pichlmair3,4,
Christina Ludwig2,* , and Bernhard Kuster1,2,*

As the COVID-19 pandemic continues to spread, thousands                             motivates proteomic scientists to join efforts that aim at bet-
of scientists around the globe have changed research direc-                         ter understanding how this new virus works and how that

                                                                                                                                                          Downloaded from https://www.mcponline.org at TU MÜNCHEN on January 11, 2021
tion to understand better how the virus works and to find out                        may inform the development of effective treatments and vac-
how it may be tackled. The number of manuscripts on pre-                            cines. In this context, it is worth reflecting in which areas of
print servers is soaring and peer-reviewed publications
                                                                                    the life sciences proteomics has historically been particularly
using MS-based proteomics are beginning to emerge. To
                                                                                    successful. One of the first areas was cell biology. For exam-
facilitate proteomic research on SARS-CoV-2, the virus that
causes COVID-19, this report presents deep-scale pro-                               ple, the ability to identify and characterize protein complexes
teomes (10,000 proteins; >130,000 peptides) of common cell                          systematically has profoundly changed the way we think
line models, notably Vero E6, Calu-3, Caco-2, and ACE2-A549                         about the functional organization of cells. Proteomics then
that characterize their protein expression profiles including                        revolutionized the analysis of post-translational modifications
viral entry factors such as ACE2 or TMPRSS2. Using the 9                            to the extent that the vast majority of all PTMs known to date
kDa protein SRP9 and the breast cancer oncogene BRCA1                               have been found by proteomic approaches. The rapid devel-
as examples, we show how the proteome expression data                               opment of quantitative MS, with or without the use of stable
can be used to refine the annotation of protein-coding                               isotopes, paved the way for large-scale cell perturbation
regions of the African green monkey and the Vero cell line
                                                                                    studies ranging from growth factors to nutrients to knock-
genomes. Monitoring changes of the proteome on viral
                                                                                    outs or drugs. This has significantly shaped our current
infection revealed widespread expression changes including
transcriptional regulators, protease inhibitors, and proteins                       understanding of the inner workings of a cell including
involved in innate immunity. Based on a library of 98 stable-                       protein expression regulation, biochemical fluxes and sig-
isotope labeled synthetic peptides representing 11 SARS-                            naling networks to name a few. Today, proteomics is also
CoV-2 proteins, we developed PRM (parallel reaction moni-                           becoming ever more important in pre-clinical drug discov-
toring) assays for nano-flow and micro-flow LC–MS/MS. We                              ery and much of the chemical biology field is powered by
assessed the merits of these PRM assays using supernatants                          the ability to interrogate proteins and drugs on a pro-
of virus-infected Vero E6 cells and challenged the assays by                        teome-wide scale. More recently, proteomics has also
analyzing two diagnostic cohorts of 24 (130) SARS-CoV-2                             begun making inroads into structural biology, an area that
positive and 28 (19) negative cases. In light of the results
                                                                                    is undergoing very rapid development and will undoubt-
obtained and including recent publications or manuscripts
                                                                                    edly make important contributions in the future. In com-
on preprint servers, we critically discuss the merits of MS-
based proteomics for SARS-CoV-2 research and testing.                               parison, and despite great efforts, progress in clinical pro-
                                                                                    teomics has been slower as many additional challenges
                                                                                    present when analyzing complex biology in heterogeneous
  Mass spectrometry-based proteomics is continuing to                               human populations. That said, recent technological devel-
make tremendous contributions to life science research and                          opments and their application suggest that clinical proteo-
the latest “explosion” of activities around SARS-CoV-2 also                         mics will become much more successful soon.

From the 1Chair of Proteomics and Bioanalytics, Technical University of Munich, Freising, Germany; 2Bavarian Center for Biomolecular Mass
   Spectrometry (BayBioMS), Technical University of Munich, Freising, Germany; 3Institute of Virology, School of Medicine, Technical University
   of Munich, Munich, Germany; 4German Center for Infection Research (DZIF), Munich partner site, Germany; 5JPT Peptide Technologies
   GmbH, Berlin, Germany
This article contains supplemental Data.
   Author's Choice—Final version open access under the terms of the Creative Commons CC-BY license.
* For correspondence: Christina Ludwig, tina.ludwig@tum.de; Bernhard Kuster, kuster@tum.de.
‡
  These authors contributed equally to this work.

                                                                                                 Mol Cell Proteomics (2020) 19(9) 1503–1522     1503
© 2020 Zecha et al. Published by The American Society for Biochemistry and Molecular Biology, Inc.                         DOI 10.1074/mcp.RA120.002164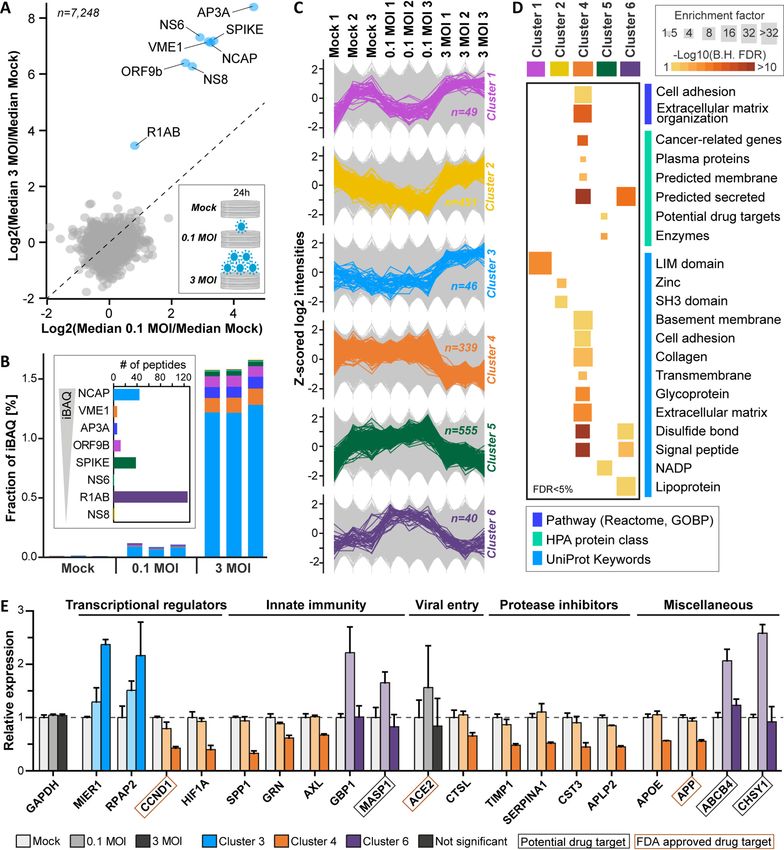
Proteomics for SARS-CoV-2 Research and Testing

    In light of the above, it should come as no surprise that            three model cell lines (African green monkey Vero E6 kidney cell line,
proteomics has also become highly successful in virology                 human Caco-2 colon and Calu-3 lung-cancer cell lines) commonly
                                                                         used in virology studies. In addition, the human A459 lung cancer
and a recent special issue of Molecular and Cellular Proteo-
                                                                         cell line stably transfected with ACE2, a peptidase reported to serve
mics has highlighted many of the important achievements                  as entry point for SARS-CoV-2 into cells (6) was included for deep
made in the area of infectious diseases (1). The recent                  proteome profiling. To this end, we performed deep proteome analy-
COVID-19 outbreak has spurred a remarkable amount of                     ses measuring 48 basic reversed phase (RP) fractions for each cell
research activities. At the time of writing, the preprint servers        line and generating high resolution and mass accuracy fragment
                                                                         spectra. For Vero E6 and ACE2-A459 cells, a workflow replicate was
medRxiv and bioRxiv listed ;5,500 manuscripts for SARS-
                                                                         prepared by employing a faster, but lower resolution method for MS2
CoV-2. More than 300 of these mention the term proteomics                spectra acquisition. High resolution and mass accuracy MS2 spectra
and a few have already entered the peer-reviewed scientific               from Vero E6 cells and a database search including human protein
literature. One example for the latter is a protein interaction          sequences were used further to exemplify a proteomics-guided re-
map constructed by using affinity-tagged viral proteins and               finement of the expressed genome and identify genes or parts of
                                                                         genes that have been completely missed in the African green mon-
MS that provides an initial overview of how SARS-CoV-2 pro-
                                                                         key genome annotation provided by Uniprot and/or RefSeq. Next,
teins interact with host proteins (2). Another group applied a           the response of Vero E6 cells 24 h after SARS-CoV-2 infection at 2
pulse-labeling approach to monitor the modulation of the vi-             different multiplicities of infection (MOI) was investigated in cell cul-
ral translatome and proteome on infection (3), and two labo-             ture triplicates to enable analyses of significant protein expression

                                                                                                                                                     Downloaded from https://www.mcponline.org at TU MÜNCHEN on January 11, 2021
ratories analyzed sera of COVID-19 cases by LC–MS/MS in                  changes. In addition, obtained infectome data were compared with a
                                                                         recently published virus-host response study (3) and a SARS-CoV-2
the search for biomarkers (4, 5). Several studies also present
                                                                         interactome study (2). Finally, using heavy synthetic peptide referen-
candidate drug targets and small molecules that show antivi-             ces, we generated a spectral library entailing fragment ion spectra
ral activity in vitro. This is of note as controlling the pandemic       and retention time information for 98 SARS-CoV-2 peptides. This
will require a multitude of measures including effective treat-          was refined further to a PRM assay panel containing 23 peptides and
ments for patients with severe course of disease using drugs             applied to the detection of SARS-CoV-2 in two clinical cohorts. In
                                                                         total, 91 respiratory specimens, of which 37 were tested negative
that exist today.
                                                                         and 54 were tested positive for SARS-CoV-2 by RT-PCR (RT-PCR),
    At the beginning of a new research activity, considerable            were analyzed by nano- and micro-flow PRM using two different
time and effort is required for the molecular characterization           input quantities. All significance and enrichment analyses were cor-
of the biological model systems, generating research re-                 rected for multiple testing at 5% FDR. Further, instead of choosing a
agents, and setting up assays. Because the SARS-CoV-2                    p-value cut-off, S0 was specified to adjust the significance cut-off of
                                                                         statistical analyses on the fold-change level in a data-driven way
pandemic puts scientists under heavy time pressure, sharing
                                                                         while accounting for differing variances across the range of meas-
such resources with the scientific community rapidly can                  ured values and groups. For two-sided t-tests, at least 2 valid quanti-
facilitate progress provided that high standards of quality can          fications per group were required, and equal variances were
be upheld. In this report, we contribute high-quality LC–MS/             assumed for each group as well as normal distribution of log trans-
MS data on the proteomes of common cell line models for                  formed protein intensities. To characterize correlations, Pearson cor-
                                                                         relation coefficients (R) were computed under the assumption of a
SARS-CoV-2 research, notably Vero E6, Calu-3, Caco-2, and
                                                                         linear relationship between two variables.
ACE2-A549 that may be used as a protein expression                           Synthetic Peptides and Antibodies—Isotopically labeled Spike-
resource or to build spectral libraries. The African green mon-          TidesTM peptides covering 11 SARS-CoV-2 proteins were kindly pro-
key and derived Vero cell lines often serve as in vitro and in           vided by JPT Peptide Technologies (for details see supplemental
vivo models for virus research and our analysis exemplifies               Methods). All quantities per spike-in peptide specified in the fol-
                                                                         lowing represent only rough estimates, as the isotopically labeled
how mass spectrometric data can be used to improve the
                                                                         peptides were not purified and concentrations were not deter-
annotation of protein-coding regions. Furthermore, we pres-              mined accurately. For retention time calibration, PROCAL reten-
ent data on how the virus modulates the proteome of                      tion time peptides from JPT Peptide Technologies (7) and indexed
infected cells. In addition, we provide a physical and spectral          retention time (iRT) peptides from Biognosys (8) were used. West-
library of 98 stable isotope-labeled, synthetic peptides repre-          ern blots were performed according to standard procedures using
                                                                         30 mg protein as input and antibodies against human ACE2 (R&D
senting 11 viral proteins along with optimized PRM assays
                                                                         Systems, Cat# AF933, 1 mg/ml) and b-actin (Santa Cruz Biotech-
that were tested on two diagnostic cohorts of in total 91                nology, sc-47778, 1:500).
COVID-19 suspected individuals. Based on our results and                     Cell Treatment and Lysis—Details of cell culture conditions, the
examples from the emerging literature, we critically project             generation of a cell line expressing ACE2, and virus growth and virus
and discuss the merits of MS-based proteomics for SARS-                  titer and cell viability assays are specified in supplemental Methods.
CoV-2 research and testing.                                              For investigation of the host cell response to the virus, 10e6 Vero E6
                                                                         cells were infected with mock or SARS-CoV-2-MUN-IMB-1 strain at
                                                                         a MOI of 3 or 0.1, and triplicates of each condition were lysed 24 h
                   EXPERIMENTAL PROCEDURES
                                                                         post infection. Supernatant of infected Vero E6 cells was collected
   Experimental Design and Statistical Rationale—The rationale of        48 h post infection using a MOI of 0.01 and spun twice at 1000 3 g
the experimental design is described in more detail in the respective    for 10 min All cells were lysed in SDS lysis buffer (2% SDS in 40 or
method and result sections and in the supplemental Methods. In           50 mM Tris/HCl pH 7.6), and virus-containing cell lysates and super-
brief, we first aimed to characterize the protein expression profiles of   natant were heated at 95°C for 5 to 10 min before storage at 280°C.

1504 Mol Cell Proteomics (2020) 19(9) 1503–1522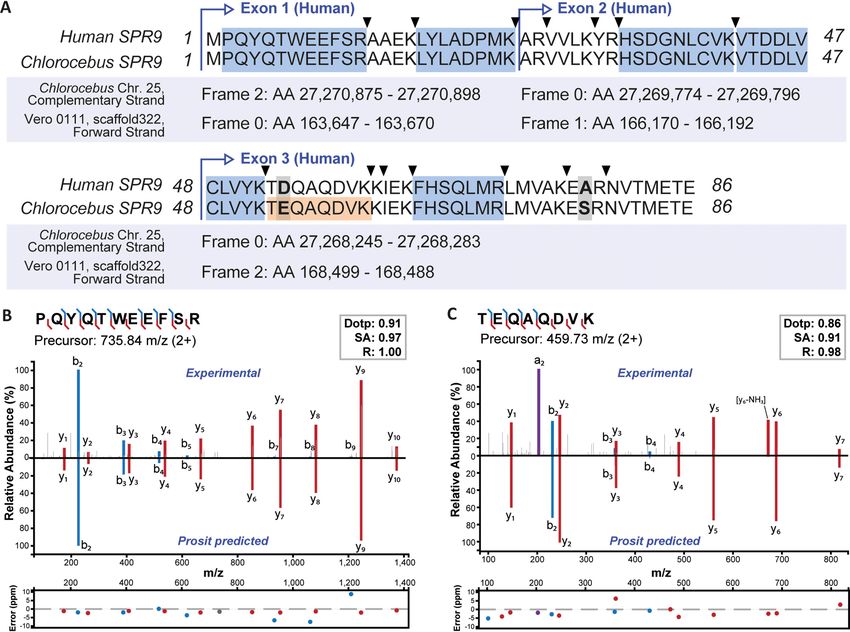
Proteomics for SARS-CoV-2 Research and Testing

   SP3 Protein Digestion, TMT Labeling and Fractionation of Cell            ethics committee of the University Hospital “rechts der Isar” of the
Line Samples—To hydrolyze DNA and reduce viscosity, cell lysates            Technical University of Munich. Person identification was not re-
were heated at 95°C for 5 min and TFA was added to a final concen-           corded, and only SARS-CoV-2 proteins were investigated. For nano-
tration of 1% (9). Quenching was performed using 3 M Tris, pH 10            flow PRM analysis of clinical cohort 1, 15 ml of residual material from
(final concentration of ;195 mM, pH 7.8). Protein concentration was          testing of 52 diagnostic samples was mixed 3:1 with 43 Novex
determined using the Pierce BCA Protein Assay Kit (Thermo Scientific).       NuPAGE LDS sample buffer containing 40 mM DTT and used as
Proteins were cleaned up and digested using the SP3 method on               input for in-gel digestion using 250 ng trypsin. Isotopically labeled
an automated Bravo liquid handling system (Agilent) as previously           SARS-CoV-2 peptide mix (;5 fmol/injection), PROCAL retention time
described (10) with minor modifications, details of which are specified       peptides and iRT peptides were spiked into all 52 clinical samples
in the supplemental Methods. In brief, 1 mg of a 1:1 mix of two types       directly before measurement. For the micro-flow PRM measurements
of carboxylate beads (cat# 45152105050250 and 65152105050250,               of cohort 1, in total 50 ml of each sample were mixed with 43 LDS
GE Healthcare), 200 mg of protein digest (120 mg for Vero E6 measured       sample buffer containing 40 mM DTT, added to two gel pockets, and
with ion trap MS2 method) and a 1:50 trypsin-to-protein ratio for over-     combined after digestion using 500 ng trypsin per gel lane. For
night digestion at 37 °C were used. Peptides were desalted using RP-        cohort 2, up to 300 ml of 39 nasopharyngeal swab samples were
S cartridges (5 ml bed volume, Agilent) and the standard peptide            dried down and resuspended in 25 ml of 23 Novex NuPAGE LDS
cleanup v2.0 protocol on the AssayMAP Bravo Platform (Agilent, wash         sample buffer containing 10 mM DTT before subjection to in-gel
solvent: 0.1% FA; elution solvent: 0.1% FA in 70% ACN). Triplicates of      digestion using 1 mg of trypsin. Before micro-flow PRM measure-
SARS-CoV-2 infected Vero E6 cells (30 mg of peptides per replicate)         ment, heavy SARS-CoV-2 peptides (;50 fmol/injection), PROCAL,
were labeled with 9 channels of TMT10plex reagent kit (Thermo Scien-        and iRT peptides were spiked into all samples. For the nano-flow

                                                                                                                                                        Downloaded from https://www.mcponline.org at TU MÜNCHEN on January 11, 2021
tific, channel 127N was omitted) according to our previously published       setup, all peptides corresponding to 5 ml of the original sample were
protocol (11) with minor modifications as specified in the supplemental       used, whereas for micro-flow analyses a quantity corresponding to
Methods. After vacuum drying, TMT-labeled peptides were dissolved           46.4 ml of the original sample was injected into the MS (equivalent to
in 0.1% FA and desalted by the AssayMAP Bravo Platform (Agilent) as         the input amount for standard RT-PCR diagnostic analysis). As nega-
described above. For off-line high pH reversed phase (RP) fractionation     tive/blank controls, empty gel lanes were processed and analyzed in
of label-free and TMT-labelled cell lines, a Dionex Ultra 3000 HPLC         parallel with all clinical samples.
system equipped with a Waters XBridge BEH130 C18 column (3.5 mM               Setup of PRM Assays for ACE2, TMPRSS2, and SARS-CoV-2
2.1 3 150 mm) was operated at a flow rate of 200 ml/min with a con-          Proteins—All PRM assays were designed in accordance with the
stant 10% of 25 mM ammonium bicarbonate (pH = 8.0) in the running           Tier 3 guidelines for targeted assay development (12, 13). In addition,
solvents. Nonlabeled peptides (200 mg) were separated using a               isotopically labeled reference peptides were used for detection of
57 min linear gradient from 4 to 32% ACN in ddH2O followed by               SARS-CoV-2 derived peptides to achieve maximally confident identi-
a 3 min linear gradient up to 85% ACN. For TMT-labeled pep-                 fication. A more detailed description of different PRM assays can be
tides, a 57 min linear gradient from 7 to 45% ACN in ddH2O fol-             found in the supplemental Methods section. In brief, peptides for
lowed by a 6 min linear gradient up to 80% ACN was employed.                ACE2 and TMPRSS2 were selected based on most intense peptides
Forty-eight fractions were collected every half minute from minute          in data dependent acquisition (DDA) measurements of high pH RP
3 to 51 and pooled discontinuously into 48 fractions (fraction 1 1          fractions. For monkey proteins, peptides that are identical or corre-
49, fraction 2 1 50, and so on). Peptide fractions were frozen at           spond to a human peptide that has been identified in any of the
280°C and dried by vacuum centrifugation.                                   human cell lines were additionally included. In total, 15/6/9/6 peptide
  Sample Preparation of a Supernatant from SARS-CoV-2 Infected              sequences were targeted for human ACE2/TMPRSS2/monkey ACE2/
Vero E6 Cells—Supernatant of SARS-CoV-2 infected Vero E6 cells,             TMPRSS2 proteins. Spectral libraries were built from experimental
which contained 2e6 virions (infectious virus particles) per ml as          spectra of deep proteome measurements and predicted spectra
measured by plaque assay, was used to evaluate SP3-based, in-gel            using Skyline (version 20.1.1.83) (14) and the Prosit 2019 algorithm
and in-solution digestion in urea buffer for the detection of SARS-         (15) and are available for download from Panorama Public (16)
CoV-2 derived peptides (see supplemental Methods for details). Fur-         (https://panoramaweb.org/SARS-CoV-2.url). For peptides that have
ther, a dilution series was prepared from the virus supernatant sam-        not been identified in DDA runs, retention time was predicted using
ple in 8 steps (15, 5, 1.5, 0.5, 0.15, 0.05, 0.015, and 0.005 mg of total   Prosit.
protein amount). Dilutions were used as input for the in-gel digestion         SARS-CoV-2 peptide selection started with the in silico tryptic diges-
workflow by mixing them 1:1 with 43 Novex NuPAGE LDS sample                  tion of the Uniprot derived SARS-CoV-2 proteome (UP000464024, 14
buffer (Invitrogen) containing 20 mM DTT. Samples were run 1 cm             entries, last modified on 22nd of March 2020). In total, 113 peptides
into a 4–12% Bis-Tris-protein gel using 13 MOPS SDS running                 representing 11 proteins met our selection criteria. All peptides
buffer (Novex NuPAGE, Invitrogen). Reduction, alkylation, and over-         were synthesized as SpikeTidesTM in isotopically labeled form
night digestion of proteins (using 250 ng trypsin) were performed           (JPT Peptide Technologies) and pooled into a single peptide mix.
according to standard in-gel procedures. In parallel, gel bands             Spectral libraries of 98 confidently detected peptides (MaxQuant
loaded with sample buffer only were processed representing “blank”          score . 50) containing high-quality reference spectra and reten-
samples. The identical amount (;15 fmol) of isotopically labeled            tion time information were built from experimental spectra of syn-
SARS-CoV-2 peptide mix was added to all 9 samples. Subsequently,            thetic peptides and predicted spectra using Skyline and the Prosit
one-third of the sample was measured by nano-flow and two-third              algorithm and are available for download from Panorama Public
by micro-flow PRM targeting 23 and 21 SARS-CoV-2 peptides,                   (16) (https://panoramaweb.org/SARS-CoV-2.url). The assay panel
respectively.                                                               was further refined for the detection of SARS-CoV-2 in respiratory
   Sample Preparation of Respiratory Specimens—Details on the               specimens using supernatant sample and based on uniqueness
collection of respiratory specimens and the determination of their vi-      for SARS-CoV-2 and the highest endogenous PRM-MS2 signal
rus load in genome equivalents (geq) via RT-PCR are given in the            using the top 6 fragment ions from the spectral library. Finally, we
supplemental Methods. In this study, 91 specimens that were col-            derived a panel of 23/21 optimal PRM assays for SARS-CoV-2
lected as part of the standard diagnostic testing and would normally        detection using nano-/micro-flow PRM and a 50/15-min linear
be discarded were used. Approval to do so was granted by the                gradient.

                                                                                       Mol Cell Proteomics (2020) 19(9) 1503–1522             1505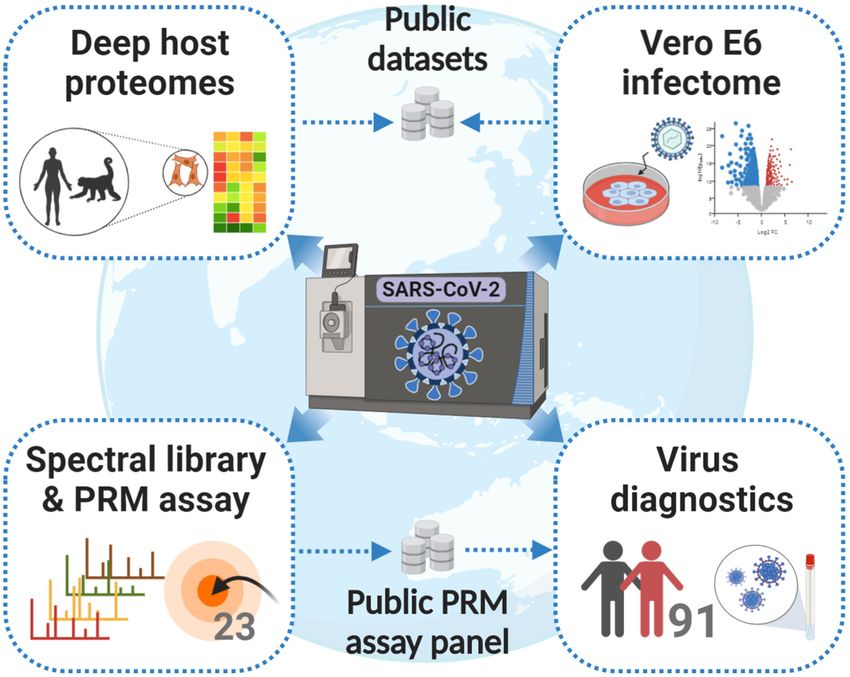
Proteomics for SARS-CoV-2 Research and Testing

                    LC–MS/MS Measurements                                Maisch) applying a flow rate of 300 nl/min and separated using a 50
                                                                         min linear gradient from 4 to 32% nano-flow solvent B (0.1% FA and
   Label-Free Cell Line Proteomes—For LC-ESI-MS/MS measure-
                                                                         5% DMSO in ACN) in A (0.1% FA in 5% DMSO). A NSI source was
ment of deep-scale proteomes, a Dionex UltiMate 3000 RSLCnano
                                                                         used. Full scan MS1 spectra were recorded in the OT from 360 to 1300
System equipped with a Vanquish pump module and coupled to a
                                                                         m/z at 60 k resolution using an AGC target value of 4e5 charges and a
Fusion Lumos Tribrid mass spectrometer (Thermo Fisher Scientific)
                                                                         maxIT of 50 ms. The top 20 precursors were selected for fragmentation
was operated under micro-flow conditions as we described recently
                                                                         and MS2 spectra were acquired after HCD fragmentation with 30%
(17). Peptide fractions were dissolved in 1% FA containing 500 fmol
                                                                         NCE and using an isolation window of 1.3 m/z, AGC target value of
of PROCAL peptides per injection, and the total fraction correspond-     5e4, and maxIT of 22 ms. Dynamic exclusion was set to 20 s. For
ing to ;3.75 to 5 mg peptides was injected directly onto a commer-       micro-flow measurements, no RT peptides were spiked. Measurements
cially available Acclaim PepMap 100 C18 LC column (2 mM particle         were performed using a 15 min gradient as specified above with follow-
size, 1 mm ID 3 150 mm; Thermo Fisher Scientific). Peptides were          ing modifications: MS1 scan range was set from 360 to 1860 m/z and
separated at a flow rate of 50 ml/min using a 15 min linear gradient of   RF-lens level to 50%. MS2 spectra were recorded at 60 k resolution
3 to 28% micro-flow solvent B (0.1% FA and 3% DMSO in ACN) in             with a fixed first mass of 100 m/z and using a maxIT of 118 ms and an
micro-flow solvent A. The Fusion Lumos was operated in DDA and            intensity threshold of 2e4 charges. Cycle time was set to 1.1 s and no
positive ionization mode using an H-ESI source. All four cell lines      dynamic exclusion was specified.
were measured employing a high-resolution orbitrap (OT) method to
                                                                            PRM LC–MS/MS Measurements—A more detailed description
obtain high-quality MS2 scans. In brief, full scan MS1 spectra were
                                                                         of targeted measurements including pre-runs for developing the final
recorded in the OT from 360 to 1,300 m/z at 60 k resolution using an
                                                                         SARS-CoV-2 PRM assay can be found in the supplemental Methods.

                                                                                                                                                  Downloaded from https://www.mcponline.org at TU MÜNCHEN on January 11, 2021
automatic gain control (AGC) target value of 4e5 charges and a maxi-
                                                                         In brief, nano-flow PRM measurements were performed using a 50
mum injection time (maxIT) of 50 ms. The RF-lens level was set to
                                                                         min linear gradient as described above for the spectral library gener-
40%. MS2 spectra were acquired in the OT at 15 k resolution after
                                                                         ation but operating the Fusion Lumos in PRM mode. Targeted MS2
higher energy collisional dissociation (HCD, 32% normalized collision
                                                                         spectra were acquired at 60 k resolution within 100–2000 m/z, after
energy (NCE)) and using an AGC target value of 1e5 charges, a
                                                                         HCD with 30% NCE, and using an AGC target value of 4e5 charges,
maxIT of 25 ms, an isolation window of 1.2 m/z, and an intensity
                                                                         a maxIT of 118 ms and an isolation window of 1.3 m/z. The number
threshold of 2.5e5. The ‘inject beyond’ functionality was enabled to
                                                                         of targeted precursors was adjusted to a cycle time of at maximum 2
use available parallelizable time. The cycle time was set to 0.6 s and
                                                                         s. For the PRM analysis of the dilution series samples and nasopha-
the dynamic exclusion lasted for 12 s. Workflow replicates of Vero        ryngeal swab samples, 23 optimal SARS-CoV-2 peptide precursors
E6 and ACE2-A549 cells were additionally analyzed with a faster, but     plus 11 iRT peptide precursors were targeted within a single PRM
lower resolution ion trap (IT) method with the following modifications    measurement and with a 6 min scheduled retention time window.
compared with the OT method: Full scan MS1 spectra were                  Micro-flow PRM measurements were performed using a 15 min lin-
recorded in the OT at 120 k resolution. MS2 spectra were acquired        ear gradient as described above. In contrast to targeted nano-flow
in the IT using the rapid scan mode after precursor isolation using an   measurements, targeted MS2 spectra were acquired after HCD with
isolation window of 0.4 m/z, an AGC target value of 1e4, a maxIT of      32% NCE and using an AGC target value of 1e5 charges. The num-
10 ms, and an intensity threshold of 5e4 charges.                        ber of targeted precursors was adjusted to a cycle time of at maxi-
   TMT-Labeled Infectome—For MS3-based measurements of                   mum 0.9 s. In total, 21 SARS-CoV-2 peptides or 21/15 human/mon-
TMT-labeled Vero E6 peptides, the following parameters were              key ACE2 and TMPRSS2 peptides were targeted in 1 min wide
adjusted compared with the deep-scale proteomic analysis with IT         transition windows except for peptides for which no experimental
readout as described above: A 25 min linear gradient from 4 to 32%       retention time was available (monkey TMPRSS2 peptides not map-
micro-flow solvent B in A was applied. The scan range was                 ping to the human sequence) in which case 2 min wide transition
increased from 360 to 1560 m/z and the RF-lens level to 50%. IT-         windows were employed. No peptides for retention time calibration
MS2 spectra for peptide identification were acquired after collisional    were scheduled for fragmentation, but PROCAL peptides were
dissociation (CID) by resonance activation in the IT for 10 ms with a    spiked into samples to use MS1 chromatogram information.
q-value of 25 and using an isolation window of 0.6 m/z. To obtain           DDA Database Searching—Peptide and protein identification and
quantitative information on TMT reporter ions, each peptide precur-      quantification for DDA type of experiments was performed using
sor was fragmented again as for MS2 analysis followed by synchro-        MaxQuant (v1.6.3.4) with its built-in search engine Andromeda (19).
nous selection of the up to 8 most intense peptide fragments in the      Tandem mass spectra derived from human cell lines were searched
IT (18) and further fragmentation via HCD using a NCE of 55%. The        against the human reference proteome (UP000005640, 96,821 entries
MS3 scan was recorded in the OT at 50K resolution (scan range            including isoforms, last modified on 15th of Jan 2020). For Vero E6
100–1000 m/z, isolation window of 1.2 m/z, AGC of 1e5 charges,           derived raw data, UniProtKB sequences for the taxonomy Chlorocebus
maxIT of 86 ms). The cycle time was 1.2 s and the dynamic exclu-         (20,699 entries including isoforms, downloaded on May 12, 2020) and
sion lasted for 50 s.                                                    RefSeq sequences for the species Chlorocebus sabaeus (61,803
   SARS-CoV-2 Spectral Library Generation—High-quality spectral          entries, downloaded on the May 4, 2020) were used. For the baseline
libraries for SARS-CoV-2 peptides were generated for both nano-          proteomes of Vero E6 cells, Chlorocebus sequences were supple-
flow and micro-flow systems using a synthetic SARS-CoV-2 peptide           mented with the human reference proteome to enable proteomics-
mix. Nano-flow DDA LC-ESI-MS/MS measurements were performed               guided genome refinement. Spectra from SARS-CoV-2 containing
on a Dionex UltiMate 3000 RSLCnano System (Thermo Fisher Scien-          samples were additionally searched against the UniProtKB SARS-
tific). Synthetic peptides were dissolved in 0.1% FA in 2% ACN and        CoV-2 proteome (UP000464024, 14 entries, last modified on March
PROCAL and iRT peptides were spiked for retention time calibration.      22, 2020) supplemented with recently reported novel ORFs (20). Fur-
Peptides were delivered to a trap column (75 mM 3 2 cm, packed in-       ther, common contaminants and, where applicable, retention time pep-
house with 5 mM C18 resin; Reprosil PUR AQ, Dr. Maisch) and              tides were added to all searches. For label-free samples, the experi-
washed using 0.1% FA at a flow rate of 5 ml/min for 10 min Subse-         ment type was left in default settings, whereas 10plex TMT was
quently, peptides were transferred to an analytical column (75 mM 3      specified as isobaric label within a reporter ion MS3 experiment type
45 cm, packed in-house with 3 mM C18 resin; Reprosil Gold, Dr.           for TMT-labeled Vero E6 samples. Isotope impurities of the TMT lot

1506 Mol Cell Proteomics (2020) 19(9) 1503–1522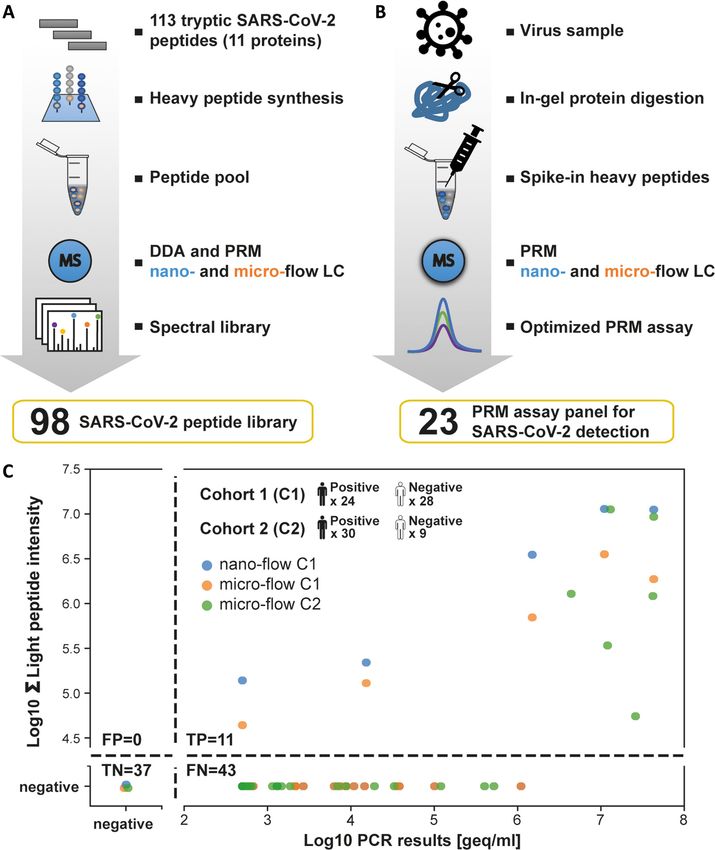
Proteomics for SARS-CoV-2 Research and Testing

(#TE268169) were specified to allow MaxQuant the automated correc-            was applied. In the clinical cohorts, positive peptide detection
tion of TMT intensities. The MaxQuant searches of the DDA data               additionally required a correlation of fragment ion intensities
obtained from the isotopically labeled synthetic peptide mixes were          between the light and heavy (spike-in) peptide (“DotProductLight-
performed by selecting Arg10 (C-terminal), Lys8 (C-terminal) and Lys7        ToHeavy”) of more than 0.9. Total protein or virus intensity per
(anywhere) as variable modifications. For all searches, carbamidome-          cell line or clinical sample was computed by summing up all light
thylated cysteine was set as fixed modification and oxidation of methi-        peptide intensities detected positive in each sample. Uniqueness
onine and N-terminal protein acetylation as variable modifications.           of SARS-CoV-2 peptides was assessed against a nonredundant
Trypsin/P was specified as the proteolytic enzyme with up to two              protein database including entries from GenPept, Swissprot, PIR,
missed cleavage sites allowed and absolute quantification by iBAQ             PDF, PDB, and RefSeq (downloaded on May 3, 2020 from https://
was enabled. Precursor tolerance was set to 64.5 ppm and fragment            ftp.ncbi.nlm.nih.gov/blast/db/FASTA/nr.gz).
ion tolerance to 620 ppm and 60.35 Da for OT and IT spectra,
respectively. Matching was enabled only between fractions of the                                         RESULTS
same proteome (5 min alignment window, 0.2 min matching window).
Default score cutoffs were used requiring a minimal Andromeda score            Proteomes of Cellular Model Systems for SARS-CoV-2
of 40 and a delta score of 6 for modified peptides. Results were              Research—A number of cell lines are recurrently used for
adjusted to 1% peptide spectrum match and 1% protein false discov-           research on coronaviruses including the human epithelial
ery rate (FDR) employing a target-decoy approach using reversed pro-         lung cancer cell line Calu-3, the human epithelial colorectal
tein sequences. Protein quantification was obtained from the summed
area under peptide elution profiles for label-free samples or from            adenocarcinoma cell line Caco-2, and the epithelial renal cell

                                                                                                                                                 Downloaded from https://www.mcponline.org at TU MÜNCHEN on January 11, 2021
summed peptide reporter intensities for TMT-labeled samples.                 line Vero E6 established from the African green monkey
   Data Analysis—Details on the exemplary refinement of the gene              (Chlorocebus sabaeus). We created a further cell line on the
annotation of the Chlorocebus sabaeus genome are specified in the             basis of the human alveolar basal epithelial adenocarcinoma
supplemental Methods and the respective results sections.                    cell line A549 that stably expresses HA-tagged human angio-
   Cell Line Full Proteomes—Absolute protein quantification was               tensin-converting enzyme 2 (ACE2), a cell surface protein
derived from iBAQ values (intensity-based absolute quantification of
proteins, according to Schwanhausser et al. (21)) as provided by the
                                                                             generally considered important for entry of coronaviruses
MaxQuant software. Hits to the reverse and contaminant database              into host cells (6). To characterize these model systems in
were removed. To correct for different loading amounts of the four           terms of protein expression and to enable the construction of
different cell lines and enable comparison of protein expression lev-        spectral libraries, we generated deep-scale proteomic pro-
els, iBAQ values were normalized by median centering. A list of 332
                                                                             files of these cell lines using a workflow consisting of SDS
confident interactors published by Gordon et al. (2) was mapped to
our cell line data based on gene names. To determine potential virus         lysis and SP3 digestion on a robotic work station (10), off-line
interactors that exhibited the most differential expression across the       peptide separation into 48 fractions using high pH reversed
four cell lines, first the ratio of the iBAQ in one cell line to the median   phase chromatography, online analysis of each fraction using
iBAQ across all four cell lines was calculated for each potential inter-     15 min gradients on a micro-flow LC (17) coupled to an Orbi-
actor. The top 5% of proteins showing the highest deviation from the
                                                                             trap Lumos instrument with high-resolution precursor and
median were categorized as differentially expressed. All analyses
were performed using R (version: 3.6.0) and heat maps were plotted           fragment ion detection and protein quantification by the iBAQ
with the help of the R package pheatmap.                                     approach (21). After filtering the data for 1% peptide and pro-
   Virus-Dose Experiment—A more detailed description of the anal-            tein false discovery rate (FDR), a total of 9,661, 10,071, 9,648
ysis of the SARS-CoV-2 infected Vero E6 cells can be found in the            and 9,901 proteins (136,082, 149,595, 134,050, 129,540 pep-
supplemental Methods. In brief, hits to the reverse and contaminant          tides) were identified for Calu-3, Caco-2, ACE2-A549 and
database were removed. Reporter ion intensities of multiplexed
mock and SARS-CoV-2 treated Vero E6 samples were normalized
                                                                             Vero E6 cells respectively (Fig. 1A; supplemental Table S1).
for mixing errors based on the total sums of peptide intensities in          Workflow replicates analyzed by ion trap MS2 showed good
each channel. The Perseus software suite (v.1.6.14.0) was used to            correlation of MS1 intensities (r = 0.88 for ACE2-A549; r =
perform correlation analysis, principal component analysis, two-sided        0.72 for Vero E6) and comparable figures for protein and
Student’s t-tests, clustering, Fisher’s exact tests, and functional 2D
                                                                             peptide identifications (10,289/165,745 for ACE2-A549 and
enrichments (22). For comparison of our data with a published virus-
host response study in Caco-2 (3), their provided supplemental data          9905/128,980 for Vero E6; supplemental Fig. S1A, S1B).
on expression changes 24 h post infection with SARS-CoV-2 at 1                  Even though the protein expression data measured by
MOI were re-analyzed for significantly changing proteins analogous            data dependent acquisition (DDA) covers six orders of magni-
to our data. All annotations were mapped to our data set based on            tude of dynamic range, ACE2 could be identified only in
gene names.
                                                                             ACE2-A549 and Vero E6 cells but not in Calu-3 and Caco-2
   PRM Data Analysis—Details of the PRM data analysis are given
                                                                             cells. The protein could be detected in the latter two cell lines
in the supplemental Methods. In brief, nano-flow and micro-flow
PRM data were analyzed using the Skyline-daily (64-bit) software             by parallel reaction monitoring (PRM; not by western blotting)
(version 20.1.1.83) (14) and reviewing peak integration, transition          but their levels were .1000 lower than in ACE2-A549 cells
interferences and integration boundaries manually. Five to seven             (Fig. 1B–1D; supplemental Fig. S1C; supplemental Table S1).
transitions per peptide were considered. To discriminate between             A similar observation was made for TMPRSS2, which was
positive and negative ACE2 and TMPRSS2 peptide detection, filtering
according to mass accuracy (max. 64 ppm) and correlation of fragment
                                                                             not detected in ACE2-A549 and Vero E6 cells by DDA or
ion intensities between the light (endogenous) SARS-CoV-2 peptide            PRM. Other proteins discussed as viral entry factors such
and the experimental library spectrum (“Library Dot Product” . 0.85)         as TMPRSS4, CTSB, CTSL, BSG and FURIN (23–26) also

                                                                                       Mol Cell Proteomics (2020) 19(9) 1503–1522       1507
Proteomics for SARS-CoV-2 Research and Testing
Downloaded from https://www.mcponline.org at TU MÜNCHEN on January 11, 2021
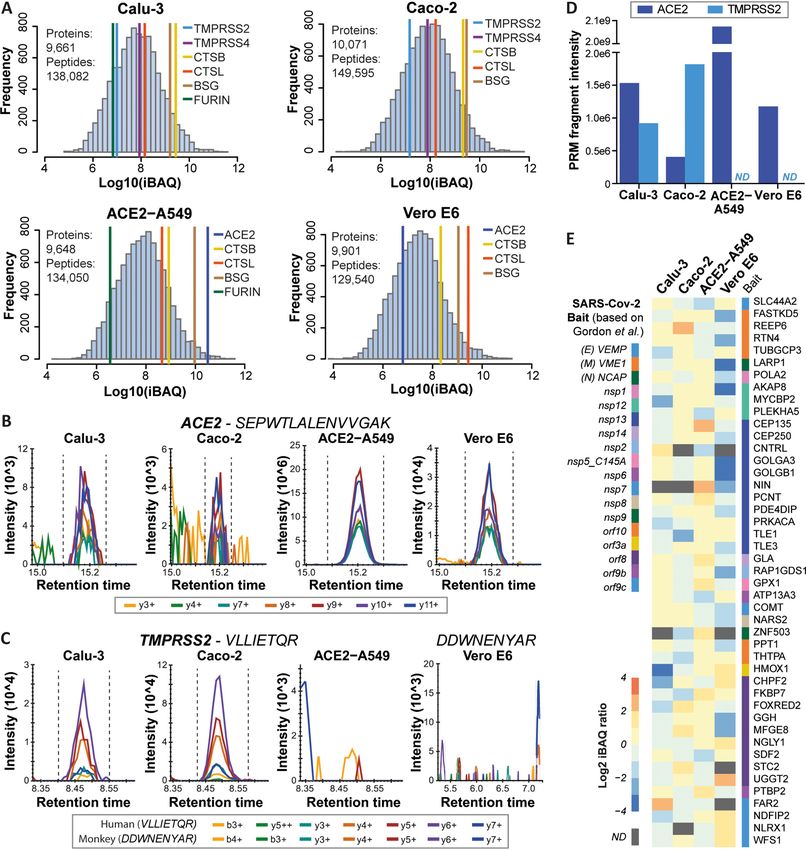
FIG. 1. Deep proteome profiling of four model cell lines used for SARS-CoV-2 research. A, Protein abundance distributions for human
Calu-3, Caco-2, and ACE2-A549, and African Green Monkey Vero E6 cells. Abundances of proteins thought to be involved in viral entry into host
cells are marked. B, PRM transitions for a peptide shared among human and monkey ACE2 in the four model cell lines. C, Same as (B) but for a
human and a monkey TMPRSS2 peptide. D, Bar chart showing summed PRM-MS2 intensities of confidently detected peptides for ACE2 and
TMPRSS2 in the four model cell lines. Please note that intensities for human and monkey ACE2 are not directly comparable because in part differ-
ent peptides were targeted (ND: not detected). E, Heat map showing the abundance of 45 high-confidence interactors of SARS-CoV-2 proteins
according to Gordon et al., which are also differentially expressed across the four cell lines used in the current study (see supplemental Fig. S2B
for details).
1508 Mol Cell Proteomics (2020) 19(9) 1503–1522Proteomics for SARS-CoV-2 Research and Testing
showed substantial differences in expression levels between intensities, and their distributions were identical to the shared
cell lines. The apparent lack of co-expression of ACE2 and peptides (supplemental Fig. S3C, S3D) indicating that these
TMPRSS2 in ACE2-A549 and Vero E6 was unexpected as matches should be trustworthy and indeed represent Chloro-
both proteins have been reported to act in concert to facili- cebus encoded proteins. Such peptides may, therefore,
tate viral entry. cover genes or exons that were overlooked during Chloroce-
The cell line proteomes also cover 311 of the 332 high- bus genome annotation, result from mistakes in splicing of
confidence interactors of a recently published SARS-CoV-2 the predicted monkey exons in silico, represent single nucle-
protein interactome performed in HEK293 cells (2). Most of otide variants (SNVs) in the genes of the Vero E6 cell culture
these proteins showed rather uniform expression patterns used in this study, or reflect errors in monkey genome
between cell lines, but some differed more than 10-fold in sequencing or assembly.
abundance (e.g. HMOX1, GOLGA3; Fig. 1E; supplemental An example for a missed gene is SRP9 (signal recognition
Fig. S2A, S2B; supplemental Table S1). Therefore, one might particle 9 kDa protein), a small protein involved in targeting
expect that viral interactomes may also differ somewhat secretory proteins to the rough endoplasmic reticulum mem-
between cell types. In our laboratory, Vero E6 and ACE2- brane. The database search identified five peptides that
A549 cells were readily infectable by a SARS-CoV-2 GFP-re- matched the human sequence but none identified a Chloro-
porter virus (27). Caco-2 cells showed much less viral sus- cebus sequence in Uniprot, RefSeq or a list of predicted pro-
Downloaded from https://www.mcponline.org at TU MÜNCHEN on January 11, 2021
ceptibility and no productive infection could be obtained for teins for the Vero JCRB0111 cell line (kindly provided by
Calu-3 cells (supplemental Fig. S2C). The ability to infect dif- Naoki Osada and Kentaro Hanada). A search of these pep-
ferent host cells depends on many factors and our baseline tides against six-frame translations of the Chlorocebus or
proteomes may become useful resources for addressing this Vero JCRB0111 genomes identified all five peptides. We
question by more specialized experiments. then aligned the human protein sequence with the 6-frame
Proteomic Annotation of the Chlorocebus Genome in Vero E6 translations to generate a new gene model for this protein
Cells—Most proteomic researchers rely on Uniprot and, to a (Fig. 2A), which is 98% identical to the human sequence
lesser extent, on RefSeq for the provision of high-quality, (100% identity between Chlorocebus and Vero JCRB0111).
annotated protein sequences. Both resources currently con- Adding this newly predicted protein to the Chlorocebus fasta
tain ;20,000 entries for Chlorocebus sabaeus, only six of file and searching the LC–MS/MS data again led to the iden-
which have been reviewed by Uniprot. Instead, almost all tification of one additional peptide that contains a Glu at
annotated sequences are predictions based on the published position 54 in Chlorocebus instead of an Asp in human. The
Chlorocebus sabaeus genome (28). The Vero E6 genome has validity of peptide assignments was confirmed by mirror
not been sequenced yet. Published genome information is mass spectra comparing the experimentally obtained tandem
available for a related cell line (Vero JCRB0111) (29), but no MS spectrum to that predicted by the artificial intelligence
annotated list of protein-coding regions is included. To inves- Prosit (15) (Fig. 2B, 2C).
tigate which Chlorocebus genes exist as proteins and to We also identified an example for overlooked exons rep-
examine if orthologs of human genes may have been missed resented by the breast cancer type 1 susceptibility protein
or only partially found, we searched the .600,000 high-reso- (BRCA1, supplemental Fig. S4). Peptide hits to the human
lution tandem mass spectra collected from Vero E6 protein sequence indicated that the large exon 9 was missing in
digests against protein sequences from Uniprot_Chloroce- the deposited Chlorocebus protein sequence, whereas the
bus, RefSeq_Sabeus and Uniprot_Human. This led to the small exons 2, 4, 5, 6, and 7 were absent in the Vero
identification of 9840 proteins represented by 127,669 pep- JCRB0111 protein sequence. Refining the gene models as
tides that mapped to Chlorocebus sequences providing clear described above resulted in 41 peptides that mapped along
protein level evidence for the transcription and translation of the entire Chlorocebus/Vero BRCA1 sequence and identi-
the underlying genes (supplemental Fig. S3A). This proteomic fied one peptide that was specific for Vero JCRB0111 and
coverage is like the ones obtained for the human cell lines one for Chlorocebus. Together, the above analysis clearly
indicating that the overall annotation of the Chlorocebus shows that the human and Green monkey BRCA1 proteins
genome for protein-coding regions is already quite good. are of similar size and highly related to each other. Although
However, the search also identified 61 proteins and 1871 not systematically investigated here, there are likely further
peptides that exclusively mapped to human sequences (sup- examples of single amino acid variants (SAAVs), missing
plemental Fig. S3A). Some of these may be trivially explained exons or missing genes in the data set. Hence, a future
by false matches to the human database given the 1% FDR extension of this work could be the searching of the provided
filters applied, notably proteins supported by one or two pep- high-quality LC–MS/MS data collected for the Vero E6 cell
tides only. However, several human-only proteins were iden- line against six-frame translations of the entire Chlorocebus
tified with many peptides (in one case 29 peptides; supple- or Vero cell line genomes. This would enable a more system-
mental Fig. S3B). Also, the list contained many human-only atic proteogenomic annotation of the African green monkey
peptides with very high Andromeda scores and strong MS1 genome.
Mol Cell Proteomics (2020) 19(9) 1503–1522 1509Proteomics for SARS-CoV-2 Research and Testing
Downloaded from https://www.mcponline.org at TU MÜNCHEN on January 11, 2021
FIG. 2. Proteomics-guided annotation of a missed gene in the Chlorocebus genome. A, Alignment of the human SRP9 protein sequence
with its Chlorocebus ortholog constructed from a six-frame translation of the genomic Chlorocebus and Vero JCRB0111 (Vero 0111) sequences.
Peptides in blue map to all, the human, the Chlorocebus, and the Vero JCRB0111 sequences. The peptide coloured in orange is unique for Chloro-
cebus and Vero JCRB0111 and was only identified in a refined search including the newly annotated monkey SRP9 sequence. Triangles indicate
trypsin cleavage sites and bold-face letters mark amino acid differences between the sequences. B, Mirror and m/z deviation plots of the experi-
mental spectrum and the Prosit predicted spectrum for the N-terminal peptide of the human and Chlorocebus protein sequence. The similarity of
the two spectra is measured by the dot product (dotp), the spectral contrast angle (SA) and the Pearson correlation coefficient (R) of the two spec-
tra. C, Same as in (B) but for the peptide that is unique for the Chlorocebus and Vero JCRB0111 sequences of SRP9.
Proteomic Response of Vero E6 Cells on Infection with SARS- labeled by tandem mass tags (TMT), combined into a TMT-9-
CoV-2—Viruses turn host cells into virus producing factories. plex peptide pool, and processed as described above. Relative
Although the Vero E6 cell line is not a physiological model, it peptide quantification was performed using the synchronous
is used frequently in virus research. Their impairment in precursor selection (SPS)-based MS3 approach (18). This led to
proper antiviral immunity because of e.g. their intrinsic defi- the highly reproducible (Pearson R . 0.98 for all TMT channels)
ciency in mounting an appropriate interferon response (owing identification and quantification of 7,287 proteins in at least two
to a 9-Mb deletion on chromosome 12 that contains the type replicates of each condition supported by 68,778 peptides
I interferon gene cluster (29)) makes Vero E6 cells applicable (supplemental Fig. S5A, S5B, supplemental Table S2).
to studying many different viruses. To generate proteome- As one would expect, viral proteins were strongly ex-
wide information on a cell line that contains the cellular ma- pressed 24 h post infection (Fig. 3A). We detected 8 of the
chinery required for highly efficient virus growth, we infected canonical viral proteins but found no evidence for expression
Vero E6 cells with SARS-CoV-2 using two different doses of alternative proteins predicted by a recent study (20). The
(mock, MOI of 0.1 and 3) and collected the proteomes 24 h detected viral proteins made up more than 1.5% of the total
post infection (each in triplicate). Digests of all samples were Vero E6 proteome with the nucleoprotein (NCAP) being by
1510 Mol Cell Proteomics (2020) 19(9) 1503–1522Proteomics for SARS-CoV-2 Research and Testing
Downloaded from https://www.mcponline.org at TU MÜNCHEN on January 11, 2021
FIG. 3. Vero E6 proteome response after infection with SARS-CoV-2. Vero E6 cells were infected with SARS-CoV-2 at 0.1 MOI, 3 MOI
and mock in triplicate and proteomes were profiled 24h post infection. A, Protein expression changes for 3 MOI versus 0.1 MOI. Annotated vi-
ral proteins are marked in blue. B, Bar chart showing the fractional abundance of viral proteins in the host cell proteome. The inset displays the
number of identified peptides per virus protein ordered by decreasing cellular abundance. C, Line charts illustrating the expression patterns of pro-
teins in the six main clusters extracted from significantly regulated proteins. Background proteins are displayed in grey. D, Functional categories
enriched in clusters determined by Fisher’s exact tests (B.H. FDR: Benjamini-Hochberg false discovery rate). E, Examples for regulated proteins
from different clusters. The dotted line indicates no change (exemplified by GAPDH).
Mol Cell Proteomics (2020) 19(9) 1503–1522 1511Proteomics for SARS-CoV-2 Research and Testing
far the most abundant protein followed by the membrane groups of regulated proteins were implicated in lipid homeo-
protein (VME1), the ion channel viroporin (accessory protein stasis, vesicle trafficking, glycosylation, and cell adhesion
3a, AP3A), the spike glycoprotein (SPIKE) and the protein 9b and contained, for instance, the apolipoprotein APOE, the
(ORF9B; Fig. 3B). Despite the detection of a total of 126 dis- phosphatidylcholine translocator ABCB4, the cholesterol
tinct peptides, the replicase polyprotein 1ab (R1AB) was of transporter GRAMD1A, the GTPase-activating protein RAL-
lower abundance than the other viral proteins but, with a me- GAPA1, the H1/Cl- exchange transporter CLCN3, the chon-
dian log10 iBAQ value of 7.0, it was still much higher droitin sulfate synthase CHSY1, and the collagens COL6A2,
expressed than the median of all Vero E6 proteins (iBAQ of 10A1, and 18A (supplemental Fig. S6B and supplemental Ta-
6.2). The data also clearly shows that a higher inoculation ble S2).
dose led to a much stronger expression of all viral proteins Next, we aligned the Vero E6 infectome generated in this
but with similar relative levels between conditions (Fig. 3B; study with a conceptually similar recent experiment per-
supplemental Fig. S5C). We observed statistically significant formed by Bojkova et al. in Caco-2 cells, in which some
expression changes of ;1500 host cell proteins and grouped 1,500 regulated proteins 24 h post SARS-CoV-2 infection
them into 6 clusters according to a consistent expression were reported (3). To be able to compare significantly regu-
behavior between the three experimental conditions (Fig. 3C; lated proteins in the two infectomes, we re-processed the
supplemental Fig. S5D–S5G; supplemental Table S2). In all Bojkova et al. data using the same statistical criteria applied
Downloaded from https://www.mcponline.org at TU MÜNCHEN on January 11, 2021
but cluster 3, we found a statistically significant enrichment to ours (Fig. 4A). Given the substantial experimental differen-
of ontologies (Fig. 3D; supplemental Fig. S6A) and further ces between the two studies (e.g. cell line, virus load, pulsed
proteins with noteworthy functional annotations (Fig. 3E; sup- SILAC versus TMT quantification), a 2-dimensional enrich-
plemental Fig. S6B). ment analysis showed only partially consistent results in that
Among significantly changing proteins, several transcrip- proteins that were up- or down-regulated in one study were
tional regulators showed up- or down-regulation on SARS- generally also up- or down-regulated in the other (Fig. 4B;
CoV-2 infection. For instance, the transcriptional repressor supplemental Fig. S8A–S8C). As mentioned above, the Vero
MIER1 and the phosphatase RPAP2, which promotes tran- E6 cell line is not a physiological model, so the substantial dif-
scription of snRNA genes by regulating the activity of the ferences in results suggest cell line-characteristic responses.
RNA polymerase II subunit POLR2A, were among the pro- As a result, more general conclusions may be drawn only by
teins exhibiting the strongest virus dose-dependent up-regu- performing further such experiments in the future and using
lation. In contrast, the G1/S specific cyclin CCND1 and the more physiologically relevant model systems.
transcription factor HIF1A – together with several other cell A comparison of our infectome with the aforementioned
cycle regulators and mediators of oxidative stress – were SARS-CoV-2 interactome performed by Gordon et al. in
strongly down-regulated at high viral loads (supplemental HEK293 cells (2) revealed that 56 interacting host proteins
Fig. S6B). The expected negative impact of viral infection on showed quantitative changes in the Vero E6 infectome (Fig.
Vero E6 cell proliferation was apparent by the fact that cell 4C; supplemental Fig. S8D). These proteins represent a mul-
confluence was decreased in a virus dose- and infection titude of different functions, and most showed small, albeit
time-dependent fashion (supplemental Fig. S7). Further, we significant regulations. However, several FDA approved drug
observed a decrease in expression of several proteins targets or proteins with active drug discovery programs
involved in innate immunity such as the cytokine SPP1, the exhibited larger regulations (e.g. CYB5R3). Some of these
growth factor GRN, and the receptor tyrosine kinase AXL (in were also differentially expressed across our four model cell
total 22 down-regulated, innate immunity-associated proteins lines (e.g. PRKACA), supporting the notion of, and providing
according to Reactome annotations; supplemental Table S2). some initial hypothesis for cell line-specific effects during
In contrast, the GTPase GBP1, which has been described to SARS-CoV-2 infection.
exhibit antiviral activity, and MASP1, a serine endopeptidase Detecting SARS-CoV-2 Proteins by Mass Spectrometry—As
and critical component of the complement system, were up- shown above, 8 of the 14 predicted proteins in the SARS-
regulated only at low viral inoculation (Fig. 3E). Moreover, CoV-2 reference proteome could be detected in Vero E6 cell
expression changes of additional proteases as well as prote- digests, notably the virus polyprotein (R1AB), the viroporin
ase inhibitors, which often also exhibit immune-modulatory ion channel (AP3A), the spike glycoprotein (SPIKE), the viral
functions and are, in part, involved in blood coagulation, membrane protein VME1, the nonstructural proteins NS6 and
were frequently observed. As an example, although ACE2 NS8, the nucleoprotein NCAP, and the alternative ORF9b
levels did not change significantly, the expression of CTSL, (Fig. 3A). We next analyzed the supernatant of virus produc-
another protein potentially involved in SARS-CoV-2 entry, ing Vero E6 cells to investigate which viral proteins may be
was down-regulated. The same applied to many protease identified from an assembled (perhaps not always fully or
inhibitors such as the metalloproteinase inhibitors TIMP1/2, functional) virus. Because cell supernatants contain substan-
the serine protease inhibitors alpha-1-antitrypsin (SERPINA1) tial quantities of proteins, metabolites and other components
and APLP2, and the cysteine protease inhibitor CST3. Other from the cell culture medium, we first compared three sample
1512 Mol Cell Proteomics (2020) 19(9) 1503–1522Proteomics for SARS-CoV-2 Research and Testing
Downloaded from https://www.mcponline.org at TU MÜNCHEN on January 11, 2021
FIG. 4. Comparison of the Vero E6 response to SARS-CoV-2 to a recently published Caco-2 infectome and a SARS-CoV-2 interactome.
A, Venn diagram illustrating the overlap of virusregulated proteins (Vero E6, Caco-2) and high-confidence SARS-CoV-2 interactors (HEK-293). The
inset shows the overlap of all quantified gene products in the two infectome studies. B, 2D enrichment analysis displaying annotation terms whose
members show consistent or divergent behaviour in the two infectomes. Only categories with a |relative regulation| .0.2 in at least one of the two
datasets are displayed. C, Heatmap showing the 56 proteins that were significantly regulated in the Vero E6 infectome and reported as high-confi-
dence interactors of SARS-CoV-2 proteins.
Mol Cell Proteomics (2020) 19(9) 1503–1522 1513Proteomics for SARS-CoV-2 Research and Testing
preparation techniques, notably the aforementioned SP3 NCAP, VME1, ORF9B, NS8) could be detected (supplemental
approach, an in-solution protocol using urea as a chaotrope Table S3).
and the classical in-gel digestion protocol. These data are To be able to perform PRM measurements on clinical ma-
summarized in supplemental Fig. S9 and show that all gave terial at a reasonable throughput, we further prioritized the
qualitatively similar results, but with differences in detail. In list of targeted peptides for best MS2 signal and uniqueness
total, five viral proteins were detected in cell culture superna- to SARS-CoV-2. The latter is important in order not to con-
tants (SPIKE, VME1, NS8, NCAP and ORF9b). As expected, fuse SARS-CoV-2 with other coronaviruses such as the four
the viral replicase and the viroporin ion channel detected in human endemic coronaviruses (229E, HKU1, NL63, and
cells could not be found in the supernatant as these are not OC43) that are often the cause of the common cold. Perhaps
part of the assembled virus. All three protocols robustly surprisingly, only 60 of the 551 tryptic peptides of the 14
detected NCAP. The protocols involving SDS denaturation SARS-CoV-2 proteins were unique when searched against a
(in-gel and SP3) better extracted the membrane proteins tryptic in silico digest of several sequence collections (all spe-
SPIKE and VME1 and gave fewer missed-cleaved peptides cies; supplemental Table S3). In addition, many of these
than the urea protocol. The in-gel and SP3 protocols were were not well detectable by PRM. This led to the selection of
not as efficient for ORF9b, and the nonstructural protein NS8 23 peptides for the final PRM assay (6 unique to SARS-CoV-
2, supplemental Fig. S10B, supplemental Table S3; see sup-
Downloaded from https://www.mcponline.org at TU MÜNCHEN on January 11, 2021
was generally not well detected. Differences in the sample
preparation protocols were more obvious at the peptide level, plement for further information). To characterize the PRM
but replicate analysis showed that each protocol yielded con- assays further, we in-gel digested dilutions of Vero E6 super-
sistent results in terms of MS signal intensity of the identified natant, spiked reference peptides at a constant concentra-
tion, and analyzed the samples by PRM (for an example see
peptides.
supplemental Fig. S11). The summed PRM signal and num-
Parallel Reaction Monitoring (PRM) Assays for SARS-CoV-2
ber of peptides supporting the detection of a viral protein
Proteins—Given the many biological sources from which
rapidly declined for total protein starting amounts of ,300 ng
samples of COVID-19 suspected individuals are taken (naso-
(micro-flow) and ,50 ng (nano-flow), respectively. In both
pharyngeal swab, bronchoalveolar lavage, blood, stool etc.)
cases, the peptide VAGDSGFAAYSR (VME1) showed the
and that these sources themselves represent complex pro-
best overall performance and marked the detection limit of
teomes, we reasoned that PRM assays including stable iso-
the PRM assay (supplemental Table S3). IBAQ analysis of
tope-labeled spike-in peptides would be required for the
DDA data for the undiluted supernatant digest estimated that
unambiguous identification of viral proteins in clinical sam-
75% of the protein in the sample is BSA, 17% correspond to
ples. Figs. 5A and 5B illustrate the two-step process for the
Vero E6 proteins, 8% are spiked standards and only ;0.4%
development and optimization of these assays. In the first
are viral proteins. The latter underscores the very high sensi-
step, we synthesized 113 stable isotope-labeled (heavy) pep-
tivity of the PRM assays.
tides that represent all theoretical tryptic (and C-terminal)
Testing Clinical Samples for SARS-CoV-2 Infection Using PRM
SARS-CoV-2 peptides with a length constraint between 7 to
Assays—With the PRM assay in hand, we tested its merits on
24 amino acids covering 11 SARS-CoV-2 proteins (supple- two diagnostic cohorts of 91 COVID-19 suspects (24 1 30
mental Table S3). DDA and PRM MS confidently detected 98 positive and 28 1 9 negative by PCR; supplemental Table
of these peptides (supplemental Fig. S10A; supplemental Ta- S4). The viral loads determined by PCR spanned six orders
ble S3). Skyline (14) was used to build experimental spectral of magnitude ranging from ;30 to 43 million geq/ml (median
libraries from generated DDA as well as PRM data processed 2400 geq). As one might expect from the way samples are
with MaxQuant (19). In addition, we also predicted a spectral collected, Coomassie blue staining of short SDS-PAGE gels
library using the artificial intelligence Prosit (15). showed large differences in the total amount of protein con-
In the second step of the PRM assay development, we tained in each sample (supplemental Fig. S12).
used supernatants of infected Vero E6 cells to generate a The first cohort was measured by nano-flow and micro-
panel of optimized PRM assays for endogenous SARS-CoV- flow PRM. For the latter, we used the same amount of start-
2 protein detection (Fig. 5B). For the reasons of proteome ing material (by volume) as was used for the PCR test. For
complexity mentioned above, we opted for the in-gel diges- the former, only 10% of this quantity could be analyzed to
tion procedure. Although this, to some extent, sacrifices make sure the trap column of the nano-LC was not over-
sample throughput, it is more robust against unknown fac- loaded. Of the 24 PCR-positive cases in the first cohort, five
tors, which turned out to be important for the analysis of were also positive by PRM on either LC–MS/MS system (Fig.
COVID-19 suspected individuals (see further below). The in- 5C). All PCR-negative cases were also negative by PRM. As
gel digested supernatant sample was spiked with the heavy the nano-flow system did not identify more positive cases,
reference peptide pool and analyzed by PRM on the nano- the second cohort was only analyzed by micro-flow PRM
flow LC–MS/MS system. Of the 98 targeted peptides, 57 en- that is robust against differences in sample loading and only
dogenous virus peptides representing 5 proteins (SPIKE, requires 20 min total analysis time compared with 70 min on
1514 Mol Cell Proteomics (2020) 19(9) 1503–1522You can also read