DEBAY SLOUGH SITE ASSESSMENT
←
→
Page content transcription
If your browser does not render page correctly, please read the page content below

DEBAY SLOUGH SITE ASSESSMENT

Emily Derenne, Habitat Restoration Specialist
Skagit County Public Works
1800 Continental Place
Mount Vernon, WA 98273
emilyjd@co.skagit.wa.us                         1900 N. Northlake Way, Suite 211
360-416-1449 office | 360-708-5045 cell                       Seattle, WA 98103

THIS PAGE INTENTIONALLY LEFT BLANK
SKAGIT COUNTY PUBLIC WORKS DEBAY SLOUGH SITE ASSESSMENT
TABLE OF CONTENTS
1 Introduction ....................................................................................................................................................... 5
2 Project Area ....................................................................................................................................................... 6
2.1.1 Memo Organization .................................................................................................................... 7
3 Project Goals and Objectives ............................................................................................................................. 7
4 Skagit River Chinook Limiting Factors ................................................................................................................ 8
5 Site Assessment and Existing Conditions Analysis ............................................................................................. 9
5.1 Topographic and Bathymetric Survey ...................................................................................................... 9
5.1.1 Methods ...................................................................................................................................... 9
5.1.2 Results ....................................................................................................................................... 10
5.2 Hydrology ............................................................................................................................................... 10
5.2.1 Methods .................................................................................................................................... 10
5.2.2 Results ....................................................................................................................................... 11
5.3 Hydraulics ............................................................................................................................................... 19
5.3.1 Methods .................................................................................................................................... 19
5.3.2 Results ....................................................................................................................................... 23
5.4 Geomorphic Assessment ....................................................................................................................... 28
5.4.1 Methods .................................................................................................................................... 28
5.4.2 Results ....................................................................................................................................... 29
5.5 Aquatic Habitat Conditions and Use ...................................................................................................... 37
5.5.1 Methods .................................................................................................................................... 37
5.5.2 Results ....................................................................................................................................... 37
5.6 Terrestrial and Wetland Habitat Conditions and Use ............................................................................ 43
5.6.1 Methods .................................................................................................................................... 43
5.6.2 Results ....................................................................................................................................... 43
6 Summary .......................................................................................................................................................... 61
6.1 Hydraulic Connectivity during Typical Seasons of Use by Fish and Wildlife .......................................... 61
6.2 Geomorphic Context -Channel Migration and Landform Stability ........................................................ 61
6.3 Riparian and Wetland Habitat Functions ............................................................................................... 62
6.4 Water Quality Conditions and Salmonid Habitat Considerations .......................................................... 62
6.5 Other Fish and Wildlife Use ................................................................................................................... 62
7 Next Steps in Feasibility Study ......................................................................................................................... 63
8 References ....................................................................................................................................................... 64
Natural Systems Design i
Date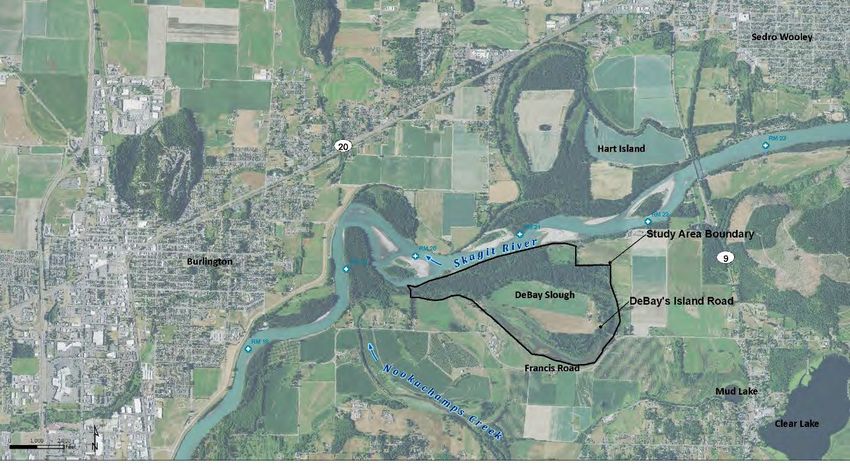
SKAGIT COUNTY PUBLIC WORKS DEBAY SLOUGH SITE ASSESSMENT
LIST OF TABLES
Table 1. Peak flow recurrence estimates for USGS Gage #12200500 for the Skagit River near Mount
Vernon. The USGS has not yet included the November 2021 flood event in the approved
period of record, since data for water year 2022 is incomplete. USACE 2013 estimates based
on regulated peaks affected by dam operations in the upper watershed. ......................................... 15
Table 2. Manning’s Roughness Values for HEC-RAS Model ............................................................................... 21
Table 3. Hydraulic Model Simulation Runs and Input Parameters .................................................................... 22
Table 4. Winter wildlife observations, high counts, and habitats used. ............................................................ 57
Table 5. Spring wildlife observations, high counts, and habitats used. ............................................................. 59
LIST OF FIGURES
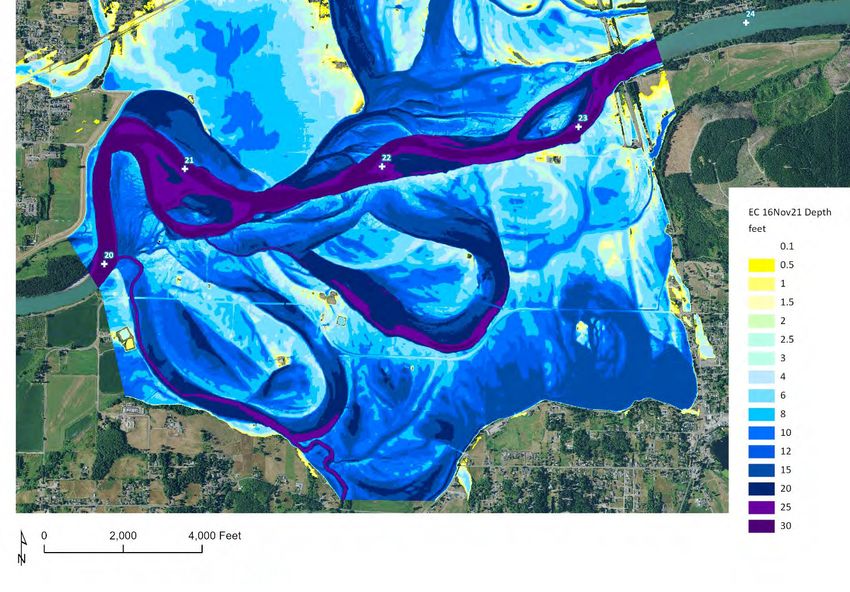
Figure 1. DeBay Slough location and vicinity ........................................................................................................ 5
Figure 2. Generalized illustration of DeBay Slough feasibility assessment project area (not intended to
represent property ownership or boundaries). ..................................................................................... 6
Figure 3. Existing conditions surface based on 2016 lidar augmented with Feb-March 2022 survey. ............... 10
Figure 4. Average daily streamflow for the Skagit River at USGS #12200500 near Mount Vernon. Black
line is the mean and gray banded area represents the 25 - 75th percentile range. ............................ 12
Figure 5. Exceedance probabilities for daily flow aggregated by month at the Skagit River at USGS
#12200500 near Mount Vernon. Black line is the median, blue squares are the 25th %, green
triangles are the 75th %, and the blue banded area represents the 10 - 90th percentile range.
For example, daily streamflow in June exceeded ~35,000 cfs in only 10% of the records, but
exceeds ~22,000 cfs in more than 50% of records............................................................................... 13
Figure 6. Exceedance probabilities for daily average flows at USGS Gage #12200500 for the Skagit
River near Mount Vernon. Values indicate the percentage of days a given flow has been
exceeded. Note the log scale for y-axis. ............................................................................................... 14
Figure 7. Historical flood peaks for the Skagit River at USGS Gage #12200500 near Mount Vernon.
Dashed lines show estimated recurrence floods based on Bulletin 17B Log-Pearson III
analysis. ................................................................................................................................................ 15
Figure 8. Log-Pearson III fit for estimating flood recurrence intervals (red line) from historical peaks
(blue squares). Green lines show 95% confidence range for peak flow estimates. Data from
USGS Gage #12200500 for the Skagit River near Mount Vernon. ....................................................... 16
Figure 9. SCPW water level logger sites for 2020-2022. ..................................................................................... 17
Figure 10. Level logger water surface elevations for SCPW sites 2-5 (colored points) and the USGS stage
gage at the SR9 bridge (black line). ...................................................................................................... 17
Figure 11. Interpolated contour map of surveyed water surface elevations for DeBay Slough and the
Skagit River for March 11, 2022. Mainstem Skagit River survey data for February 23, 2022,
were adjusted to account for vertical difference in discharge/stage. Note that contours are
based on surveyed WSE only and do not include SCPW levelogger data. ........................................... 18
Figure 12. Interpolated contour map of water surface elevations extracted from March 29, 2016 lidar
data....................................................................................................................................................... 18
Natural Systems Design ii
Date
SKAGIT COUNTY PUBLIC WORKS DEBAY SLOUGH SITE ASSESSMENT
Figure 13. HEC-RAS 2D Model Domain ................................................................................................................. 20
Figure 14. Manning's Roughness values and Land Classification in Model Domain. ............................................ 21
Figure 15. Longitudinal Profile of Water Surface Elevations in Debay Slough from the Skagit River up to
DeBay’s Isle Road for flows in the Skagit River ranging from 8,000 to 22,000 cfs. .............................. 24
Figure 16. Existing Conditions Flow Depths at 82,000 cfs (approximately 30-foot stage at Mount Vernon
USGS gage) ........................................................................................................................................... 26
Figure 17. Existing Conditions Velocities at 30-foot Stage at USGS Mount Vernon (82,000 cfs) ......................... 27
Figure 18. Modeled Depths during the November 15, 2021, Flood Event ........................................................... 28
Figure 19. Relative Elevation Model (REM) of the project area. The REM was developed using 2016
lidar (NPS, in publication). .................................................................................................................... 30
Figure 20. Clay sill holding grade at the downstream end of the slough. The sill appears to be resistant
to erosion and is likely contributing to the maintenance of water levels within the slough.
The sill forms the upstream end of the connector channel. Photo taken on March 10, 2022
looking upstream.................................................................................................................................. 31
Figure 21. Historical Skagit River channel migration patterns within the project area. The 1872 map was
obtained from the General Land Office within the U.S. Bureau of Land Management. The
1941, 1968, 1981, 2006, 2015, and 2021 images were obtained from the USGS Earth
Explorer website. .................................................................................................................................. 32
Figure 22. Historical changes within DeBay Slough. The 1872 map was obtained from the General Land
Office within the US. Bureau of Land Management. The 1941, 1968, 1981, 2006, 2015, and
2021 images were obtained from the USGS Earth Explorer website................................................... 34
Figure 23. 1951 aerial imagery of the project area compared to the 2021 location of the connector
channel. The connector channel appears to have formed along the left bank of a former
Skagit River main-stem channel and has remained relatively stable since its formation after
1951. ..................................................................................................................................................... 35
Figure 24. Typical example of large wood within the connector channel. The majority of the minimal
amounts of wood within the channel consist of small, bank attached pieces of red alder or
small accumulations. Photo taken on March 10, 2022, looking upstream. ........................................ 36
Figure 25. Log jam at the outlet of the connector channel. The log jam appears to have formed from
wood rafted down the Skagit River during the November 2021 flood. Photo taken March 10,
2022, looking upstream. ....................................................................................................................... 36
Figure 26. Connector channel junction where the channel meets the Skagit River (left) and connector
channel with the log jam near the mainstem junction in the background. Photos taken
March 9, 2022. ..................................................................................................................................... 37
Figure 27. DeBay Slough example of open water habitat looking upstream toward road crossing. Photo
taken June 8, 2022. .............................................................................................................................. 38
Figure 28. Skagit County Public Works HOBO gage water temperature data recorded at four locations
within the DeBay Slough site. Sites 2 and 3 are at the downstream end of the lower slough.
Sites 4 and 5 are downstream and upstream of the DeBay’s Isle Road culvert, respectively.
Orange line indicates temperature threshold for salmonid rearing and migration habitat.
Red line indicates lethal temperature threshold for juvenile salmonids. ............................................ 40
Figure 29. Western end of DeBay Slough and the connector channel on 8/29/2020 showing no surface
water connection between the slough and channel. ........................................................................... 41
Figure 30. Slough upstream of culvert, view north. Photo taken September 5, 2021.......................................... 42
Natural Systems Design iii
Date
SKAGIT COUNTY PUBLIC WORKS DEBAY SLOUGH SITE ASSESSMENT
Figure 31. Slough upstream of DeBay’s Isle road culvert, view south toward culvert (background left of
center). Photo taken June 8, 2022. ...................................................................................................... 42
Figure 32. Mapped habitat types based on vegetation during high water periods of the year, November
– July. .................................................................................................................................................... 45
Figure 33. Mapped habitat types based on vegetation during low water periods of the year, August –
October. ................................................................................................................................................ 46
Figure 34. Deciduous forest vegetation community and density of largely native understory; Game
Reserve Agricultural field is in the foreground. Photo taken June 8, 2022.......................................... 48
Figure 35. Nest and pair of nesting bald eagles in mature deciduous riparian forest. Photo taken May
17, 2022. ............................................................................................................................................... 48
Figure 36. Himalayan blackberry-dominated deciduous scrub shrub habitat adjacent to agricultural
field and the lower slough. Photo take May 17, 2022. ........................................................................ 49
Figure 37. Scrub-shrub community of willows fringing upper slough, with emergent and aquatic bed
wetland adjacent, as well as deciduous riparian forest adjacent in background. Photo taken
May 17, 2022. ....................................................................................................................................... 50
Figure 38. Emergent and aquatic bed vegetation communities in the lower slough. Photo taken May
17, 2022. ............................................................................................................................................... 51
Figure 39. Aquatic Bed habitat with water lily and Potamogeton spp. in the upper slough. Photo taken
May 17, 2022. ....................................................................................................................................... 52
Figure 40. Waterfowl use of open water in lower slough, February 17, 2020. Species include
Trumpeter Swan, Tundra Swan, Mallard, and American Wigeon. ....................................................... 53
Figure 41. Open water habitat south of DeBay’s Isle Road culvert, with fringe of aquatic bed/emergent
wetland, deciduous scrub shrub wetland, and deciduous forest. Photo taken May 17, 2022. ........... 53
Figure 42. Black-tailed Deer and Common Yellowthroat in the grass/forb meadow area on June 8,
2022. ..................................................................................................................................................... 54
Figure 43. Game Reserve agricultural field, June 8, 2022, planted in rows of corn. ............................................ 54
Figure 44. Game Reserve agricultural field, eastern edge of unharvested corn adjacent to deciduous
riparian forest. Photo taken February 16, 2022. .................................................................................. 55
Figure 45. Example of crop stubble left to overwinter in the Hunt Safety Zone. Photo taken February
16, 2022. ............................................................................................................................................... 55
Figure 46. Mallards foraging and resting in the Game Reserve field. Photo taken February 17, 2022. ............... 56
Figure 47. Trumpeter swans approaching the slough on February 17, 2022. The vast majority of swan
night roosting activity occurred on the lower slough during field observations. ................................ 57
LIST OF APPENDICES
Appendix A-1 Hydraulic Model Calibration
Appendix A-2 Existing Conditions Hydraulic Model Output Maps
Appendix B U.S. Army Corps of Engineers Wetland Determination Data Forms
Natural Systems Design iv
Date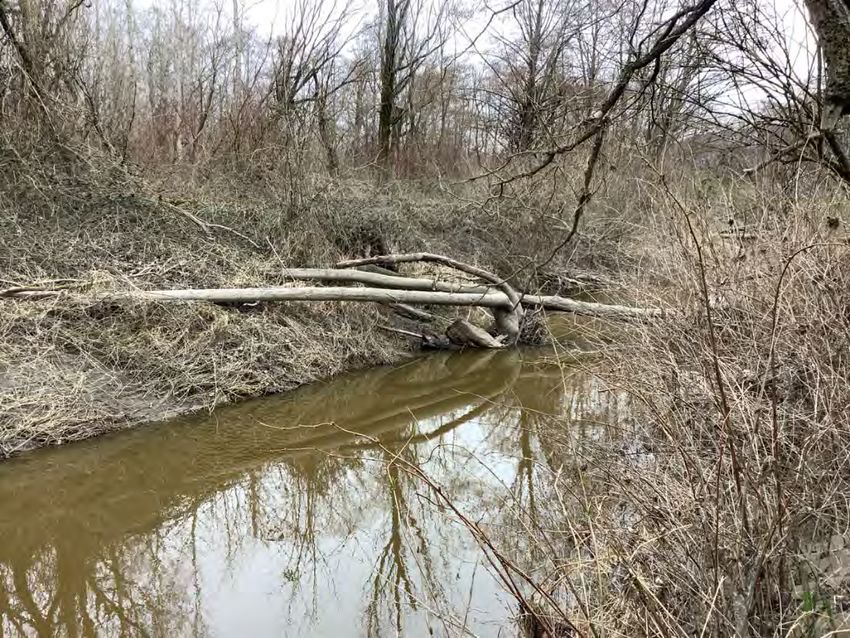
SKAGIT COUNTY PUBLIC WORKS DEBAY SLOUGH SITE ASSESSMENT
1 INTRODUCTION
Natural Systems Design, Inc. (NSD) has prepared this memo to document our analysis of existing conditions
within DeBay Slough in Skagit County, Washington. NSD is supporting Skagit County Public Works (SCPW), in
partnership with the Washington State Department of Fish and Wildlife (WDFW), to evaluate restoration
opportunities to enhance juvenile Chinook rearing and refuge habitat within DeBay Slough, a left bank, off
channel slough of the Skagit River (Figure 1). The project area is located just upstream/east of the Nookachamps
Creek confluence with the Skagit at approximately river mile (RM) 21.5, east of Burlington. This summary is the
first step in the feasibility study and will support future identification of restoration opportunities and
development of conceptual designs and an associated Basis of Design report. This memo will ultimately form the
basis of that report.
Figure 1. DeBay Slough location and vicinity
Various historical and mapping resources differ in the spelling of the slough and associated roadway. WDFW
refers to their reserve as the Johnson/DeBay’s Slough Unit; various resources identify the access road as DeBay’s
Isle or Island Road. We have adopted the nomenclature of DeBay Slough and DeBay’s Isle Road herein consistent
with the County’s parcel database and after consultation with the project Advisory Group.
NSD, SCPW, and WDFW are evaluating the feasibility of habitat and access enhancements at DeBay Slough that
consider the slough and its surrounding area’s multiple uses (i.e., overwintering tundra and trumpeter swan
habitat, waterfowl hunting, birding, natural open space, and agriculture uses). This site assessment evaluates
existing conditions relative to the multi-use and multi-species benefits that the site currently provides and will
support consideration by SCPW, WDFW, and the project’s advisory group of the potential to improve juvenile
Chinook rearing and refuge habitat.
NATURAL SYSTEMS DESIGN 5
September 26, 2022
SKAGIT COUNTY PUBLIC WORKS DEBAY SLOUGH SITE ASSESSMENT
2 PROJECT AREA
The DeBay Slough project area encompasses the slough itself, DeBay’s Isle Road and culvert which are owned
and maintained by Skagit County, an outlet/connector channel to the Skagit River, and the approximately 390-
acre Johnson/DeBay’s Slough Wildlife Area Unit owned and managed by WDFW (Figure 2).
Figure 2. Generalized illustration of DeBay Slough feasibility assessment project area (not intended to
represent property ownership or boundaries).
The Johnson/DeBay’s Slough Unit was purchased in 1995-1997 to protect a popular swan night roost site and to
provide a non-hunted upland reserve for trumpeter and tundra swans where they can feed and rest in the
winter. DeBay Slough is named for the DeBay family which owned and farmed the area.
The Johnson/DeBay's Slough Unit is comprised of agricultural fields, riparian forest, and freshwater wetlands.
WDFW has primarily managed this area in cooperation with local farmers as a Game Reserve for overwintering
trumpeter and tundra swans that migrate to the area from the Arctic to forage and rest. The Reserve also
provides limited waterfowl hunting in the portion of DeBay Slough north of DeBay’s Isle Road and in the
adjacent agricultural field to the east of the upper portion of DeBay Slough. Because the project area includes a
diversity of habitats, it also provides birding opportunities including observing the wintering swans and year-
round opportunities to observe birds utilizing the slough, wetlands, and riparian forest habitats of the area.
DeBay’s Isle Road crosses the slough, providing access to the Game Reserve from Francis Road. The DeBay’s Isle
Road crossing includes an undersized culvert crossing which limits hydraulic and geomorphic connectivity to the
upper portion of the slough.
Private property surrounding the slough is primarily agricultural, with dairy farms along the southern boundary,
fields variously cropped in corn to the west, and filbert/hazelnut orchards to the southeast. Public access to the
NATURAL SYSTEMS DESIGN 6
September 26, 2022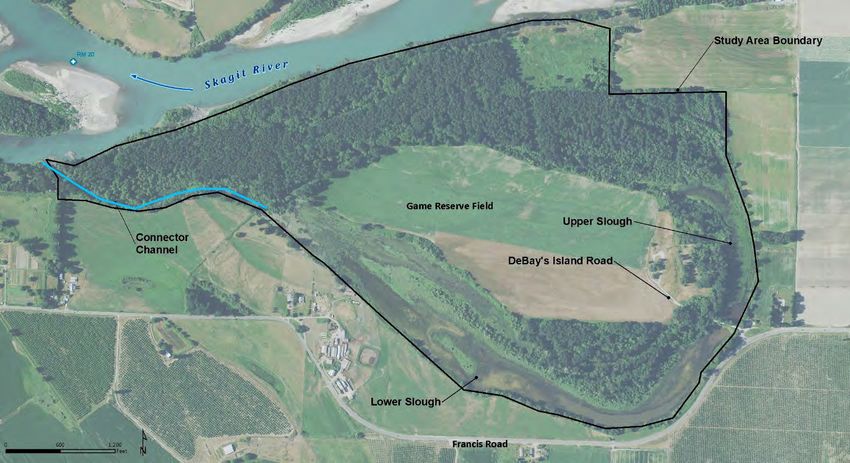
SKAGIT COUNTY PUBLIC WORKS DEBAY SLOUGH SITE ASSESSMENT
Game Reserve is limited to the parking and grassy viewing area at the end of DeBay’s Isle Road; parking is also
available immediately off Francis Road in a small parking lot which provides access to the hunting areas.
2.1.1 Memo Organization
This memo presents the project goals and objectives, followed by a summary of the limiting factors affecting
Chinook salmon in the Skagit River. We then present a summary of the site assessment methods and existing
conditions analysis for each of the following elements of the project area:
Topography and Bathymetric Survey
Hydrology
Hydraulics
Geomorphic Assessment
Aquatic Habitat Conditions and Use
Terrestrial and Wetland Habitat Conditions and Use
Summary
Next Steps in Feasibility Study
3 PROJECT GOALS AND OBJECTIVES
The goal of this project is to assess the feasibility of making habitat enhancement improvements to the DeBay
Slough study area for the benefit of Chinook salmon. The study area supports multiple land uses, a wide
diversity of terrestrial, wetland, and aquatic habitats, and an important Game Reserve for overwintering swans.
Given these considerations, WDFW and SCPW seek to understand the variety of habitats and ecological
functions of the study area and to use that information to consider if actions to benefit Chinook salmon could
feasibly be considered in the study area without detrimental effects to neighboring properties and land use or to
the functions and habitats currently present.
The primary elements being considered by WDFW and SCPW in the assessment of habitat enhancement
feasibility, as developed in cooperation with the project’s Advisory Group, include:
Hydraulic connectivity between the slough, connector channel, and Skagit River at flows consistent with
important seasons of use by juvenile Pacific salmonids, specifically Chinook Salmon, and waterfowl,
including overwintering swans
Geomorphic context, with an emphasis on trends in river channel migration and stability of DeBay
Slough as a landform
Extent and nature of existing riparian and wetland vegetation and habitat functions they provide to both
juvenile salmonids and aquatic-associated wildlife and birds
Water quality in the slough, including temperature and dissolved oxygen conditions relative to salmonid
rearing habitat needs
Use of the slough by juvenile salmonids as rearing and high flow refuge habitat.
Use of the slough by other native and non-native fish, aquatic-associated mammals, amphibians, and
reptiles
Use of the slough and surrounding areas by waterfowl, raptors, and migratory and resident birds
Human use of the Game Reserve for birding and hunting
NATURAL SYSTEMS DESIGN 7
September 26, 2022
SKAGIT COUNTY PUBLIC WORKS DEBAY SLOUGH SITE ASSESSMENT
Human residential and agricultural use of the areas surrounding the slough
The technical approach to characterizing existing conditions relied on a combination of desktop and field data
collection of topographic, hydrologic, hydraulic, geomorphic, and fish and wildlife habitat information to
understand the ecological attributes of the study area. This information, coupled with the consideration of the
habitat needs of Skagit River Chinook salmon, will form the basis of the feasibility assessment.
4 SKAGIT RIVER CHINOOK LIMITING FACTORS
The Skagit River Chinook Recovery Plan (SRSC and WDFW, 2005) sets forth a framework for evaluating
restoration and protection actions for the recovery of Chinook and details specific actions supportive of recovery
based on the life history needs and habitat limiting factors for Chinook in the Skagit River basin. NSD reviewed
the Recovery Plan to identify specific uses and limiting factors relevant to DeBay Slough and the habitats present
within the study area and to consider restorative actions which would specifically address the life history needs
and habitat limiting factors for Chinook in the Skagit River basin.
Anadromous forms of ten salmonid species exist within the Skagit Basin. These include six Chinook stocks
(spring, summer, and fall); pink salmon; coho salmon; chum salmon; sockeye salmon; summer and winter run
steelhead; sea run and resident cutthroat trout; and Dolly Varden and bull trout (SRSC and WDFW, 2005).
Chinook, steelhead, and bull trout are each federally listed threatened species protected by the Endangered
Species Act.
Lower Skagit fall Chinook spawn in the Skagit River mainstem and its tributaries downstream of the Sauk River,
mainly between Sedro Woolley and the Sauk River. They spawn primarily in October, which is generally later
than the Upper Skagit summer Chinook (SRSC and WDFW, 2005). DeBay Slough does not provide spawning
habitat but may be accessible to juvenile Chinook (as well as other salmonids). Specifically, the slough may
provide off-channel, early summer rearing habitat for ocean-type parr migrants, which rear in freshwater for a
few months prior to outmigrating to the delta in late May or June. Stream-type yearlings are a Skagit River
Chinook life history type in which the juveniles rear in freshwater for over a year, eventually migrating to the
estuary from late March through May. These juveniles may use DeBay Slough for winter rearing/high flow
refuge and potentially also for early season summer rearing habitat.
Degraded riparian zones and high water temperatures are specific factors that limit or restrict habitat use by
Chinook in the portion of the watershed that includes DeBay Slough. Degraded riparian zones lacking in large
conifers alter the natural large wood recruitment cycle and the related formation of complex riverine floodplain
and wetland habitats that support juvenile Chinook rearing.
Fish passage and access barriers to habitat across life history stages is another factor that negatively affects
Chinook in the basin. Access issues include altered hydrologic connections, maintenance of connections to off
channel and side channel habitats including open water and wetland areas, as well as access to areas fed by cold
hyporheic zone water and with complex foraging and refuge habitat formed by large wood and an interspersion
of edge habitats formed by streamside and wetland vegetation.
It has been estimated that approximately 37% of the floodplain in the spawning range of Lower Skagit fall
Chinook is disconnected from natural river processes, limiting the formation and accessibility of off channel
habitat for juvenile rearing (SRSC and WDFW, 2005). Restoration of freshwater rearing habitats is thus
specifically recommended to increase the number of parr migrants which survive to outmigrate through the
delta and nearshore environments. The recommended strategy for floodplain restoration generally focuses on
reconnecting isolated floodplain areas and restoring mainstem edge habitat. This includes restoration of a
diversity of habitats for low velocity flood refuge habitat in off channel and back water areas, such as DeBay
NATURAL SYSTEMS DESIGN 8
September 26, 2022SKAGIT COUNTY PUBLIC WORKS DEBAY SLOUGH SITE ASSESSMENT
Slough, so that 0+ age juveniles are not displaced downstream into the delta and nearshore, resulting in lower
survival, and can instead utilize the freshwater, off channel areas to rear and increase in size (SRSC and WDFW,
2005).
Similarly, floodplain restoration actions that restore the movement of water, wood, and sediment across the
floodplain not only support the maintenance and creation of Chinook spawning and rearing habitats, but also
increase the base level of productivity through increasing riparian, wetland, and floodplain vegetation primary
productivity. In so doing, detritus retention and benthic foodchain productivity is also increased, which directly
support juvenile prey resources in off channel and side channel habitats. This feasibility study includes
consideration of access to and habitat quality within juvenile rearing habitats, as well as restorative actions that
support riparian, wetland, and floodplain vegetation community diversity and extent.
5 SITE ASSESSMENT AND EXISTING CONDITIONS ANALYSIS
NSD collected and synthesized existing information to develop an understanding of the DeBay Slough site and
surrounding area. NSD compiled and reviewed relevant background information for the site including aerial
photography, mainstem channel occupancy, the lidar digital elevation model (DEM), current and historical land
use practices, and previous reports including the Skagit Chinook Recovery Plan (SRSC and WDFW, 2005). NSD
also reviewed existing water quality (WQ) and hydrologic data collected by SCPW to compare with existing
water quality standards for juvenile Chinook rearing habitat.
NSD conducted field assessments in early 2022 to collect data necessary for the 2D hydraulic modeling and
geomorphic assessments, to qualitatively assess fish and wildlife habitat conditions and use, and to support the
eventual development of potential habitat restoration actions.
5.1 Topographic and Bathymetric Survey
NSD collected topographic and bathymetric survey data to characterize existing topographic conditions within
the slough, the Skagit River mainstem, and the connector channel between DeBay Slough and the Skagit River.
Survey data were collected to supplement the existing 2016 lidar coverage at the site, to account for recent
channel migration in the Skagit River, and to capture bathymetric data for wetted areas in the slough and
mainstem channel.
5.1.1 Methods
The mainstem Skagit River was surveyed using single beam sonar and real time kinematic (RTK) GPS survey by
jet boat on February 16, 2022 and using of single beam sonar and RTK from small kayaks and ground-based RTK
survey on February 23, 2022. The mainstem Skagit survey spanned from upstream of the SR 9 bridge (RM 23.5)
to just downstream of the confluence with Nookachamps Creek (RM 20). DeBay Slough and the connector
channel to the Skagit mainstem were surveyed using single beam sonar and ground based RTK on March 10-11,
2022.
Survey data were collected at cross sections chosen for the development of the hydraulic model, with thalweg
points and water surface and water’s edge data collected to enable interpolation between cross sections and aid
in hydraulic model calibration. Survey data were reviewed for quality assurance and quality control and then
imported to a HEC-RAS 2D environment for surface development. Development of the existing surfaces
representing the mainstem Skagit River, DeBay Slough, and connector channel bathymetry was performed using
the terrain development tools included in HEC-RAS Version 6.2. Terrain development consisted of establishing
surveyed cross sections, channel thalweg and banklines from the collected survey data. Terrain interpolation
NATURAL SYSTEMS DESIGN 9
September 26, 2022SKAGIT COUNTY PUBLIC WORKS DEBAY SLOUGH SITE ASSESSMENT
between the surveyed cross sections was performed utilizing the established thalweg and banklines to shape
the channel terrain within the limits of the survey.
5.1.2 Results
The bathymetric surfaces representing the mainstem Skagit, DeBay Slough, and connector channel were
combined and then composited with existing 2017 North Puget lidar (collected in March 2016, hereafter
referred to as ‘2016 lidar’) data obtained from the Washington State Department of Natural Resources lidar
Portal. This final composite surface represents the existing conditions at the project site and will serve as the
basis for project basemaps and hydraulic model development. All data and the resulting surface are in US survey
feet relative to the NAD83/2011 Washington State Plane North (4601) coordinate system and NAVD88 (Geoid
12B) vertical datums, respectively. The final composite surface and limits of survey are shown in Figure 3.
Figure 3. Existing conditions surface based on 2016 lidar augmented with Feb-March 2022 survey.
5.2 Hydrology
5.2.1 Methods
NSD compiled and analyzed hydrologic data collected downstream of the site at the US Geological Survey (USGS)
gage for the Skagit River near Mount Vernon (#12200500) and stage data collected by the USGS at the State
Route (SR) 9 bridge upstream of the site (#12199000). NSD also reviewed water level data collected by SCPW at
sites within DeBay Slough to understand how changes in Skagit River stage (as measured at SR 9 gage) influence
water levels and habitat connectivity in the slough.
Daily average flow measurements for the USGS gage on the Skagit River at Mount Vernon were compiled for the
period from 1962 to 2022 to assess seasonal flow patterns, identify summer baseflow conditions, and to
quantify flow conditions during important life history stages for salmonids. Exceedance probabilities for daily
NATURAL SYSTEMS DESIGN 10
September 26, 2022SKAGIT COUNTY PUBLIC WORKS DEBAY SLOUGH SITE ASSESSMENT
flows represent the number of days or the probability (as a percent likelihood) that a given flow is exceeded.
Exceedance probabilities were calculated for the water year (October 1 – September 30) and by month.
Annual peak flow measurements for the USGS gage at Mount Vernon were compiled for the period of record
from 1906 to present, which includes 82 approved peak flow measurements. The approved preliminary estimate
for peak discharge for the November 16, 2021, flood event was also included in the peak flow analysis to
estimate recurrence intervals for the historic record, and to inform hydraulic model boundary conditions.
Recurrence interval flows were estimated following USGS Bulletin 17B methods, as modified by Mastin et al.,
2016.
Water level logger data collection by SCPW began in late June of 2020 and continued through February 2021, at
which point several data loggers were vandalized, missing, or damaged by flooding. SCPW re-deployed level
loggers in late winter 2022 in slightly different locations in hopes of collecting another full year of data.
However, elevated water conditions in June and July 2022 prevented data download in time for inclusion in this
memo. Data collected since redeployment will be summarized during later stages of the feasibility assessment.
All locally collected level logger data were corrected to account for atmospheric pressure from a nearby
barologger or using local weather station data (e.g., Washington State University weather station at Sakuma,
approximately 2 miles from DeBay Slough). Compensating for atmospheric pressure allows water levels
(measured as water pressure) to be converted to water depths based on water density as a function of water
temperature, which is measured at each data logger. Water surface elevation (WSE) for each data point is
derived from adding recorded water depths to surveyed sensor elevations, measured as offsets from surveyed
tops of level logger well caps.
Surveyed WSE points from the February and March 2022 topographic and bathymetric surveys were used to
develop an interpolated map of WSE contours between the Skagit River and the slough water surface during the
late winter period. To account for the different in flow conditions between the two survey date collection
periods, an adjustment of +1.45 feet was made to raise the Skagit River WSE data collected on February 23
(13,500 cfs) to better represent the higher flow conditions of the March 11 (18,100 cfs) survey date. This
adjustment in WSE was developed using the average daily stage data from the Mount Vernon and SR9 gages.
Stage height at the Mt Vernon USGS gage was 1.85 ft higher on March 11, 2022, and 1.05 ft higher at the SR9
USGS stage gage as compared to river stages on February 23, and the average of these two values, 1.45 feet,
was used to adjust the February 23 WSE data. Select WSE returns from 2016 lidar data were also compiled to
develop an interpolated WSE surface during the lidar data collection on March 29, 2016 (15,200 cfs) for
comparison with recently collected survey data.
5.2.2 Results
Streamflow Patterns
Streamflow patterns in the Skagit River follow a bimodal annual cycle, with the water year beginning with low
flows, rising to a first peak driven by fall and winter rainstorms, falling in the late winter as snowpack
accumulates in the upper watershed, and then peaking with snowmelt in the early summer months before
receding in the late summer and early fall (Figure 4). 49 percent of mean total annual precipitation in the lower
Skagit (32.7 inches/year at Mount Vernon) occurs from November through February (USACE 2013). The
contributing basin above Mount Vernon receives an average of 92 inches/year, 75 percent of which falls from
October – March.
Exceedance probabilities for daily flows aggregated by month show a similar pattern, with a fall peak driven by
rainfall and a summer peak driven by snowmelt (Figure 5). Exceedance probabilities for daily flows throughout
NATURAL SYSTEMS DESIGN 11
September 26, 2022SKAGIT COUNTY PUBLIC WORKS DEBAY SLOUGH SITE ASSESSMENT
the entire water year can provide a good indication of baseflow (e.g., 10% exceedance) conditions that are met
or exceeded for much of the water year (Figure 6).
Dam operations at the Skagit and Baker hydroelectric facilities capture spring snowmelt runoff and release
water when natural inflows are low during the late summer, fall, and mid-winter (SWC, 2011). Hydroelectric
operations reduce spring runoff and increase flows during what would naturally be low-flow seasons. Due to the
regulated flow regimes in the upper watershed, flow variability in the lower and middle Skagit is driven largely
by natural flow regimes in major tributaries to the Skagit below the dams, including the Sauk and Suiattle basins
and the Cascade River, which have substantially higher mean annual precipitation than the lower Skagit
watershed.
Figure 4. Average daily streamflow for the Skagit River at USGS #12200500 near Mount Vernon. Black line is
the mean and gray banded area represents the 25 - 75th percentile range.
NATURAL SYSTEMS DESIGN 12
September 26, 2022SKAGIT COUNTY PUBLIC WORKS DEBAY SLOUGH SITE ASSESSMENT
Figure 5. Exceedance probabilities for daily flow aggregated by month at the Skagit River at USGS
#12200500 near Mount Vernon. Black line is the median, blue squares are the 25th %, green triangles are the
75th %, and the blue banded area represents the 10 - 90th percentile range. For example, daily streamflow in
June exceeded ~35,000 cfs in only 10% of the records, but exceeds ~22,000 cfs in more than 50% of records.
NATURAL SYSTEMS DESIGN 13
September 26, 2022SKAGIT COUNTY PUBLIC WORKS DEBAY SLOUGH SITE ASSESSMENT
Figure 6. Exceedance probabilities for daily average flows at USGS Gage #12200500 for the Skagit River near
Mount Vernon. Values indicate the percentage of days a given flow has been exceeded. Note the log scale for
y-axis.
Peak Flows
Annual flood peak records indicate the flood of record occurred in November of 1990, with an observed peak of
152,000 cfs at the Mount Vernon USGS gage site (#12200500, Figure 7). The 1990 flood peak is estimated as
roughly a 100-year recurrence flood event (e.g., 1% chance of exceedance; Figure 8). Flood frequency estimates
are shown with and without the November 2021 flood event in Table 1, since the USGS has not completed data
collection and approval for water year 2022 data (October 1, 2021, through September 30, 2022). Review of
peak flow estimates with and without the November 2021 flood event indicate that this most recent flood peak
skewed lower probability (larger flood) estimates upward by several thousand cubic feet per second (cfs). Note
that flood flows at Mount Vernon are affected by regulation in the upper watershed at the Ross, Diablo, and
Baker River dams. The US Army Corps of Engineers (USACE) conducted a peak flow analysis in 2013 to estimate
regulated and unregulated peak flows, which differ from Bulletin 17B estimates for the Mount Vernon USGS
gage.
Future Flow Regime
Dam operations at Baker Lake and Ross and Diablo Lakes in the upper Skagit attenuate flood peaks, and previous
flood frequency analyses suggest that these dams reduce estimated 100 year peak flows in the Skagit by up to
24 percent (USACE, 2003; NHC, 2013), with 14 percent reductions in the estimated 100 year peak flow at Mount
Vernon (USACE, 2013). Due in part to flow regulation by the dams, data from Mantua et al. (2010) indicate that
the lower Skagit River will likely experience little change in peak flow magnitude under future climate scenarios,
NATURAL SYSTEMS DESIGN 14
September 26, 2022SKAGIT COUNTY PUBLIC WORKS DEBAY SLOUGH SITE ASSESSMENT
however spring and summer snowmelt runoff is expected to decline, and the summer low flow period is
projected to increase in duration by the end of the century. Coupled with warming air temperatures, lower
summer flows may increase thermal stress for cold water fish (e.g., Chinook, steelhead, bull trout) in the basin
(SWC, 2011).
Table 1. Peak flow recurrence estimates for USGS Gage #12200500 for the Skagit River near Mount
Vernon. The USGS has not yet included the November 2021 flood event in the approved period of record,
since data for water year 2022 is incomplete. USACE 2013 estimates based on regulated peaks affected by
dam operations in the upper watershed.
USACE 2013
Annual Exceedance Without November 2021 With November 2021
Return Interval (yrs) Regulated Estimate
Probability Estimated Discharge (cfs) Estimated Discharge (cfs)
(cfs)
0.99 1.01 29,290 29,240 -
0.5 2 68,910 69,410 76,900
0.2 5 92,860 93,840 92,900
0.1 10 108,300 109,600 119,000
0.04 25 127,300 129,100 149,800
0.02 50 141,200 143,400 167,600
0.01 100 154,900 157,400 206,500
0.002 500 186,600 189,900 282,600
Figure 7. Historical flood peaks for the Skagit River at USGS Gage #12200500 near Mount Vernon. Dashed
lines show estimated recurrence floods based on Bulletin 17B Log-Pearson III analysis.
NATURAL SYSTEMS DESIGN 15
September 26, 2022SKAGIT COUNTY PUBLIC WORKS DEBAY SLOUGH SITE ASSESSMENT
Figure 8. Log-Pearson III fit for estimating flood recurrence intervals (red line) from historical peaks (blue
squares). Green lines show 95% confidence range for peak flow estimates. Data from USGS Gage #12200500
for the Skagit River near Mount Vernon.
Surface Water Gradients
Water level logger locations for data collected by SCPW are shown in Figure 9, and WSE extracted from the level
loggers are shown in Figure 10. Level logger data show a strong linkage between DeBay Slough and the Skagit
River (as measured at SR9 USGS gage), with flow peaks in the Skagit generally resulting in increased stage within
the slough (Sites 3-5) and the outlet connector channel (Site 2). For periods of data overlap, the water surface at
Site 5 on the northern side of the DeBay’s Isle Road culvert is perched higher than Site 4 on the southern side of
the culvert, which is roughly 0.1 ft higher than the west/downstream end of the slough at Site 3. This pattern of
a perched water surface along the northern side of the Slough is consistent with surveyed WSE points (Figure
11). Note that surveyed WSE points occurred during two different flow conditions and were adjusted for the
observed difference in stage (see methods above). Comparison of surveyed WSE with the 2016 lidar WSE (Figure
12) shows a similar pattern in surface water gradients within the reach and confirm findings from the adjusted
survey WSE. Limited data are available for the connector channel at Site 2, however WSE at Site 2 appears to
draw down more rapidly than the slough areas (Sites 3-5) following the spring freshet in June – July 2020 and
following fall and winter flood peaks in 2020 – 2021 (Figure 10).
Interpolated contours for surveyed WSE suggest that the northern end of the Slough may be gaining
groundwater from the Skagit below the SR9 bridge crossing and losing flow in the western edge via the
connector channel and groundwater to a lower base level in the Skagit to the west of the Slough (Figure 11).
Overall, the WSE gradient follows a down-valley pattern that is largely consistent with the channel alignment of
the Skagit River.
Groundwater monitoring to the northeast, south, and west of DeBay Slough would help resolve local
groundwater gradients that govern whether the Slough is gaining or losing flow relative to the Skagit River. Both
surveyed and lidar WSE data suggest some gaining at the northeastern end of the slough, however these
NATURAL SYSTEMS DESIGN 16
September 26, 2022SKAGIT COUNTY PUBLIC WORKS DEBAY SLOUGH SITE ASSESSMENT
interpretations are based on limited surface water observations and water surface lidar returns. In general, the
agreement between surveyed WSE (Figure 11) and lidar WSE (Figure 12) suggests a gaining groundwater
connection at the eastern end of the slough and a losing connection at the west end of the slough.
Figure 9. SCPW water level logger sites for 2020-2022.
Figure 10. Level logger water surface elevations for SCPW sites 2-5 (colored points) and the USGS stage gage
at the SR9 bridge (black line).
NATURAL SYSTEMS DESIGN 17
September 26, 2022SKAGIT COUNTY PUBLIC WORKS DEBAY SLOUGH SITE ASSESSMENT
Figure 11. Interpolated contour map of surveyed water surface elevations for DeBay Slough and the Skagit
River for March 11, 2022. Mainstem Skagit River survey data for February 23, 2022, were adjusted to account
for vertical difference in discharge/stage. Note that contours are based on surveyed WSE only and do not
include SCPW levelogger data.
Figure 12. Interpolated contour map of water surface elevations extracted from March 29, 2016 lidar data.
NATURAL SYSTEMS DESIGN 18
September 26, 2022SKAGIT COUNTY PUBLIC WORKS DEBAY SLOUGH SITE ASSESSMENT
5.3 Hydraulics
5.3.1 Methods
Model Domain
To evaluate hydraulic conditions within DeBay Slough, the Skagit River mainstem and the adjacent floodplain
areas, NSD developed a two-dimensional model of the project reach within the U.S. Army Corps of Engineers
(USACE) modeling platform, Hydrologic Engineering Center-River Analysis System (HEC-RAS), Version 6.2. The
hydraulic model domain spanned from just upstream of the State Route 9 bridge on the Skagit River mainstem
down through the confluence with Nookachamps Creek and includes the adjacent DeBay Slough, Hart Slough
and surrounding Skagit Valley floodplain. NSD derived the underlying terrain for the model from the composite
surface consisting of bathymetric survey data collected by NSD in February and March of 2022 and 2016 lidar
data obtained through the DNR lidar portal.
The model mesh utilized varying cell sizes to fully capture terrain details and flow pathways. Cell sizes ranged
from 10 feet in the connector channel to 40 feet within the Skagit mainstem and 200 feet in the surrounding
Skagit Valley (Figure 13). Model inflow was set at the SR 9 bridge and model outflow was set at the limits of the
bathymetric survey data collection just downstream from the confluence with Nookachamps Creek. Model
outflow was set to a normal depth condition with a slope of 0.0016 ft/ft as derived from the approximate water
surface slope at this location in the 2016 lidar data. Additional model inflows were included in the upper (north
of DeBay’s Isle Rd) and lower (south of DeBay’s Isle Road) portions of DeBay Slough to account for groundwater
inflows into the slough. For the peak flow modeling runs, an additional inflow was added for the combined East
Fork and West Fork Nookachamps Creek near the Swan Road Bridge crossing, located approximately 4,600 feet
southwest of DeBay Slough.
NATURAL SYSTEMS DESIGN 19
September 26, 2022SKAGIT COUNTY PUBLIC WORKS DEBAY SLOUGH SITE ASSESSMENT
Skagit River
inflow
Model
Outflow
DeBay Slough
inflows
DeBay Island
Road and culvert
Nookachamps Creek
inflow
Figure 13. HEC-RAS 2D Model Domain
Model Elements and Roughness
Within the model domain described above, additional model elements were added to the mesh to represent the
existing culvert at DeBay’s Isle Road and assign Manning’s Roughness values based upon land classification to
characterize the hydraulic roughness exerted by the varying land types (e.g., main channel, cultivated crops,
scrub-scrub, etc.) found in the model domain. The existing culvert crossing at DeBay’s Isle Road was included in
the model domain as a 2D area connection. The location of the culvert was approximated as it could not be
located during the topographic survey; culvert geometry data was obtained from the WDFW barrier assessment
(WDFW, 2019). No other drainage structures were included in the model mesh.
To aid in assigning roughness values for the model domain, National Land Cover Data (NLCD) from 2019 was
obtained from the Multi-Resolution Land Characteristics Consortium and used to review and assign initial land
cover classification data for the model domain (MRLC Consortium, 2022). The NLCD was compared with the
2021 NAIP aerial imagery for the project reach and land classification assignments were revised and simplified
within the limits of the hydraulic model domain to add in assigning Manning’s Roughness values. The resulting
Manning's N values and land classification are shown in Figure 14 and Table 2 below.
NATURAL SYSTEMS DESIGN 20
September 26, 2022SKAGIT COUNTY PUBLIC WORKS DEBAY SLOUGH SITE ASSESSMENT
Figure 14. Manning's Roughness values and Land Classification in Model Domain.
Initial Manning’s N values were assigned based upon typical value ranges for the various land classifications as
outlined in the HEC-RAS 2D User’s Manual (USACE, 2021). Roughness values were then further refined based
upon the model calibration discussed below and in Appendix A-1.
Table 2. Manning’s Roughness Values for HEC-RAS Model
LAND CLASSIFICATION MANNING’S N VALUE
Roadway 0.017
Barren Land 0.029
Mainstem 0.034
Open Water 0.040
Developed, Open Space 0.046
Side Channel 0.046
Cultivated Crops/Grassland-Herbaceous 0.058
Developed, Low Intensity 0.081
Developed, Medium Intensity 0.104
Emergent Herbaceous Wetlands 0.104
Shrub-Scrub 0.115
Evergreen Forest 0.138
Developed, High Intensity 0.161
Mixed Forest 0.173
Log Jam 0.230
NATURAL SYSTEMS DESIGN 21
September 26, 2022SKAGIT COUNTY PUBLIC WORKS DEBAY SLOUGH SITE ASSESSMENT
Design Flows
NSD assessed five flow events ranging from a typical summer low flow condition to the November 16, 2021,
flood event which was an approximate 25-year event in this area of the Skagit Basin. Table 3 presents the five
model runs which includes their inflow values, approximate stage at both the USGS at Mount Vernon and USGS
near Sedro Woolley (SR 9 bridge), and approximate DeBay Slough water surface elevation where available.
Table 3. Hydraulic Model Simulation Runs and Input Parameters
DESIGN FLOW USGS GAGE STAGE (FT1) DEBAY INFLOW DISCHARGES (CFS)
SLOUGH
(FT,
NAVD88)
Total Habitat 12200500 12199000 Lower Mainstem DeBay DeBay Combined
Flow Condition at Mount near Sedro Slough Skagit Slough Slough Nookachamps
(cfs) Vernon Woolley Stage River Upper Lower Creek
Typical Aug-Oct
11.5 19.9 25.8 8,000 1 - -
8,000 Low Flow
Typical winter
15,000 flow during swan 14.6 22.1 26.8 15,000 4 - -
use period
Typical winter
22,000 high flow (25%
17.1 23.6 27.5 22,000 22 - -
exceedance) for
Nov-Jan
Typical flooding
30 38 unk2 78,934 103 103 3,066
82,000
November 16,
37 42.6 unk2 133,000 103 103 4,720
133,000 2021, Event
1. USGS gage stages referenced to gage datum. Elevation in feet, NAVD88 at gage locations is gage stage + 3.82 feet.
2. DeBay Slough water surface elevation data were not available for the larger flood events. At these events, floodplain flows are
driven by the overbank flow in the Skagit River and less sensitive to antecedent groundwater conditions in the slough.
3. For these two flood events, inflow discharges in upper and lower DeBay Slough are only included to aid in model warmup and do not
impact model results for these larger discharges.
Large flood events, such as the 50- and 100-year floods were not assessed in this habitat improvement feasibility
study, as floods of this magnitude are less relevant for consideration of habitat improvements in the slough and
connector channel. Such events cover very large portions of the Skagit Valley and are best represented by larger
scale hydraulic models such as the CWMS developed by the USACE.
Model Calibration
As detailed in Appendix A-1, NSD performed a model calibration process to validate the model’s ability to
replace hydraulic conditions observed both during the lower habitat flow model runs and the two larger flood
model runs. The model calibration process focused primarily on refining the Manning’s roughness values used to
represent hydraulic roughness within the main channel of the Skagit River, the connector channel, DeBay
Slough, and its surrounding floodplain areas. Additional parameters adjusted during the calibration process also
included the estimated groundwater inflows into DeBay Slough during lower discharges and the assumed
percentage of blockage in the existing culvert under DeBay’s Isle Road. The model calibration process and
supported analyses are included in Appendix A-1 Hydraulic Model Calibration and are summarized below.
NATURAL SYSTEMS DESIGN 22
September 26, 2022SKAGIT COUNTY PUBLIC WORKS DEBAY SLOUGH SITE ASSESSMENT
Model calibration of the mainstem Skagit River focused on lower flows and utilized water surface elevation data
collected by NSD during the mainstem bathymetric survey on February 23, 2022, and during the DeBay Slough
and connector channel survey on March 11, 2022. The low flow model was able to replicate the observed
hydraulic conditions in the Skagit River mainstem, DeBay Slough, and connector channel within 0.5 feet as
compared to the available observed data. Average difference between the observed Skagit River WSE and the
modeled WSE for the same discharge was +0.03 ft, a very close match. Furthermore, the inundated areas of the
Skagit River mainstem matched very well with observed edge of water topographic survey points collected by
NSD, indicated that the topo-bathymetric surface developed for the Skagit River mainstem is representative of
Spring 2022 conditions in the Skagit River. Within DeBay Slough the model over-predicted WSEs slightly with an
average difference between the modeled and observed water surface elevations of +0.23 feet. Within the
connector channel the model underpredicted WSEs with an average difference of -0.39 feet. All three of the key
project areas for the lower, habitat flow runs (Skagit mainstem, DeBay Slough, and connector channel) all
calibrated with less than 0.5 feet of absolute difference between the modeled and observed WSEs, indicating
good agreement with the observed data and that the model sufficiently represents existing conditions for these
flows.
For the high flow model runs, model calibration was done for the run representing the November 16, 2021,
flood event in the Skagit Basin and focused on adjusting floodplain roughness values as well as evaluating
available flood hydrograph data. Available data used for the high flow calibration included high water marks
(HWMs) collected by NHC for Skagit County and summarized in the Post-November 2021 Flood High Water Mark
Inventory Skagit River Downstream of Rockport (NHC, 2022) and the US Army Corps Water Management System
(CWMS) combined 1D/2D HEC-RAS model that was recently recalibrated to the November 16, 2021, flood event
(USACE, 2022). The high flow model run was also able to replicate the observed conditions during the November
16, 2021, flood event within the project vicinity. Available HWMs at DeBay’s Isle Road, the SR 9 bridge and the
intersection of Frances Road and SR 9 showed that the modeled WSE averaged 0.3 feet less than the observed
HMWs. Outside of the project area, but within the model domain, there was greater variation in the modeled
versus observed data, and in general, the hydraulic model tended to underpredict WSE compared to the
available observed data.
5.3.2 Results
NSD used the calibrated hydraulic model to understand the existing patterns of water movement, depth,
elevation, and velocity in the slough and connector channel. Particular focus was applied to the times of year
when juvenile salmonids may use the slough for winter refuge and early summer rearing habitat and when
swans and other waterfowl use the slough and surrounding area for overwintering and night roosting habitat.
Higher flow model runs were performed to better understand overbank and floodplain flows and how they
interact with DeBay Slough, the existing crossing at DeBay’s Isle Road and the surrounding agricultural lands and
residences. The existing conditions hydraulic model results were also considered relative to the culvert through
DeBay’s Isle Road and its effects on water surface elevation, water quality, and fish and wildlife habitat
conditions in the portions of the slough bisected by the roadway. Model output showing computed depth,
velocity and water surface elevation at each flow event are included in Appendix A-2 Hydraulic Model Output
Maps.
Habitat Flow Results
Three of the five modeled flow events focused on representing key habitat conditions and timing of juvenile
salmonid and wintering swans and other waterfowl use of DeBay Slough and the adjacent Skagit River
mainstem. These three events included the 8,000, 15,000 and 22,000 cfs discharges which represent the typical
low flow conditions during August to October, the typical flow condition during winter months when wintering
NATURAL SYSTEMS DESIGN 23
September 26, 2022You can also read