Deep-Sea Exploration (ROV/Mapping) - the ...
←
→
Page content transcription
If your browser does not render page correctly, please read the page content below

doi: 10.25923/bamn-9q27

           Cruise Report: EX-10-04
    INDEX SATAL 2010: Indonesia-USA Joint
     Deep-Sea Exploration (ROV/Mapping)
                             Sangihe Talaud Region, Indonesia

                           Leg 1: Guam, USA, to Bitung, Indonesia
                                (8, June, 2010 - 20, June, 2010)
                        Leg 2: Bitung, Indonesia, to Bitung, Indonesia
                                (23, June, 2010 - 14, July, 2010)
                        Leg 3: Bitung, Indonesia, to Bitung, Indonesia
                               (22, July, 2010 - 7, August, 2010)
                           Leg 4: Bitung, Indonesia, to Guam, USA
                            (14, August, 2010 - 19 August, 2010)

Contributors:
Jeremy Potter, Expedition Coordinator, NOAA Office of Exploration and Research
Kelley Elliott, Expedition Coordinator, NOAA Office of Exploration and Research
Mashkoor Malik, Expedition Coordinator, NOAA Office of Exploration and Research
Elizabeth (Meme) Lobecker, Expedition Coordinator, NOAA Office of Exploration and Research

                                      June 26, 2021

                      Office of Ocean Exploration and Research, NOAA
                           1315 East-West Hwy, SSMC3 RM 10210
                                  Silver Spring, MD 20910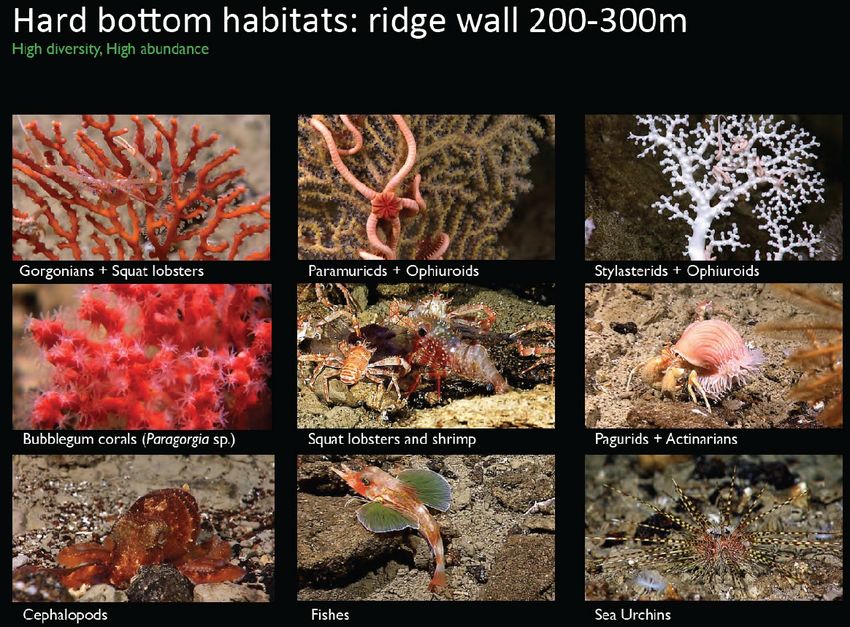
Abstract
The INDEX-SATAL 2010 expedition was the maiden voyage of NOAA Ship Okeanos Explorer, which
worked with the Indonesian research vessel (R/V) Baruna Jaya IV. U.S. and Indonesian scientists
worked side-by-side on both ships as well as in shore-based Exploration Command Centers (ECCs)
in Jakarta, Indonesia and Seattle, WA, where they received information in real time via satellite
and high-speed Internet2 pathways, including high-definition (HD) video of the seafloor from
the Okeanos Explorer’s remotely operated vehicles (ROVs). The expedition consisted of four legs,
with the Okeanos Explorer operating solo on the first and fourth legs, and both ships operating
simultaneously—but in different areas—during the second and third legs. The expedition
explored an area known as SATAL, a contraction of Sangihe and Talaud, two island chains
stretching north of Sulawesi toward the Philippines. The joint science team mapped and explored
Kawio Barat, an active undersea volcano that rises nearly 3,650 m (12,000 feet) from the seafloor.
This expedition revealed a high marine diversity in the area extending into the deep ocean.
International collaboration was highlighted by the inclusion of both American and Indonesian
scientists on each ship, establishment and use of an ECC in Jakarta, and the complementary
scientific work of each ship. The Okeanos Explorer mapped the deep ocean floor and water
column, collecting oceanographic data and collecting HD video using an ROV, a capability the
Baruna Jaya IV does not have. The Baruna Jaya IV mapped the seafloor in different locations and
collected biological and inorganic samples, a capability the Okeanos Explorer did not have during
the expedition.

The expedition, through the involvement of Indonesian and U.S. scientists, contributed to the
Coral Triangle Initiative (http://www.coraltriangleinitiative.org, last accessed Oct. 2020), a
partnership of six Southeast Asian countries whose waters cover a triangular-shaped area where
the Indian and Pacific Oceans meet. The joint expedition was a powerful demonstration of this
commitment, sharing knowledge in real time with scientists in Seattle and Jakarta, with students
in their classrooms, and with the world in other venues and online.

This report can be cited as follows:
Potter, J., Kelley, E., Malik, M. and Lobecker, E. (2021). Cruise EX-10-04, 2010 INDEX SATAL 2010:
Indonesia-USA Deep-Sea Exploration. Office of Ocean Exploration and Research, Office of Ocean
Exploration and Research, Office of Oceanic and Atmospheric Research, NOAA, Silver Spring, MD
20910. OER Expedition Rep. 10-04. https://doi.org/10.25923/bamn-9q27

For further information direct inquiries to:
NOAA Office of Ocean Exploration and Research
1315 East-West Hwy, SSMC3 RM 10210 Silver Spring, MD 20910
Phone: 301-734-1014 Fax: 301-713-4252
Email: oceanexplorer@noaa.gov

                                                                                                2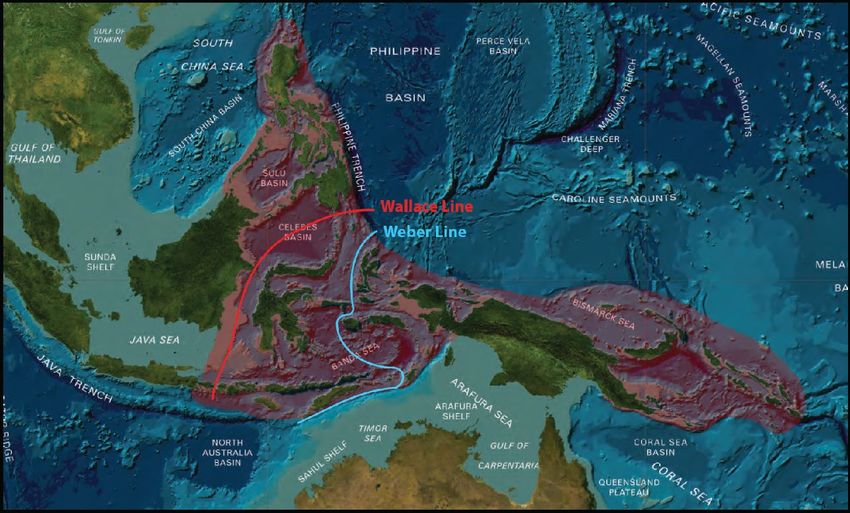
Acknowledgements:
The dedication and efforts of the crews of NOAA Ship Okeanos Explorer and R/V Baruna Jaya IV
were greatly appreciated, and made INDEX-SATAL 2010 possible.

INDEX-SATAL 2010 mission partners included the NOAA Office of Ocean Exploration and Research
(OER), Indonesia Ministry of Marine Affairs and Fisheries (BRKP-DKP), Indonesia Agency for the
Assessment and Application of Technology (BPPT), Bandung Institute of Technology (ITB), U.S.
Embassy Jakarta, The Exploratorium, and SeaWorld Indonesia. The Indonesian National Military
(TNI) provided necessary security during the expedition. The Indonesia-U.S. Ocean Exploration
Steering Committee efforts are greatly appreciated in helping to guide the development of the
INDEX-SATAL 2010 expedition.

Steering Committee Members included:
Dr. Gellwynn Jusuf, Chairman, BRKP-DKP            David McKinnie, NOAA
Dr. Marzan Iskandar, Chairman, BPPT-DKP           Jeremy Potter, NOAA
Dr. Budi Sulistyo, BRKP-DKP                       Hugo Yon, U.S. Embassy
Kol. Laut Dede Yuliadi TNI-Marine Hydro-
Oceanography Service (Dishidros AL)

Indonesia-U.S. Ocean Exploration Partnership Science Planning Team Members included:
Indonesia Science Team Members:
Sugiarta Wirasantosa – Co-PI (BRKP-DKP)           Hamdan Abidin Ministry of Energy and
Nanik Heryati (BPPT)                              Mineral Resources-Geological Agency (PSG-
Aryo Hanggono (BRKP-DKP)                          ESDM)
Noorsalam Nganro (ITB)                            Hasanuddin Abidin (ITB)
Yudi Anantasena (BPPT)                            KH Dede Yuliadi (TNI-Dishidros AL)
Wahyu Pandoe (BPPT)                               Iswinardi (Ditwilhan-Dephan)
                                                  Safwan Hadi (ITB)
U.S. Science Team Members:
Steve Hammond, Co-PI, (NOAA)                      Timothy Shank (Woods Hole Oceanographic
Rusty Brainard (NOAA/Pacific Islands              Institution [WHOI])
Fisheries Science Center [PIFSC])                 Verena Tunnicliffe (University of Victoria
Patricia Fryer (University of Hawaiʻi [UH])       [UVic])
Larry Mayer (University of New Hampshire          Nathan Buck (University of Washington
[UNH])                                            [UW]/Joint Institute for the Study of the
James Holden (University of                       Atmosphere and Ocean [JISAO])
Massachusetts at Amherst [UMass])

We also acknowledge Craig Russell, Steve Hammond, David McKinnie, and Susan Gottfried for
their help with compiling this report.

                                                                                            3
Table of Contents

1.   Introduction                                                                                                                      6
2.   Project Background                                                                                                                6
     2.1 Objectives for EX-10-04: INDEX-SATAL 2010 ............................................................. 7
     2.2 Programmatic Objectives                                                                                                       8
3. Participants                                                                                                                        9
4. Methods                                                                                                                           12
     4.1 Ship Specifications..................................................................................................... 13
     4.2 Equipment ................................................................................................................. 14
     4.2.1 ROV and Camera Platform                                                                                                   14
     4.2.2 Mapping Capabilities                                                                                                      15
     4.4 Telepresence Capability Overview                                                                                            19
     4.4 Operations ................................................................................................................. 25
5. Clearances and Permits                                                                                                            30
6. Schedule                                                                                                                          30
7. Results                                                                                                                           34
     7.1 Geomorphology and Geology .................................................................................... 35
     7.2 Biodiversity ................................................................................................................ 36
     7.3 Kawio Barat ............................................................................................................... 40
8.   Data Deposition and Archival                                                                                                    43
     8.1 Data Collected ........................................................................................................... 43
     8.2 OER Data Discoverability Tools ................................................................................. 45
     8.3 Video Data ................................................................................................................. 46
9. References                                                                                                                        46
10. Appendices                                                                                                                       49
     Appendix A: Data Management Plan ............................................................................... 49
     Appendix B: Implementing Arrangement .......................................................................... 69
     Appendix C: Acronyms .................................................................................................... 83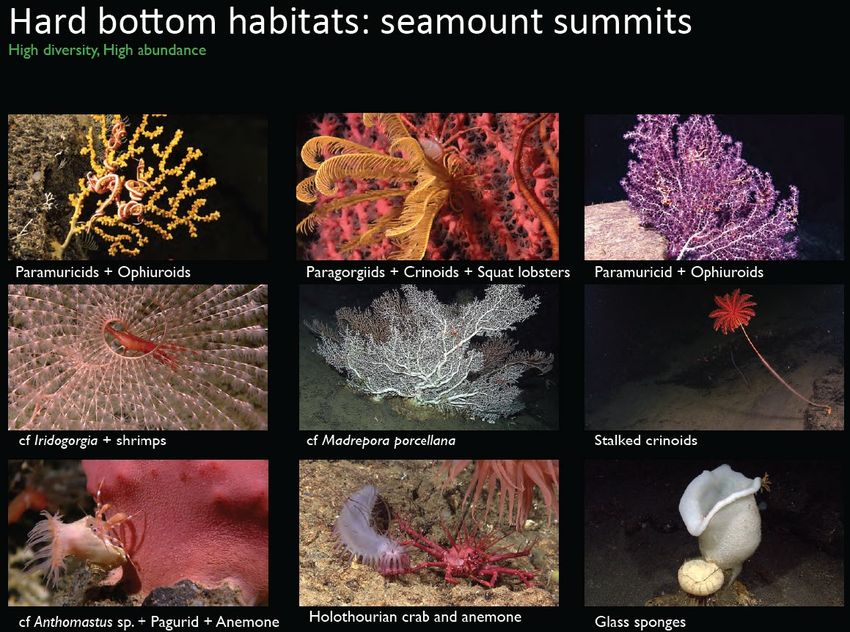
Tables
Table 1. NOAA Ship Okeanos Explorer onboard mission team personnel during EX-10-04. ... 10
Table 2. Shore-based science team participants for EX-10-04. ............................................... 11
Table 3. Specifications for ships used during EX-10-04. ......................................................... 13
Table 4. Location of ARMS installed. ...................................................................................... 26
Table 5. CTD locations conducted by R/V Baruna Jaya IV ...................................................... 27
Table 6. Location of the trawl stations conducted by R/V Baruna Jaya IV. .............................. 28
Table 7. CTD casts collected by Okeanos Explorer during EX-10-04 Leg 2. ........................... 28
Table 8. ROV dives conducted during the cruise..................................................................... 29
Table 9. Expedition Schedule.................................................................................................. 31
Table 10. Exploration metrics. ................................................................................................. 34

Figures
Figure 1. Overview of the INDEX-SATAL 2010 exploration area. .............................................. 7
Figure 2. The Camera Platform .............................................................................................. 14
Figure 3. Diagram of IFE’s Little Hercules ROV detailing the location of key components. ...... 15
Figure 4. EM302 hardware ...................................................................................................... 16
Figure 5. POS MV hardware. .................................................................................................. 17
Figure 6. The arrangement of the miscellaneous antennas onboard ....................................... 17
Figure 7. Ship CTD system ..................................................................................................... 18
Figure 8. Sippican XBT launch setup ...................................................................................... 19
Figure 9. Overview of the telepresence setup ......................................................................... 19
Figure 10. The VoIP intercom system ..................................................................................... 21
Figure 11. An example of chat log entries. .............................................................................. 23
Figure 12. CTD casts and CTD water samples collected by R/V Baruna Jaya IV .................... 27
Figure 13. Location of the trawl stations conducted by R/V Baruna Jaya IV. ........................... 28
Figure 14. Overview summary map......................................................................................... 35
Figure 15. A few representative images of potential new species discovered ......................... 37
Figure 16. Preliminary species estimates for gorgonian and black corals ................................ 37
Figure 17. Map of the Celebes Sea region .............................................................................. 38
Figure 18. Biodiversity (number of species) distribution worldwide .......................................... 39
Figure 19. Representative species observed .......................................................................... 40
Figure 20. CTD cast with light scattering (LSS) and Oxidation-Reduction Potential (ORP) ..... 41
Figure 21. Images from Kawio Barat ....................................................................................... 42
Figure 22. Representative images of fauna observed during the ROV dives over Kawio Barat
in vicinity of hydrothermal activity. ........................................................................................... 43
Figure 23. Example of few entries in the Eventlog................................................................... 44
Figure 24. An example of the dive summaries ........................................................................ 45

                                                                                                                                  5
1. Introduction
By leading national and collaborative international efforts to explore the ocean and make ocean
exploration more accessible, the NOAA Office of Ocean Exploration and Research (OER) is filling
gaps in basic understanding of deep waters and the seafloor, providing deep-ocean data,
information, and awareness. Ocean exploration is an interdisciplinary approach for assessing
and investigating the physical, chemical, and biological characteristics of the ocean floor, the
ocean itself, and the diversity of life forms that inhabit the marine environment. Ocean
exploration is intended to yield a body of knowledge that may result in immediate benefit or
may inform research hypotheses that result in new scientific understanding in the future. From
mapping and characterizing previously unseen seafloor to collecting and disseminating data and
information about deep waters and the seafloor—and the resources they hold—this work
establishes a foundation of information and fills data gaps.

Using the latest tools and technology, OER explores unknown areas of the deep ocean. NOAA
Ship Okeanos Explorer is one such tool. Working in close collaboration with government
agencies, academic institutions, and other partners, OER conducts deep-sea exploration
expeditions using the advanced technologies on Okeanos Explorer, mapping and characterizing
areas of the ocean that have not yet been explored.

All data collected during Okeanos Explorer expeditions adhere to federal open-access data
standards and are publicly available shortly after an expedition ends. This ensures the delivery
of reliable scientific data needed to identify, understand, and manage key elements of the ocean
environment.

Exploring, mapping, and characterizing the seafloor are necessary for a systematic and efficient
approach to advancing the development of ocean resources, promoting the protection of the
marine environment, and building a better appreciation of the value and importance of the
ocean in our everyday lives. As the only U.S. federal program dedicated to ocean exploration,
OER is uniquely situated to lead partners in delivering critical deep-ocean information to
managers, decision makers, scientists, and the public—leveraging federal investments to meet
national priorities.

2. Project Background
INDEX-SATAL 2010 (EX-10-04) was a joint ocean exploration expedition between NOAA Ship
Okeanos Explorer and the Indonesian research vessel (R/V) Baruna Jaya IV. The expedition
symbolized plans for a long-term commitment to the partnership between NOAA and
representative Indonesian scientific ministries and agencies. For the 2010 expedition, the
operations focused on the Sangihe Talaud (SATAL) region, which was proposed by Indonesian
scientists as a priority area for ocean exploration (Figure 1). The Co-Principal Investigators

                                                                                              6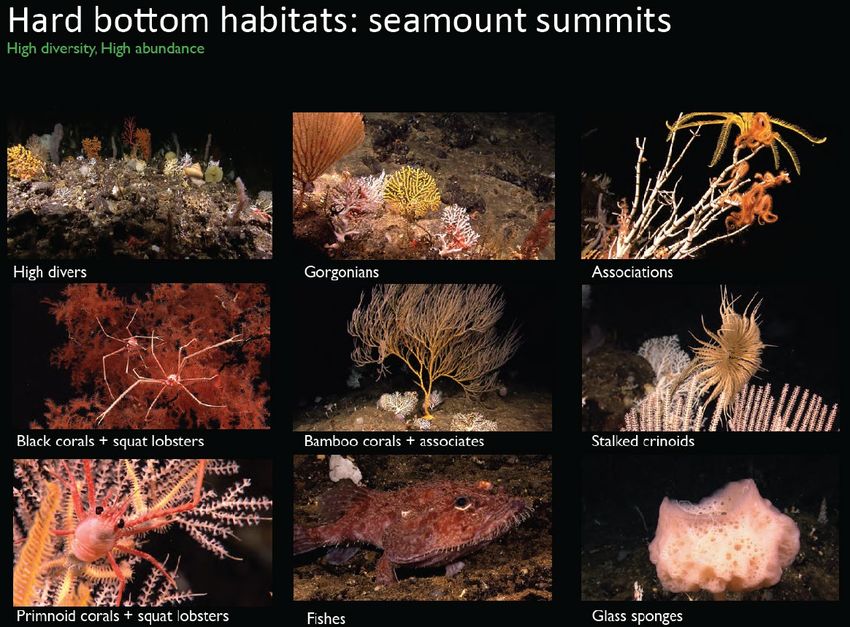
anticipated that the Indonesian-U.S. Ocean Exploration Partnership would reveal new—and
perhaps unique—discoveries, including but not limited to:

    1.      New ecosystems associated with seamounts, spreading centers, and the deep
            ocean (e.g., trenches) that are often centers for biologically-diverse communities of
            fishes and invertebrates (including corals);

    2.      Areas of volcanic and hydrothermal vent activity where biologically-unique
            communities typically are found in association with widely varying ambient water
            temperatures and extreme chemical environments; and,

    3.      Insights into ocean acidification processes, as well as the budgets and cycles of the
            deep ocean and volcanically-derived gases—such as carbon dioxide—that may have
            a role in climate and ecosystem variability.

Figure 1. Overview of the INDEX-SATAL 2010 exploration area.

2.1 Objectives for EX-10-04: INDEX-SATAL 2010

The primary science objectives for the joint Indonesia-U.S. 2010 exploration expedition
included:

    1. Locating sites of interest for exploration (e.g. deep-sea hydrothermal vents, coral reefs,
       cold seeps, and fish habitats);

    2. Conducting geological, geophysical, biogeographical, and biodiversity assessments of
       these sites;

                                                                                                7
3. Mapping plume distributions (to increase the potential for discovering any near- and/or
      far-field biological consequences of dissolved or particulate chemical plume advection);

    4. Initiating characterization of ecosystem relationships to both regional and local
       geological settings (including biological/habitat relationships) in the regions explored;
       and

   5. Bathymetric mapping to reveal insights into active and historical submarine volcanic
      processes, local and regional current flow, and tectonic and structural processes that
      may include tsunamigenic risk.

The Indonesian partners agreed to provide the Baruna Jaya IV for approximately 28 days during
the summer of 2010. The U.S. partners agreed to transit the Okeanos Explorer from Hawaiʻi to
Indonesia and provide approximately 45 days of total time in Indonesian waters. The U.S.
partners also agreed to build an Exploration Command Center (ECC) in Jakarta.

Based on shipboard capabilities of NOAA Ship Okeanos Explorer and R/V Baruna Jaya IV, the
following data collection goals for the regions of interest were identified:

   1. Acquisition of large-scale bathymetric coverage of the areas of interest using
      multibeam systems (Baruna Jaya IV and Okeanos Explorer);

   2. Location of physical or chemical plumes from active volcanic and/or hydrothermal sites
      using the CTD/rosette systems (Baruna Jaya IV and Okeanos Explorer);

   3. Collection of representative biota using fisheries equipment (Baruna Jaya IV);

   4. Optical imaging of identified targets of interest to achieve geological and biological
      objectives using the Okeanos Explorer’s dual-bodied Little Hercules remotely operated
      vehicle (ROV) system;

   5. Collection of bathymetric data for selected, relatively shallow-water areas using the
      Baruna Jaya IV’s multibeam system; and

   6. Cataloging habitat types and biota along continuous deep-to-shallow water profiles in
      selected areas.

2.2 Programmatic Objectives

Mapping and ROV and Operations
Mapping objectives during each Okeanos Explorer cruise are to collect high-resolution acoustic
data. At the time of the expedition, data were collected from the EM 302 multibeam. Mapping
data were acquired during transits (when permissible), as well as on specific targets identified
by the science team. Data from these systems were processed as quickly as possible in order to
generate daily mapping products that supported ROV operations.

                                                                                                   8
ROV objectives were to obtain high-quality video and sensor data on exploration targets to
achieve the science objectives. This most often involved surveying benthic habitats and features
in priority areas (e.g., deep corals and related benthic ecosystems, canyons, and seamounts).
Benthic surveys were not only used to characterize the habitats in each target area, but also to
ground truth the acoustic data with visual data (i.e., video). At the time of expedition, no
sampling capability was available and no samples were taken.

Telepresence
Telepresence objectives were to provide real-time, high-quality video during ROV dives to
shoreside scientists, managers and ECC visitors. Visitors to the Jakarta ECC passively watched
the dives, while scientists, managers and students actively participated by watching the live
video and communicating via teleconference and/or instant messaging. Telepresence was used
to help achieve the science objectives by extending the science team well beyond those actually
onboard the ship.

Data Management
Data management objectives were to collect, process, distribute, and archive cruise data as
quickly and efficiently as possible. Effective data management provided a foundation of publicly-
accessible information products to spur further exploration, research, and management
activities; it also stimulated interest in the deep-sea environment and the excitement of
exploration.

Education and Outreach
Education and outreach objectives included the engagement of the general public in ocean
exploration through the Ocean Explorer website, both during and after each cruise. Web content
included topical essays written before the cruise, daily updates, mission logs, highlight videos,
still imagery, and mapping products—all of which are posted on the OER website:
 (https://oceanexplorer.noaa.gov/okeanos/explorations/10index/welcome.html, last accessed
Dec. 2020). Educational materials, including grades 5-12 lesson plans, were also developed
around the expedition and can be found at:
https://oceanexplorer.noaa.gov/okeanos/explorations/10index/background/edu/edu.html
(last accessed Dec. 2020). Educational experiences were also achieved through school tours to
ECCs during live broadcasts. Critical webpages during the expedition were also made available
in the Indonesian language.

3. Participants
At-sea personnel for EX-10-04 included the expedition coordinator, mapping specialists, ROV
engineers, video engineers, data specialists, and onboard scientists. Shore-based science team
members participated from remote ECCs and from their home locations via telepresence
technology. Lists of these participants are provided in Tables 1 and 2 below.

                                                                                               9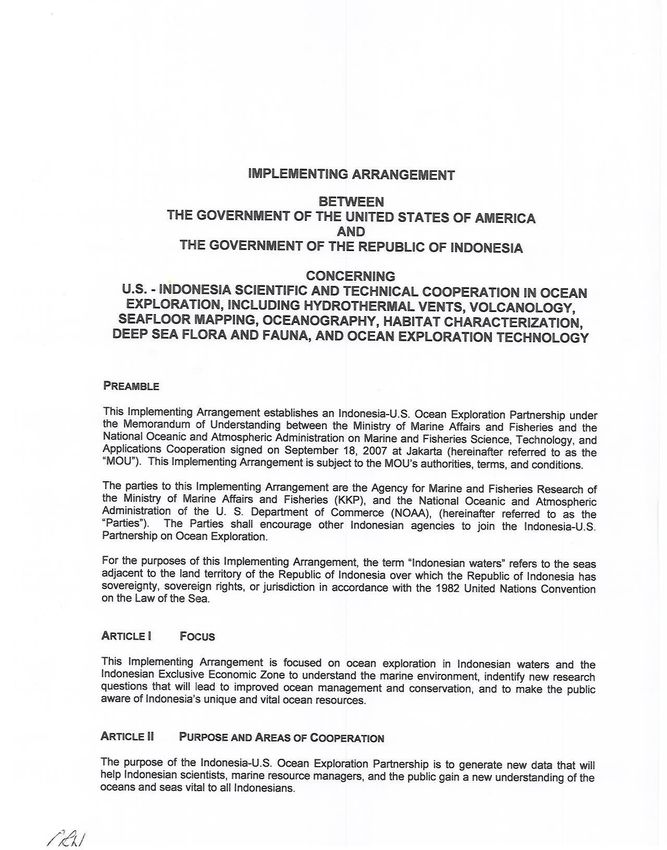
Table 1. NOAA Ship Okeanos Explorer onboard mission team personnel during EX-10-04.

                                Leg1             Leg2             Leg3                Leg4
 #    Role                      Name             Name             Name                Name
                                                                                      Elizabeth
 1    Expedition Coordinator    Jeremy Potter    Jeremy Potter    Kelley Elliott      (Meme)
                                                                                      Lobecker
                                Michael
 2    Indonesian Science Lead                    Xerandy          Ranier Arief Troa
                                Purwoadi
 3    U.S. Science Liaison                       John Sherrin     Santiago Herrera
                                                 Major Zayadi     Major Dian
 4    Indonesian TNI Official
                                                 Muddan           Adrianto
                                                 Mashkoor
 5    Mapping Team Leader       Mashkoor Malik                    Meme Lobecker
                                                 Malik
      Mapping Watchstander/                                                           Shannon
 7                              Lillian Stuart   Tom Kok          Tom Kok
      ROV Navigator                                                                   Hoy
      Mapping Watchstander/                                                           Elaine
 8                              Tom Kok          Karl McLetchie   Karl McLetchie
      ROV Navigator                                                                   Stuart
      Mapping Watchstander/
 9                              Karl McLetchie   Joel DeMello     Joel DeMello
      ROV Navigator
 10   ROV Team Coordinator                       Dave Lovalvo     Dave Lovalvo
 11   ROV Pilot 1                                Dave Wright      Dave Wright
 12   ROV Pilot 2                                Randy Pricket    Tom Orvosh
 13   ROV Pilot 3                                Eric Prechtl     Craig Dawe
 14   ROV Co Pilot 1                                              Jon Mefford
 15   ROV Co Pilot 2                             Joe Biscotti     Christopher Loo
 16   ROV Co Pilot 3                             Brian Bingham    Vincent Howard
 17   ROV Video 1               Roland Brian     Tom Pierce       Roland Brian
 18   ROV Video 2                                Roland Brian     Randy Visser
 19   Telepresence Lead         Webb Pinner      Webb Pinner      Webb Pinner
      Video/Telepresence                         Doug             Brian Brinkman
 20
      Technician                                 Jongeward
                                Nathan Buck
      Additional Support        Megan Nadeau
 21
      Personnel                 Tom Pierce
                                Joel DeMello

                                                                                                  10
Table 2. Shore-based science team participants for EX-10-04.
Personnel in ECCs during EX-10-04 Leg 1
Name Affiliation Role Location
Steve Hammond OER U.S. Chief Scientist Jakarta, Indonesia
Sugiarta Wiransantosa BRKP Indonesia Chief Scientist Jakarta, Indonesia
John McDonough OER OER Deputy Director Jakarta, Indonesia
David McKinnie OAR U.S./Indonesia Liaison Jakarta, Indonesia
Ed Baker PMEL U.S. Scientist PMEL—Seattle, WA
David Butterfield PMEL U.S. Scientist PMEL—Seattle, WA
Sharon Walker PMEL US Scientist PMEL—Seattle, WA
Joe Resing PMEL US Scientist PMEL—Seattle, WA
Craig Russell OER OER Mission support PMEL—Seattle, WA
Doug Jongeward PMEL ECC Technical Support PMEL—Seattle, WA
Inner Space Center (ISC)—
Catalina Martinez OER OER Mission support
Narragansett, RI
Elizabeth (Meme) Lobecker OER OER Mission support UNH—Durham, NH
Personnel in ECCs during EX-10-04 Leg 2
Name Affiliation Role Location
Steve Hammond OER U.S. Chief Scientist Jakarta, Indonesia
Sugiarta Wiransantosa BRKP Indonesia Chief Scientist Jakarta, Indonesia
Jim Holden UMass U.S. Scientist/Science Lead Jakarta, Indonesia
David McKinnie OAR U.S./Indonesia Liaison Jakarta, Indonesia
Patty Fryer UH U.S. Scientist Jakarta, Indonesia
Catalina Martinez OER OER Mission Support ISC—Narragansett, RI
Verena Tunnicliffe UVic Canadian Scientist Victoria, BC
Ed Baker PMEL U.S. Scientist Seattle, WA
Dave Butterfield PMEL U.S. Scientist/Science co-Lead Seattle, WA
Jennifer Lin UMass U.S. Scientist Seattle, WA
Cherisse du Preez UVic Canadian Scientist Seattle, WA
Craig Russell OER U.S./Indonesia Liaison Seattle, WA
Web Coordinator/
Kelley Elliott OER Seattle, WA
Operations Support
Ridge Liepins PMEL Telepresence Technician Seattle, WA
Kristine Kosinksi UH U.S. Scientist Seattle, WA
Tim Shank WHOI U.S. Scientist Woods Hole, MA
Santiago Herrera WHOI U.S. Scientist Woods Hole, MA
Seattle, WA; Woods Hole,
Eleanor Bors WHOI U.S. Scientist
MA
Catriona Munro WHOI U.S. Scientist Woods Hole, MA
11Jill McDermott WHOI U.S. Scientist Woods Hole, MA
Personnel in ECCs during EX-10-04 Leg 3
Name Affiliation Role Location
Steve Hammond OER U.S. Chief Scientist Jakarta, Indonesia
Sugiarta Wiransantosa BRKP Indonesia Chief Scientist Jakarta, Indonesia
Tim Shank WHOI U.S. Scientist/ Science Lead Jakarta, Indonesia
David McKinnie OAR U.S./Indonesia Liaison Jakarta, Indonesia
Jeremy Potter OER U.S./Indonesia Liaison Jakarta, Indonesia
Catalina Martinez OAR OER Mission Support ISC—Narragansett, RI
Craig Russell OER U.S./Indonesia Liaison Jakarta, Indonesia
Verena Tunnicliffe UVic Canadian Scientist Victoria, BC
Marjolaine Matabos UVic Canadian Scientist Victoria, BC
Dustin Schomagel UVic Canadian Scientist Victoria, BC
John Sherrin UVic Canadian Scientist Victoria, BC
Samantha Zelin UMass U.S. Scientist Seattle, WA
Elizabeth Sibert WHOI U.S. Scientist Woods Hole, MA
Eleanor Bors WHOI U.S. Scientist Seattle, WA
David Butterfield PMEL U.S. Scientist Seattle, WA
Marine
Julie Huber Biological U.S. Scientist Seattle, WA
Laboratory
Ridge Liepins PMEL Telepresence Technician Seattle, WA
Jim Holden UMass U.S. Scientist Amherst, MA
Jennifer Lin UMass U.S. Scientist Amherst, MA
Yusuf Surachman
BPPT Indonesian Scientist Seattle, WA
Djajadihardja
Tryono Indonesian Scientist Seattle, WA
4. Methods
To accomplish its objectives, EX-10-04 used:
● NOAA Ship Okeanos Explorer and R/V Baruna Jaya IV.
● Dual-bodied ROV system (ROVs Little Hercules and a camera platform) to conduct
daytime seafloor and water column surveys.
● Sonar systems (Kongsberg EM 302 multibeam sonar and Knudsen 3260 sub-bottom
profiler) to conduct mapping operations at night and when the ROVs were on deck.
● A high-bandwidth satellite connection to provide real-time ship-to-shore
communications (telepresence).
12All environmental data collected by NOAA must be covered by a data management plan to
ensure they are archived and publicly accessible. The data management plan for EX-10-04 is
provided as Appendix A.
While Baruna Jaya IV conducted parallel operations in support of the INDEX-SATAL 2010
mission, this cruise report covers only the detailed operations of Okeanos Explorer.
4.1 Ship Specifications
Relevant ship specifications for Okeanos Explorer and Baruna Jaya IV are provided as Table 3.
Table 3. Specifications for ships used during EX-10-04.
Indonesian R/V Baruna Jaya IV NOAA Ship Okeanos Explorer
Call sign: PLIQ
Length overall (LOA): 60.4 m Hull Number 337
Breadth: 12.1 m Call letters WTDH
Draft: 4.15 m Launched Oct 28, 1988
Gross register tonnage (GRT): 1,219 T Delivered to Sept 10, 2004
Main engine 2 × 1,100 PS Niigata 5PA5L NOAA
Single propeller Commissioned Aug 14, 2008
Speed: 8-9 knots LOA 68.3 m (224 feet)
Accommodation: 50 personnel Breadth 13.1 m (43 feet)
Builder: CMN, France Draft 5.18 m (17 feet)
Launched: 1995 Range 9,600 nm
6 ton A–Frame, 3-ton Crane Endurance 40 days
1,000 m for bottom trawl &
Main propulsion 2,800 hp General electric
up to 6,000 m for mooring line)
DC drive motors
Gilson winch (2)
Cruising speed 10 knots
Otter winch (2)
Mapping speed 8 knots
Otter
Berthing 46
Hydrographic winch/Gantry
Cold Storage: 20t (-10 C), 1t (-20 C) Commissioned 6
Officers
Licensed engineers 3
Crew 18
Scientists 19
134.2 Equipment
4.2.1 ROV and Camera Platform
The EX is equipped with a 4,000 meter rated two-body ROV system composed of a camera
platform (Figure 2) and ROV, Little Hercules (Figure 3). The Little Hercules ROV came to the
Okeanos Explorer through collaboration between OER and Dr. Robert Ballard’s Institute for
Exploration (IFE) at the University of Rhode Island (URI). Little Hercules went through an
extensive four-month overhaul before the expedition that included a new motor controller and
power bottle system, an upgraded fiber-optic multiplexer system, a new ultra-short baseline
(USBL) Tracking System, a full-color imaging sonar, a new conductivity, temperature, and depth
(CTD) sensor, two new single-chip color charge-coupled device (CCD) cameras, two new light-
emitting diode (LED) lights, two 400-watt hydrargyrum medium-arc iodide (HMI) lights and a
high-definition (HD) video camera. New tethers, new tether terminations, a new transformer, a
new electrical junction box, new depth and altitude sensors, a new light bar, and a new version
of control software were also installed.
During dives the camera platform is suspended from the A-frame by the primary umbilical, while
Little Hercules (LH) is free to explore to the extent of its neutrally buoyant 40m tether. The
camera platform serves as lighting and imaging platform, looking down to illuminate and image
the area around LH, while LH, decoupled from the ship’s motion, can collect stable HD imagery
of the seafloor.
Figure 2. The Camera Platform, as originally designed and built by Pheonix International (left, credit: Dave
Lovalvo, Eastern Oceanics). The image on the right shows the camera platform as reconfigured and used
during the INDEX SATAL expedition.
14Figure 3. Diagram of IFE’s Little Hercules ROV detailing the location of key components.
The main scientific data product returned from the vehicles is the HD video and still imagery.
Little Hercules is equipped with an HD Camera (Insite Zeus Plus) mounted on a rotator unit
(Remote Ocean Systems R-25-FB) which allows it to tilt from viewing straight ahead to straight
down. Both vehicles rely on high intensity (HMI) lights to illuminate their surroundings. Little
Hercules is equipped with a pair of HMI Lights with flood reflectors (Deep Sea Power and Light
400W Sea Arc 2). Finally, to provide scale to the imagery, LH has a pair of parallel, camera
mounted red lasers (DSPL Micro SeaLasers), separated by 10cm. Little Hercules carries a CTD
(Seabird 49 FastCAT) that returns only conductivity, temperature, and depth measurements.
The remaining sensors on the vehicles are dedicated to navigating and positioning during dives.
These sensors include depth gauges, altimeters, inertial measurement unit (LH), scanning
sonar’s, and Ultra Short Baseline (USBL) tracking transponders.
4.2.2 Mapping Capabilities
Okeanos Explorer was equipped with a 30 kHz Kongsberg EM 302 multibeam sonar and a 3.5
kHz Knudsen sub-bottom profiler (SBP 3260) during this expedition (Lobecker et al., 2011).
During INDEX-SATAL 2010, EM 302 bottom bathymetric and backscatter data were collected.
Additionally, EM 302 water column data were logged for most of the cruises, when the ship
worked offshore Guam in an area where identification of hydrothermal vents was a priority. The
ship used a Position and Orientation System for Marine Vessels (POS MV), Applanix ver. 4, to
record and correct the multibeam data for any motion. The C-Nav Global Positioning System
(GPS) provided Differential GPS (DGPS) correctors with position accuracy expected to be better
than two meters.
15All the corrections (motion, sound speed profile, sound speed at sonar head, draft, and sensor
offsets) were applied during real-time data acquisition in Seafloor Information System (SIS), ver.
1.04. Expendable bathythermograph (XBT) casts (Deep Blue, maximum depth of 760 m) were
taken every six hours and in between if needed. XBT cast data were converted to an SIS-
compliant format using Velocipy, a NOAA in-house tool for XBT processing.
Multibeam Echo Sounder (MBES)
Okeanos Explorer is equipped with a Kongsberg Maritime EM 302 multibeam sonar system. The
sonar system was hull mounted by Todd Shipyard in Seattle during 2006/2007. The installation
was accepted after field tests in September 2008. The EM 302 receiver and transmit arrays are
arranged in a transducer fairing installed between frame 15 and 42 (Figure 4). The topside
electronics (trans-receiver unit—primary user [PU] unit) for the EM 302 are located in an
enclosed closet in the ship’s library, and the EM 302 control and acquisition software SIS station
is located in main mission space in the Control Room on the 01 deck. A remote on/off switch is
also located next to the SIS acquisition station. The SIS computer is located in the rack room
(Figure 4).
Figure 4. EM302 hardware (Clockwise from left) EM 302 Transmit Receive Unit (TRU) unit,
transducer fairing, elements of EM 302 being installed inside the fairing, and the TRU remote
on/off switch.
The nominal frequency of EM 302 is 30 kHz. The system can be operated in two modes—
continuous waveform (CW) or frequency modulated (FM) mode. The distinctive advantage of
FM mode is that larger swath coverage can be realized as compared to traditional deepwater
multibeam systems. The sonar also utilizes multi-ping technology (dual swath) where two
pings are simultaneously sent into water thereby increasing the data density.
16Positioning and Orientation Equipment
The Applanix/TSS POS MV estimates position, heading, attitude, and heave of the vessel. The
inertial measurement unit (IMU) is located in the fan room in front of the ship’s library (between
frames 35-40) (Figure 5). The system includes the POS MV computer system (PCS), an IMU, and
two GPS antennas (Figure 6).
Figure 5. POS MV hardware. From left to right: IMU and granite block, IMU, and the IMU under protective
housing.
Figure 6. The arrangement of the miscellaneous antennas onboard , including the Civil Navigation (CNAV)
GPS antenna and the POS MV port and starboard antennas.
Sound Speed Measurements
Vertical Profiling:
Okeanos Explorer has several systems for conducting vertical profiling of the water column. A
seabird Electronics Model 9/11+ CTD is installed in a 24-position rosette frame with a seabird
SBE-32 carousel (Figure 7). There are 24 2.5L niskin bottles. The SBE 9+ underwater unit has a
depth capability of 6800 meters and a dual conductivity/temperature sensor pair. This system
has four ports available for up to 8 auxiliary sensors. Additional sensors installed on the CTD
frame may include: Light Scattering, Dissolved Oxygen (DO), Oxygen Reduction Potential (ORP)
and Altimeter.
17Okeanos Explorer, at the time of this expedition was outfitted with two Sea-Bird Electronics, Inc.,
(SBE) 9/11Plus CTDs, each with dual “3Plus Temperature” and “4C Conductivity” sensors. “3Plus
Temperature” sensors are certified by SBE to demonstrate temperature measurement drift of
less than 0.001 °C and time measurement accuracy within 0.065 ± 0.010 seconds. “4C
Conductivity” sensors are ideally suited for obtaining horizontal data with towed systems or
vertical data with lowered systems. This unit is capable of collecting temperature, conductivity,
pressure and depth in real time; salinity and sound velocity are calculated in real time via SBE
Seasave acquisition software. One complete package is used to collect data and the other is kept
as a spare. The ship must hold station to conduct a CTD cast. The CTD is lowered through the
water column at 60 m/min.
Figure 7. Ship CTD system (Left) Deck Unit (SBE 11) for acquisition of real time sound speed profile from
SBE 9 plus CTD (Right) Horizontal mounted CTD with dual Temperature and Conductivity sensors and SBE
32 Carousel for 24-bottle water sampling.
Lockheed Martin Sippican XBT casts were conducted on the aft deck with a portable launcher
(Figure 8). Expendable sound velocity (XSV) probes were also used to measure sound velocity
directly. The data were collected in real time with the WinMK21 acquisition software. The major
difference between the CTD and XBT is that an XBT/XSV cast can be completed while the ship is
underway. The “Deep Blue” XBT probes can be launched at ship speeds of up to 20 knots, and
collect data to a maximum depth of 760 m. A small amount of XBT-T5 probes are available
onboard, to be used for comparisons casts when CTD operations are not available. XBT-T5
18probes can be launched at ship speeds of up to six knots and collect data to a maximum depth
of 1,830 m.
Figure 8. Sippican XBT launch setup from the aft deck (left). Deck unit for Sippican XBT (right).
4.4 Telepresence Capability Overview
A key and unique capability of the Okeanos Explorer is its ability to allow explorers and audiences
ashore to participate in the expedition in real time. Using telepresence, explorers at shore-based
ECCs can view live HD video from the ship, watch ROVs and mapping systems, transfer data at
high speeds, and talk directly to explorers on the ship and at other ECCs around the world.
The telepresence capability supporting the Okeanos Explorer is composed of several categories
of advanced technology infrastructure: network, video, audio communications, data logging,
data transfer, and data management (Figure 9).
Figure 9. Overview of the telepresence setup used during the INDEX-SATAL 2010 expedition.
19VSAT and Network Infrastructure
The network infrastructure supporting the telepresence capability includes several ship-based,
space-based, and shore-based components. Onboard, the ship contains a robust local area
network (LAN) connecting all of the exploration systems for operations and data transmission.
To move data and information off the ship to the shore, the ship utilizes a 3.7m C-Band Very
Small Aperture Terminal (VSAT) to transmit high-speed data or video up to 20 megabits-per-
second (Mbps) and receive data up to five Mbps. The C-Band VSAT transmits to and receives
from a global beam linear or circular polarization C-Band satellite (the actual satellite utilized
depends on the planned operating area; during INDEX-SATAL 2010, Intelsat 5 [IS-5] with linear
polarization was used) via either or both a high-speed and low-speed modem (the modem used
depends upon the data types and destinations). The satellite connects to a shore-based earth
station located in the continental U.S. (the earth station used depends on the satellite used and
earth station availability for the selected satellite; during INDEX-SATAL 2010, the Steele Valley
Satellite Earth Station near Perris, California, was utilized). From the earth station, all data and
information are sent via a high-speed fiber optic cable to the NOAA network (actual entry
location into the NOAA network depends on earth station used and the nearest NOAA network
entry point; during INDEX-SATAL 2010, the NOAA network entry point was at NOAA
headquarters in Silver Spring, Maryland). From the NOAA network, the information is split in
two directions. Video is sent directly out onto Internet2 as a multicast video signal. Audio
intercom communications are sent out onto standard commodity Internet, and the data are
transferred to relevant locations via Internet2, commodity Internet, or the NOAA proprietary
network, depending on the destination and routing from the ship. During INDEX-SATAL 2010, an
additional link to Internet2 was made from ITB Bandung to BRKP Ancol via leased Physical
Network Inventory (PNI) fiber optic cable. This provided BRKP with the necessary bandwidth and
Internet2 link to host the Jakarta ECC.
Video Recording and Real-time Streaming
The video infrastructure supporting the telepresence capability includes video collection,
encoding, broadcast, and decoding technologies. Onboard the ship is a video collection system
capable of recording 240 hours of HD video from four onboard HD cameras, 12 onboard
standard definition cameras, one ROV-based HD camera, one camera platform HD camera, and
several standard definition “work” cameras on both the ROV and camera platform. The video
recording system can record in raw format or at variable configurable compression rates or
resolutions. Any of these video sources, or video of shipboard computer data acquisition
screens, can be streamed to shore.
When the high-speed VSAT is active and connected to a satellite, an onboard video engineer
selects the specific video sources to encode into MPEG-4 video (the actual number and
20compression of broadcast video feeds is dependent upon the available VSAT bandwidth, which
varies depending on the mission). Through this process, EX is capable of streaming up to three
of these compressed, but still full, high-definition video feeds to shore simultaneously. The
selected encoded video is then broadcast from the ship via the VSAT, via a video router, as RTP
multicast video onto Internet2. As a multicast video stream on Internet2, any Internet2 location
can view the live video with a hardware or software MPEG-4 decoder, with less than a three
second delay. ECCs utilize Mac-based VLC software decoding to decode and view the video
feeds. URI’s Inner Space Center (ISC), a development center for telepresence capabilities, utilizes
hardware decoders to decode and view the live video feeds.
Intercom Communications
All shipboard and shore-based audio components of the telepresence network use a centralized
intercom system for managing shipboard and ship-to-shore communications (Figure 10). This
intercom network facilitates communication between users working in the Okeanos Explorer
control room, the ship’s officers on the bridge, the ship’s deck department (via wireless headsets),
and participants located at shore-side ECC. Audio communications between the ship- and shore-
based explorers allow real-time collaboration, daily operations planning, and the ability to
expand the breadth and depth of expertise engaged in a mission. Onboard the ship, there are
12 Real-time syndication (RTS) intercom stations, each configured with talk and listen privileges,
depending on the user roles at that station. Each onboard station connects to an intercom
mainframe or hub. Via the ship’s low-speed VSAT modem, the intercom hub on the ship
manages all ship-based traffic and communicates with a shore-based intercom hub located at
the ISC. The intercom hub at the ISC links each of the shore-based RTS intercoms at each ECC
and manages all shore-based traffic. The two hubs pass intercom voice data to one another and
then to the appropriate shore- or ship-based destinations. All voice traffic is carried over
standard commodity Internet. The protocol used is a proprietary, third-party voice over Internet
protocol (VoIP).
Figure 10. The VoIP intercom system leverages the ship’s Internet connectivity to connect all of the ship-
based and shore-based intercom units into a single system. This allows all participants, regardless of
21location, to easily communicate with all other participants. Left: Scientist David Butterfield at the Seattle ECC
communicates with participants on the ship and at the Jakarta ECC. Right: A close-up view of an RTS unit
in Okeanos Explorer’s control room.
The intercom system is integrated with Okeanos Explorer’s video streaming and video
recording subsystems, allowing the intercom audio to be heard in the live video streams and in
the recorded video clips.
Instant Messaging for Real-Time Data Logging and Collaboration
Data logging for specific expedition activities is an important part of creating a record of
observations, activities, system status, and other pertinent information. The expedition used a
“group chat room” - a data logging system that allowed ship- and shore-based personnel to log
their observations and activities in a central location and simultaneously allow users to see
others’ log entries (Figure 11). This data logging system is an Extensible Messaging and Presence
Protocol (XMPP) -based system. The system utilized a shore-based XMPP server and open-
source ship- and shore-based XMPP clients. Each operational user is provided user access to
authenticate to the server. Once authenticated, the user may log in at will or view others log
entries at any time during an expedition. Each log entry records the user name, date, and time
of the observation.
Through this XMPP instant messaging (IM) service, scientists participating in the expedition
either onboard the ship or on shore are able to communicate and log observations about
ongoing operations in real-time. IM communications can either be directly between two
individuals, or “person-to-person” collaboration, or via a group chat room. Okeanos Explorer
operations use a dedicated group chat room call the Okeanos “Eventlog” for participants to
share information about the expedition in real-time (e.g. notifying the team on shore of delays
due to weather), and to record observations about science activities observed both at sea and
on shore in real-time. Each day, a resulting Eventlog file is generated with all entries time-
stamped to match the ship’s clocks and serves as a complete record for all cruise events and
science observations.
22Figure 11. An example of chat log entries.
Real-time Access to Data and Operational Information
Data transfer to and from the ship is a critical capability to any successful telepresence-enabled
operation. Data transferred and received can have a variety of uses or audiences—from
scientists to the general public. Each audience or user requires a unique access point specific to
the user and use. Regardless of the access point, all data are transferred off the ship via the
VSAT. Depending on data type, either the high-speed or low-speed modem is used. Data
required for operational purposes are transferred to shore and located on either a shore-based
managed file transfer protocol (FTP) server or a shore-based content management system (CMS)
server accessible on standard Internet. Each server has unique capabilities and purposes. The
FTP server handles high-volume, high-frequency data transfers. The CMS handles low-volume,
low-frequency data transfers and sharing of critical operational information. Both the FTP and
CMS servers require user authentication to access the data. However, the FTP and CMS also
both serve non-operational “products” for public use via anonymous login or open web pages,
respectively. Products posted in these locations can be used for education, outreach, media, and
communications activities. During telepresence-enabled expeditions, participating scientists are
23able access the latest data and products generated during the cruise from these servers, further
enabling their ability to participate remotely in the cruise.
Exploration Command Centers (ECCs)
Shore-side participants interact with the shipboard team through ECCs, allowing explorers to
join in the ongoing exploration from shore. ECCs are also an education and outreach venue,
and are used for live events with the vessel.
Once configured appropriately, the ECCs mimics the layout and functionality of the control
rooms on board Okeanos Explorer (Coleman 2012). The large monitors and video decoding
hardware available to ECC participants display the same three primary video feeds seen on
board the ship. The intercom unit enables direct two-way communication between the watch
leader in the shipboard control room and the scientists at the ISC and ECCs. The intercom station
also enables shipboard personnel to listen to shore-based conversations, and vice versa. The
additional computer workstations in each ECC provide Internet access to web-based tools that
include the data and operational information from the ongoing cruise. Where appropriate,
processing software is also made available on the workstations to assist the ECC-based scientists
with interpreting the real-time data.
The primary role of the ECCs is to provide a broader base of intellectual capital to exploration,
and allow explorers to explore from shore. Three ECCs were online and used during the INDEX
SATAL Expedition. They were located at:
• NOAA Pacific Marine Environmental Laboratory (PMEL), Sand Point, Seattle, WA
• University of Rhode Island’s Inner Space Center, Narragansett, RI
• Jakarta, Indonesia
The Okeanos Explorer transmitted three live video and data feeds to the ECCs in Jakarta and the
U.S., where Indonesian and U.S. scientists participated in the expedition in real-time by
monitoring the live video, communicating with the ship and shore-based science team via
instant messaging and RTS intercoms, and taking part in daily ship-to-shore science planning
meetings. Each day, virtual meetings were held with both the shipboard and shore-side
scientists to discuss that day’s operations, and finalize plans for the following day. During ROV
dives, the three live video feeds generally included the primary HD camera on Little Hercules,
the primary HD camera on the Camera Sled showing Little Hercules at work, and another
computer data screen to provide situational awareness of the ongoing operation – such as the
Hypack Navigation screen showing the location of the ship, each vehicle, and where they were
in relation to the seafloor in real-time. When the ROV was not in the water, the multibeam data
acquisition was generally streamed to shore, along with at least one video feed of the shipboard
24mission spaces to provide situational awareness of what was happening at sea to scientists on
shore. In addition to the real-time transmissions, a complete data archive was provided to DKP
at the end of the expedition (For more details about data management, refer to Appendix A:
Data Management Plan).
Freely and Publicly Accessible Data, As Soon as Possible
A key tenet of the Okeanos Explorer model is that data are made available to the public without
proprietary rights as soon as possible, except when national security, regulatory, or trustee
responsibilities require additional protections or restrictions on the data. Therefore, data
management is a critical function of any exploration expedition. Onboard the Okeanos Explorer,
a unique and prototype-integrated data management system is utilized to ensure accurate and
efficient data and metadata generation and management. Onboard the Okeanos Explorer
resides a Cruise Information Management System (CIMS) that auto-generates metadata for data
collected by the ship and deployed sensors and systems. Metadata are automatically sent daily
via low-speed VSAT to a shore-based data center. The data center catalogs the metadata and
prepares for data ingestion, triggering a host of shore-based data center accession activities.
Upon receipt of the actual data (transmission method depends on data type and size), the data
center packages the data and metadata and begins the accession process to ensure the integrity
of the data is maintained, that the data and metadata are accessible to the public as soon as
possible, and that they are stored in a secure and widely accessible national data center for long-
term archive.
4.4 Operations
The 2010 ocean exploration expedition involved two deep-ocean research vessels (the Baruna
Jaya IV and the Okeanos Explorer) operating in coordination to achieve the expedition’s science
objectives. The Baruna Jaya IV conducted bathymetric surveys in relatively shallow waters
(generally less than 1,500 m) and collected seawater CTD measurements at selected points
(Figure 12, Table 5) as well as fisheries-related sample collection and assessments (Figure 13,
Table 6). The Baruna Jaya IV also served as a base of operations for small boats involved in
shallow-water bathymetry and habitat assessments, including setting up Autonomous Reef
Monitoring Structure (ARMS). The setting up of ARMS was completed by a joint team of
Indonesia-U.S. scientists. (See
https://oceanexplorer.noaa.gov/okeanos/explorations/10index/logs/aug01/aug01.html, last
accessed Dec. 2020). ARMS are long-term collecting devices developed to mimic the structural
complexity of coral reef habitats and to attract colonizing invertebrates and algae. They were
developed by the Coral Reef Ecosystem Division of the NOAA PIFSC in conjunction with the
Census of Coral Reefs Project (CReefs) of the Census of Marine Life (CoML) as a standard and
systematic method to investigate and monitor the diversity of lesser-known reef organisms. The
25six ARMS deployed along Sangihe Island (Table 4) are the first of these installed in Indonesian
waters. They join the 400 ARMS that already exist in coral reefs across the globe.
The first site, SAG-01, was located near the southern tip of Tahuna Harbor. The reef flat
extended approximately 10 m from the shoreline, then dropped to a wall from three meters to
15 m, and gradually sloped down to 30 m. ARMS were installed at SAG-01 near the base of the
wall at 15 m. Each unit was approximately three meters apart from one another. The habitat on
the slope was dominated by rubble, sand, and macroalgae intermixed with small colonies of
Acropora sp.
The second site, SAG-02, was located approximately two kilometers south of the harbor
entrance. The reef at this location sloped gradually from three meters to 20 m. ARMS were
installed at 15 m and each unit was separated by approximately three meters. The habitat was
dominated by macroalgae and rubble.
Table 4. Location of ARMS installed.
Location Site Latitude Longitude Depth (m) # ARMS installed
Sangihe Island SAG-01 N 3.59816 E 125.48658 15 3
Sangihe Island SAG-02 N 3.57787 E 125.48504 15 3
The Okeanos Explorer collected bathymetric data of deeper waters (generally more than 1,500
m) and collected towed- and point-CTD measurements (Table 7) to help identify plumes and
other anomalies. Where areas of interest were indicated by bathymetric, multibeam
backscatter, or CTD data, the Okeanos Explorer deployed a dual-bodied ROV for detailed
investigation using HD video cameras (Table 8).
Though water samples were collected using the Okeanos Explorer CTD/rosette, no biological or
physical samples were collected using the Okeanos Explorer. Instead, Baruna Jaya IV collected
biological and physical samples.
26Figure 12. CTD casts and CTD water samples collected by R/V Baruna Jaya IV (Image courtesy of R/V Baruna
Jaya IV).
Table 5. CTD locations conducted by R/V Baruna Jaya IV (Information courtesy of R/V Baruna Jaya IV).
ID Latitude Longitude
1 2.0445 125.4963
2 3.99258 125.821
3 4.80319 125.9837
4 4.867708 126.5741
5 4.818667 126.7897
7 4.19867 125.5885
8 4.279469 125.4822
9 2.86828 125.2953
10 2.51444 125.3008
11 2.6962 125.2865
12 2.2462 125.1217
13 1.92954 124.705
27Figure 13. Location of the trawl stations conducted by R/V Baruna Jaya IV.
Table 6. Location of the trawl stations conducted by R/V Baruna Jaya IV.
Trawl Station Longitude Latitude
1 126.9667 4.7
2 127.0125 4.861111
3 125.7639 4.664444
4 125.5594 4.0
5 125.2844 2.704444
6 125.3344 2.704444
7 Missing Missing
Table 7. CTD casts collected by Okeanos Explorer during EX-10-04 Leg 2.
Latitude Longitude Water samples (Depth in m)
CTD Cast Station Date (N) (E)
EX1004L2_01 62710 4.6762 125.0852 No Samples
EX1004L2-02 62910 4.6723 125.0868 No Samples
EX1004L2-03 62910 4.6760 125.0870 No Samples
EX1004L2-04 62910 4.6778 125.0875 No Samples
EX1004L2-05 70210 3.7780 125.3705 No Samples
EX1004L2-06 70210 3.7757 125.3718 No Samples
EX1004L2-07 70210 3.7738 125.3743 No Samples
28EX1004L2-08 70210 3.7715 125.3792 No Samples
EX1004L2-09 70610 5.2675 126.6175 No Samples
EX1004L2-10 70610 5.3268 126.6132 No Samples
EX1004L2-11 70710 5.8723 127.2533 No Samples
EX1004L2-12 71109 2.8480 125.0680 No Samples
EX1004L2-13 71109 2.6267 125.0863 No Samples
EX1004L3-01 72410 2.1364 124.9013 702, 650, 600, 400
EX1004L3-02 72510 2.136072 124.9071 No Samples
EX1004L3-03 72510 2.27052 124.8304 No samples
1800, 1760, 1684, 1630, 1572, 1875, 1785,
EX1004L3-04 80310 4.675833 125.0878 1767, 1712, 1694, 1644,
EX1004L3-05 80610 2.6839 125.2591 1500, 1440, 1400, 1350, 1300, 1250, 1200
EX1004L3-06 80610 2.687733 125.2569 No samples
Table 8. ROV dives conducted during the cruise —linear distance was computed from the KML files of the
dive tracks in Google Earth.
Time Off Time Linear
At bottom bottom (hours) transect
Dive (UTC) (UTC) Approx. distance
Number Date Latitude Longitude Approx.
# (GMT) (N) (E) (km)
EX-10-04 Leg 2
1 062910 4.6785 125.0730 0220 0717 5 1.5
2 063010 4.6765 125.0873 0219 0714 5 0.8
3 070110 4.6683 125.2542 0304 0757 5 1.4
4 070210 4.0127 125.2800 0130 0735 6 2.2
5 070310 3.7788 125.3697 0055 0814 7 2.4
6 070510 5.3773 126.7669 0313 0633 3 1.1
7 070610 5.2494 126.6563 0325 0736 4 0.8
8 070810 5.0780 126.6521 0211 0709 5 1.1
9 070910 4.9512 125.7848 0110 0713 6 1.6
10 071010 3.3413 125.2817 0328 0637 3 0.9
11 071110 2.8627 125.0343 0110 0820 6 1.4
12 071210 2.6247 125.0863 0122 0655 6.5 1.1
13 071210 2.8442 125.0584 2131 0553 6 1.8
EX-10-04 Leg 3
1 072210 2.8479 124.0655 2045 0543 9 2.3
2 072410 2.1367 124.9019 0110 0756 7 1.6
3 072510 2.2665 124.8353 0211 0722 5 1.5
29You can also read