Development of Methanol Permselective FAU-Type Zeolite Membranes and Their Permeation and Separation Performances

Page created by Fred Cunningham
 
CONTINUE READING
Development of Methanol Permselective FAU-Type Zeolite Membranes and Their Permeation and Separation Performances
membranes

Article
Development of Methanol Permselective FAU-Type Zeolite
Membranes and Their Permeation and Separation Performances
Ayumi Ikeda              , Chie Abe, Wakako Matsuura and Yasuhisa Hasegawa *

                                          Research Institute of Chemical Process Technology, National Institute of Advanced Industrial Science and
                                          Technology (AIST), 4-2-1 Nigatake, Miyagino-ku, Sendai 983-8551, Japan; a-ikeda@aist.go.jp (A.I.);
                                          abe-chie@aist.go.jp (C.A.); wakako.matsuura@aist.go.jp (W.M.)
                                          * Correspondence: yasuhisa-hasegawa@aist.go.jp; Tel.: +81-22-237-3098

                                          Abstract: The separation of non-aqueous mixtures is important for chemical production, and zeolite
                                          membranes have great potential for energy-efficient separation. In this study, the influence of the
                                          framework structure and composition of zeolites on the permeation and separation performance of
                                          methanol through zeolite membranes were investigated to develop a methanol permselective zeolite
                                          membrane. As a result, the FAU-type zeolite membrane prepared using a solution with a composition
                                          of 10 SiO2 :1 Al2 O3 :17 Na2 O:1000 H2 O showed the highest permeation flux of 86,600 µmol m−2 s−1
                                          and a separation factor of 6020 for a 10 wt% methanol/methyl hexanoate mixture at 353 K. The
                                          membrane showed a molecular sieving effect, reducing the single permeation flux of alcohol with
                                          molecular size for single-component alcohols. Moreover, the permeation flux of methanol and the
                                          separation factor increased with an increase in the carbon number of the alcohols and methyl esters
                                containing 10 wt% methanol. In this study, the permeation behavior of FAU-type zeolite membranes
         
                                          was also discussed based on permeation data. These results suggest that the FAU-type zeolite
Citation: Ikeda, A.; Abe, C.;             membrane has the potential to separate organic solvent mixtures, such as solvent recycling and
Matsuura, W.; Hasegawa, Y.                membrane reactors.
Development of Methanol
Permselective FAU-Type Zeolite            Keywords: organic mixture separation; methanol removal; pervaporation
Membranes and Their Permeation
and Separation Performances.
Membranes 2021, 11, 627. https://
doi.org/10.3390/membranes11080627
                                          1. Introduction
Academic Editor: Tomohisa Yoshioka             The separation of organic mixtures is essential for the chemical and petrochemi-
                                          cal industries to improve process efficiency. In particular, organic solvent recycling,
Received: 29 July 2021                    isomer separation, and the integration of reaction and separation processes have been
Accepted: 13 August 2021                  reported [1]. Membrane separation is an energy-efficient separation technology, and in-
Published: 15 August 2021                 organic membranes have superior chemical stability and mechanical strength compared
                                          to polymeric membranes. Among inorganic membranes, porous membranes, such as
Publisher’s Note: MDPI stays neutral      zeolite, silica, and carbon membranes, can separate organic mixtures by molecular sieving
with regard to jurisdictional claims in   and selective adsorption.
published maps and institutional affil-        Recently, the separation of organic mixtures using membranes by the molecular sieving
iations.                                  effect has been reported [2–4]. Tsuru et al. developed a methanol permselective organosilica
                                          membrane using bis(triethoxysilyl)acetylene as a precursor [2]. The methanol flux was
                                          24,300 µmol m−2 s−1 with a separation factor of 10 for a dimethyl carbonate mixture
                                          containing 10 wt% methanol at 323 K. Lively et al. examined xylene isomer separation by
Copyright: © 2021 by the authors.         reverse osmosis method using carbon molecular sieve hollow fiber membranes derived
Licensee MDPI, Basel, Switzerland.        from cross-linked poly(vinylidene fluoride) [3]. The flux was 1100 µmol m−2 s−1 with a
This article is an open access article    separation factor of 4 for a xylene mixture (o-/p-xylene = 50/50) at 395 K. When an MFI-type
distributed under the terms and           zeolite membrane was used for xylene separation, the p-xylene flux was 2.3 µmol m−2 s−1
conditions of the Creative Commons        with a separation factor of more than 100 at 373 K [4]. The high permeation and separation
Attribution (CC BY) license (https://     performances of the zeolite membrane were achieved because the membrane had few
creativecommons.org/licenses/by/          defects such as pinholes and cracks.
4.0/).

Membranes 2021, 11, 627. https://doi.org/10.3390/membranes11080627                                       https://www.mdpi.com/journal/membranes
Development of Methanol Permselective FAU-Type Zeolite Membranes and Their Permeation and Separation Performances
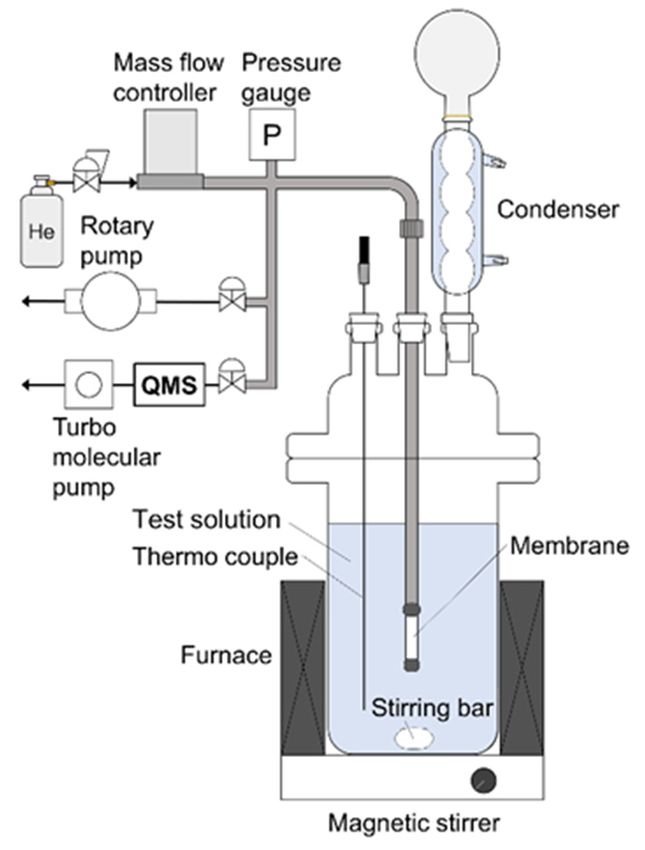
Membranes 2021, 11, 627                                                                                           2 of 13

                                Zeolite membranes can separate organic mixtures by selective adsorption, for exam-
                          ple, alcohol/alcohol, alcohol/ether, and aromatic/alkane mixtures [5,6]. Kanemoto et al.
                          evaluated the permeation performance of an MFI-type zeolite membrane for a mixture of
                          1-butanol, 2-propanol, and butyrate [5]. As a result, 1-butanol can selectively permeate
                          because it has a higher carbon number and more hydrophobicity than 2-propanol. Kita
                          et al. reported that an FAU-type zeolite membrane could separate benzene from cyclohex-
                          ane [6]. The benzene selectivity was attributed to the selective adsorption of benzene on
                          the zeolite by the interaction of the covalent electrons of benzene with Na+ in the zeolite.
                          The FAU-type zeolite membrane was also effective for the separation of methanol from
                          methyl tert-butyl ether.
                                Membrane reactors have attracted much attention for the development of energy- and
                          resource-saving chemical reactions. The application of zeolite membranes to transesterifi-
                          cation reactions has recently been investigated [7,8]. The selective removal of by-products
                          (such as alcohol) from reaction mixtures can shift the chemical equilibrium, which im-
                          proves the yield of the target ester. We investigated the influence of the reaction substrates
                          of transesterification reactions on the conversion increment in the membrane reactor [9].
                          As a result, the permeation of methanol through the zeolite membrane significantly im-
                          proved the yield of the target ester. However, it is unclear which zeolite frameworks and
                          compositions are suitable for alcohol separation from non-aqueous organic solutions.
                                In this study, four zeolite membranes were prepared, and their permeation and
                          separation performances of methanol from alcohols and methyl esters were evaluated
                          to determine the influence of the framework structure and composition of the zeolite
                          membrane. Since the FAU-type zeolite showed the highest permeation and separation
                          performance of methanol among the membranes, the permeation performances were inves-
                          tigated for single-component alcohols and several organic solvents containing methanol.
                          Furthermore, the permeation and separation behavior of the FAU-type zeolite membrane
                          are discussed based on these data in this manuscript.

                          2. Materials and Methods
                          2.1. Materials
                               Sodium aluminate, sodium hydroxide, sodium silicate solution, tetrapropylammo-
                          nium bromide (TPABr), N,N,N-trimethyl-1-adamantammonium hydroxide (TMAdOH) so-
                          lution, colloidal silica (LUDOX HS-40), NaY-type zeolite particles (HSZ-320NAA, Si/Al = 2.3)
                          and HY-type zeolite particles (HSZ-390HUA, Si/Al = 770) were used for the preparation of
                          zeolite membranes. Methanol, ethanol, 1-propanol, 1-butanol, 1-hexanol, methyl acetate,
                          methyl propionate, methyl butyrate, and methyl hexanoate were used in the pervaporation
                          experiments. All reagents were purchased from FUJIFILM Wako (Osaka, Japan) and used
                          without further purification.

                          2.2. Membrane Preparation
                               CHA-, LTA-, MFI-, and FAU-type zeolites were selected as the potential material
                          for methanol permselective membranes. CHA- and LTA-type zeolites have similar pore
                          diameters (0.38, 0.42 nm) to the molecular size of methanol (0.380 nm). Besides, MFI- and
                          FAU-type zeolite membranes can separate alcohol from alcohol/ester mixtures [5] and
                          methanol/organic solvent mixture separation [6], respectively. Therefore, we selected the
                          above four types of zeolite membranes.
                               Four types of zeolite membranes (CHA-, LTA-, MFI-, and FAU-type) were synthesized
                          on the outside of porous α-alumina support tubes by a secondary growth method. The prop-
                          erties of the support tube were as follows: Diameter = 3 mm, mean pore diameter = 0.3 µm,
                          and porosity = 50%. The membranes were prepared using the same method as previously
                          reported [10–12]. The detailed preparation procedures for zeolite membranes are described
                          as follows.
                               For the CHA-type zeolite membrane [10], a synthesis solution was prepared by mixing
                          sodium hydroxide, sodium aluminate, TMAdOH solution, and HY-type zeolite particles,
Development of Methanol Permselective FAU-Type Zeolite Membranes and Their Permeation and Separation Performances
Membranes 2021, 11, 627                                                                                           3 of 13

                          followed by stirring for 4 h at room temperature. The molar composition of the mixture
                          was 45 SiO2 :1 Al2 O3 :4.5 Na2 O:3.2 TMAdOH:4500 H2 O. The CHA-type zeolite particles
                          were manually implanted into the macropores of the support tube by rubbing with paper
                          wipers. The tube was added to a Teflon-lined stainless-steel autoclave filled with 30 g
                          of the synthesis solution. The autoclave was placed horizontally in an oven at 433 K for
                          24 h to form a polycrystalline layer on the support. After the autoclave was cooled to
                          room temperature, the tube was removed from the autoclave and washed with deionized
                          water several times. The tube was dried overnight at room temperature and then fired
                          at 773 K for 10 h to obtain the CHA-type zeolite membrane (hereafter referred to as the
                          CHA membrane).
                                For the LTA-type zeolite membrane [11], a synthesis solution was prepared by stirring
                          a mixture of sodium aluminate, sodium hydroxide, and sodium silicate solution for 1 h at
                          room temperature. The molar composition of the mixture was 2 SiO2 :1 Al2 O3 :2.3 Na2 O:300
                          H2 O. The outside of the support tube was rubbed with LTA-type zeolite particles, and the
                          tube was added to an autoclave filled with 30 g of the synthesis solution. The autoclave
                          was placed horizontally in an oven at 393 K for 5 h. After the reaction, the autoclave was
                          cooled to room temperature, and the tube was recovered and washed with deionized water
                          several times. Finally, the membrane was dried overnight under ambient conditions to
                          obtain the LTA-type zeolite membrane (hereafter referred to as the LTA membrane).
                                For the MFI-type zeolite membrane [12], a synthesis solution was prepared by mixing
                          sodium hydroxide, colloidal silica, deionized water, and TPABr as a structure-directing
                          agent, followed by stirring for 1 h at room temperature. The molar ratio of the synthesis
                          solution was 1 SiO2 :0.05 Na2 O:0.26 TPABr:80 H2 O. The outside of the support tube was
                          rubbed with MFI-type zeolite particles, and both ends of the tube were sealed with Teflon
                          tape to prevent crystal deposition on the inner surface of the tube. The tube was then
                          placed in a Teflon-lined stainless-steel autoclave filled with 30 g of the synthesis solution.
                          The autoclave was placed horizontally in an oven at 413 K for 24 h. After the autoclave
                          was cooled to room temperature, the tube was removed from the autoclave and washed
                          with deionized water several times. The tube was dried overnight at room temperature
                          and then fired at 673 K for 48 h to obtain the MFI-type zeolite membrane (hereafter referred
                          to as the MFI membrane).
                                For the FAU-type zeolite membrane [12], a synthesis solution was prepared by stir-
                          ring a mixture of sodium hydroxide, sodium aluminate, sodium silicate solution, and
                          deionized water for 4 h at room temperature. The molar composition of the mixture was
                          a SiO2 :1 Al2 O3 :17 Na2 O:1000 H2 O (a = 5, 10, 13, and 25). The NaY-type zeolite particles
                          were rubbed on the outside of the support tube, and the tube was added to an autoclave
                          filled with 30 g of the synthesis solution. The autoclave was set horizontally in an oven at
                          363 K for 16 h to grow the FAU-type zeolite crystals on the support tube. The tube was
                          then washed with deionized water several times after cooling the autoclave and dried
                          overnight at room temperature. Hereafter, the FAU-type zeolite membranes with molar
                          compositions of a = 5, 10, 13, and 25 are referred to as FAU(5), FAU(10), FAU(13), and
                          FAU(25) membranes, respectively.
                                The membrane morphology was observed using scanning electron microscopy (SEM,
                          JEOL, JCM-6000, Tokyo, Japan), and the composition was analyzed using an energy disper-
                          sive X-ray analyzer (EDX, JEOL, ED-2300, Tokyo, Japan) attached with the SEM. The crystal
                          structure was identified by X-ray diffraction (XRD, Rigaku, Smart-Lab, Tokyo, Japan).

                          2.3. Pervaporation Experiment
                               One end of the membrane was connected to a stainless-steel tube using a resin (GL Sci-
                          ence, Torr seal, Tokyo, Japan), and the other end was capped. The effective membrane areas
                          were 1.0 cm2 for the CHA, LTA, and MFI membranes and 2.0 cm2 for the FAU membrane,
                          respectively. All membrane performances were evaluated by a pervaporation method
                          using the apparatus shown in Figure 1. Ethanol, 1-propanol, 1-butanol, 1-hexanol, methyl
                          acetate, methyl propionate, methyl butyrate, and methyl hexanoate were used as solvents
One end of the membrane was connected to a stainless-steel tube using a resin (GL
                          Science, Torr seal, Tokyo, Japan), and the other end was capped. The effective membrane
                          areas were 1.0 cm2 for the CHA, LTA, and MFI membranes and 2.0 cm2 for the FAU mem-
                          brane, respectively. All membrane performances were evaluated by a pervaporation
Membranes 2021, 11, 627   method using the apparatus shown in Figure 1. Ethanol, 1-propanol, 1-butanol, 1-hexanol,             4 of 13
                          methyl acetate, methyl propionate, methyl butyrate, and methyl hexanoate were used as
                          solvents in the test solution containing 10 wt% methanol for the pervaporation experi-
                          ment. These alcohols and methyl esters are used as reaction substrates of transesterifica-
                           in the test solution containing 10 wt% methanol for the pervaporation experiment. These
                          tion reaction in our previous report [9]. The test solution (150 g) was added to a separable
                           alcohols and methyl esters are used as reaction substrates of transesterification reaction in
                          flask and heated at 303–353 K with stirring at 600 rpm. The membrane was immersed in
                           our previous report [9]. The test solution (150 g) was added to a separable flask and heated
                          the  solution,
                           at 303–353   K and
                                          withthe  insideatof600
                                                stirring       therpm.
                                                                   membrane      was evacuated
                                                                        The membrane               using a rotary
                                                                                            was immersed             pump below
                                                                                                             in the solution,    and
                          1the
                             kPa.
                               inside of the membrane was evacuated using a rotary pump below 1 kPa.6.0
                                  In addition,   helium   was   introduced    into the  membrane     at 1.0, 3.0, or   InmL    min−1
                                                                                                                          addition,
                          as  the standard.
                           helium             The gasinto
                                   was introduced       composition
                                                           the membrane in the
                                                                             at evacuated     stream
                                                                                1.0, 3.0, or 6.0     was−1analyzed
                                                                                                 mL min               using mass
                                                                                                             as the standard.    The
                          spectrometry
                           gas composition (Pfeiffer
                                              in thevacuum,
                                                      evacuated  QGA,   Asslar,
                                                                   stream   was Germany).
                                                                                 analyzed using The permeation    flux, Ji, (Pfeiffer
                                                                                                    mass spectrometry       of com-
                          ponent
                           vacuum, i was
                                     QGA, calculated   as follows [13]:
                                             Asslar, Germany).      The permeation flux, J , of component i was calculated
                                                                                                  i
                          as follows [13]:                                      N y
                                                                          Ji =NHeHe yi i ,                                              (1)
                                                                      Ji =         S yHe,                                                (1)
                                                                                S y He
                          where NHe, S, and yi are the molar flow rate of helium, the membrane area, and the mole
                          where NHe , S, and yi are the molar flow rate of helium, the membrane area, and the mole
                          fraction of   component i in the evacuated stream, respectively. The permeance of single
                           fraction of component i in the evacuated stream, respectively. The permeance of single
                          alcohol, Qi, component, was calculated using the following equation:
                           alcohol, Qi , component, was calculated using the following equation:
                                                                                         J
                                                                        Qi = J i                  ,                                     (2)
                                                                                p  f , i − pp, i ,
                                                                                         i
                                                                     Qi =                                                                (2)
                                                                              p f ,i − p p,i
                          where pf,i and pp,i represent the saturated vapor pressure of component i of the feed solu-
                          tion
                          where and
                                  pf,ithe
                                       andpartial vapor pressure
                                           pp,i represent          of component
                                                          the saturated    vapor pressure  i on theofpermeate
                                                                                                        componentside,
                                                                                                                    i ofrespectively.  The
                                                                                                                         the feed solution
                          saturated    vapor pressure
                           and the partial             of component
                                              vapor pressure            i was calculated
                                                                of component             i on the using    the Antoine
                                                                                                      permeate            constants listed
                                                                                                                side, respectively.    The
                           saturated
                          in  Table 1.vapor   pressure of factor
                                         The separation    component     i was calculated
                                                                  of methanol            for each using    thesolvent,
                                                                                                      organic  Antoineα,  constants  listed
                                                                                                                            is defined    as
                           in Table 1. The separation factor of methanol for each organic solvent, α, is defined as
                          follows:
                           follows:                                                   y yO
                                                                       α (M/O)  = yMM /yO           ,                                   (3)
                                                                    α(M/O    ) = x x ,
                                                                                     xM  M /xO  O
                          where xxii is
                          where       is the
                                         the mole
                                             mole fraction
                                                  fraction of component ii in
                                                           of component    in the
                                                                              the solution,
                                                                                  solution, and
                                                                                            and the
                                                                                                the subscripts
                                                                                                    subscripts M
                                                                                                               M and
                                                                                                                 and O
                           indicate methanol
                          indicate  methanol andand organic
                                                     organic solvent, respectively.

                          Figure 1. Schematic diagram of pervaporation apparatus.
Membranes 2021, 11, 627                                                                                             5 of 13

                          Table 1. Antoine constants of primary alcohols.

                                                                  Antoine Constant
                               Solvent                                                                    Reference
                                                      A                     B              C
                               Methanol            8.07919             1581.34           239.65              [14]
                                Ethanol             8.04494             1554.3           222.65              [14]
                              1-Propanol           7.751113           1441.6293         198.8507             [14]
                               1-Butanol           4.54607            1351.555           −93.34              [15]

                          2.4. Seed Particles Preparation for Zeolite Membrane
                                For the CHA membrane, the seed particles were prepared by mixing sodium hydrox-
                          ide, sodium aluminate, N,N,N-trimethyl-1-adamantammonium hydroxide solution (SDA,
                          25%, Sachem Asia, Osaka, Japan), and ultra-stable Y-type zeolite particles (HSZ-390HUA).
                          The molar composition of the solution was 40 SiO2 :1Al2 O3 :4 Na2 O:8 SDA:800 H2 O. The
                          mixture was poured into a Teflon-lined stainless-steel autoclave, and a hydrothermal reac-
                          tion was carried out at 433 K for four days. Solids were recovered by filtration, washed
                          with distilled water, and dried overnight at 383 K to obtain seed particles.
                                For the MFI membrane, the seed particles were prepared by mixing sodium hydroxide,
                          tetrapropylammonium hydroxide (TPAOH), and tetraethyl orthosilicate. The molar com-
                          position of the solution was 25 SiO2 :0.1 Na2 O:9 TPAOH:490 H2 O:100 EtOH. The mixture
                          was poured into a Teflon-lined stainless-steel autoclave, and a hydrothermal reaction was
                          carried out at 373 K for 72 h. Solids were recovered centrifugally and washed with distilled
                          water. The average particle size was 110 nm.
                                Commercially available NaA (A-4) and NaY-type zeolite particles (HSZ-320NAA)
                          were used as the seed particles in this study. They can be purchased from FUJIFILM Wako
                          Corp (Osaka, Japan).

                          3. Results and Discussions
                          3.1. Membrane Characterization
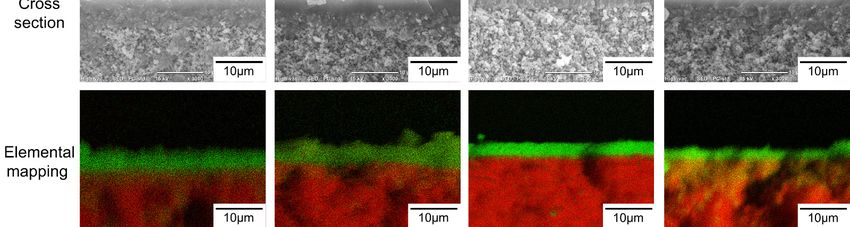
                                Figure 2 shows the SEM images of the top surface and cross-section and elemental
                          mapping by EDX of the CHA, LTA, MFI, and FAU(10) membranes. The outer surface of
                          the support was covered with well-intergrown polycrystalline layers with sizes of 2–5 µm
                          for CHA, 3–4 µm for LTA, 2–3 µm for MFI, and 1–4 µm for FAU. The thicknesses of the
                          polycrystalline layers were in the range of 1.2–4.5 µm. The Si/Al ratios of CHA, LTA, MFI,
                          and FAU(10) membranes were 18, 1.0, 75, and 1.3. by EDX. The values of CHA, LTA, and
                          FAU(10) were similar to theoretical Si/Al ratios, while that of the MFI membrane was
                          different from the theoretical Si/Al ratio (=∞). This proposes the zeolite layer contains
                          aluminum derived from the α-alumina support. As shown in Figure 3, the XRD patterns
                          of the membranes contain both the α-alumina support and desired zeolite. Table 2 shows
                          major XRD peaks of four zeolites and the relative intensities. For CHA, the peaks due to
                          (1,0,0), (1,0,−1), and (2,−1,0) were observed at 2θ = 9.5, 12.9, and 20.6◦ , respectively. LTA,
                          MFI, and FAU membranes also give peaks due to corresponding zeolites. These results
                          indicate that CHA, LTA, MFI, and FAU(10) membranes can be prepared on the supports.
                          The peak intensity ratios due to zeolites were almost the same as those of the particles.
                          This means that the zeolite crystals forming the polycrystalline layer are not oriented in a
                          unique direction.
                                Figure 4 shows the effect of the molar composition of the synthesis solution on the
                          morphology of the FAU membranes. When the molar composition of the synthesis solution
                          was 25 SiO2 :1 Al2 O3 :17 Na2 O:1000 H2 O (SiO2 /Al2 O3 = 25), many particles were deposited
                          on the outer surface. However, few particles were observed at SiO2 /Al2 O3 ratios of 5, 10,
                          and 13. The thicknesses of the polycrystalline layers were almost the same as 1.7–2.5 µm
                          for all SiO2 /Al2 O3 .
Membranes 2021, 11, x FOR PEER REVIEW                                                                                               6 of 13
 Membranes 2021,
 Membranes  2021, 11,
                  11, 627
                       x FOR PEER REVIEW                                                                                              6 6of
                                                                                                                                          of 13
                                                                                                                                             13

     Figure 2. SEM images and cross-section elemental mapping of CHA, LTA, MFI, and FAU(10) membranes (Green: Si, Red:
       Figure
       Figure 2.
     Al).      2. SEM
                  SEM images and cross-section
                      images and cross-sectionelemental
                                               elementalmapping
                                                         mappingofof CHA,
                                                                   CHA,   LTA,
                                                                        LTA,   MFI,
                                                                             MFI, andand FAU(10)
                                                                                      FAU(10)    membranes
                                                                                              membranes     (Green:
                                                                                                        (Green:      Si, Red:
                                                                                                                Si, Red:  Al).
       Al).

                                    Figure
                                 Figure     3. XRD
                                        3. XRD     patterns
                                                 patterns    of CHA,
                                                          of CHA,    LTA,
                                                                  LTA,    MFI,
                                                                        MFI, andand  FAU(10)
                                                                                  FAU(10)    membranes.
                                                                                            membranes.       Symbols
                                                                                                         Symbols     denote
                                                                                                                   denote   thethe diffraction
                                                                                                                                diffraction
                                   Figure
                                 peaks
                                   peaks   3.
                                        of of XRD
                                            CHACHA patterns
                                                  (diamond),of CHA,
                                                     (diamond),LTA  LTA,  MFI,triangle),
                                                                   (inverted
                                                                 LTA  (invertedand   FAU(10)
                                                                                         MFI
                                                                                 triangle),  membranes.
                                                                                              (triangle),
                                                                                            MFI             Symbols
                                                                                                          FAU
                                                                                                 (triangle),         denote
                                                                                                                (circle),
                                                                                                              FAU         and
                                                                                                                  (circle),   the
                                                                                                                             and   diffraction
                                                                                                                                α-alumina
                                                                                                                                   α-alumina
                                   peaks
                                 (square). of CHA (diamond), LTA (inverted triangle), MFI (triangle), FAU (circle), and α-alumina
                                   (square).
                                   (square).
Table 2. XRD peaks and relative intensity, Irel, for CHA, LTA, MFI, and FAU(10) particles.

              CHA         Table 2. XRD peaks and     relative intensity, Irel, for CHA, MFI
                                                   LTA                                  LTA, MFI, and FAU(10) particles. FAU(10)
 2θ (°)      (h,k,l)
                   CHA    I rel (%)     2θ (°)    (h,k,l)
                                                      LTA    I rel (%)     2θ   (°)    (h,k,l)
                                                                                           MFI    I rel (%)     2θ (°)    (h,k,l)
                                                                                                                            FAU(10)Irel (%)
   9.5       (1,0,0)
     2θ (°)2021,
Membranes         (h,k,l)
                  11, 627    100Irel (%) 7.2
                                           2θ (°) (2,0,0)
                                                     (h,k,l) 100   Irel (%) 7.9 2θ (°) (0,1,1)
                                                                                          (h,k,l) 100   Irel (%) 6.2
                                                                                                                   2θ (°) (1,1,1)
                                                                                                                             (h,k,l) 100Irel
                                                                                                                                         7 of(%)
                                                                                                                                              13
  12.99.5 (2,−1,0)(1,0,0)    47.2 100    10.27.2  (2,2,0)
                                                     (2,0,0)    76.9 100      8.97.9   (2,0,0)
                                                                                          (0,1,1)    59.7 100    15.66.2  (3,3,1)
                                                                                                                             (1,1,1) 33.8 100
  20.612.9 (1,0,−1)
                 (2,−1,0) 50.4    47.2 16.1 10.2 (4,2,0)
                                                     (2,2,0) 36.276.9 23.18.9 (0,5,1)     (2,0,0) 11059.7 23.615.6 (5,3,3)   (3,3,1) 30.733.8
     20.6      (1,0,−1)        50.4         16.1        (4,2,0)          36.2       23.1      (0,5,1)          110        23.6        (5,3,3)       30.7
                         Table 2. XRD peaks and relative intensity, Irel , for CHA, LTA, MFI, and FAU(10) particles.
                                           Figure 4 shows the effect of the molar composition of the synthesis solution on the
               CHA                  morphology FigureofLTA
                                                        4the    FAUthe
                                                            shows       membranes.
                                                                           effect of theWhen
                                                                                         molarthecomposition
                                                                                             MFI    molar composition         of the
                                                                                                                    of the synthesis  synthesis
                                                                                                                                  FAU(10)solutionsolu-
                                                                                                                                                    on the
                                    tionmorphology
                                           was   25 SiO  2 :1
                                                          of  Al
                                                              the 2 O3
                                                                    FAU:17 Na 2 O:1000
                                                                           membranes.   H 2O (SiO
                                                                                          When     2
                                                                                                  the/Al 2 O
                                                                                                       molar 3 = 25), many
                                                                                                                 composition  particles
                                                                                                                                 of the  were   depos-
                                                                                                                                         synthesis    solu-
  2θ (◦ )     (h,k,l)      Irel (%)           ◦
                                         2θ ( )      (h,k,l)        Irel (%)          ◦
                                                                                 2θ ( )     (h,k,l)       Irel (%)          ◦
                                                                                                                       2θ ( )      (h,k,l)     Irel (%)
                                    itedtion
                                           on was
                                               the outer
                                                    25 SiOsurface.       However, few particles were           observed at SiO2/Al2O3 ratios
                                                              2:1 Al2O3:17 Na2O:1000 H2O (SiO2/Al2O3 = 25), many particles were depos-
                                                                                                                                                   of 5,
   9.5        (1,0,0)        100 10, and   7.2 13. The
                                                     (2,0,0)
                                                          thicknesses  100 of the 7.9       (0,1,1) layers
                                                                                   polycrystalline          100were almost
                                                                                                                         6.2    the(1,1,1)
                                                                                                                                     same        100
                                        ited                                                                                         2/Al2Oas   1.7–2.5
   12.9      (2,−1,0)        47.2         10.2on the(2,2,0)
                                                       outer     surface.
                                                                      76.9 However,8.9 few (2,0,0)
                                                                                             particles were 59.7 observed
                                                                                                                        15.6 at SiO(3,3,1)   3 ratios
                                                                                                                                                 33.8 of 5,
                                    μm10, forand
                                               all SiO  /Al2O
                                                   13. 2The      3.
                                                               thicknesses     of the polycrystalline layers were almost the same as 1.7–2.5
   20.6      (1,0,−1)        50.4          16.1       (4,2,0)       36.2        23.1       (0,5,1)       110          23.6       (5,3,3)       30.7
                                         μm for all SiO2/Al2O3.

     Figure 4. SEM images of FAU membranes prepared using the synthesis solutions with SiO2/Al2O3 ratios of 5, 13, and 25.
     Figure 4. SEM images of FAU membranes prepared using the synthesis solutions with SiO2 /Al2 O3 ratios of 5, 13, and 25.
        Figure 4. SEM images of FAU membranes prepared using the synthesis solutions with SiO2/Al2O3 ratios of 5, 13, and 25.
                                            Figure
                                              Figure55showsshowsthe theinfluence
                                                                         influence ofof the
                                                                                         the SiO
                                                                                             SiO22/Al
                                                                                                   /Al2O3 ratio of the synthetic solution on the
                                                                                                       2 O3 ratio of the synthetic solution on the
                                      Si/Al
                                       Si/Alratios
                                                 Figureofofthe
                                                           5the FAU
                                                             shows     zeolite
                                                                  FAUthe        membrane
                                                                            influence   of theand
                                                                                                SiOthe
                                                                                                    2/Alrecovered
                                                                                                         2O3 ratio of particles. At SiO
                                                                                                                        the syntheticSiO 2/Al2O3 = 5,the
                                                                                                                                       solution
                                                ratios                  zeolite  membrane      and  the  recovered    particles. At     2 /Al2 O3on
                                                                                                                                                  = 5,
                                      the
                                       theSi/Al
                                         Si/Al
                                            Si/Al  ratios
                                                  ratios     of the
                                                           of the
                                                      ratios       FAU
                                                               of the particles   and
                                                                           zeolite and
                                                                       particles       membrane
                                                                                   membrane
                                                                                          membrane    were
                                                                                                  and were  1.35  and
                                                                                                       the recovered     1.31, respectively.
                                                                                                              1.35 and particles.   At SiO2/Al
                                                                                                                          1.31, respectively. As the
                                                                                                                                                2Othe
                                                                                                                                               As  3 = 5,
                                      SiO 2/Al
                                         the    2O3 ratio
                                               Si/Al         of of
                                                                 thethe
                                                                      solution   increased,   the
                                                                                                theSi/Al  ratios ofofthe
                                                                                                                       theparticles and
                                                                                                                                      andmembrane
                                       SiO  2 /Al  2 O3ratios
                                                         ratio       the  particles
                                                                         solution    and membrane
                                                                                   increased,            were
                                                                                                     Si/Al      1.35
                                                                                                            ratios    and   1.31, respectively.
                                                                                                                            particles            As the
                                                                                                                                           membrane
                                      also
                                       alsoincreased.
                                         SiO   2/Al2O3 ratio of the solution increased, the Si/Al ratios of the particles and membrane
                                              increased.
                                         also increased.

                                                  InfluenceofofSiO
                                       Figure5.5.Influence
                                      Figure                    SiO2/Al
                                                                    2 /Al
                                                                       2O23Oratio
                                                                             3 ratio
                                                                                   ofof synthesis
                                                                                      synthesis   solutionononthe
                                                                                                solution        theSi/Al
                                                                                                                    Si/Al  ratioofofFAU
                                                                                                                         ratio       FAUmembranes
                                                                                                                                         membranes
                                      and
                                       andparticles.
                                           particles.
                                         Figure 5. Influence of SiO2/Al2O3 ratio of synthesis solution on the Si/Al ratio of FAU membranes
                                         and particles.
                                            Lechert et al. investigated the influence of the molar composition of the synthesis
                                       solutions on the Si/Al ratio of FAU-type zeolite crystallites [16]. Assuming that the molar
                                       composition of the zeolite synthesis solution is a SiO2 :1 Al2 O3 :c Na2 O:d H2 O, the theoretical
                                       Si/Al ratio of FAU-type zeolite crystallites can be described as follows:

                                                                                              a+c−1
                                                                                   Si/Al =          .                                                 (4)
                                                                                               c+1
Membranes 2021, 11, 627                                                                                             8 of 13

                              The calculation result is represented by the dashed line in Figure 5. The good agree-
                          ment between the experimental data and theoretical values indicates that the membrane
                          composition can be controlled by the composition of the synthesis solution.

                          3.2. Methanol Separation Performance of CHA, LTA, MFI, and FAU Membranes
                               Table 3 shows the results of pervaporation experiments for a 10 wt% methanol/methyl
                          hexanoate mixture at 353 K. For all the zeolite membranes, methanol permeated selectively,
                          and the permeation fluxes of methyl hexanoate were less than 32 µmol m−2 s−1 . The lower
                          fluxes indicate that there are few large pinholes in the zeolite membranes.

                          Table 3. Permeation and separation performances of methanol through zeolite membranes for 10 wt%
                          methanol/methyl hexanoate mixture at 353 K.

                                                               Flux (µmol m−2 s−1 )                  Separation Factor
                                  Zeolite
                                                         Methanol           Methyl Hexanoate                (-)

                                  CHA                     13,800                   24.0                    1270
                                   LTA                     1070                    10.5                     225
                                   MFI                     1300                    17.2                     168
                                 FAU(10)                  86,600                   31.9                    6020

                               The FAU(10) membrane with a large pore size showed an excellent methanol per-
                          meation flux of 86,600 µmol m−2 s−1 (=9.9 kg m−2 h−1 ) and a high separation factor of
                          6020. The reason was considered that FAU-type zeolite has the largest pore size (0.74 nm)
                          among the tested zeolite membranes. The methanol selectively permeates through the
                          FAU(10) membrane by selective adsorption and molecular sieving as discussed later
                          (Figures 7 and 9). Because the pore diameter of the CHA-type zeolite (0.38 nm) is close to
                          the molecular size of methanol (0.380 nm), the separation factor of the CHA membrane
                          was as high as 1270. However, the permeation fluxes of the LTA and MFI membranes
                          were lower than 1300 µmol m−2 s−1 . The lower permeation fluxes could be attributed to
                          the lower adsorption capacity of the LTA-type zeolite [17] and the inhibition of methanol
                          diffusion by methyl hexanoate for MFI-type zeolite [18].

                          3.3. Effect of Si/Al Ratio of FAU Membrane
                                Next, the effect of the composition of the synthesis solution on the separation and per-
                          meation performance of methanol through the FAU membrane was investigated. Table 4
                          shows the effect of the SiO2 /Al2 O3 ratio on the permeation performance of the FAU mem-
                          branes for the 10 wt% methanol/methyl hexanoate mixture at 353 K. When SiO2 /Al2 O3 = 5,
                          the methanol permeation flux and separation factor were 51,900 µmol m−2 s−1 and 3890,
                          respectively. As the SiO2 /Al2 O3 ratio of the synthetic solution increased, the permeation
                          flux increased, reaching 184,000 µmol m−2 s−1 at SiO2 /Al2 O3 = 25. In contrast, a maximum
                          separation factor of 6020 was obtained for SiO2 /Al2 O3 = 10. The FAU(13) and (25) mem-
                          branes were supposed to exist pinholes since the permeation fluxes of methyl hexanoate
                          were two orders of magnitude higher. Especially, the FAU(25) membrane observed a
                          lot of particles on the surface (Figure 4), so it indicated the formation of zeolite particles
                          was superior to the membrane formation at SiO2 /Al2 O3 = 25, whereas the FAU(5) and
                          (10) membranes had few pinholes, since the permeation fluxes of methyl hexanoate were
                          low. By increasing the SiO2 /Al2 O3 ratio from 5 to 10, the hydrophobicity of the FAU(10)
                          membrane could be increased. As the result, the permeation flux of methanol through the
                          FAU(10) membrane was obtained 1.7 times higher than that of the FAU(5) membrane.
Membranes 2021, 11, x FOR PEER REVIEW                                                                                               9 of 13

                                FAU(10) membrane could be increased. As the result, the permeation flux of methanol
Membranes 2021, 11, 627                                                                                        9 of 13
                                through the FAU(10) membrane was obtained 1.7 times higher than that of the FAU(5)
                                membrane.

                                Table 4. Effect of SiO2/Al2O3 ratio of synthesis solutions on the permeation performances of the FAU
                                 Table 4. Effect of SiO /Al2 O3 ratio of synthesis solutions on the permeation performances of the
                                zeolite membranes for 210wt%    methanol/methyl hexanoate mixture at 353 K.
                                 FAU zeolite membranes for 10wt% methanol/methyl hexanoate mixture at 353 K.
                                        SiO2/Al2O3                        Flux (μmol m−2 s−1)                      Separation Factor
                                         SiO2 /Al2 O3                      Flux (µmol m−2 s−1 )                     Separation Factor
                                         Ratio (-)                Methanol           Methyl Hexanoate                     (-)
                                           Ratio (-)               Methanol            Methyl29.5
                                                                                                Hexanoate                   (-)
                                             5                      51,900                                               3890
                                            105                      51,900
                                                                   86,600                      29.5
                                                                                             31.9                         3890
                                                                                                                         6020
                                             10
                                            13                        86,600
                                                                   106,000                     31.9
                                                                                            1520                          6020
                                                                                                                         155
                                             13                      106,000                  1520                         155
                                            25
                                             25                    184,000
                                                                     184,000                2710
                                                                                              2710                       150
                                                                                                                           150

                                3.4. Single Alcohol Permeation Performance
                                 3.4. Single Alcohol Permeation Performance
                                      Figure 6 shows the temperature dependence of the permeation fluxes of single-com-
                                       Figure 6 shows the temperature dependence of the permeation fluxes of single-
                                ponent alcohols through the FAU(10) membrane. The methanol permeation flux was 5900
                                 component     alcohols through the FAU(10) membrane. The methanol permeation flux was
                                μmol m−2 s−1 at−2303  K. The permeation flux decreased as the carbon number increased, and
                                 5900 µmol m s−1 at 303 K. The permeation      flux decreased as the carbon number increased,
                                that of 1-butanol was 94.4 μmol m−2 s−1−at     303
                                                                               −   K. The permeation flux of methanol in-
                                 and that of 1-butanol was 94.4 µmol m s 1 at 303 K. The permeation flux of methanol
                                                                            2
                                creased with increasing solution temperature, reaching 41,400 μmol m−2 s−1−at    338 K. Eth-
                                 increased with increasing solution temperature, reaching 41,400 µmol m 2 s−1 at 338 K.
                                anol and 1-propanol showed temperature dependencies similar to that of methanol. In
                                 Ethanol and 1-propanol showed temperature dependencies similar to that of methanol. In
                                contrast,
                                 contrast,the
                                            theeffect
                                                effectof
                                                       oftemperature
                                                          temperatureon
                                                                      onthe
                                                                          thepermeation
                                                                              permeationflux
                                                                                          fluxof
                                                                                               of1-butanol
                                                                                                  1-butanolwas
                                                                                                            wassmaller
                                                                                                                smallerthan
                                                                                                                        than
                                that of the  other alcohols.
                                 that of the other alcohols.

                                            Temperaturedependency
                                 Figure6.6.Temperature
                                Figure                  dependencyofofpermeation
                                                                       permeationfluxes
                                                                                   fluxesofofsingle
                                                                                              singlealcohols
                                                                                                     alcoholsthrough
                                                                                                              throughthe
                                                                                                                      theFAU(10)
                                                                                                                          FAU(10)
                                 membrane.
                                membrane.

                                       Figure77shows
                                      Figure     showsthe theinfluence
                                                              influenceof  ofthe
                                                                              the molecular
                                                                                  moleculardiameter
                                                                                                diameteron   onthe
                                                                                                                 the permeation
                                                                                                                     permeationflux   flux of
                                                                                                                                           of
                                 single-component      alcohols   through    the FAU(10)    membrane        at 323,
                                single-component alcohols through the FAU(10) membrane at 323, 333, and 348 K. The  333,   and  348   K. The
                                 permeationfluxfluxofofmethanol
                                                        methanolwas   was   31,100            −2 s−1 at 333 K. The flux decreased
                                permeation                               31,100     µmol
                                                                                 μmol   m−2ms−1 at  333 K. The flux decreased with
                                 with increasing
                                increasing          molecular
                                             molecular           diameter,
                                                         diameter,   and that and that of 1-butanol
                                                                               of 1-butanol   was 122 wasμmol122 m−2µmol    m−significant
                                                                                                                     s−1. This
                                                                                                                                2 s−1 . This

                                 significant
                                effect        effect of
                                       of molecular     molecular
                                                      size            size on theflux
                                                           on the permeation       permeation     fluxto
                                                                                       is attributed    is the
                                                                                                            attributed
                                                                                                                molecularto the  molecular
                                                                                                                            sieving    func-
                                tion of the zeolite, even though the pore size of the FAU-type zeolite (0.74 nm) (0.74
                                 sieving  function  of the  zeolite, even  though   the pore   size of the   FAU-type     zeolite        nm)
                                                                                                                                   is larger
                                 is larger
                                than        than the molecular
                                      the molecular    diameters diameters       of the(ethanol:
                                                                     of the alcohols     alcohols0.430
                                                                                                    (ethanol:     0.430 nm, 1-propanol:
                                                                                                           nm, 1-propanol:       0.469 nm,
                                 0.469  nm,  and  1-butanol:  0.504   nm).  These  results  also  support
                                and 1-butanol: 0.504 nm). These results also support our claim that there    our  claimare
                                                                                                                         thatnothere
                                                                                                                                 largeare  no
                                                                                                                                        pin-
                                 large  pinholes  in the FAU   membranes,      as discussed
                                holes in the FAU membranes, as discussed in Table 3.           in Table  3.
                                       Because the permeation flux is described as the product of the permeance and the
                                 partial pressure difference, the permeation flux in Figure 6 includes the temperature
                                 dependence of the vapor pressure. To discuss only the membrane permeation phenomenon,
                                 the permeation flux was converted to permeance. The temperature dependence of the
                                 vapor pressure was calculated using the Antoine constant (Table 1).
Membranes
 Membranes2021,
           2021,11,
                 11,x627
                      FOR PEER REVIEW                                                                                                                  1010ofof13
                                                                                                                                                                13

                                Figure 7. Influence of kinetic diameter of alcohol on permeation flux of single alcohol through the
                                FAU(10) membrane at 323 K (circle), 333 K (square), and 348 K (triangle).

                                        Because the permeation flux is described as the product of the permeance and the
                                 partial pressure difference, the permeation flux in Figure 6 includes the temperature de-
                                 pendence of the vapor pressure. To discuss only the membrane permeation phenomenon,
                                  Figure
                                Figure
                                 the           Influence
                                          7.7.Influence
                                       permeation        ofofkinetic
                                                       flux   kinetic
                                                              was       diameterof
                                                                       diameter
                                                                   converted         ofalcohol
                                                                                    to  alcoholon
                                                                                       permeance.onpermeation
                                                                                                      permeation      fluxofofsingle
                                                                                                                     flux
                                                                                                        The temperature         single   alcoholthrough
                                                                                                                                        alcohol
                                                                                                                                  dependence       through
                                                                                                                                                     of the the the
                                                                                                                                                               va-
                                  FAU(10)
                                FAU(10)
                                 por           membrane
                                             membrane
                                       pressure           atat323
                                                               323KK(circle),
                                                    was calculated     (circle),
                                                                          using  333
                                                                                333  KKAntoine
                                                                                   the   (square),and
                                                                                        (square),   and348
                                                                                                         348KK(Table
                                                                                                    constant       (triangle).
                                                                                                                  (triangle).
                                                                                                                            1).
                                        Figure 8 shows the Arrhenius plot of the single-component alcohol permeance
                                         Figure 8the
                                        Because      shows    the Arrhenius
                                                         permeation        flux isplot   of the single-component
                                                                                     described     as the    product of    alcohol
                                                                                                                               the2.7  permeanceand
                                                                                                                                      permeance        through
                                 through       the FAU(10)      membrane.         The    permeance      of methanol         was           × 10−7 −mol       −2the
                                                                                                                                                    2 s−m1 Pas−1
                                                                                                                                                                  −1
                                  the   FAU(10)      membrane.       The     permeance       of  methanol      was     2.7  ×   10 − 7 mol     m
                                partial
                                 Pa        pressure    difference,      the   permeation      flux   in Figure      6  includes
                                     −1 at 303 K, increased with temperature, and reached 4.0 × 10⁻⁷ mol m−2 s−1 Pa−1 at 338 K.     the   temperature        de-
                                  at 303
                                pendence   K, ofincreased
                                                   theenergy
                                                       vapor with   temperature,
                                                                 pressure.              and only
                                                                               To discuss     reachedthe 4.0   × 10−7 mol
                                                                                                         membrane                 m−2 s−1phenomenon,
                                                                                                                           permeation          Pa−1 at 338 K.
                                 The    activation
                                  Thepermeation
                                        activation flux
                                                      energy     for
                                                                 for  permeation
                                                                       permeation       was   9.1  kJ
                                                                                        was 9.1 kJ mol mol −−1 by calculation
                                                                                                              1  by calculation       with
                                                                                                                                       with the Arrhenius
                                                                                                                                              the   Arrhenius
                                the
                                 equation.       The         was
                                                      permeance    converted
                                                                       of  ethanol to  permeance.
                                                                                       also  showed    The   temperature
                                                                                                         aa similar              dependence
                                                                                                                         temperature                of the va-
                                                                                                                                            dependence           to
                                  equation.
                                por    pressure   The  permeance
                                                    wasancalculated     of   ethanol
                                                                         using    theforalso  showed
                                                                                        Antoine    constant  similar
                                                                                                                (Table   temperature         dependence
                                                                                                                           1). −−11. However, 1-Butanol          to
                                 methanol,
                                  methanol,      with
                                                  with  an  activation
                                                            activation     energy
                                                                           energy     for  permeation
                                                                                           permeation      of
                                                                                                           of   14.1
                                                                                                               14.1    kJ
                                                                                                                       kJ  mol
                                                                                                                          mol       . However,       1-Butanol
                                 showed Figurethe  8 showstrend,the Arrhenius          plot of energy
                                                                                                  the single-component              ofalcohol   kJpermeance
                                               thereverse              with
                                                                         withanan  activation              forforpermeation             −44.2      mol   −1. The−1
                                  showedthe
                                through             reverse trend,
                                                   FAU(10)      membrane.        The activation
                                                                                        permeance   energy
                                                                                                        of methanol  permeation
                                                                                                                            was    2.7  of
                                                                                                                                         ×  −−7
                                                                                                                                           10  44.2
                                                                                                                                                 mol kJm mol
                                                                                                                                                           −2 s−1 .
                                 effect
                                  The     of
                                        effect temperature
                                                 of increased
                                                    temperature  on  the   permeance        of  1-propanol
                                                                      on the permeance of 1-propanol was −7      was     small    (activation
                                                                                                                           small (activation       energy      for
                                Pa  −1 at 303 K,                  with                                                                            −1energy for
                                                                    −1 −1temperature, and reached 4.0 × 10 mol m s Pa at 338 K.
                                                                                                                                        −2 −1
                                 permeation
                                  permeation ==−0.9   −          mol).
                                                        0.9kJkJmol        ).
                                The activation energy for permeation was 9.1 kJ mol−1 by calculation with the Arrhenius
                                equation. The permeance of ethanol also showed a similar temperature dependence to
                                methanol, with an activation energy for permeation of 14.1 kJ mol−1. However, 1-Butanol
                                showed the reverse trend, with an activation energy for permeation of −44.2 kJ mol−1. The
                                effect of temperature on the permeance of 1-propanol was small (activation energy for
                                permeation = −0.9 kJ mol−1).

                                             Arrheniusplot
                                 Figure8.8.Arrhenius
                                Figure                    plotofof  permeances
                                                                 permeances    of of  single
                                                                                  single      alcohols
                                                                                           alcohols       through
                                                                                                      through   the the FAU(10)
                                                                                                                     FAU(10)       membrane
                                                                                                                               membrane    (the(the
                                                                                                                                                ac-
                                tivation
                                 activationenergy  for for
                                              energy    permeation:
                                                           permeation:  Methanol;   9.1 kJ
                                                                            Methanol;    9.1mol        −1 , ethanol;
                                                                                                  , ethanol;
                                                                                              kJ−1mol          14.1 kJ14.1
                                                                                                                       molkJ   mol−1 , 1-propanol;
                                                                                                                           −1, 1-propanol;  −0.9 kJ
                                mol     kJ mol−1 , 1-butanol;           kJ mol−1 ).
                                     −1, 1-butanol; −44.2 kJ mol   −1).
                                 −0.9                          −44.2

                                        The
                                         The molecules
                                              molecules adsorbed in the   the pores
                                                                              poresdiffuse
                                                                                      diffuseacross
                                                                                                 acrossthe
                                                                                                         thezeolite
                                                                                                              zeolitemembrane
                                                                                                                       membrane     according
                                                                                                                                  according    to
                                  thethe
                                 to    concentration
                                           concentrationgradient.
                                                           gradient.TheThe
                                                                         adsorbed
                                                                              adsorbedamountamountdecreased   as theastemperature
                                                                                                       decreased                     increased,
                                                                                                                         the temperature      in-
                                  while 8.the
                                Figure
                                 creased,     diffusion
                                            Arrhenius
                                             while       coefficient
                                                    theplot
                                                        diffusion      increased
                                                             of permeances          inversely.
                                                                              of single
                                                                    coefficient          alcohols
                                                                                  increased       The  activation
                                                                                                    through
                                                                                               inversely.          energymembrane
                                                                                                             the FAU(10)
                                                                                                            The  activation  for permeation
                                                                                                                               energy        ac-is
                                                                                                                                        (theper-
                                                                                                                                       for
                                tivation
                                  expressedenergy
                                               as  for
                                                  the  permeation:
                                                       sum  of  the  Methanol;
                                                                    heat  of      9.1 kJ
                                                                             adsorption   mol −1, ethanol; 14.1 kJ mol−1, 1-propanol; −0.9 kJ
                                                                                            and   the activation  energy
                                 meation is expressed as the sum of the heat of adsorption and the activation energy for    for diffusion.  This
                                mol  −1, 1-butanol; −44.2 kJ mol−1).
                                  suggests    that the permeation of methanol and ethanol with positive activation energies
                                  was strongly influenced by diffusion, while adsorption had a significant effect on the
                                       The molecules
                                  permeation             adsorbed
                                                  of 1-butanol.    It in
                                                                      is the  pores diffuse
                                                                         understood             across the is
                                                                                         that 1-butanol      zeolite  membrane
                                                                                                               difficult   to adsorbaccording
                                                                                                                                       into the
                                tozeolite
                                    the concentration      gradient.    The  adsorbed
                                            pores, as considering the results in Figure 6. amount      decreased   as   the  temperature     in-
                                creased, while the diffusion coefficient increased inversely. The activation energy for per-
                                meation is expressed as the sum of the heat of adsorption and the activation energy for
diffusion. This suggests that the permeation of methanol and ethanol with positive acti-
                              vation energies was strongly influenced by diffusion, while adsorption had a significant
                              effect on the permeation of 1-butanol. It is understood that 1-butanol is difficult to adsorb
                              into the zeolite pores, as considering the results in Figure 6.
Membranes 2021, 11, 627                                                                                                              11 of 13

                              3.5. Permeation and Separation Performance of Methanol from Methanol/Organic Solvent
                              Mixture
                               3.5. Table
                                    Permeation and Separation
                                          5 shows             Performance
                                                   the influence          of Methanol
                                                                  of organic          from Methanol/Organic
                                                                             solvent species                Solvent
                                                                                             on the permeation   andMixture
                                                                                                                     sepa-
                              rationTable
                                     performance    of methanol
                                          5 shows the    influence through
                                                                    of organicthe FAU(10)
                                                                                solvent     membrane.
                                                                                        species          When methanol
                                                                                                on the permeation            was
                                                                                                                      and separa-
                              mixed  with ethanol,
                               tion performance   of the  methanol
                                                     methanol        permeation
                                                                through           flux was
                                                                          the FAU(10)       14,700 μmol
                                                                                        membrane.   Whenm   −2 s−1 andwas
                                                                                                           methanol     the mixed
                                                                                                                            sepa-
                              ration factor was
                               with ethanol, the8methanol
                                                   at 348 K. permeation
                                                               These increased    with14,700
                                                                            flux was   the carbon
                                                                                             µmol m  −2 s−1 of
                                                                                                   number    andalcohols   mixed
                                                                                                                   the separation
                               factor
                              with    was 8 atthus,
                                    methanol;   348 K.forThese  increased
                                                           1-hexanol,       with the carbon
                                                                       the methanol           number
                                                                                       permeation  fluxofand
                                                                                                          alcohols   mixed
                                                                                                              separation     with
                                                                                                                           factor
                               methanol;
                              reached     thus,μmol
                                       51,200   for 1-hexanol,
                                                      m−2 s−1 andthe980,
                                                                     methanol   permeation
                                                                         respectively.  The flux
                                                                                             sameand  separation
                                                                                                   trend           factor reached
                                                                                                          was observed     when
                               51,200 µmol    −2 s−1 and 980, respectively. The same trend was observed when methanol
                              methanol   wasmmixed    with methyl esters (except in the case of methyl butyrate).
                               was mixed with methyl esters (except in the case of methyl butyrate).
    Table 5. Influence of solvent species on permeation and separation performances of methanol through the FAU(10) mem-
    brane
     Tablefor
           5. 10 wt% methanol/solvent
               Influence                 mixtures.
                          of solvent species on permeation and separation performances of methanol through the FAU(10)
     membrane for 10 wt% methanol/solvent mixtures.
                             Temperature                           Flux (μmol m−2 s−1)                            Separation Factor
        Solvent
                                 (K)
                              Temperature                   MethanolFlux (µmol m−2 s−Solvent
                                                                                      1)                                  (-) Factor
                                                                                                                   Separation
          Solvent
      Ethanol                     (K)
                                 348                         14,700
                                                             Methanol                 11,000
                                                                                      Solvent                              8(-)
    1-Propanol
        Ethanol                  348
                                  348                        14,400
                                                              14,700                   1740
                                                                                       11,000                            408
     l-Butanol
      1-Propanol                 348
                                  348                        27,900
                                                              14,400                    695
                                                                                         1740                            16040
       l-Butanol
    1-Hexanol                     348
                                 348                          27,900
                                                             51,200                       695
                                                                                        148                                160
                                                                                                                         980
      1-Hexanol
  Methyl acetate                  348
                                 328                          51,200
                                                              231                         148
                                                                                         4.2                            510980
    Methyl acetate                328                          231                        4.2                              510
 Methyl  propionate
  Methyl propionate
                                 328
                                  328
                                                             24,400
                                                              24,400
                                                                                       62.0
                                                                                         62.0
                                                                                                                        1290
                                                                                                                         1290
  Methyl
   Methylbutyrate
           butyrate              348
                                  348                        52,300
                                                              52,300                    538
                                                                                          538                            270
                                                                                                                           270
 Methyl
  Methylhexanoate
          hexanoate              348
                                  348                        98,200
                                                              98,200                   47.0
                                                                                         47.0                           4630
                                                                                                                         4630

                                   Figure
                                    Figure9 9shows
                                                shows the influence
                                                        the         of the
                                                             influence      carbon
                                                                       of the       number
                                                                                carbon       of the
                                                                                        number   of organic solvent
                                                                                                    the organic      on theonper-
                                                                                                                  solvent      the
                              meation
                               permeation fluxes of methanol and solvents for the FAU(10) membrane. As mentionedinin
                                         fluxes  of methanol    and solvents  for  the FAU(10)   membrane.    As  mentioned
                              Table
                               Table5,5,the
                                         thepermeation
                                              permeationfluxfluxof
                                                                 ofmethanol
                                                                   methanolincreased
                                                                               increasedwith
                                                                                          withthe
                                                                                                thecarbon
                                                                                                    carbonnumber
                                                                                                            numberofofalcohols,
                                                                                                                         alcohols,
                              while
                               while that of mixed alcohols showed the reverse tendency. Even whenmethyl
                                    that   of mixed  alcohols  showed   the reverse  tendency.  Even  when   methylesters
                                                                                                                      esterswere
                                                                                                                             were
                              mixed
                               mixedwith
                                       withmethanol,
                                              methanol,the
                                                         thepermeation
                                                              permeationflux
                                                                          fluxofofmethanol
                                                                                   methanolshowed
                                                                                             showeda asimilar
                                                                                                        similarincreasing
                                                                                                                increasingtrend,
                                                                                                                            trend,
                              although
                               althoughthe themeasurement
                                               measurementtemperature
                                                               temperaturewaswasdifferent.
                                                                                  different.

                                          Influenceofofcarbon
                               Figure9.9.Influence
                              Figure                    carbonnumber
                                                                 numberofof(a)
                                                                             (a)alcohol
                                                                                 alcoholand
                                                                                         and(b)
                                                                                             (b)methyl
                                                                                                 methylester
                                                                                                          esteron
                                                                                                                onpermeation
                                                                                                                   permeationfluxes
                                                                                                                               fluxesofofthe
                                                                                                                                          the
                               FAU(10)membranes
                              FAU(10)     membranesfor  for10
                                                            10wt%
                                                                wt%methanol/solvent
                                                                      methanol/solvent    mixturesatat328
                                                                                         mixtures      328KK(unfilled)
                                                                                                               (unfilled)and
                                                                                                                          and348
                                                                                                                              348KK(filled).
                                                                                                                                     (filled).
                              Symbols
                               Symbolsdenote
                                          denotemethanol
                                                 methanol(circle)
                                                              (circle)and
                                                                       andsolvents
                                                                           solvents(square).
                                                                                     (square).

                                     As discussed in Figure 8, methanol and ethanol molecules adsorbed on the zeolite
                               diffuse into the pores and permeate through the zeolite membrane according to the concen-
                               tration gradient. Therefore, for a mixed solution of methanol and ethanol, the permeation
                               of methanol was inhibited by ethanol in the zeolite pores, which reduced the permeation
                               flux of methanol. In contrast, the adsorption of 1-butanol into zeolite pores is important
                               for the permeation of 1-butanol, as shown in Figure 8. For a mixture of methanol and
Membranes 2021, 11, 627                                                                                                          12 of 13

                                1-butanol, the permeation of methanol is not inhibited by 1-butanol because it is difficult
                                for 1-butanol to adsorb on the zeolite pores. As a result, both the permeation flux and
                                separation factor improved for 1-hexanol and methyl hexanoate with more carbons than
                                1-butanol.

                                4. Conclusions
                                      For developing a methanol permselective zeolite membrane, we investigated the influ-
                                ence of the framework structure, composition, and organic compounds on the permeation
                                and separation performance of methanol through zeolite membranes in this study. First,
                                CHA, LTA, MFI, and FAU membranes with few pinholes were successfully prepared on
                                porous support tubes. Then, the permeation and separation performances of methanol
                                were determined by pervaporation with a 10 wt% methanol/methyl hexanoate mixture.
                                As a result, the FAU membrane synthesized with a composition of 10 SiO2 :1Al2 O3 :17
                                Na2 O:1000 H2 O showed a high permeation flux of 86,600 µmol m−2 s−1 and a separation
                                factor of 6020 at 353 K. Next, FAU membranes were prepared using synthetic solutions
                                with different SiO2 /Al2 O3 ratios to investigate the influence of the zeolite composition on
                                the permeation and separation performances of methanol through the FAU membranes.
                                The highest separation factor was obtained at SiO2 /Al2 O3 = 10, although the permeation
                                flux of methanol increased with a higher SiO2 /Al2 O3 ratio. The FAU membrane showed a
                                molecular sieving effect that reduced the single permeation flux of alcohol with molecular
                                size. Moreover, diffusion affected the permeation of methanol and ethanol through the FAU
                                membrane, while adsorption significantly affected the permeation of 1-butanol. Finally,
                                pervaporation experiments using the FAU membrane were carried out for several alcohols
                                and methyl esters. As a result, the permeation flux of methanol increased with the carbon
                                number of organic solvents because of the reduction in the inhibition of methanol perme-
                                ation by these organic solvents. These results suggest that the FAU membrane has the
                                potential to separate organic mixtures, such as solvent recycling and membrane reactors.

                                Author Contributions: Conceptualization, Y.H. and A.I.; methodology, A.I.; validation, A.I. and
                                Y.H.; formal analysis, Y.H. and A.I.; investigation, A.I., W.M. and C.A.; resources, Y.H.; data curation,
                                A.I.; writing—original draft preparation, A.I.; writing—review and editing, Y.H.; visualization, A.I.;
                                supervision, Y.H. All authors have read and agreed to the published version of the manuscript.
                                Funding: Part of this paper is based on results obtained from a project commissioned by the New
                                Energy and Industrial Technology Development Organization (NEDO).
                                Institutional Review Board Statement: Not applicable.
                                Informed Consent Statement: Not applicable.
                                Conflicts of Interest: The authors declare no conflict of interest.

References
1.   Smitha, B.; Suhanya, D.; Sridhar, S.; Ramakrishna, M. Separation of organic–organic mixtures by pervaporation—A review.
     J. Membr. Sci. 2004, 241, 1–21. [CrossRef]
2.   Dong, G.; Nagasawa, H.; Yu, L.; Wang, Q.; Yamamoto, K.; Ohshita, J.; Kanezashi, M.; Tsuru, T. Pervaporation removal of methanol
     from methanol/organic azeotropes using organosilica membranes: Experimental and modeling. J. Membr. Sci. 2020, 610, 118284.
     [CrossRef]
3.   Koh, D.Y.; McCool, B.A.; Deckman, H.W.; Lively, R.P. Reverse osmosis molecular differentiation of organic liquids using carbon
     molecular sieve membranes. Science 2016, 353, 804–807. [CrossRef] [PubMed]
4.   Sakai, M.; Kaneko, T.; Sasaki, Y.; Sekigawa, M.; Matsukata, M. Formation process of columnar grown (101)-oriented silicalite-1
     membrane and its separation property for xylene isomer. Crystals 2020, 10, 949. [CrossRef]
5.   Kanemoto, M.; Negishi, H.; Sakaki, K.; Ikegami, T.; Chohnan, S.; Nitta, Y.; Kurusu, Y.; Ohta, H. Efficient butanol recovery from
     acetone-butanol-ethanol fermentation cultures grown on sweet sorghum juice by pervaporation using silicalite-1 membrane.
     J. Biosci. Bioeng. 2016, 121, 697–700. [CrossRef] [PubMed]
6.   Kita, H.; Fuchida, K.; Horita, T.; Asamura, H.; Okamoto, K. Preparation of Faujasite membranes and their permeation properties.
     Sep. Purif. Technol. 2001, 25, 261–268. [CrossRef]
Membranes 2021, 11, 627                                                                                                            13 of 13

7.    Kumakiri, I.; Hashimoto, K.; Nakagawa, Y.; Inoue, Y.; Kanehiro, Y.; Tanaka, K.; Kita, H. Application of FAU zeolite membranes to
      alcohol/acrylate mixture systems. Catal. Today 2014, 236, 86–91. [CrossRef]
8.    Ikeda, A.; Hasegawa, Y. Efficient transesterification of methyl acetate with 2-propanol by the selective removal of methanol using
      zeolite membranes. Chem. Lett. 2021, 50, 113–115. [CrossRef]
9.    Ikeda, A.; Matsuura, W.; Abe, C.; Hasegawa, Y. Effect of reaction substrates on membrane-assisted transesterification reactions.
      Chem. Eng. Process. 2021, 165, 108443. [CrossRef]
10.   Hasegawa, Y.; Abe, C.; Ikeda, A. Pervaporative dehydration of organic solvents using high-silica CHA-type zeolite membrane.
      Membranes 2021, 11, 229. [CrossRef] [PubMed]
11.   Hasegawa, Y.; Matsuura, W.; Abe, C.; Ikeda, A. Influence of organic solvent species on dehydration behaviors of NaA-type zeolite
      membrane. Membranes 2021, 11, 347. [CrossRef] [PubMed]
12.   Inami, H.; Abe, C.; Hasegawa, Y. Development of ammonia selectively permeable zeolite membrane for sensor in sewer system.
      Membranes 2021, 11, 348. [CrossRef] [PubMed]
13.   Hasegawa, Y.; Kimura, K.; Nemoto, Y.; Nagase, T.; Kiyozumi, Y.; Nishide, T.; Mizukami, F. Real-time monitoring of permeation
      properties through polycrystalline MFI-type zeolite membranes during pervaporation using mass spectrometry. Sep. Purif.
      Technol. 2008, 58, 386–392. [CrossRef]
14.   Ohe, S. Data Book of Vapor-Liquid Equilibrium Computation Program by Excel; Shuzo Ohe: Tokyo, Japan, 2002.
15.   Kemme, H.R.; Kreps, S.I. Vapor pressure of primary n-alkyl chlorides and alcohols. J. Chem. Eng. Data 1969, 14, 98–102. [CrossRef]
16.   Lechert, H. The pH-value and its importance for the crystallization of zeolites. In Verified Syntheses of Zeolite Materials, 2nd ed.;
      Robson, H., Lillerud, K., Eds.; Elsevier: Amsterdam, The Netherlands, 2001; pp. 33–38. [CrossRef]
17.   Breck, D.W. Zeolite Molecular Sieves—Structure, Chemistry, and Use; John Wiley & Sons, Inc.: New York, NY, USA, 1974.
18.   Nishiyama, N.; Gora, L.; Teplyakov, V.; Kapteijin, F.; Moulijn, J.A. Evaluation of reproducible high flux silicalite-1 membranes:
      Gas permeation and separation characterization. Sep. Purif. Technol. 2001, 22–23, 295–307. [CrossRef]
You can also read