Effect of Alloying Elements on the Sr Modification of Al-Si Cast Alloys

Page created by Angel Lewis
 
CONTINUE READING
Effect of Alloying Elements on the Sr Modification of Al-Si Cast Alloys
metals
Article
Effect of Alloying Elements on the Sr Modification of Al-Si
Cast Alloys
Elisa Fracchia 1, * , Federico Simone Gobber 1                     and Mario Rosso 2

                                          1   Department of Applied Science and Technology (DISAT), Polytechnic of Turin, Viale T. Michel 5,
                                              15121 Alessandria, Italy; federico.gobber@polito.it
                                          2   Department of Applied Science and Technology (DISAT), INSTM c/o Polytechnic of Turin, Viale T. Michel 5,
                                              15121 Alessandria, Italy; mario.rosso@formerfaculties.polito.it
                                          *   Correspondence: elisa.fracchia@polito.it; Tel.: +39-0131-2293-58

                                          Abstract: Strontium-based modifier alloys are commonly adopted to modify the eutectic silicon
                                          in aluminum-silicon casting alloys by changing the silicon shape from an acicular to a spherical
                                          form. Usually, the modifier alloy necessary to properly change the silicon shape depends on the
                                          silicon content, but the alloying elements’ content may have an influence. The AlSr10 master alloy’s
                                          modifying effect was studied on four Al-Si alloys through the characterization of microstructural
                                          and mechanical properties (micro-hardness and impact tests). The experimental results obtained
                                          on gravity cast samples highlighted the interdependence in the modification of silicon between the
                                          Si content and the alloying elements. After modification, a higher microstructural homogeneity
                                          characterized by a reduction of up to 22.8% in the size of intermetallics was observed, with a
                                          generalized reduction in secondary dendritic arm spacing. The presence of iron-based polygonal-
                                          shaped intermetallics negatively affects Sr modification; coarser silicon particles tend to grow close
                                          to α-Fe. The presence of casting defects such as bifilm reduces Sr modification’s beneficial effects,
                                          and little increase in absorbed impact energy is observed in this work.
         
         
                                          Keywords: Sr modification; EN AC 45300; EN AC43500; EN AC 48000; EN AC 42100; microstructures;
Citation: Fracchia, E.; Gobber, F.S.;     impact toughness
Rosso, M. Effect of Alloying Elements
on the Sr Modification of Al-Si Cast
Alloys. Metals 2021, 11, 342. https://
doi.org/10.3390/met11020342
                                          1. Introduction
Academic Editor: Gunter Gerbeth
                                                In recent years, aluminum-silicon casting alloys have been given high consideration
Received: 11 January 2021                 thanks to their excellent mechanical properties and generally good corrosion resistance [1,2].
Accepted: 13 February 2021                Moreover, these alloys are characterized by high fluidity, good weldability, and low thermal
Published: 19 February 2021               expansion coefficient [3].
                                                Several fields of application adopt aluminum alloys or aluminum composites [4],
Publisher’s Note: MDPI stays neutral      especially the automotive industry [5,6], where the light weight of aluminum alloys allows
with regard to jurisdictional claims in   the reduction in cars’ weights and, consequently, greenhouse gas emissions [7]. From this
published maps and institutional affil-   point of view, it is not surprising that a great deal of publications consider aluminum-
iations.                                  silicon alloys and aluminum composites or functionally graded materials for automotive
                                          applications, especially adopted to manufacture powertrain components such as pistons by
                                          traditional techniques [8,9] or by powder metallurgy [10,11], and process-related issues [12].
                                          Thanks to alloying elements such as Mg and Cu, aluminum-silicon alloys are susceptible
Copyright: © 2021 by the authors.         to heat treatment to achieve better mechanical properties. Heat treatment usually involves
Licensee MDPI, Basel, Switzerland.        a first step where solubilization takes place, as the alloying elements solubilize into the
This article is an open access article    α-aluminum matrix, and a second step of artificial aging, where intermetallic phases
distributed under the terms and           nucleate into the α-aluminum matrix, thus increasing mechanical properties [13]. During
conditions of the Creative Commons        heat treatment, silicon shape modification takes place, and the eutectic silicon morphology
Attribution (CC BY) license (https://     changes from acicular to spherical; the magnitude of this transformation depends on the
creativecommons.org/licenses/by/          heat treatment parameters (times and temperatures) [14].
4.0/).

Metals 2021, 11, 342. https://doi.org/10.3390/met11020342                                                    https://www.mdpi.com/journal/metals
Effect of Alloying Elements on the Sr Modification of Al-Si Cast Alloys
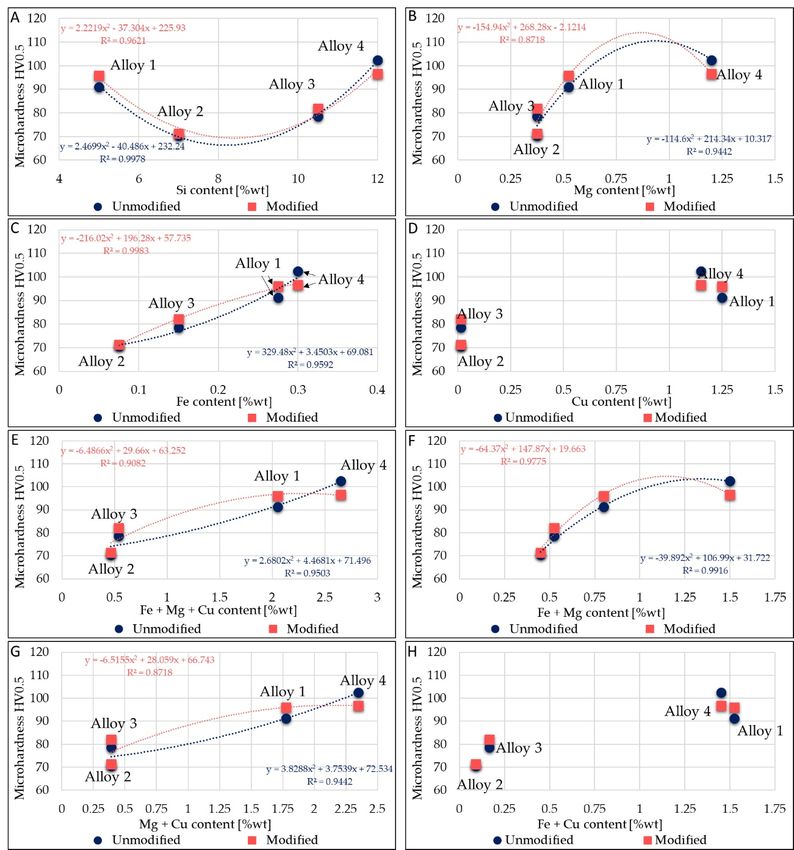
Metals 2021, 11, 342                                                                                                              2 of 19

                                     On the other hand, several chemical elements can promote the modification of eutectic
                               silicon [15] instead of heat treatment: Sr, Na, K, Rb, Ca, Ce, La, Ba, and Yb. In [16], the
                               authors investigated the effect of Ba, Ca, Y, and Yb on 356.0 alloy, observing that these
                               elements modify the eutectic silicon to different degrees. Ba and Ca lead to a good or very
                               good modification of Si into a fine fibrous silicon structure, especially Ba, which led to the
                               best modification among the elements analyzed for the specific alloy composition. Y and
                               Yb caused a plate-like structure, and the same result was underlined in [17] for alloy A357
                               (EN AC 42100). When aluminum-silicon alloys were modified by Yb and Sr, the nucleation
                               temperature of the eutectic silicon decreased, its shape changed from a coarse plate-like
                               to a fine fibrous structure [18]. As regards Eu [19], research has evidenced a very good
                               modification already with 0.05% w.t. Eu in Al-5% Si alloy. Addition of 1% w.t. Ce [20] led
                               to a partial eutectic modification, while the addition of 1% w.t. Ce and 0.04% w.t. Sr can
                               modify the eutectic structure.
                                     In [21,22], the authors studied the relation between the increase in Sc levels and
                               the refining and modification effects in Al-Mg2 Si alloys and found that the silicon shape
                               evolves from a rough plate-like shape to a thin coral-like and fine fibrous morphology.
                                     Al-Si alloys are commonly modified in industrial practice by employing the master
                               alloy Al-Sr10 [23,24]. Experimental evidence demonstrated that Sr modification’s effective-
                               ness depends on both the Sr quantity and the metal quality. High metal quality (minor
                               oxide into the melt) requires a low Sr amount [25]. As proposed in [26], the eutectic phase
                               and the intermetallic phase β-Al5FeSi nucleate on the same nuclei; it is conceivable that Fe
                               affects the eutectic phase. In fact, in [27], it was demonstrated that the number of eutectic
                               grains in Sr-modified alloys containing 10% w.t. silicon is lower when the amount of Fe
                               is higher. As regards mechanical properties, in [28], the authors investigated the effect of
                               refining the Sr-modified A356.2 alloy on the mechanical properties, finding an increase
                               in impact-released energies with the decrease in the grain size after Sr addition. In [29],
                               Sr addition was investigated in the alloy EN AC 46000, and it was found that Sr causes
                               a substantial improvement in tensile properties compared to the as-cast properties. The
                               addition of 276 ppm of Sr increases ultimate tensile strength from 300 to 350 MPa and
                               causes an increase in elongation at rupture from 3% to 6%. Furthermore, a decrease in
                               eutectic temperature nucleation was observed and outlined in alloy A319 [30]. The same
                               behavior was outlined in [31] for high-purity hypoeutectic alloys.
                                     In this work, four aluminum-silicon casting alloys were analyzed. Samples were
                               studied in the unmodified condition or after the use of the master alloy AlSr10. Alloys were
                               cast by gravity casting, and samples were prepared and analyzed in terms of microstructure
                               (silicon shape and intermetallic fraction) and mechanical properties (micro-hardness and
                               impact tests) to find a relationship between the modification and all of these parameters.
                               Intermetallic phase evolutions after the Sr adoption were also investigated to highlight how
                               the various intermetallic phases are affected by Sr for each alloy. Based on the literature,
                               the main intermetallics found in the alloys are reported in Table 1. The goal of the work is
                               to highlight relationships between eutectic characteristics and Sr addition.

                       Table 1. Intermetallic phases expected in the alloys studied from literature [32–35].

           Alloy              Intermetallic Phases                  Alloy                         Intermetallic Phases
 Alloy 1—EN AC 45300     θ-Al2 Cu; β-Mg2 Si; β-Al5 FeSi;     Alloy 3—EN AC 43500
                                                                                            α-Al8 Fe2 Si; β-Al5 FeSi; β-Mg2 Si;
        (alloy 1)              α-Al15 (Fe,Mn)3 Si2                  (alloy 3)
                                                                                               β-Mg2 Si; ε-Al3 Ni; θ-Al2 Cu;
                             β-Mg2 Si; α-Al8 Fe2 Si;
 Alloy 2—EN AC 42100                                         Alloy 4—EN AC 48000       α-Al15 (Fe,Mn)3 Si2 ; β-Al5 FeSi; α-Al8 Fe2 Si;
                         β-Al5 FeSi; α-Al15 (Fe,Mn)3 Si2 ;
        (alloy 2)                                                   (alloy 4)                   Al2 CuMg; Al9 FeMg3 Si5 ;
                         π-Al8 Mg3 FeSi6 ; Al9 FeMg3 Si5
                                                                                          π-Al8 Mg3 FeSi6 ; Q-Al5 Cu2 Mg8 Si6 ;
Effect of Alloying Elements on the Sr Modification of Al-Si Cast Alloys
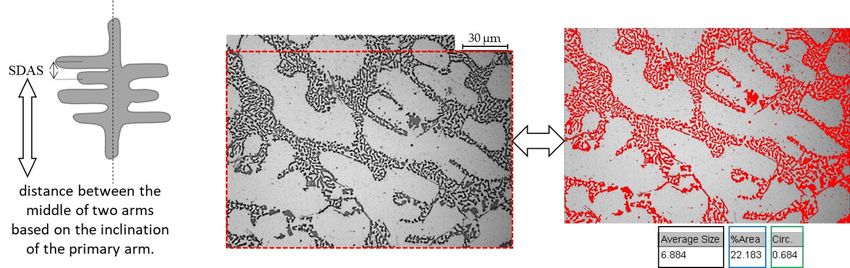
Metals 2021, 11, 342                                                                                                                                                           3 of 19

                                       2. Materials and Methods
                                             The effect of AlSr master alloy addition to four aluminum-silicon alloys with different
                                       silicon contents was studied in this work. Three alloys belong to the hypoeutectic alloys
                                       group—EN AC 42100 (AlSi7Mg0.3), EN AC 45300 (AlSi5Cu1Mg), and EN AC 43500
                                       (AlSi10MnMg)—while the fourth alloy belongs to the eutectic system, EN AC 48000
                                       (AlSi12CuNiMg). Compositional details for the alloys, from now on named alloy 1, alloy 2,
                                       alloy 3, and alloy 4, are shown in Table 2. The composition data refer to standard 1706 and
                                       technical datasheets.

                             Table 2. Alloys’ composition from regulation EN 1706 and technical datasheets.

                                                           EN AB/AC 45300-AlSi5Cu1Mg (Alloy 1)
     Elements           Si              Fe        Cu            Mn              Mg                   Ni              Zn            Pb              Sn                   Ti     Al
       Min.            4.5               -        1.0             -             0.40                   -               -             -               -                -
                                                                                                                                                                               Res.
       Max.            5.5             0.55       1.50          0.55            0.65                 0.25            0.15          0.15            0.05             0.20
          Mechanical properties                             A% = 1 ÷ 2%                                   Rm = 145 ÷ 175 MPa                              Rp0.2 = 125 ÷ 145 MPa
                                                           EN AB/AC 42100-AlSi7Mg0.3 (Alloy 2)
          Elements               Si              Fe                    Cu                     Mn                Mg                         Zn              Ti                Al
            Min.                 6.5              -                      -                      -               0.30                        -             0.10
                                                                                                                                                                             Res.
            Max.                 7.5            0.15                   0.03                   0.10              0.45                      0.07            0.18
          Mechanical properties                             A% = 2 ÷ 6%                                   Rm = 140 ÷ 220 MPa                               Rp0.2 = 80 ÷ 140 MPa
                                                          EN AB/AC 43500-AlSi10MnMg (Alloy 3)
       Elements           Si              Fe                    Cu                     Mn                     Mg                           Zn              Ti                Al
         Min.             9.0              -                      -                    0.40                   0.15                          -               -
                                                                                                                                                                             Res.
         Max.            11.50           0.20                   0.03                   0.80                   0.60                        0.07            0.15
          Mechanical properties                                  A% = 5%                                      Rm = 250 MPa                                   Rp0.2 = 120 MPa
                                                         EN AB/AC 48000-AlSi12CuNiMg (Alloy 4)
     Elements           Si                Fe             Cu                   Mn                       Mg                    Ni                   Zn              Ti           Al
       Min.            10.50               -             0.80                   -                      0.90                 0.70                   -               -
                                                                                                                                                                              Res.
       Max.            13.50             0.60            1.50                 0.35                     1.50                 1.30                 0.35            0.20
          Mechanical properties                           A% = 2 ÷ 6% (T5)                                  Rm = 200 (T5) MPa                              Rp0.2 =185 (T5) MPa

                                             All of these alloys can be reinforced by precipitation hardening because they contain
                                       a certain Mg tenor (reinforcing by nucleation of Mg2 Si intermetallics); alloys contain-
                                       ing Cu can additionally form Al2 Cu and AlCuMg phases [36], and Ni-containing alloys
                                       can form Al3 Ni and other complex intermetallic phases [37]. The presence of Fe and
                                       Mn leads to obtaining Fe-based intermetallic phases such as Al5 FeSi, Al8 FeMg3 Si6 , and
                                       Al15 (FeMn)3 Si2 [38], as reported in Table 1.
                                             Each alloy was separately melted in a graphite crucible, and 250 ppm AlSr10 master
                                       alloy was added for the modification 10 minutes before casting. Casting temperatures
                                       were set to 710 ◦ C for alloy 1 and alloy 2 and 730 ◦ C for alloy 3 and 4. No drossing
                                       agents and fluxing agents were used. Castings obtained (eight in total: four modified and
                                       four unmodified) were cut into smaller samples of 25 mm × 25 mm × 10 mm and then
                                       polished using SiC papers from 180 to 2400 grit, diamond paste, and colloidal silica for
                                       microstructural analysis and micro-hardness measurements.
                                             After polishing, the microstructures were investigated using an optical microscope
                                       (optical microscope LEICA MEF4M, Leica Microsystems, Heerbrugg, Switzerland), and the
                                       eutectic area percentage, eutectic particles’ shape, and particles’ dimensions were measured
                                       at three different parts of each sample using an image analysis software (LEICA QWin,
                                       version 3.5, Leica Microsystems, Heerbrugg, Switzerland). It is important to note that
                                       the measured morphological features (eutectic average particle size, percentage of the
                                       occupied area, and circularity) included intermetallic phases and silicon. Intermetallic
Effect of Alloying Elements on the Sr Modification of Al-Si Cast Alloys
Metals 2021, 11, 342                                                                                                                  4 of 19
Metals 2021, 11, x FOR PEER REVIEW                                                                                                  4 of 19

                                  phaseareas
                                 phase    areaswere
                                                werethen
                                                      thenmeasured
                                                           measuredusing
                                                                       usingananimage
                                                                                  imageanalysis
                                                                                           analysisalgorithm
                                                                                                     algorithmwith
                                                                                                                withthe
                                                                                                                      theopen-source
                                                                                                                          open-source
                                  software   ImageJ.
                                 software ImageJ.
                                        Theeutectic
                                       The   eutecticarea
                                                      areapercentage,
                                                           percentage,which
                                                                        whichisisthetheeutectic
                                                                                        eutecticpercentage
                                                                                                  percentagecalculated
                                                                                                               calculatedin
                                                                                                                          inaaspecific
                                                                                                                               specific
                                 area, was measured for each alloy using three micrographs at magnification 20X. The The
                                  area,  was  measured    for each  alloy  using   three   micrographs    at  magnification  20X.  eu-
                                  eutectic
                                 tectic     shape,
                                         shape,     particle
                                                 particle    dimensions,
                                                          dimensions,   andandintermetallic
                                                                                 intermetallicdimensions
                                                                                                  dimensionswereweremeasured
                                                                                                                     measured using
                                                                                                                                 using
                                  threeimages
                                 three   imagesatat50X
                                                    50Xmagnification
                                                         magnificationforforeach
                                                                             eachsample,
                                                                                     sample,andandfinally,
                                                                                                    finally, secondary
                                                                                                             secondary dendrite
                                                                                                                         dendrite arm
                                                                                                                                  arm
                                  spacing   (SDAS)   was  measured   as reported     in ref. [39] by  measuring   thirty
                                 spacing (SDAS) was measured as reported in ref. [39] by measuring thirty dendrites for  dendrites  for
                                  each  sample,   employing    three  images    at  10X  magnification.      Details about
                                 each sample, employing three images at 10X magnification. Details about the SDAS meas-     the SDAS
                                  measurement
                                 urement          and analysis
                                            and image   image analysis
                                                                 are shownareinshown
                                                                                 Figurein 1. Figure
                                                                                             Alloys' 1. Alloys’ micro-hardness
                                                                                                     micro-hardness               was
                                                                                                                       was calculated
                                  calculated as an average value from ten indentations for each specimen (parameters: 15 s,
                                 as an average value from ten indentations for each specimen (parameters: 15 s, 500 gf, HV
                                  500 gf, HV 0.5) using a LEICA VMHT tester, Leica Microsystems, Heerbrugg, Switzerland.
                                 0.5) using a LEICA VMHT tester, Leica Microsystems, Heerbrugg, Switzerland. Micro-
                                  Micro-hardness was adopted instead of macro-hardness because smaller indentations may
                                 hardness was adopted instead of macro-hardness because smaller indentations may per-
                                  permit observing the AlSr10 effect in eutectic regions.
                                 mit observing the AlSr10 effect in eutectic regions.

     Figure
      Figure1.1.Secondary
                  Secondarydendrite
                             dendritearm spacing
                                       arm        (SDAS)
                                            spacing       measurement
                                                     (SDAS) measurement andand
                                                                             image  analysis.
                                                                                image         Left Left
                                                                                       analysis.   image: SDASSDAS
                                                                                                        image:   measurement    pro-
                                                                                                                      measurement
     cedure
     procedure as in [39]. Center and right images: image analysis details on the eutectic phase (average size, circularity, %area
            as   in [39]. Center and right images:  image analysis details on the eutectic phase  (average size, circularity, % area
     occupied). Optical images at 50X magnification.
      occupied). Optical images at 50X magnification.

                                       Since
                                        Sinceimpact
                                               impacttests
                                                        testscan
                                                              canestimate
                                                                  estimatethe
                                                                            theductility
                                                                                 ductilityof
                                                                                           ofalloys
                                                                                               alloysunder
                                                                                                        underconditions
                                                                                                                conditionsof ofrapid
                                                                                                                                rapidload-
                                                                                                                                        load-
                                 ing
                                  ing[23],
                                      [23],these
                                             thesetests
                                                    testswere
                                                          wereconducted
                                                                conductedto toassess
                                                                                assessthe
                                                                                       theeffectiveness
                                                                                            effectivenessof   ofthe
                                                                                                                 themodifications.
                                                                                                                     modifications.Tests
                                                                                                                                       Tests
                                 were
                                  were performed      using three
                                        performed using      threespecimens
                                                                    specimensfor foreach
                                                                                     eachtype
                                                                                           type of of casting
                                                                                                   casting      (modified
                                                                                                             (modified   andand   unmodi-
                                                                                                                              unmodified),
                                 fied), milled   at a size of 10 mm   × 10 mm    × 55  mm,   following    the
                                  milled at a size of 10 mm × 10 mm × 55 mm, following the ASTM E29-16b standardASTM    E29-16b   standard
                                 TG5113E,
                                  TG5113E,ZwickZwickRoell,
                                                       Roell,Genova,
                                                               Genova,Italy.
                                                                        Italy. Expected
                                                                               Expectedabsorbed
                                                                                           absorbedenergies
                                                                                                        energiesare arelow,
                                                                                                                        low, as
                                                                                                                             as noticeable
                                                                                                                                 noticeable
                                 from
                                  from previous work where the energy absorbed for aluminum composite samples (alloys
                                        previous    work  where   the energy   absorbed   for  aluminum       composite   samples    (alloys
                                 EN
                                  ENACAC48000
                                           48000andandENENAC AC42100)
                                                                 42100)was,
                                                                         was,atatmaximum,
                                                                                  maximum,20    20JJ[40].
                                                                                                      [40].Moreover,
                                                                                                            Moreover,other
                                                                                                                         otherresearch
                                                                                                                                research inin
                                 the
                                  theliterature
                                      literaturereported
                                                   reportedabsorbed
                                                              absorbedenergy
                                                                        energyof  ofalmost
                                                                                     almost15 15JJinin[28],
                                                                                                       [28],aamaximum
                                                                                                               maximumof    of77JJfor
                                                                                                                                   for alloy
                                                                                                                                       alloy
                                 356.0
                                  356.0inin[41],
                                            [41],and
                                                  andananaverage
                                                           averagevalue
                                                                    valueofof77JJfor
                                                                                  forvarious
                                                                                      various alloys
                                                                                                alloys AlSi10
                                                                                                         AlSi10 [42]
                                                                                                                  [42].

                                 3.3.Results
                                     Resultsand
                                             andDiscussion
                                                  Discussion
                                  3.1. Microstructures andIntermetallic
                                 3.1. Microstructures and  IntermetallicPhases
                                                                        Phases
                                       Microstructuresininunmodified
                                      Microstructures          unmodifiedalloys
                                                                             alloys depend
                                                                                  depend   onon
                                                                                              thethe  intermetallic
                                                                                                  intermetallic     phases,
                                                                                                                 phases, whichwhich
                                                                                                                                 de-
                                  depend   on   the alloying   elements.    As previously   mentioned,   the alloys  studied
                                 pend on the alloying elements. As previously mentioned, the alloys studied in the present     in the
                                  present
                                 work      workacontain
                                       contain     certain aamount
                                                             certainof
                                                                     amount
                                                                       Fe, Mn,ofand
                                                                                 Fe,Mg.
                                                                                      Mn,Additionally,
                                                                                          and Mg. Additionally,   alloy
                                                                                                        alloy 1 and alloy1 4and alloy
                                                                                                                             contain
                                  4 contain
                                 Cu  and Ni Cu    and Ni (as
                                              (as reported      reported
                                                             in Table      in Table
                                                                       2). The       2). The microstructures
                                                                               microstructures                  of the
                                                                                                 of the unmodified   andunmodified
                                                                                                                          modified
                                  and  modified   alloys are  reported  in  Figure 2. Some  intermetallic phases  are detectable
                                 alloys are reported in Figure 2. Some intermetallic phases are detectable by optical micros-      by
                                  optical microscopy. The amount of intermetallic phases in the alloys and their influence
                                 copy. The amount of intermetallic phases in the alloys and their influence on mechanical
                                  on mechanical properties depend mainly on the alloys’ compositions. Some of these
                                 properties depend mainly on the alloys’ compositions. Some of these intermetallic phases
                                  intermetallic phases are known to be detrimental [43] as β-Al5 FeSi, increasing the iron
                                 are known to be detrimental [43] as β-Al5FeSi, increasing the iron        content, causes elonga-
                                  content, causes elongation reduction. Fe-β intermetallic phases were profusely found in
                                 tion reduction. Fe-β intermetallic phases were profusely found in alloys 1 and 3. Cu sub-
                                  alloys 1 and 3. Cu substantially influences both strength and hardness, already in the
                                 stantially influences both strength and hardness, already in the as-cast state [44].
                                  as-cast state [44].
Effect of Alloying Elements on the Sr Modification of Al-Si Cast Alloys
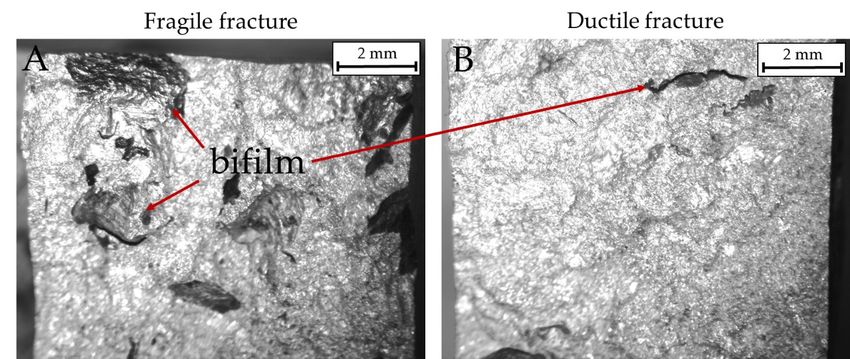
Metals 2021, 11, 342                                                                                                             5 of 19
Metals 2021, 11, x FOR PEER REVIEW                                                                                              5 of 19

     Figure
     Figure 2.
            2. Optical
               Optical microscope
                       microscope images
                                    images at
                                            at 20X magnification. Intermetallic
                                               20X magnification.   Intermetallic phases
                                                                                  phases that
                                                                                         that nucleated
                                                                                              nucleated in
                                                                                                         in the
                                                                                                            the alloys.
                                                                                                                alloys. The
                                                                                                                        The arrows
                                                                                                                            arrows
     indicate
     indicate some intermetallic phases. A: Eutectic silicon; B: α-aluminum matrix; C: acicular Fe intermetallic; D: Cu-based
              some intermetallic  phases. A:  Eutectic silicon; B: α-aluminum   matrix; C: acicular Fe intermetallic; D: Cu-based
     phase; E: Chinese script; F: Q-phase; G: Mg2Si.
     phase; E: Chinese script; F: Q-phase; G: Mg2 Si.

                                 3.2. Micro-Hardness
                                  3.2. Micro-Hardness
                                       Micro-hardness measurements were carried out in the middle of the samples, and
                                       Micro-hardness measurements were carried out in the middle of the samples, and
                                 the results are reported in Figure 3. Micro-hardness varies slightly after adding Al-Sr; for
                                  the results are reported in Figure 3. Micro-hardness varies slightly after adding Al-Sr;
                                 alloys 1 to 3, a subtle increase in micro-hardness was observed after Al-Sr addition, while
                                  for alloys 1 to 3, a subtle increase in micro-hardness was observed after Al-Sr addition,
                                 micro-hardness decreased for alloy 4 after Al-Sr addition. Such differences in micro-hard-
                                 while micro-hardness decreased for alloy 4 after Al-Sr addition. Such differences in micro-
                                 ness are relatively narrow, and a neat, systematic trend was not observed. Positively, in-
                                  hardness are relatively narrow, and a neat, systematic trend was not observed. Positively,
                                 termetallic phases affect the alloys' hardness; particularly, alloys with higher Cu, Fe, Ni,
                                  intermetallic phases affect the alloys’ hardness; particularly, alloys with higher Cu, Fe, Ni,
                                 and Mg contents can form harder intermetallic phases than other alloys. Based on the al-
                                  and Mg contents can form harder intermetallic phases than other alloys. Based on the
                                 loying elements shown in Table 2 and intermetallic phases listed in Table 1, alloy 1 and
                                  alloying elements shown in Table 2 and intermetallic phases listed in Table 1, alloy 1 and
                                 alloy
                                  alloy 44 are
                                           are expected
                                               expected to
                                                         to be
                                                            be the
                                                               the hardest ones because
                                                                   hardest ones because they
                                                                                          they contain
                                                                                                contain strengthening
                                                                                                        strengthening elements
                                                                                                                       elements
                                 such
                                  such as Cu, Mg, Ni, Fe, and Mn; moreover, alloy 4 is the hardest because
                                       as   Cu, Mg, Ni, Fe,  and Mn;  moreover,  alloy 4 is the  hardest because it
                                                                                                                 it contains
                                                                                                                    contains the
                                                                                                                             the
                                 highest quantity of silicon. For the same reasons, alloy 3 is harder than alloy 2 because it
                                 contains a higher Si amount.
Effect of Alloying Elements on the Sr Modification of Al-Si Cast Alloys
Metals 2021, 11, x FOR PEER REVIEW                                                                                                              6 of 19

Metals 2021, 11, 342                                                                                                                             6 of 19
                                            A larger dispersion in the measured micro-hardness was observed for the hardest
                                      alloys (alloys 1 and 4); such variability is due to the significant difference between the
                                      micro-hardness measured near the hard intermetallics and that measured in the soft α-Al
                                      highest quantity of silicon. For the same reasons, alloy 3 is harder than alloy 2 because it
                                      matrix (maximum and minimum values measured were 100 and 72 HV0.5, respectively,
                                      contains a higher Si amount.
                                      in alloy 1 and 115 and 81 HV0.5, respectively, in alloy 4).

                  Micro-hardnessmeasurements
      Figure 3. Micro-hardness     measurementsforfor  allall
                                                           thethe alloys,
                                                               alloys,     unmodified
                                                                       unmodified    (left(left
                                                                                           side)side) and modified
                                                                                                 and modified   (right(right
                                                                                                                       side). side).
                                                                                                                              ValuesValues     re-
                                                                                                                                        reported
      are average
      ported       values. values.
             are average   The table  reports
                                    The  table all  micro-hardness
                                                reports              measurements.
                                                         all micro-hardness             Alloy 1: 86-93
                                                                                measurements.      AlloyHV0.5   = α-Al;
                                                                                                          1: 86-93 HV0.5from   93 to from
                                                                                                                           = α-Al;    100 HV0.5
                                                                                                                                            93 to
      = eutectic;
      100 HV0.5 up   to 100 HV0.5
                  = eutectic; up to =100
                                       intermetallic  phases. Alloy
                                          HV0.5 = intermetallic        2: 65–70
                                                                    phases.      HV0.5
                                                                               Alloy  2: =65–70
                                                                                            α-Al;HV0.5
                                                                                                  up to 70  HV0.5up= eutectic.
                                                                                                         = α-Al;     to 70 HV0.5Alloy    3: 70–80
                                                                                                                                     = eutectic.
      HV0.53:= 70–80
      Alloy    α-Al; HV0.5
                      from 80= to 83 HV0.5
                                α-Al; from 80 = eutectic silicon;
                                                to 83 HV0.5       up to 83
                                                              = eutectic     HV0.5up
                                                                          silicon; = intermetallic
                                                                                      to 83 HV0.5 =phases.     Alloy 4:
                                                                                                       intermetallic    96–100Alloy
                                                                                                                     phases.     HV0.5    = α-Al;
                                                                                                                                       4: 96–100
      from  100 to 110  HV0.5  = eutectic  silicon; up to 110  HV0.5   = intermetallic  phases.
      HV0.5 = α-Al; from 100 to 110 HV0.5 = eutectic silicon; up to 110 HV0.5 = intermetallic phases.

                                           Micro-hardness
                                           A larger dispersion  appears
                                                                     in thedependent
                                                                             measuredon      alloying elements.
                                                                                          micro-hardness              This dependence
                                                                                                               was observed                  is out-
                                                                                                                                 for the hardest
                                     lined
                                     alloysin(alloys
                                                Figure14.and
                                                           Only4);Si, Fe, variability
                                                                    such   Mg, and Cuiswere
                                                                                          due toconsidered,     because
                                                                                                  the significant          these elements
                                                                                                                        difference   between   affect
                                                                                                                                                 the
                                     the  alloys' micro-hardness.
                                     micro-hardness      measured near  In Figure  4A,intermetallics
                                                                            the hard    a parabolic trendand between      Si content
                                                                                                              that measured      in theand   micro-
                                                                                                                                          soft  α-Al
                                     hardness    values is and
                                     matrix (maximum         noticeable.
                                                                  minimum  Despite
                                                                              valuesthe  increasewere
                                                                                       measured    in Si 100
                                                                                                           tenor,
                                                                                                               andalloy    2 and respectively,
                                                                                                                     72 HV0.5,    alloy 3 present  in
                                     less
                                     alloymicro-hardness
                                            1 and 115 and 81   than   alloyrespectively,
                                                                  HV0.5,    1. This behavior     was4).due to their low amount of alloying
                                                                                          in alloy
                                     elements.    In fact, in appears
                                           Micro-hardness       Figure 4B–D,     increases
                                                                          dependent         in micro-hardness
                                                                                       on alloying  elements. This  bydependence
                                                                                                                         parabolic trends       with
                                                                                                                                        is outlined
                                     Mg   addition,
                                     in Figure        Fe addition,
                                                 4. Only              andand
                                                            Si, Fe, Mg,    Cu addition,   respectively,because
                                                                               Cu were considered,         in modified
                                                                                                                    theseorelements
                                                                                                                              unmodified      alloys
                                                                                                                                         affect  the
                                     are  visible.
                                     alloys’        The Fe effect In
                                              micro-hardness.        could  be well
                                                                         Figure  4A, approximated
                                                                                      a parabolic trend by abetween
                                                                                                              linear trend    too. Furthermore,
                                                                                                                         Si content    and micro-
                                     trends
                                     hardness in values
                                                  Figure is
                                                          4E–H     furtherDespite
                                                             noticeable.    clarify the
                                                                                     the impact
                                                                                         increaseofinFe,    Cu, and
                                                                                                        Si tenor, alloyMg2 onandmicro-hardness.
                                                                                                                                  alloy 3 present
                                     less micro-hardness
                                     Alloy   2 and alloy 3 havethanlower
                                                                      alloyMg
                                                                            1. This  behavior
                                                                                and Fe  contents,was  due these
                                                                                                   while    to their   low amount
                                                                                                                   elements    cause anof alloying
                                                                                                                                           increase
                                     elements.
                                     in            In fact, in Figure 4B–D, increases in micro-hardness by parabolic trends with
                                         micro-hardness.
                                     Mg addition,
                                           Figure 4D  Feclearly
                                                         addition,
                                                                 shownandthat
                                                                           Cu addition,   respectively,
                                                                               the increase                in modified
                                                                                              in micro-hardness            or unmodified
                                                                                                                      is related              alloys
                                                                                                                                  to the presence
                                     are  visible.  The  Fe  effect  could  be well   approximated      by  a linear   trend
                                     of Cu. The higher the average Cu amount, the higher the micro-hardness, as observed for  too.  Furthermore,
                                     trends
                                     all      in alloying
                                         of the   Figure 4E–H      further
                                                            elements        clarify The
                                                                        analyzed.    the impact
                                                                                         trends inofFigure
                                                                                                      Fe, Cu,4E,GandareMgsimilar:
                                                                                                                             on micro-hardness.
                                                                                                                                     it seems that
                                     Alloy
                                     the Fe2amount
                                               and alloy   3 have
                                                        almost      lower
                                                                 does   notMg   andthe
                                                                            affect   Fe parabolic
                                                                                        contents, while
                                                                                                   trend;these     elements
                                                                                                             in fact,          cause an
                                                                                                                      the R2 values     areincrease
                                                                                                                                            similar
                                     in each
                                     in  micro-hardness.
                                               case. On the other hand, trends in Figure 4B,F are similar, but the R2 value changes
                                     in both the alloy states (unmodified and modified); this makes the effect of Fe on micro-
                                     hardness values more evident.
                                           Studying the evolution in micro-hardness as a function of the alloying elements may
                                     permit to assume, in advance, the micro-hardness attended for a specific alloy in the as-
Effect of Alloying Elements on the Sr Modification of Al-Si Cast Alloys
Metals 2021, 11, x FOR PEER REVIEW                                                                                               7 of 19

Metals 2021, 11, 342                                                                                                              7 of 19
                                 cast condition. In respect to the micro-hardness, all samples, modified and unmodified,
                                 have the same pattern.

     Figure
      Figure4.
             4.Correlation
               Correlationbetween
                           betweenmicro-hardness
                                    micro-hardness and
                                                    and average
                                                        average elements
                                                                elements contained
                                                                         contained in
                                                                                    in alloys.
                                                                                       alloys. (A).
                                                                                                (A):Relation
                                                                                                    Relationbetween
                                                                                                              betweenaverage
                                                                                                                      averageSi
                                                                                                                             Si
     content
      content and micro-hardness. (B): Relation between average Mg content and micro-hardness. (C): Relation betweenaverage
             and micro-hardness. (B). Relation between average Mg  content and micro-hardness.    (C). Relation between average
     Fe content and micro-hardness. (D). Relation between average Cu content and micro-hardness. (E). Relation between av-
      Fe content and micro-hardness. (D): Relation between average Cu content and micro-hardness. (E): Relation between
     erage Fe + Mg + Cu content and micro-hardness. (F). Relation between average Fe + Mg content and micro-hardness. (G).
      average Fe + Mg + Cu content and micro-hardness. (F): Relation between average Fe + Mg content and micro-hardness.
     Relation between average Mg + Cu content and micro-hardness. (H). Relation between average Fe + Cu content and micro-
     (G): Relation between average Mg + Cu content and micro-hardness. (H): Relation between average Fe + Cu content and
     hardness.
      micro-hardness.
                                 3.3. Secondary Dendrite Arm Spacing (SDAS)
                                        Figure 4D clearly shown that the increase in micro-hardness is related to the presence
                                       SDAS
                                  of Cu.   Themeasurements      were Cu
                                                higher the average      carried out in
                                                                            amount,  theallhigher
                                                                                            samplesthe to observe the difference
                                                                                                        micro-hardness,               be-
                                                                                                                            as observed
                                 tween
                                  for allthe  modified
                                          of the alloyingand  unmodified
                                                            elements         specimens,
                                                                       analyzed.         following
                                                                                  The trends         the procedure
                                                                                                in Figure              reporteditin
                                                                                                           4E,G are similar:         Fig-
                                                                                                                                   seems
                                 ure
                                  that1.the
                                         AsFenoticeable   from Table
                                               amount almost      does3,not
                                                                          theaffect
                                                                               SDASthe
                                                                                     decreased
                                                                                        parabolicintrend;
                                                                                                     all alloys  afterthe
                                                                                                            in fact,    theR2addition  of
                                                                                                                              values are
                                 AlSr10.   Remarkably,     the most   significant  decrease   was   noticed  for  those   compositions
                                  similar in each case. On the other hand, trends in Figure 4B,F are similar, but the R value     2
                                 with   lower
                                  changes      silicon
                                            in both  thecontent  (alloy(unmodified
                                                         alloy states    1), while a minor    decreasethis
                                                                                     and modified);      wasmakes
                                                                                                              observed     in alloy
                                                                                                                     the effect     4. on
                                                                                                                                 of Fe In
                                 detail,  SDAS in alloy
                                  micro-hardness     values1 was
                                                             morereduced
                                                                   evident. by 34%, in alloys 2 and 4 almost by 16%, and in alloy
                                        Studying the evolution in micro-hardness as a function of the alloying elements may
                                  permit to assume, in advance, the micro-hardness attended for a specific alloy in the as-cast
                                  condition. In respect to the micro-hardness, all samples, modified and unmodified, have
                                  the same pattern.
Effect of Alloying Elements on the Sr Modification of Al-Si Cast Alloys
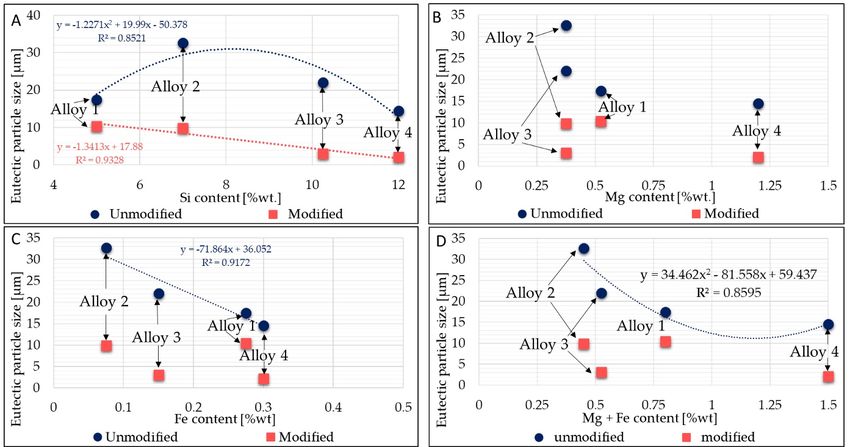
Metals 2021, 11, 342                                                                                                           8 of 19

                       3.3. Secondary Dendrite Arm Spacing (SDAS)
                             SDAS measurements were carried out in all samples to observe the difference between
                       the modified and unmodified specimens, following the procedure reported in Figure 1.
                       As noticeable from Table 3, the SDAS decreased in all alloys after the addition of AlSr10.
                       Remarkably, the most significant decrease was noticed for those compositions with lower
                       silicon content (alloy 1), while a minor decrease was observed in alloy 4. In detail, SDAS in
                       alloy 1 was reduced by 34%, in alloys 2 and 4 almost by 16%, and in alloy 3 by approximately
                       8%. These average results suggest that Al-Sr reduces SDAS significantly for alloys with
                       lower silicon contents.

                       Table 3. SDAS values measured.

                                                              Alloy 1                                    Alloy 2
                          SDAS Values
                                               Unmodified                Modified         Unmodified                Modified
                           SDAS (µm)           27.48 ± 4.15             18.09 ± 4.15      25.03 ± 3.14             20.80 ± 5.14
                                                              Alloy 3                                    Alloy 4
                           SDAS (µm)            15.02 ±2.68             13.77 ±2.18       19.51 ±2.07              16.06 ±1.08

                            However, the casting removal from the mold may affect SDAS comparison in alloys
                       having similar silicon contents because delays in the casting extraction can slow the cooling
                       rate down, thus increasing the measured SDAS.

                       3.4. Eutectic Modification
                             The eutectic region includes the eutectic silicon and the intermetallic phases. The Sr
                       modification mainly influences the average particle size of the silicon, the silicon shape,
                       and the area occupied by the eutectic phase into the alloys’ bulk (percentage of the eutectic
                       silicon in a specific measured area). The eutectic size was strongly reduced after AlSr
                       addition, as visible in Table 4 and Figure 5.

                       Table 4. Image analysis results for the characterization of the eutectic area.

                                                                  Alloy 1                                 Alloy 2
                          Image Analysis
                                                    Unmodified              Modified         Unmodified               Modified
                         Average size (µm)             17.46                   10.41             32.67                  9.92
                             Circularity               0.726                   0.72              0.476                  0.756
                               Solidity                0.825                   0.829             0.729                  0.834
                          % Eutectic phase          30.3 ± 0.52             48.4 ± 2.94       21.9 ± 0.9             35.7 ± 0.85
                                                                  Alloy 3                                 Alloy 4
                          Image Analysis
                                                    Unmodified              Modified         Unmodified               Modified
                         Average size (µm)             22.06                   3.09              14.53                  2.16
                             Circularity               0.75                    0.675             0.822                  0.806
                               Solidity                0.845                   0.796             0.859                  0.884
                          % Eutectic phase          48.1 ± 2.64             52.3 ± 1.92       52.9 ± 4.64            53.7 ± 0.71
Effect of Alloying Elements on the Sr Modification of Al-Si Cast Alloys
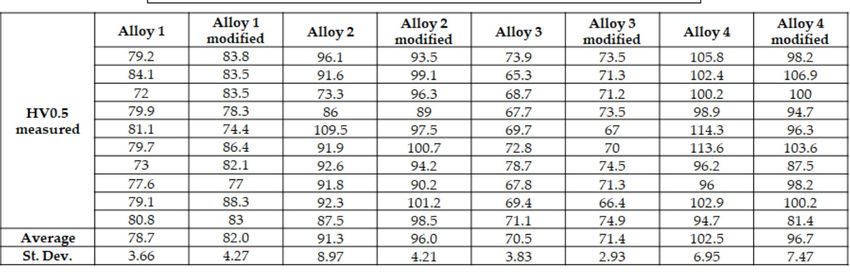
Metals 2021, 11, 342                                                                                                                            9 of 19
Metals 2021, 11, x FOR PEER REVIEW                                                                                                            9 of 19

     Figure
      Figure 5.
              5. (A):
                  (A):Graphical
                      Graphicalrepresentation
                                    representationofofthe
                                                       the average
                                                            average particle
                                                                      particle area;
                                                                                area; (B):
                                                                                       (B): graphical
                                                                                            graphical representation
                                                                                                       representation of
                                                                                                                       of the
                                                                                                                           the percentage
                                                                                                                               percentage of
                                                                                                                                           of
     eutectic
      eutectic phase; (C): the relation between average Si content and SDAS; (D): the relation between average Fe ++ Mg
              phase;  (C): the   relation  between  average  Si content  and   SDAS;     (D): the relation between  average    Fe   Mg ++ Cu
                                                                                                                                          Cu
     content
      contentand
               andSDAS;
                    SDAS; (E):
                           (E): the
                                 the relation
                                      relation between
                                               between average
                                                        average Si
                                                                 Si ++Fe
                                                                      Fe++MgMg++Cu Cucontent
                                                                                        contentand
                                                                                                 andSDAS.
                                                                                                     SDAS.

                                          The
                                           The measurement
                                                eutectic phase’s ofsize
                                                                     circularity  evaluates
                                                                         is different amongthe  theparticle's
                                                                                                    unmodified   perimeter's
                                                                                                                     alloys, but smoothness:      the
                                                                                                                                    such difference
                                   smoother      a particle  becomes,    the higher   the circularity    value.    From   Table
                                    is reduced after modification with AlSr. Alloys with less silicon (alloys 1 and 2) have a      4, it seems   that
                                   the   best results
                                    eutectic   size ofwere   obtained for10
                                                         approximately       alloys
                                                                                µm, 3and
                                                                                      andalloys
                                                                                           4. Thewith
                                                                                                   evaluation       of solidity
                                                                                                          more silicon           instead
                                                                                                                            (alloys        is useful
                                                                                                                                       3 and   4) are
                                   to  characterize
                                    closer   to 2.5 µm;theall
                                                           regularity   andfrom
                                                               the results   roughness    of a particle
                                                                                   the image     analysisasareit represents
                                                                                                                  reported inthe     ratio3between
                                                                                                                                  Table     for each
                                   the   areaFigure
                                    alloy.     of the5measured
                                                        shows theparticle    and thefound
                                                                      relationships    perimeter    of theSDAS
                                                                                              between        imaginary      convex elements.
                                                                                                                     and alloying      hull around   In
                                   it.  As regards
                                    particular,    in solidity,
                                                      Figure 5A, as the  particle becomes
                                                                    a parabolic               morethe
                                                                                   trend in both     solid,   the solidity
                                                                                                          unmodified       andvalue     approaches
                                                                                                                                  modified     alloys
                                   one.
                                    is observed. Figure 5B shows the relation between SDAS and the average content of the
                                    alloying    elements
                                          A parabolic       Fe, Mg, and
                                                         relationship       Cu: insilicon
                                                                         between     this graph,
                                                                                            contentit and
                                                                                                       is noticeable     thatwas
                                                                                                             particle size    thefoundR2 parameter
                                                                                                                                             (Figure
                                    resulted
                                   6A).   Alloysvery  low; athere
                                                   having     loweris content
                                                                      not a clear  trend between
                                                                               of alloying   elements thehave
                                                                                                           alloying
                                                                                                                 largerelements
                                                                                                                         eutectic and     the SDAS
                                                                                                                                     particle  sizes.
                                    measured.
                                   This    behaviorFinally,
                                                      is dueintoFigure   5C, presence
                                                                 the large   all the main   alloyingelements
                                                                                        of alloying     elementsfavoring
                                                                                                                     (Si, Fe, Mg,     and Cu)ofwere
                                                                                                                                 nucleation        in-
                                    considered: into
                                   termetallics     for unmodified
                                                         the eutecticcompositions,      an excellent
                                                                        area, thus limiting             parabolic
                                                                                               the growth             approximation
                                                                                                               of silicon.   On the other having
                                                                                                                                               hand,an
                                    R  2 value of 0.999 is observed. This result indicates that there seems to exist a mathematical
                                   in the modified alloys, a linear correlation between the reduction in eutectic particle size
                                    relation
                                   and         between
                                          the Si  contentSDAS     andisaverage
                                                           increase               alloying
                                                                          noticeable:       element,
                                                                                       the greater   theasSiincontent,
                                                                                                                Equation    (1):lower the Si size.
                                                                                                                          the
                                   Figure 6A–D display the eutectic particle size          evolution related to Si, Fe, and Mg contents.
                                          No clear trend was observed          6.923 x2 Fe
                                                                         y = −between    + 31.71
                                                                                            or Mgx content
                                                                                                     + 11.103and the reduction in eutectic          (1)
                                   silicon particle size. Essentially, the higher the Fe and Mg content, the higher the interme-
                                    where y is the SDAS and x is the average sum of the elements Si, Fe, Mg, and Cu.
                                   tallic phases that occur into the eutectic region; consequently, it seems that the modifica-
                                           The measurement of circularity evaluates the particle’s perimeter’s smoothness: the
                                   tion acts to reduce some intermetallic phases’ size too, resulting in smaller average eutectic
                                    smoother a particle becomes, the higher the circularity value. From Table 4, it seems that
                                   size, even though from the literature [45], it seems that the increase in Mg harms Sr mod-
                                    the best results were obtained for alloys 3 and 4. The evaluation of solidity instead is useful
Effect of Alloying Elements on the Sr Modification of Al-Si Cast Alloys
Metals 2021, 11, 342                                                                                                                                  10 of 19

Metals 2021, 11, x FOR PEER REVIEW                                                                                                          10 of 19
                                    to characterize the regularity and roughness of a particle as it represents the ratio between
                                    the area of the measured particle and the perimeter of the imaginary convex hull around it.
                                    As regards solidity, as the particle becomes more solid, the solidity value approaches one.
                                          A parabolic
                                    ification.         relationship
                                               According     to otherbetween
                                                                         researchsilicon   content
                                                                                    from the         and particle
                                                                                                literature   [34], asize was found
                                                                                                                     reduced    effect(Figure   6A).
                                                                                                                                       of Sr mod-
                                    Alloys   having   a lower     content    of alloying    elements     have   larger   eutectic
                                    ification was observed in alloys with higher Mg content. The reduction in the area occu-       particle   sizes.
                                    This behavior
                                    pied             is duephase
                                          by the eutectic       to thewaslarge  presence
                                                                             reduced    to aoflesser
                                                                                                alloying
                                                                                                      extentelements    favoring in
                                                                                                               (in magnitude)      nucleation
                                                                                                                                      alloy 1 and of
                                    intermetallics
                                    alloy  4, which into  the eutectic
                                                     are richer    in Mgarea,
                                                                            thanthus   limiting
                                                                                 the other         the growth
                                                                                              alloys.            of silicon.
                                                                                                       Furthermore,          On the et
                                                                                                                         Shabestari   other   hand,
                                                                                                                                         al. in [41]
                                    in the modifiedthat
                                    demonstrated       alloys,
                                                           if Mna islinear  correlation
                                                                       present,  Sr has abetween
                                                                                           negligible theeffect
                                                                                                           reduction    in eutectic
                                                                                                                 on modifying     theparticle
                                                                                                                                      form ofsizethe
                                    and the Si
                                    primary      content
                                               β-Fe phase. increase
                                                              In this is   noticeable:
                                                                        respect,  a largethe greaterofthe
                                                                                           amount        β-FeSi phase
                                                                                                                content,wasthefound
                                                                                                                                lowerinthe  Si size.
                                                                                                                                         modified
                                    Figure16A–D
                                    alloys    and 3,display    the eutectic
                                                     compositions        whichparticle  size
                                                                                 are rich  inevolution
                                                                                               Mn.         related to Si, Fe, and Mg contents.

      Figure 6.
      Figure  6. The
                 The relationships
                      relationshipsbetween
                                       betweenparticle
                                                particlesize
                                                          sizeand
                                                                and
                                                                  Si,Si,
                                                                      Mg,Mg,
                                                                          andand
                                                                               Fe Fe contents.
                                                                                  contents. (A):(A). Relation
                                                                                                 Relation     between
                                                                                                           between     average
                                                                                                                   average      Si content
                                                                                                                           Si content and
      and eutectic particles’ size.; (B). Relation between average Mg content and eutectic particles’ size. (C). Relation between
      eutectic particles’ size.; (B): Relation between average Mg content and eutectic particles’ size. (C): Relation between average
      average Fe content and eutectic particles’ size. (D). Relation between average Mg + Fe content and eutectic particles’ size.
      Fe content and eutectic particles’ size. (D): Relation between average Mg + Fe content and eutectic particles’ size.

                                            In
                                            No[46],
                                                 clearthe   authors
                                                        trend    was underline
                                                                        observed betweenthat despite Fe orSrMg
                                                                                                             addition,
                                                                                                                 contentα-Feandintermetallics
                                                                                                                                 the reduction do      not dis-
                                                                                                                                                    in eutectic
                                    solve    into  the  Al   matrix,    while      β-Fe   intermetallics      can  be affected    by
                                     silicon particle size. Essentially, the higher the Fe and Mg content, the higher the intermetal- Sr  addition   [47]. This
                                    behavior      can   be  highlighted        by    measuring       the  main   intermetallic
                                     lic phases that occur into the eutectic region; consequently, it seems that the modification  phases,   easily   discerni-
                                    ble
                                     actsunder     an optical
                                           to reduce              microscope. phases’
                                                         some intermetallic           The evolution
                                                                                                 size too,ofresulting
                                                                                                              differentinintermetallic
                                                                                                                            smaller averagephases    was stud-
                                                                                                                                                 eutectic  size,
                                    ied
                                     eveninthough
                                              each alloy.
                                                       from Mainly,
                                                               the literatureα-Fe [45],
                                                                                     phases,    β-Fe that
                                                                                           it seems    phases,    and Fe-Mg
                                                                                                            the increase    in Mgintermetallics     were ana-
                                                                                                                                    harms Sr modification.
                                    lyzed through
                                    According             the image
                                                     to other           analysis,
                                                                  research      fromfinding        a relation
                                                                                         the literature         between
                                                                                                            [34],  a reducedSr addition
                                                                                                                                 effect ofand   intermetallic
                                                                                                                                            Sr modification
                                    modification.       Figure     7 shows      the    results   regarding     the  main
                                    was observed in alloys with higher Mg content. The reduction in the area occupied      intermetallic    phases    detected
                                                                                                                                                         by the
                                    in
                                     eutectic phase was reduced to a lesser extent (in magnitude) in alloy 1 and alloy 4, Figure
                                        each   alloy   and    their  evolution        (in terms    of area   occupied)    after  Sr addition.   From     which
                                    6,
                                     areitricher
                                            is arguable
                                                   in Mg thanthat the
                                                                    β-Feotherphases     decrease
                                                                                   alloys.            after Sr Shabestari
                                                                                              Furthermore,       addition; the     area
                                                                                                                              et al.      occupied
                                                                                                                                      in [41]          by β-Fe
                                                                                                                                              demonstrated
                                    intermetallic      phases decreases
                                     that if Mn is present,                        further ineffect
                                                                   Sr has a negligible            alloyson1 and   3, where
                                                                                                             modifying     thea form
                                                                                                                                high amount       of β-Feβ-Fe
                                                                                                                                        of the primary     was
                                    detected—from
                                    phase. In this respect, 33.7 toa5.4large µmamount
                                                                                  2 in alloy 1 and from 15.9 to 2.8 µm2 in alloy 3.
                                                                                              of β-Fe phase was found in modified alloys 1 and 3,
                                            Furthermore,
                                     compositions       which   a decrease
                                                                   are rich in   inMn.
                                                                                     the average occupied area of α-Fe in alloy 1 after Sr addi-
                                    tion, Infrom   55.9   to  39.7  µm   2 , was    observed,
                                                [46], the authors underline that despite           with similar    standardα-Fe
                                                                                                             Sr addition,      deviations.    Alloy 4do
                                                                                                                                     intermetallics      shows
                                                                                                                                                            not
                                    adissolve
                                       sharp increase
                                                 into thein   Alα-Fe    afterwhile
                                                                   matrix,       Sr addition,      from 28.2 tocan
                                                                                         β-Fe intermetallics        almost    80 µm .by
                                                                                                                        be affected    2 Looking     at the[47].
                                                                                                                                            Sr addition     av-
                                    erage     area results
                                    This behavior          can (Figure       7), it may
                                                                 be highlighted           bybemeasuring
                                                                                                  argued that  theSrmain
                                                                                                                      acts intermetallic
                                                                                                                             on β-Fe phases,       causing
                                                                                                                                              phases,        its
                                                                                                                                                         easily
                                     discernible under
                                    fragmentation         in allanthe
                                                                    optical
                                                                       alloys.  microscope.        The evolution
                                                                                   As for Mg-containing               of different
                                                                                                                  phases,              intermetallic
                                                                                                                            they decrease               phases
                                                                                                                                              their occupied
                                    was
                                    area,studied
                                             apart fromin each
                                                             alloyalloy.
                                                                     4, which Mainly,             phases,
                                                                                           α-Fe both
                                                                                    increases           Mg2β-Fe
                                                                                                              Si andphases,    and Fe-Mg
                                                                                                                       α-Fe phases.      Alloyintermetallics
                                                                                                                                               3 shows sim-
                                    were     analyzed
                                    ilar values            through
                                                    in terms            the image
                                                                 of average               analysis,phase
                                                                                   intermetallic       finding    a relation between Sr addition and
                                                                                                               area.
                                     intermetallic      modification.
                                            Intermetallic      behaviors Figurecould be   7 shows
                                                                                             relatedthe    results
                                                                                                       to the        regarding
                                                                                                                eutectic           thesize.
                                                                                                                          particles’     main  intermetallic
                                                                                                                                             For  alloy 1, eu-
                                    phases
                                    tectic     detected
                                             particle   sizeindecreased
                                                                  each alloy   byand 40.4%,their
                                                                                               andevolution      (in terms of
                                                                                                     all the intermetallic        area occupied)
                                                                                                                               phases    decreased after     Sr
                                                                                                                                                       in aver-
                                    age area; this indicates that the eutectic particle size decrease was mainly due to the inter-
                                    metallic area reduction rather than Si reduction. Alloy 2 eutectic particle sizes decreased
                                    by about 70%, while an increase in the α-Fe area of about 50% was observed. This evidence
Metals 2021, 11, x FOR PEER REVIEW                                                                                                           11 of 19

Metals 2021, 11, 342                                                                                                                           11 of 19
                                 indicates that the average eutectic area's substantial decrease was mainly due to silicon
                                 reduction and Fe-Mg intermetallic reduction.
                                       As regards alloy 3, the average eutectic particle area shrank by 86% after Sr addition.
                                  addition.atFrom
                                 Looking           Figure 6, it is area
                                              the intermetallic    arguable that β-Fe
                                                                        evolution,      phases decrease
                                                                                    it appears  that the after  Sr addition;
                                                                                                          eutectic            the area
                                                                                                                    area decrease    is
                                  occupied   by β-Fe  intermetallic   phases  decreases
                                 attributable to both silicon and intermetallic reduction.further  in alloys
                                                                                                Finally,  in 1  and
                                                                                                             alloy   3,
                                                                                                                    4,  where
                                                                                                                       an       a high
                                                                                                                          increase  in
                                  amount
                                 α-Fe  andof       was detected—from
                                              β-Fe phases
                                            Mg2Si          was detected.33.7
                                                                           The to  5.4 µm2 in
                                                                                reduction   in the
                                                                                               alloy  1 and from
                                                                                                    average        15.9particles’
                                                                                                             eutectic   to 2.8 µm  2 in
                                                                                                                                  area
                                  alloy 3. 85%) is mostly attributable to a decrease in Si size.
                                 (almost

     Figure
     Figure 7.
             7. Intermetallics
                 Intermetallics measured
                                measured for each alloy.
                                         for each alloy. Intermetallic
                                                         Intermetallicmeasurements
                                                                       measurementsare
                                                                                    areevidenced
                                                                                        evidencedininthe
                                                                                                      themicrographs
                                                                                                          micrographsbybydifferent
                                                                                                                           differ-
     ent colors—the table shows the area occupied for each intermetallic phase. Data for the α-Fe and β-Fe in the unmodified
     colors—the table shows the area occupied for each intermetallic phase. Data for the α-Fe and β-Fe in the unmodified
     condition for alloys 1 and 3 refer to previous work [32].
     condition for alloys 1 and 3 refer to previous work [32].

                                 3.5. Impact   Toughnessa decrease in the average occupied area of α-Fe in alloy 1 after Sr
                                        Furthermore,
                                       Figurefrom
                                  addition,     8 shows     the39.7
                                                      55.9 to         µm2 , was observed,
                                                                 microstructures        and the with
                                                                                                   impact    toughness
                                                                                                          similar          values
                                                                                                                    standard        for alloysAlloy
                                                                                                                               deviations.     in the4
                                 unmodified
                                  shows a sharp  (bars   on thein
                                                      increase     left  side)
                                                                      α-Fe      andSrmodified
                                                                             after      addition,conditions
                                                                                                      from 28.2 (bars     on the
                                                                                                                   to almost      µm2 .side).
                                                                                                                               80right          After
                                                                                                                                          Looking    at
                                 modification,
                                  the average area silicon   particles
                                                        results  (Figure  in7),
                                                                             alloy   1 still
                                                                                it may   behad     an acicular
                                                                                              argued              shape
                                                                                                         that Sr acts  on (Figure   8E), despite
                                                                                                                           β-Fe phases,    causingthe
                                                                                                                                                    its
                                 average   particleinsize
                                  fragmentation               decreasing
                                                         all the alloys. As   byforalmost    70% for the
                                                                                     Mg-containing            unmodified
                                                                                                           phases,            sampletheir
                                                                                                                     they decrease      (Figure  8A).
                                                                                                                                            occupied
                                 This
                                  area,isapart
                                          not surprising;
                                                from alloyin4,fact,  whichthe increases
                                                                               measuredboth   circularity
                                                                                                    Mg2 Si reported
                                                                                                             and α-Feinphases.
                                                                                                                            Figure 3Alloy
                                                                                                                                       remains   con-
                                                                                                                                             3 shows
                                  similar
                                 stant.    values
                                         This        in terms
                                               behavior       mayof be
                                                                     average    intermetallic
                                                                          associated    with the   phase    area. of large polyhedral Fe-based
                                                                                                      presence
                                        Intermetallic
                                 intermetallics    in thebehaviors        could be
                                                             eutectic region.      As related
                                                                                       previously to the   eutectic
                                                                                                        brought   up,particles’   size.regions
                                                                                                                        the eutectic     For alloy
                                                                                                                                                in al-1,
                                  eutectic
                                 loys  1 andparticle    size decreased
                                              4 are composed                  by 40.4%,
                                                                     of eutectic    siliconandandall    the intermetallic
                                                                                                    various   intermetallicphases
                                                                                                                               phases.decreased     in
                                                                                                                                         Since inter-
                                  averagephases
                                 metallic   area; this     indicates
                                                      typically    havethat     the eutectic
                                                                           polyhedral      shapes,particle
                                                                                                       thosesize   decrease
                                                                                                              phases           was mainly
                                                                                                                        negatively             due to
                                                                                                                                     impact tough-
                                  the intermetallic
                                 ness  and fracture area       reduction
                                                         behavior.      Hence,rather    thanthe
                                                                                  despite       Si eutectic
                                                                                                   reduction.     Alloy 2 eutectic
                                                                                                              modification,     impact particle
                                                                                                                                          energysizes
                                                                                                                                                  ab-
                                  decreased    by   about    70%,    while   an   increase    in  the   α-Fe  area   of about
                                 sorbed cannot increase significantly, as depicted in the bar chart of Figure 8: alloy 1 energy 50%   was   observed.
                                  Thisfrom
                                 rose   evidence
                                              5.43 ±indicates     that± the
                                                       0.16 to 6.29       0.69average
                                                                               J, and thateutectic    area’s
                                                                                               of alloy       substantial
                                                                                                          4 increased    fromdecrease    wastomainly
                                                                                                                               2.83 ± 0.13     3.17 ±
                                  due  to silicon   reduction     and    Fe-Mg    intermetallic      reduction.
                                 0.22 J. As regards alloy 2, many bifilms were found in the modified specimens; these bi-
                                 films As  regardsreduce
                                        probably       alloy 3,thethefinal
                                                                        average    eutectic
                                                                             absorbed          particleAs
                                                                                           energies.      area shrank in
                                                                                                             reported     by[25],
                                                                                                                             86% the
                                                                                                                                   aftermelt
                                                                                                                                         Sr addition.
                                                                                                                                              quality
                                  Looking at the intermetallic area evolution, it appears that the eutectic area decrease is
                                  attributable to both silicon and intermetallic reduction. Finally, in alloy 4, an increase in
                                  α-Fe and Mg2Si phases was detected. The reduction in the average eutectic particles’ area
                                  (almost 85%) is mostly attributable to a decrease in Si size.
Metals 2021, 11, 342                                                                                                                   12 of 19

                                   3.5. Impact Toughness
                                        Figure 8 shows the microstructures and the impact toughness values for alloys in the
                                  unmodified (bars on the left side) and modified conditions (bars on the right side). After
                                  modification, silicon particles in alloy 1 still had an acicular shape (Figure 8E), despite the
                                  average particle size decreasing by almost 70% for the unmodified sample (Figure 8A).
                                  This is not surprising; in fact, the measured circularity reported in Figure 3 remains
                                  constant. This behavior may be associated with the presence of large polyhedral Fe-based
                                  intermetallics in the eutectic region. As previously brought up, the eutectic regions in
                                  alloys 1 and 4 are composed of eutectic silicon and various intermetallic phases. Since
                                  intermetallic phases typically have polyhedral shapes, those phases negatively impact
                                  toughness and fracture behavior. Hence, despite the eutectic modification, impact energy
                                  absorbed cannot increase significantly, as depicted in the bar chart of Figure 8: alloy 1
Metals 2021, 11, x FOR PEER REVIEW                                                                                           12 of 19
                                  energy rose from 5.43 ± 0.16 to 6.29 ± 0.69 J, and that of alloy 4 increased from 2.83 ± 0.13
                                  to 3.17 ± 0.22 J. As regards alloy 2, many bifilms were found in the modified specimens;
                                  these bifilms probably reduce the final absorbed energies. As reported in [25], the melt
                                  affects
                                  qualitythe  effectiveness
                                           affects           of Sr modification.
                                                   the effectiveness              In this sense,
                                                                      of Sr modification.        the
                                                                                           In this   presence
                                                                                                   sense,      of bifilmof
                                                                                                          the presence   onbifilm
                                                                                                                            the frac-
                                                                                                                                  on
                                  ture surfacesurface
                                  the fracture  indicated   a quality
                                                        indicated      of melt
                                                                   a quality of not
                                                                                meltsufficient to obtain
                                                                                     not sufficient       the the
                                                                                                    to obtain bestbest
                                                                                                                   performances
                                                                                                                       performancesin
                                  terms  of modification.
                                  in terms  of modification.

      Figure 8.
      Figure  8. Impact
                 Impact test
                         test results
                              resultsand
                                      andalloys’
                                           alloys'microstructures
                                                   microstructures(optical
                                                                   (opticalmicroscope).
                                                                            microscope). Microstructures
                                                                                        Microstructures    (A–D)
                                                                                                         (A–D)     refer
                                                                                                                refer    to the
                                                                                                                      to the    unmodi-
                                                                                                                             unmodified
      fied alloys, as on the bar chart's left side. Microstructures (E–H) refer to the modified alloys, as on the bar chart's right side.
      alloys, as on the bar chart’s left side. Microstructures (E–H) refer to the modified alloys, as on the bar chart’s right side.
      Image (A,E): alloy 1; image (B,F): alloy 2; image (C,G): alloy 3; image (D,H): alloy 4.
      Image (A,E): alloy 1; image (B,F): alloy 2; image (C,G): alloy 3; image (D,H): alloy 4.
                                         Figure 9 documents the relations between intermetallics and silicon shape observed.
                                   In particular, Figure 9 refers to alloy 3. Some intermetallic phases seem to influence the
                                   eutectic silicon dimensions and shapes. In alloy 3, the decrease in silicon length away from
                                   intermetallic phases was noticeable, as observed in previous work too [32] (see Table 4).
                                   Despite that, an uneven modification of the eutectic silicon from a plate-like to a spherical-
                                   like shape was documented. As the eutectic spherical shape promotes ductile fracture [48],
Metals 2021, 11, 342                                                                                                                                   13 of 19

                                       Figure 9 documents the relations between intermetallics and silicon shape observed.
                                  In particular, Figure 9 refers to alloy 3. Some intermetallic phases seem to influence the
                                  eutectic silicon dimensions and shapes. In alloy 3, the decrease in silicon length away
                                  from intermetallic phases was noticeable, as observed in previous work too [32] (see
                                  Table 4). Despite that, an uneven modification of the eutectic silicon from a plate-like to a
                                  spherical-like shape was documented. As the eutectic spherical shape promotes ductile
                                  fracture [48], the uneven modification resulted in a slight increase in absorbed energy from
                                  the unmodified compared to the modified samples. On the other hand, it seems that the
                                  β-Fe acicular phases mainly detected in the modified alloy 3 (blue arrow in Figure 9) do
 Metals 2021, 11, x FOR PEER REVIEW                                                                                         13 (red
                                  not affect the silicon particle shapes, while, on the contrary, Fe plate-like intermetallics  of 19
                                  arrow in Figure 9) strongly affect the silicon modification in their surrounding areas.

       Figure 9. Effect of intermetallic
                                   Figurephases  on of
                                           9. Effect silicon shape. Optical
                                                        intermetallic phases micrograph   of alloy
                                                                             on silicon shape.      3 modified.
                                                                                                Optical         Redof
                                                                                                        micrograph    arrow
                                                                                                                        alloyindicates Fe Red
                                                                                                                              3 modified.
       plate intermetallics; blue arrow  indicates acicular  Fe intermetallic. The  uneven  silicon  shape is well visible near the inter-
                                   arrow indicates Fe plate intermetallics; blue arrow indicates acicular Fe intermetallic. The uneven
       metallics.                  silicon shape is well visible near the intermetallics.

                                           Twosurface
                                          Two     surfacefractures
                                                              fracturesafter
                                                                          afterimpact
                                                                                  impacttests
                                                                                            testsare
                                                                                                   areshown
                                                                                                        shownin   inFigures
                                                                                                                      Figures10    10and
                                                                                                                                       and11.
                                                                                                                                            11.In
                                                                                                                                                In particular,
                                                                                                                                                    particular,
                                    Figure    10   highlights     the  presence     of  bifilms   in  the bulk    of   the   specimens.
                                   Figure 10 highlights the presence of bifilms in the bulk of the specimens. Alloy 4 resulted               Alloy  4 resulted
                                                                                                                                                             in
                                    in  low    absorbed      energy     because     of  the  extensive     presence        of
                                   low absorbed energy because of the extensive presence of oxide skins, while alloy 3 resultedoxide    skins,  while   alloy 3
                                    resultedand
                                   cleaner       cleaner
                                                     showed  andhigher
                                                                   showed      higher
                                                                           impact        impact
                                                                                     energy         energy absorbed.
                                                                                                absorbed.      In Figure 11,   In Figure
                                                                                                                                    the SEM 11,micrographs
                                                                                                                                                 the SEM mi-
                                    crographsthe
                                   represent       represent
                                                        different thefracture
                                                                       different   fracture behaviors
                                                                                behaviors      detected in   detected
                                                                                                                the tested  in the   tested specimens.
                                                                                                                                specimens.                  Par-
                                                                                                                                                Particularly,
                                    ticularly,
                                   samples        samples
                                               from     alloysfrom
                                                                3 andalloys     3 and 4toare
                                                                        4 are shown             shown the
                                                                                             highlight    to highlight
                                                                                                               different kindsthe different     kinds
                                                                                                                                      of fractures      of frac-
                                                                                                                                                     detected.
                                    tures detected.
                                   Specimens       realizedSpecimens
                                                                by alloyrealized      by alloy
                                                                            4 fractured            4 fractured
                                                                                            in a fragile   manner, in aas  fragile    manner,
                                                                                                                             noticeable          as noticeable
                                                                                                                                            by the   cleavage
                                    by theand
                                   facets    cleavage      facets
                                                  the rivers        and theinrivers
                                                                 detected        Figure detected
                                                                                          11A. Byincontrast,
                                                                                                        Figure 11A.samples By contrast,
                                                                                                                                 realized samples
                                                                                                                                            by alloy realized
                                                                                                                                                       3 show
                                   aby
                                     morealloy   3 show
                                             ductile        a more as
                                                         behavior,     ductile   behavior,
                                                                          depicted             as depicted
                                                                                       in Figure    11B, withina Figure         11B, with
                                                                                                                     large number            a large number
                                                                                                                                          of dimples    on the
                                   fracture
                                    of dimples surface.
                                                    on the  The   fracture
                                                               fracture      surfaces
                                                                          surface.    Theforfracture
                                                                                              alloy 1 are    similar
                                                                                                         surfaces     fortoalloy
                                                                                                                             alloy14are while  thosetoofalloy
                                                                                                                                           similar       alloy4
                                   2while
                                     are similar
                                            those of  to alloy 3.2 are similar to alloy 3.
                                          On
                                           Onalloy
                                                 alloy44(and,
                                                           (and,similarly,
                                                                    similarly,on onalloy
                                                                                     alloy1), 1),cleavage
                                                                                                  cleavagefacets
                                                                                                               facetswereweredetected,
                                                                                                                                  detected,while
                                                                                                                                               whiledimples
                                                                                                                                                       dimples
                                   related   to  the  modified      eutectic  silicon   were   observed     only    to  a  limited
                                    related to the modified eutectic silicon were observed only to a limited extent on the frac-      extent  on  the fracture
                                   surface    [49]. Despite
                                    ture surface                 the increase
                                                       [49]. Despite              in average
                                                                         the increase            eutecticeutectic
                                                                                          in average        size, circularity        and solidity
                                                                                                                       size, circularity            indicated
                                                                                                                                             and solidity     in-
                                   an  incomplete
                                    dicated              modification;
                                                an incomplete              the impact
                                                                     modification;      theenergy
                                                                                             impact  increased     slightly. On
                                                                                                        energy increased               alloy 3,On
                                                                                                                                   slightly.    thealloy
                                                                                                                                                     presence
                                                                                                                                                          3, the
                                   of  fewer intermetallic
                                    presence                        phases positively
                                                  of fewer intermetallic                      affects the
                                                                                phases positively            impact
                                                                                                         affects          toughness.
                                                                                                                  the impact               SiliconSilicon
                                                                                                                                    toughness.       particles
                                                                                                                                                            par-
                                   break,
                                    ticles forming       dimples,dimples,
                                            break, forming            but the roundness        of the silicon
                                                                                 but the roundness          of theparticles
                                                                                                                       siliconcan     be further
                                                                                                                                  particles   can improved.
                                                                                                                                                    be further
                                    improved.
                                           Figure 12 shows the impact specimens’ edge for each composition studied. Particu-
                                    larly, cracks on the edge of the samples and absorbed energies were documented and re-
                                    lated with the microstructural behaviors previously measured: SDAS, eutectic particle
                                    size, and intermetallic phases (α-Fe, β-Fe, and Fe-Mg).
                                           As noticeable in Figure 12, the edges of the impact test specimen of alloy 1 show
                                    different features. In the unmodified alloy sample, many cracks were detected, while the
                                    modified alloy showed a limited number of defects. These defects are related to the spec-
Metals2021,
Metals       11,x342
       2021,11,   FOR PEER REVIEW                                                                                                                         1414ofof19
                                                                                                                                                                   19
Metals 2021, 11, x FOR PEER REVIEW                                                                                                                         14 of 19

     Figure
      Figure10.
             10.Macrographic
                 Macrographic     images  of of
                                     images   fractured  surfaces
                                                 fractured         in impact
                                                            surfaces          specimens. (A): (A):
                                                                                              A brittle  fracture in alloy 4 modified (im-
             10. Macrographic      images  of fractured   surfaces  in in impact
                                                                        impact   specimens.
                                                                               specimens.           A brittle
                                                                                          (A): A brittle      fracture
                                                                                                          fracture      in alloy
                                                                                                                   in alloy      4 modified
                                                                                                                            4 modified (im-
     pact energy 3.17 J). (B): A ductile fracture in alloy 3 modified (impact energy 8.82 J).
      (impact
      pact    energy
           energy 3.173.17  J). (B):
                       J). (B):       A ductile
                                 A ductile      fracture
                                            fracture      in alloy
                                                      in alloy     3 modified
                                                                3 modified     (impact
                                                                            (impact    energy
                                                                                    energy 8.828.82
                                                                                                 J). J).

     Figure 11. SEM images of fracture surfaces in impact specimens. (A): A brittle fracture in alloy 4 modified (impact energy
      Figure
      Figure   11. SEM
                   SEM
               11. A    images
                        images   of
                                 of fracture
                                    fracture  surfaces
                                              surfaces in
                                                       in impact
                                                          impact specimens.
                                                                 specimens. (A): A
                                                                                 A brittle
                                                                            (A):J). brittle fracture
                                                                                            fracture in
                                                                                                     in alloy
                                                                                                        alloy 44 modified
                                                                                                                 modified (impact
                                                                                                                          (impact energy
                                                                                                                                  energy
     3.17 J). (B):   ductile fracture  in alloy 3 modified  (impact energy 8.82
      3.17 J). (B): A ductile fracture in alloy 3 modified (impact energy 8.82 J).
      3.17 J). (B): A ductile fracture in alloy 3 modified (impact energy 8.82 J).
                                          In
                                           In alloy
                                                alloy121,1,after
                                                            afterSr Sr modification, an         anSDAS       reduction of  of34%,
                                                                                                                               34%,aaparticle     size  reduction
                                           Figure          shows      themodification,
                                                                          impact specimens’         SDASedgereduction
                                                                                                                for each composition     particle  sizeParticularly,
                                                                                                                                            studied.     reduction
                                   of
                                    of about
                                        about    40%,
                                                  40%,    reduction
                                                           reduction      through
                                                                           through        the
                                                                                           the  fragmentation
                                                                                                 fragmentation       process
                                                                                                                      process   of
                                                                                                                                 of β-Fe
                                                                                                                                     β-Fe  intermetallic,
                                                                                                                                            intermetallic,   and
                                                                                                                                                              andaa
                                     cracks on the edge of the samples and absorbed energies were documented and related
                                   slight
                                    slight  increase
                                              increase     in    micro-hardness
                                                             in micro-hardness              from    91.3
                                                                                             from 91.3 to   to  96  HV0.5
                                                                                                                 96 HV0.5    (average
                                                                                                                              (average     values)
                                                                                                                                            values)  were
                                                                                                                                                      were   docu-
                                                                                                                                                              docu-
                                    with the      microstructural          behaviors previously              measured:     SDAS,      eutectic  particle  size,  and
                                   mented.
                                    mented.      SDAS
                                                  SDAS     reduction
                                                            reduction      affects
                                                                            affects   the    alloy’s   mechanical
                                                                                                        mechanical resistance and the particle sizere-
                                                                                                                        resistance     and  the  particle  size
                                     intermetallic       phases      (α-Fe,    β-Fe, theandalloy’s
                                                                                                Fe-Mg).                                                            re-
                                   duction
                                    duction     influences the         rupture       behavior      by
                                                                                                    byfostering      the
                                                                                                                      theductile     fracture
                                                                                                                                      fracturewhile     the
                                                                                                                                                         the1modi-
                                           As influences
                                                  noticeable the        rupture12,
                                                                   in Figure          behavior
                                                                                          the edges      fostering
                                                                                                         of the impact     ductile
                                                                                                                            test specimen        while
                                                                                                                                                 of alloy     modi-
                                                                                                                                                               show
                                   fication
                                    fication   occurred. In       this   sense,     the
                                                                                     themodification,          along
                                                                                                                alongwith
                                                                                                                       withthe    β-Fe
                                                                                                                                   β-Fefragmentation,        seems
                                     differentoccurred.
                                                   features.InIn    this  sense,
                                                                        the   unmodified   modification,
                                                                                                   alloy sample,       many   the
                                                                                                                                cracks    fragmentation,
                                                                                                                                          were   detected, seems
                                                                                                                                                              while
                                   to
                                    to limit   the   presence       of  cracks.      Consequently,         the   average   absorbed      energy   increases.
                                     thelimit   the presence
                                          modified                   of cracks.
                                                          alloy showed               Consequently,
                                                                                 a limited       numberthe        average These
                                                                                                              of defects.   absorbed      energy
                                                                                                                                     defects   are increases.
                                                                                                                                                    related to the
                                          As
                                           As regards
                                                 regards      alloy
                                                               alloy2,2,aa similar
                                                                               similar trendtrend totoalloy
                                                                                                        alloy11 waswas highlighted.
                                                                                                                          highlighted. SDAS SDAS decreased
                                                                                                                                                    decreasedby    by
                                     specimen’s       microstructure.
                                   16%,
                                    16%, Inthe    eutectic
                                            thealloy
                                                   eutectic     particle
                                                                 particle   size     by
                                                                              size by 70%, 70%,    and    the   Fe-Mg    intermetallic-occupied          area   was
                                                         1, after    Sr modification,           an and
                                                                                                    SDAS   the   Fe-Mg intermetallic-occupied
                                                                                                              reduction                                   area was
                                                                                                                           of 34%, a particle size reduction
                                   halved
                                    halved    after
                                                after Sr
                                                       Sraddition.
                                                            addition.The   The    impact
                                                                                   impact      specimen's edge        resulted    with   few cracks
                                                                                                                                                cracksin inthe   un-
                                     of about      40%,    reduction       through         thespecimen's
                                                                                                 fragmentation  edgeprocess
                                                                                                                       resultedof  with
                                                                                                                                     β-Fefewintermetallic,  the
                                                                                                                                                              and un-a
                                   modified
                                    modified      composition,
                                                   composition,        while     no   cracks
                                                                         while no cracks          were
                                                                                                  were   detected     in the  samples     made    with   modified
                                     slight increase       in micro-hardness             from 91.3     to detected
                                                                                                           96 HV0.5in(average
                                                                                                                          the samples
                                                                                                                                    values)made
                                                                                                                                              were with   modified
                                                                                                                                                     documented.
                                   alloy.
                                     SDASIn
                                    alloy.   In  alloy
                                                  alloy3,3,decreases
                                               reduction       decreases
                                                                affects the   in   SDAS
                                                                               inalloy’s      (8%)
                                                                                               (8%)and
                                                                                    SDASmechanical    andthe the eutectic
                                                                                                                  eutecticparticle
                                                                                                               resistance          thesize
                                                                                                                            particle
                                                                                                                            and         size(of
                                                                                                                                              (of86%)
                                                                                                                                        particle  86%)   were
                                                                                                                                                          wereno-
                                                                                                                                                   size reduction no-
                                   ticed,
                                    ticed, but
                                     influences   the
                                            but the    intermetallic
                                                     the    rupture behavior
                                                         intermetallic      phase-occupied
                                                                                         by fostering
                                                                             phase-occupied           areas
                                                                                                       areas   remained
                                                                                                             theremained   constant.
                                                                                                                  ductile fracture
                                                                                                                            constant.    As
                                                                                                                                        whileβ-Fe  promotes
                                                                                                                                                the promotes
                                                                                                                                          As β-Fe    modificationthe
                                                                                                                                                                  the
                                   fragile   fracture,
                                     occurred.      In this  its short
                                                               sense,     fragmentation
                                                                         the   modification,       probably
                                                                                                    along        affects
                                                                                                              with  the   the
                                                                                                                         β-Fe
                                    fragile fracture, its short fragmentation probably affects the absorbed energy, hindering   absorbed     energy,
                                                                                                                                fragmentation,          hindering
                                                                                                                                                    seems   to  limit
                                   its
                                     theincrease.
                                    its   presenceCracks
                                         increase.       of cracks.
                                                       Cracks      detected       inin the
                                                                         Consequently,
                                                                    detected            the modified
                                                                                                 the average
                                                                                               modified      and   unmodified
                                                                                                              andabsorbed
                                                                                                                    unmodified      specimens
                                                                                                                               energy             are
                                                                                                                                         increases.
                                                                                                                                     specimens     are similar
                                                                                                                                                         similar in in
                                   number        and   extent.      Since    this    composition         has   few   alloying
                                    number and extent. Since this composition has few alloying elements, the intermetallic       elements,     the  intermetallic
                                   phases
                                    phaseshave  haveless
                                                       lessinfluence
                                                               influenceon    onimpact
                                                                                    impactenergyenergyin   inboth
                                                                                                               bothcases.
                                                                                                                     cases.
You can also read