Effects of Multi-Component Backgrounds of Volatile Plant Compounds on Moth Pheromone Perception - MDPI
←
→
Page content transcription
If your browser does not render page correctly, please read the page content below
insects
Article
Effects of Multi-Component Backgrounds of Volatile Plant
Compounds on Moth Pheromone Perception
Lucie Conchou, Philippe Lucas, Nina Deisig                        , Elodie Demondion             and Michel Renou *

                                          Institute of Ecology and Environmental Sciences of Paris, iEES-Paris, INRAE, Sorbonne Université, CNRS, IRD,
                                          UPEC, Université Paris Diderot, 78026 Versailles, France; lucie@agriodor.com (L.C.); philippe.lucas@inrae.fr (P.L.);
                                          ndeisig@uni-koeln.de (N.D.); elodie.demondion@inrae.fr (E.D.)
                                          * Correspondence: mzichel.renou@inrae.fr

                                          Simple Summary: It is well acknowledged that some of the volatile plant compounds (VPC) naturally
                                          present in insect natural habitats alter the perception of their own pheromone when presented
                                          individually as a background to pheromone. However, the effects of mixing VPCs as they appear
                                          to insects in natural olfactory landscapes are poorly understood. We measured the activity of brain
                                          neurons and neurons that detect a sex pheromone component in a moth antenna, while exposed to
                                          simple or composite backgrounds of VPCs representative of the odorant variety encountered by this
                                          moth. Maps of activities were built using calcium imaging to visualize which brain areas were most
                                          affected by VPCs. In the antenna, we observed differences in VPC capacity to elicit firing response
                                          that cannot be explained by differences in stimulus intensities because we adjusted concentrations
                                          according to volatility. The neuronal network, which reformats the input from antenna neurons in
                                the brain, did not improve pheromone salience. We postulate that moth olfactory system evolved

                                          to increase sensitivity and encode fast changes of concentration at some cost for signal extraction.
Citation: Conchou, L.; Lucas, P.;         Comparing blends to single compounds indicated that a blend shows the activity of its most active
Deisig, N.; Demondion, E.; Renou, M.      component, VPC salience seems more important than background complexity.
Effects of Multi-Component
Backgrounds of Volatile Plant             Abstract: The volatile plant compounds (VPC) alter pheromone perception by insects but mixture
Compounds on Moth Pheromone
                                          effects inside insect olfactory landscapes are poorly understood. We measured the activity of receptor
Perception. Insects 2021, 12, 409.
                                          neurons tuned to Z7-12Ac (Z7-ORN), a pheromone component, in the antenna and central neurons
https://doi.org/10.3390/
                                          in male Agrotis ipsilon while exposed to simple or composite backgrounds of a panel of VPCs
insects12050409
                                          representative of the odorant variety encountered by a moth. Maps of activities were built using
Academic Editor: Ezio Peri
                                          calcium imaging to visualize which areas in antennal lobes (AL) were affected by VPCs. We compared
                                          the VPC activity and their impact as backgrounds at antenna and AL levels, individually or in blends.
Received: 2 April 2021                    At periphery, VPCs showed differences in their capacity to elicit Z7-ORN firing response that cannot
Accepted: 30 April 2021                   be explained by differences in stimulus intensities because we adjusted concentrations according
Published: 1 May 2021                     to vapor pressures. The AL neuronal network, which reformats the ORN input, did not improve
                                          pheromone salience. We postulate that the AL network evolved to increase sensitivity and to encode
Publisher’s Note: MDPI stays neutral      for fast changes of pheromone at some cost for signal extraction. Comparing blends to single
with regard to jurisdictional claims in   compounds indicated that a blend shows the activity of its most active component. VPC salience
published maps and institutional affil-   seems to be more important than background complexity.
iations.

                                          Keywords: pheromone; plant volatile compounds; odor background; olfactory neuron; olfactory
                                          coding; odorscape; moth

Copyright: © 2021 by the authors.
Licensee MDPI, Basel, Switzerland.
This article is an open access article    1. Introduction
distributed under the terms and
                                               Olfactory communication is essential to insects as it is involved in the identification
conditions of the Creative Commons
                                          and the location of vital resources such as a food source, a mate, or an oviposition site.
Attribution (CC BY) license (https://
creativecommons.org/licenses/by/
                                          Insects have developed an exquisite olfactory sense in terms of sensitivity, specificity, and
4.0/).
                                          temporal dynamics. Their olfactory system enables them to discriminate the pheromones

Insects 2021, 12, 409. https://doi.org/10.3390/insects12050409                                                    https://www.mdpi.com/journal/insects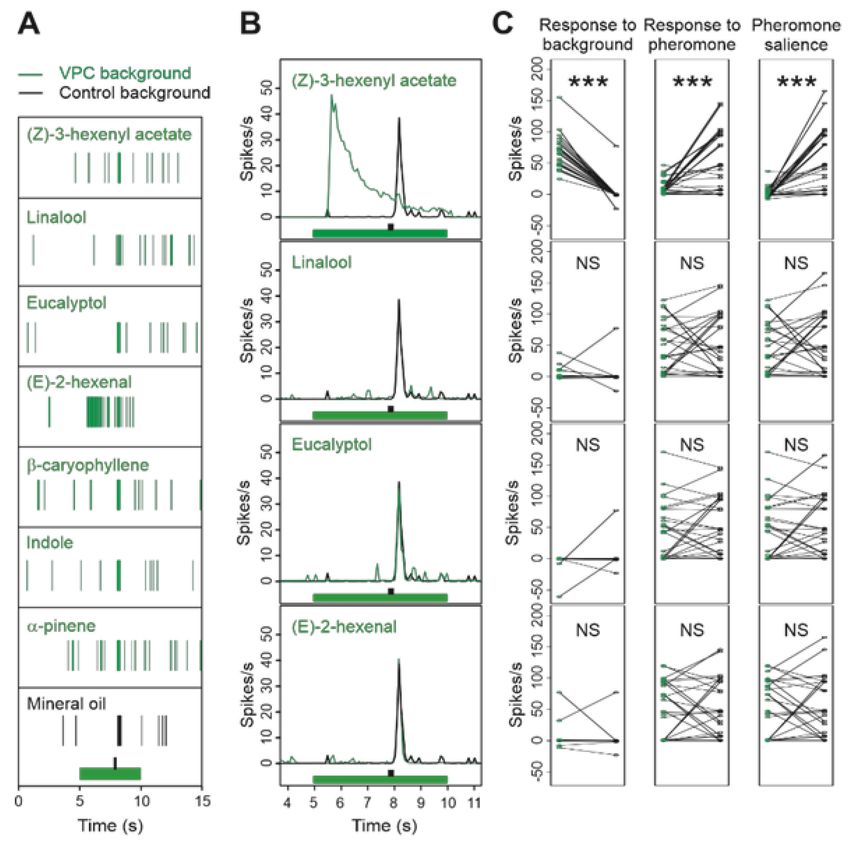
Insects 2021, 12, 409                                                                                             2 of 25

                        they produce, as well as the odors involved in interspecific interactions, such as, for instance,
                        the floral compounds emitted by plants to attract specialist pollinators. Herbivorous
                        species, for instance, can discriminate potential host-plant species based on their volatile
                        emissions [1]. Exchanges of chemical information are thus not only vital to insects, but
                        also essential to the functioning of the species network composing a community [2]. Once
                        released in the atmosphere, these ecologically relevant signals and cues are transported by
                        airflows, diluted, and mixed to a background of other volatile organic compounds to form
                        a complex and changing olfactory landscape [3]. Considering the hundreds of different
                        volatile compounds released by plants (VPC) [4,5], the capacity of the insect olfactory
                        system to extract the ecologically relevant information from that very complex chemical
                        environment is remarkable [6,7].
                              Insect olfactory systems evolved to deal with such complex olfactory landscapes [8].
                        Male moths for instance are able to detect from hundreds of meters the odor plume
                        generated by a female emitting its sex pheromone and to navigate upwind toward the
                        calling female. Female moths release a few ng per hour of a specific pheromone blend,
                        which represent only traces compared to the ppb of VPCs present in the atmosphere [9,10].
                        In the male antennae, narrowly tuned olfactory receptors (OR) expressed in olfactory
                        receptor neurons (ORN) specifically bind the pheromone components [11,12] ensuring
                        detection selectivity. The antennae house thousands of ORNs each of them expressing one
                        functional type of OR specialized in the detection of one pheromone component (Ph-ORN).
                        Beside quality, the firing activities of Ph-ORNs also encode the intensity of the stimulus.
                        Ph-ORNs converge onto a comparatively small number of central neurons in a specialized
                        area of the antennal lobes (AL), the macro-glomerular complex (MGC) [13]. Because of this
                        convergence, the projection neurons (PN) in the MGC display a remarkably low response
                        threshold [14–16]. Male moths not only discriminate the pheromone components, but also
                        show ratio selectivity [17] which increases the specificity of pheromone communication.
                        Blend ratio coding starts in the MGC, some MGC neurons responding more to blend of
                        pheromone components than individual components [18,19]. Additionally, fast fluctuations
                        of pheromone concentration are tracked by the ORN and MGC-neurons firing [20–23].
                              Odors within the habitat, and most specifically the volatile emissions from host-plants,
                        affect moth behavioral responses to pheromone. Host plant volatiles, for instance, reduce
                        the responses of Spodoptera littoralis males to deficient or heterospecific pheromone signals
                        in a wind tunnel [24]. Plant and pheromone signals are processed by two anatomically
                        distinct olfactory sub-systems, MGC and ordinary glomeruli (OG), but paired stimulations
                        with a VPC and pheromone suppress responses in both MGC and OGs, indicating that both
                        stimuli are not integrated independently [25]. Interactions can take place at the detection
                        level and single VPCs modulate pheromone responses in male moths when presented
                        together with pheromone. Effects on pheromone detection vary according to moth species
                        and VPCs. Linalool and (Z)-3-hexenol synergize the responses of the Ph-ORNs of Heliothis
                        zea to its pheromone [26]. Heptanal, a major component of the floral aroma of linden,
                        activates Ph-ORNs of the noctuid moth Agrotis ipsilon [27]. However, other investiga-
                        tions report antagonistic interactions. Linalool decreases the responses of Ph-ORNs to
                        pheromone compounds in S. littoralis [28]. A background of VPCs also modulates the firing
                        of MGC neurons masking the response to pheromone [29]. Activity maps obtained by
                        calcium imaging revealed intense MGC response to VPCs and various modes of interac-
                        tions between pheromone and VPCs when they are presented together [30]. Interestingly,
                        heptanal modified the multiphasic response-pattern of MGC-neurons to pheromone, de-
                        creased the response, but improved their capacity to encode pulsed stimuli [31,32]. The
                        response to the pheromone component codlemone was suppressed in some AL neurons
                        of male codling moths [33]. There is also evidence that some interactions take place at
                        the OR level. Competitive fluorescence binding assays confirmed that plant odorants
                        compete with the natural pheromone component, Z11 hexadecenal, for binding on HR13,
                        a pheromone receptor of Heliothis virescens males [34]. A sex pheromone receptor of the
                        codling moth, Cydia pomonella, also binds the plant volatile pear ester [35].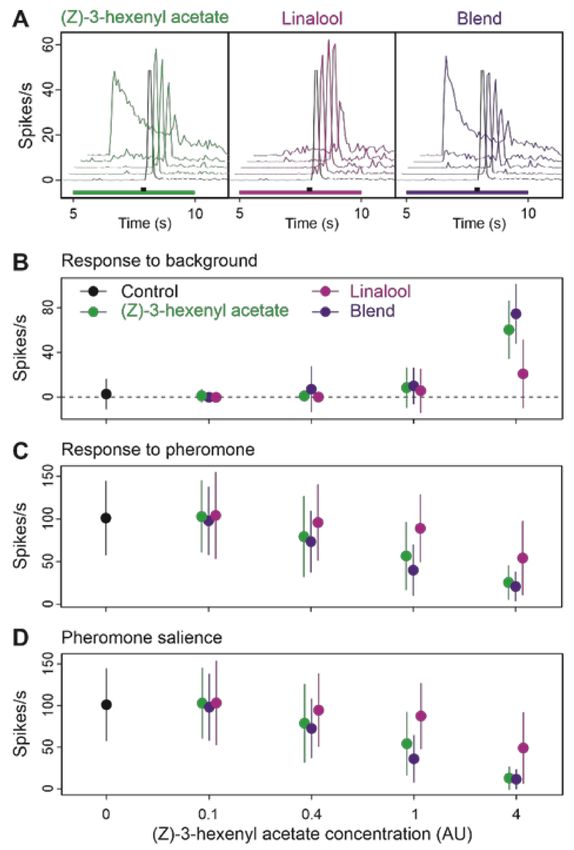
Insects 2021, 12, 409                                                                                          3 of 25

                              The ecological importance of VPC-pheromone interactions in natural conditions was
                        recently questioned [36] because, although pheromone attraction of H. virescens males was
                        significantly impaired in a concentration-dependent manner after adding single VPCs,
                        their pheromone-guided flight behavior was not influenced by the natural emissions
                        of host-plants in a wind tunnel. Badeke et al [36] concluded that the pheromone-VPC
                        interactions only occur at supra-natural concentrations of VPCs. However, natural odor
                        backgrounds are made of dozens of different compounds released by communities of host
                        or non-host plants whose effects on pheromone communication could combine each to
                        other. Furthermore, insect olfactory communication is now challenged by very fast and
                        intense changes in VPC quality and concentrations notably due to the profound changes
                        in land use and because plant metabolism is sensitive to global warming and increasing
                        concentrations of CO2 and O3 , which modifies the amounts of VPCs they release in the
                        atmosphere [37,38]. Due to these changes in the olfactory landscapes in which insects
                        live, it becomes crucial to better understand how multi-component olfactory backgrounds
                        impact insect communication. Because of the preeminent role of sex pheromones in insect
                        reproduction, pheromone-VPC interactions are a good model to address these questions.
                              The present research aimed to investigate the effects of multi-component VPC back-
                        grounds on pheromone perception in the moth Agrotis ipsilon (Hufnagel). The black
                        cutworm, A. ipsilon, is a polyphagous and cosmopolitan moth belonging to the Noctuidae
                        family that causes economic losses to many crops around the world. As in most moth
                        species, pheromone communication is crucial for A. ipsilon mating, but males also rely
                        on plant volatiles as food cues [39,40]. A. ipsilon has become a model species for study-
                        ing the processing of pheromone and plant signals and their interaction at neuronal and
                        behavioral levels [30,32,41]. Thus, this moth offers well-studied behavioral and physiologi-
                        cal backgrounds to study the processing of plant-pheromone mixtures. The pheromone
                        blend released by female A. ipsilon consists of three main components: cis-7-dodecenyl
                        acetate (Z7-12:Ac), cis-9-tetradecenyl acetate (Z9-14:Ac), and cis-11-hexadecenyl acetate
                        (Z11-16:Ac) [41–43]. Three functional types of pheromone sensitive ORNs (Ph-ORNs),
                        each specifically tuned to either Z7-12:Ac, Z9-14:Ac, or Z11-16:Ac, have been identified in
                        male antennae [44,45]. Previous investigations of their distribution along the antenna have
                        shown that trichoid sensilla of the antennal branches house almost exclusively Ph-ORNs
                        tuned to Z7-12:Ac (Z7-ORN). Z9-14:Ac-tuned ORNs (Z9-ORN) are less numerous and
                        found only at branch tips [44]. Only two out of a sample of 100 neurons were found to
                        respond to Z11-16:Ac [15]. A 3D glomerular atlas of the male antennal lobes has been
                        established [46]. We used extracellular electrophysiology and calcium imaging to measure
                        the responses of Z7- and MGC-neurons to the sex pheromone in simple or composite
                        backgrounds of VPCs. Maps of activities were built using calcium imaging to visualize
                        which VPCs activated areas in moth antennal lobes. To stimulate the moth antennae, we
                        used a protocol that approximates the expected natural olfactory landscape in which a
                        pheromone puff must be detected against a more diffuse odor background [27,29]. Ac-
                        cordingly, short pheromone puffs were delivered over long-lasting VPC backgrounds. We
                        chose a panel of VPCs with different chemical structures and physicochemical properties
                        representative of the odorant variety encountered by a moth searching for a mate. We first
                        clarified the dose-response effects using single VPCs to create the background. A significant
                        effort was paid to improve the control of stimulus intensity and to establish dose-response
                        relationships. We evaluated the intrinsic activity for each VPC and determined their type
                        of interaction with pheromone. We compared impact of VPC background at antennal and
                        AL levels. Then, we prepared binary, ternary, and quaternary blends of VPCs to investigate
                        interactions between VPCs and to determine whether properties of the blend could be
                        deduced from the properties of single VPCs. Our data confirm that common VPCs interfere
                        with the moth pheromone system in a dose-dependent manner. Activity varies among
                        VPCs. The activity of a blend reproduces that of the most active component with only few
                        interactions between components. We believe our data will contribute to better evaluate
                        the vulnerability of insect olfaction to the ongoing changes in their olfactory landscapes.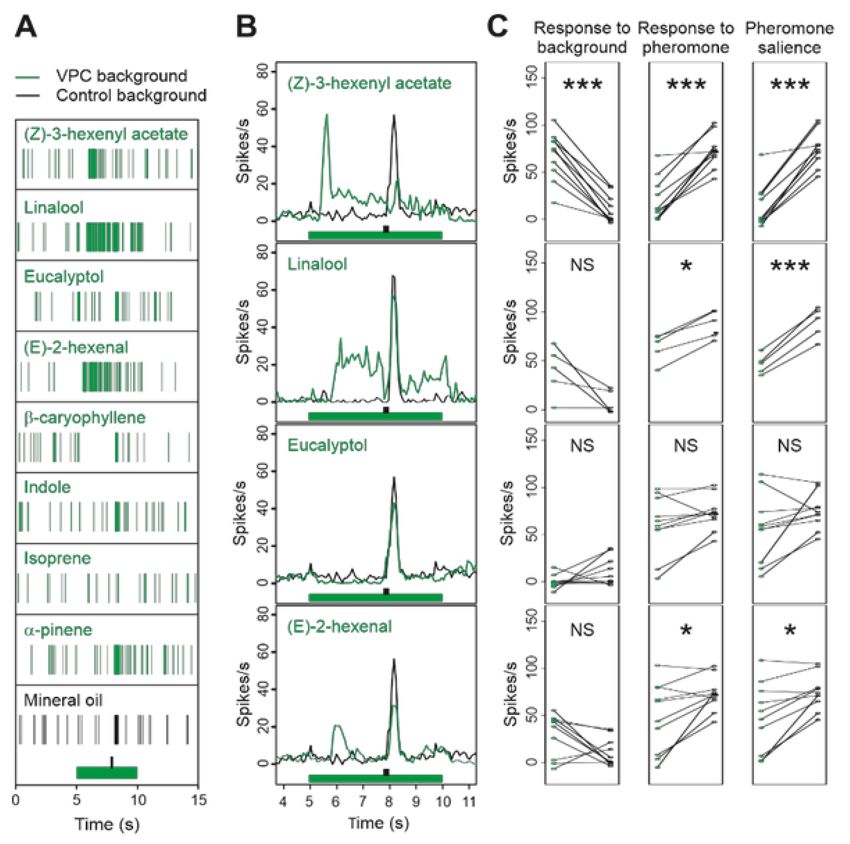
Insects 2021, 12, 409                                                                                        4 of 25

                        2. Materials and Methods
                        2.1. Insects
                              A. ipsilon adult males were obtained from a laboratory stock. Larvae were fed on an
                        artificial diet [47]. Pupae were sexed and males were kept separately from females in an
                        inversed light–dark cycle (16 h:8 h light:dark photoperiod) at 22 ◦ C. This ensured that
                        the males were virgin and had never been in contact with pheromone before experiments.
                        Newly emerged males were collected every day and were given access to a 20% sucrose
                        solution ad libitum. Day of emergence was considered as day-0. Males were aged of four
                        days at experiment time. Experiments were performed during scotophase hours but under
                        day light.

                        2.2. Chemicals
                             The pheromone component Z7-12Ac (CAS 14959-86-5), was purchased from Pher-
                        obank (purity > 99%). Based on the literature, we selected eight VPCs with different
                        chemical structures and physicochemical properties to be representative of the variety of
                        odorants that can be encountered by a male moth searching for a mate in an agricultural
                        landscape in mainland France. The monoterpene linalool, the aromatic heterocyclic indole,
                        and the bicyclic sesquiterpene β-caryophyllene have been identified in constitutive and
                        herbivore-induced emissions of Zea mais, one of the host crop plants of A. ipsilon [48].
                        α-pinene is a common monoterpene, emitted by oak and other perennial species that grow
                        on field edges [49]. The unsaturated hydrocarbon isoprene is one of the most abundant
                        VPC in the atmosphere [50]; it is released among others by poplars planted to create wind-
                        break hedges or for wood production [51]. (Z)-3-hexenyl acetate and (E)-2-hexenal are
                        green leaf volatiles (GLV) produced by numerous plant species in response to biotic or
                        abiotic stress [52]. Eucalyptol is a cyclic monoterpene released by flowering weeds, among
                        which Artemisia annua, a common weed in maize fields [53]. VPCs were diluted in light
                        mineral oil (CAS 8042-47-5). VPC synthetic standards (Table S1) and mineral oil were
                        obtained from Sigma–Aldrich (Saint Louis, MO, USA).

                        2.3. Odor Stimulus Delivery
                             The stimulus delivering device consisted of an ensemble of electrovalves enabling to
                        deliver VPCs from separate sources in the main air stream of a glass tube (length 200 mm,
                        inner diameter 9 mm) whose distal end was positioned 20 mm from the insect antenna,
                        while the pheromone stimuli were delivered through a lateral input (Figure S1). Air was
                        charcoal-filtered and humidified.
                             Pheromone stimuli were delivered as air puff (167 mL/min) through a Pasteur pipette
                        containing a piece of filter paper loaded with 10 ng (unless mentioned) of Z7-12:Ac diluted
                        in 1 µL of hexane. Hexane was left to evaporate for 30 s before inserting the pheromone-
                        loaded paper into the pipette. Air passage through the pipette was commanded by an
                        electrovalve (LHDA1233215H, The Lee Company, Westbrook, ME, USA). The pipette tip
                        was inserted into a hole on the side of the glass tube, 150 mm upstream of its distal end.
                             VPC sources consisted of 4 mL glass vials containing 1 mL of a single VPC diluted
                        in mineral oil, or mineral oil only (control). The air stream was divided into 8 parallel
                        flows (200 mL/min each) with an airflow divider (LFMX0510528B, The Lee Company),
                        each of which directed towards a 3-way electrovalve (LHDA1223111H, The Lee Company).
                        Normally opened (NO, non-odorized) and normally closed (NC, odorized) exits of the
                        eight valves were connected either to empty vials or to VPC source vials, respectively.
                        All outlets of odorized and non-odorized vials were connected to the proximal end of
                        the glass tube. Thus, valve opening did not modify the total airflow received by the
                        antenna (1.6 L/min). All tubing downstream from the valves was made of Teflon (internal
                        diameter 1.32 mm). Vials were connected to the tubing with stainless steel hypodermic
                        needles inserted through a Teflon septum. For delivering single VPCs, the Teflon tubes at
                        vial outlet were directly connected to the main glass tube (Figure S1A). VPC mixing was
                        achieved by opening several valves simultaneously and mixing odorized airflows in a low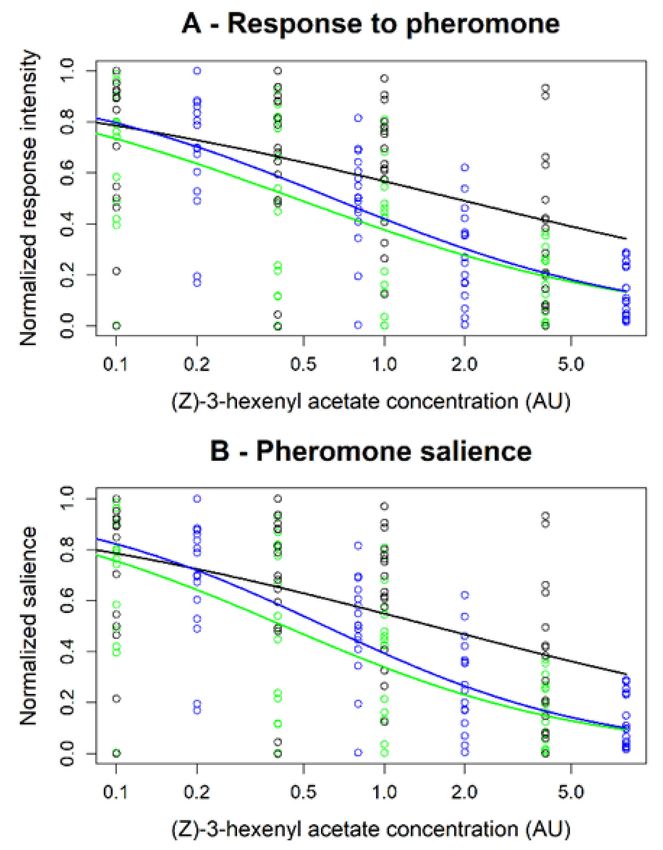
Insects 2021, 12, 409                                                                                                    5 of 25

                        dead-volume manifold (MPP-8, Warner Instruments, Figure S1B). For each of the 8 valves,
                        the NO and the NC exits were connected together before entering one of the 8 manifold
                        inlets. Temperature in the experimental rooms was regulated at 21–23 ◦ C. The VPC and
                        pheromone sources were allowed to equilibrate at the temperature of the rooms in which
                        the experiments were carried out.

                        2.4. Odor Stimuli
                             Stimulation sequences consisted of a short pheromone puff delivered in the middle
                        of a 5 s VPC background presentation (Figure 1). For electrophysiological recordings,
                        the pheromone puff lasted 200 ms and started 2.8 s after background onset (Figure 1).
                        For calcium imaging, the slow response dynamics of the fluorescence signal required to
                        adapt stimulus duration. The pheromone puff lasted 1 s and started 2 s after background
                        onset. Successive stimuli on the same preparation were separated by 30 s (antennal lobe
                        recordings) or 60 s (single sensillum recordings and calcium imaging). Valve opening and
                        closing sequences were computer-controlled with millisecond accuracy. The VPC were
                        presented in random order, except for calcium imaging. In calcium imaging, stimuli with
                        VPCs as a background to pheromone were alternated with stimuli with VPCs alone.

                        Figure 1. Stimulation protocol for electrophysiological experiments on Z7-ORNs and MGC-neurons.
                        Black and green boxes indicate, respectively, the delivery of the background (VPC in mineral oil or pure
                        mineral oil) and the pheromone compound Z7-12:Ac on the moth antenna. TW1 to TW4: limits of the
                        time windows used to measure spontaneous activity (TW1), firing response to background (TW2), firing
                        activity immediately before pheromone stimulus (TW3) and response to Z7-12:Ac (TW4).

                             First, we evaluated the effects of single VPCs. Linalool, whose ability to activate the
                        MGC-neurons of A. ipsilon had been already demonstrated [29], was used to establish the
                        dose used for all VPCs of the panel. We first measured the activity of different dilutions of
                        linalool on MGC-neurons, showing that a dilution of 1% triggered a clear firing activity. We
                        adjusted dilutions of the other VPCs in function of their differences of volatility according
                        to procedures proposed by Munch et al. [54] based on data from [55] (Table S1). The same
                        dilutions were used for the sources of background in electrophysiological and Calcium
                        imaging experiments.
                             Then, the effects of binary blends of VPCs and their components alone were tested at
                        4 concentrations each, while the pheromone dose was kept constant. In order to control
                        precisely the ratios in the background, we measured their air–mineral oil partition coeffi-
                        cients (Khl , Table S1) and used them to calculate the mineral oil concentration (Cl ) necessary
                        to obtain the desired concentration in the headspace (Ch ) of a closed, equilibrated source:

                                                                   Ch = Khl ∗ Cl                                            (1)

                              Partition coefficients Khl were measured by injecting the headspace of closed equili-
                        brated sources containing known concentrations of VPCs into a calibrated GC-FID. When
                        an airflow passes through such a source, the concentration in the headspace drops to a
                        fraction of the initial concentration and then reaches a steady state until the source starts
                        to exhaust. Therefore, odorant concentration delivered from the source is related to the
                        initial concentration inside the closed equilibrated source by a dilution factor that does not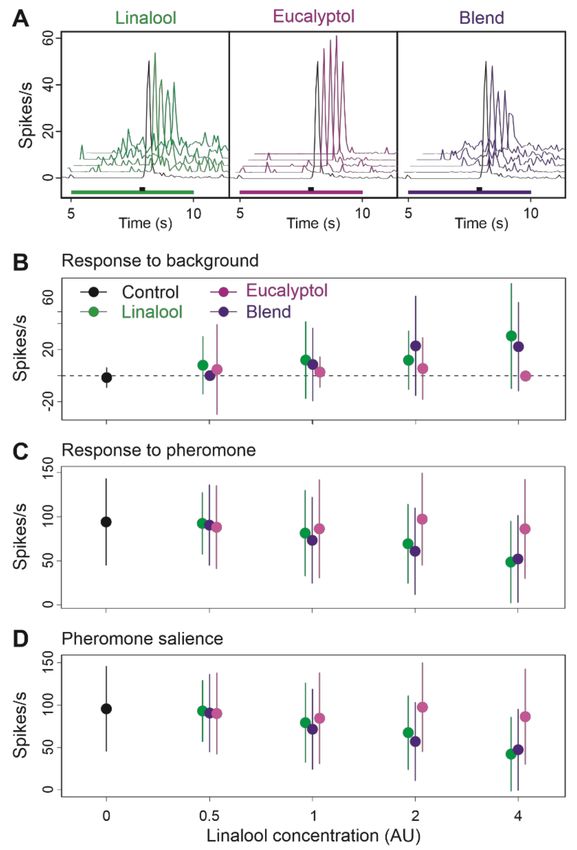
Insects 2021, 12, 409                                                                                       6 of 25

                        depend on the odorant. Assuming that this proportionality remains true for the concentra-
                        tions delivered on the antenna (i.e., no bias induced by differential adsorption on tubing
                        walls), we expressed all delivered VPC concentrations relative to an arbitrary unit (AU)
                        where one AU was defined as the molar concentration delivered on the antenna from a
                        source containing 1% linalool in mineral oil.
                              Binary blends were obtained by opening simultaneously the valves controlling the
                        airflow through the sources containing the single VPCs to be blended while closing a
                        compensation flow. Therefore, if the concentrations of blend components, when tested
                        separately, are noted A and B, the blend was tested at the concentration A + B. The
                        order of presentation of individual VPCs and of their combination was randomized. For
                        each background type, 4 successive stimuli were presented at increasing concentration.
                        A pheromone puff with no background was presented as a control at the beginning of
                        the recording and after the highest concentration of each background type. We verified
                        with a photoionization detector (PID; Aurora Scientific Inc, Aurora, Canada) that the
                        concentration of VPC did not vary depending on whether it was delivered alone or in
                        a multicomponent blend, as well as along successive stimuli separated by 5 or 10 min,
                        with the exception of the very first stimulus (Figure S2). Experiments began by ejecting a
                        VPC stimulus from all sources away from the recorded antenna. Then, the glass tube was
                        focalized on the antenna and intervals between successive openings of the same VPC valve
                        were always 5 or 10 min.
                              Finally, we tested blends of 3 or 4 VPCs as backgrounds to the pheromone stimulus.
                        We alternated presentation of these complex backgrounds with backgrounds consisting in
                        a single VPC or a binary blend of its components. Each of these 2 composite backgrounds
                        and the corresponding simple backgrounds were presented twice to each neuron in random
                        order. Control stimuli (pheromone without background) were presented at the beginning
                        of each recording and after each pair of composite and simple background stimuli.

                        2.5. Electrophysiology
                             For single sensillum recordings, male moths were briefly anesthetized with CO2
                        and restrained in a Styrofoam holder. One antenna was immobilized with adhesive tape.
                        A tungsten electrode was inserted into the antenna to serve as a reference. We targeted
                        the ORNs tuned to the pheromone constituent Z7-12:Ac (Z7-ORN) which are housed in
                        the long trichoid sensilla located along antennal branches. The recording electrode was,
                        therefore, inserted at the base of one of these sensilla.
                             For extracellular recordings from MGC-neurons, male moths were restrained in a cut
                        pipette tip, leaving the head exposed, and immobilized with dental wax. The head capsule
                        was opened, and the brain exposed by removing all muscles and mouthparts above it. The
                        neurolemma was carefully removed from the antennal lobe in order to allow electrode
                        penetration. The recording electrode was made from a glass micropipette whose tip was
                        manually broken to a diameter of 2 µm and filled with (in mM): NaCl 150, KCl 4, CaCl2
                        6, MgCl2 2, Hepes 10, Glucose 5 (pH 7.2, osmotic pressure 360 mOsm/L adjusted with
                        mannitol). The preparation was constantly perfused with this solution once the brain
                        capsule was opened. The reference electrode was a silver wire inserted at the rear of the
                        head capsule in contact with brain tissues. The recording electrode was slowly inserted
                        inside the MGC until the appearance of a clear single-unit firing activity. Extracellular
                        recordings from A. ipsilon AL sample only neurons with a large neurite [16] so we expected
                        to record mainly projection neurons (PN) rather that local interneurons (LN). Recordings
                        were done using a CyberAmp 320 controlled by pCLAMP10 (Molecular Devices, San Jose,
                        CA, USA). The biological signal was amplified (×2000), band-pass filtered (1–3000 Hz) and
                        sampled at 10 kHz with a Digidata 1440A acquisition board (Molecular Devices). Spikes
                        were sorted using Spike 2 software (CED, Oxford, UK).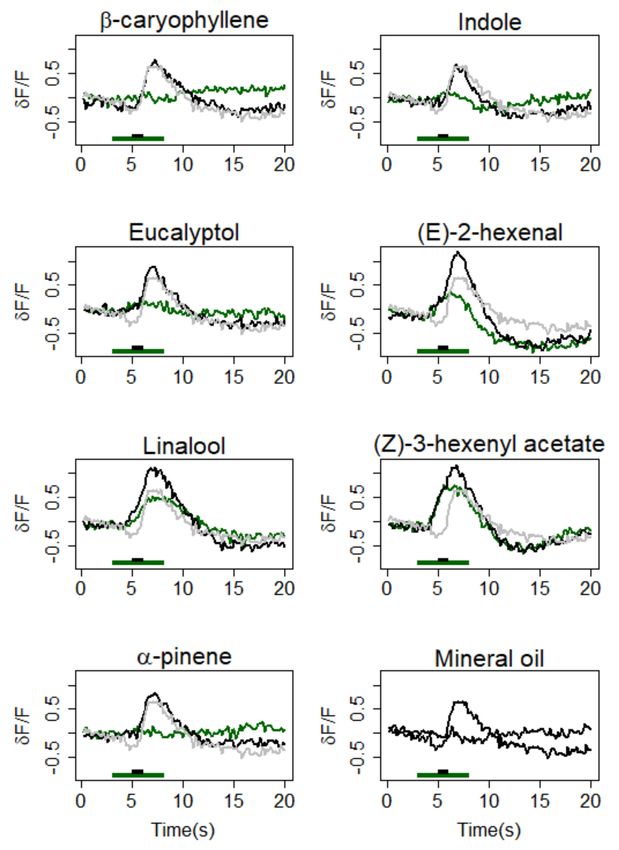
Insects 2021, 12, 409                                                                                          7 of 25

                        2.6. Calcium Imaging in Antennal Lobes
                              Male moths were restrained in a Plexiglas chamber and the head was fixed. The head
                        was opened and muscles and mouthparts removed to gain access to the brain. Then, 20 µL
                        of a dye solution (50 µg Calcium Green 2-AM dissolved with 50 mL Pluronic F-127, 20%
                        in dimethylsulfoxide, Molecular Probes, Eugene, OR, USA) was bath-applied for at least
                        1 h, before being washed with Ringer. For recordings, a T.I.L.L. Photonics imaging system
                        (Martinsried, Germany) was coupled to an epifluorescent microscope (BX-51WI, Olympus,
                        Hamburg, Germany) equipped with a 10× (NA 0.3) water immersion objective. Signals
                        were recorded using a 640 × 480 pixel 12-bit monochrome CCD camera (T.I.L.L. Imago,
                        cooled to −12 ◦ C). The acquisition rate was set at 5 frames/s with an acquisition time of
                        15 ms. Identification of individual glomeruli was done by superposing activity maps using
                        Adobe Photoshop (Version CS2). We chose not to include isoprene in calcium imaging
                        experiments due to the limited number of channels available in the odor stimulation device.
                              Raw data analysis was done using custom–made software written in IDL (Research
                        Systems Inc., Boulder, CO, USA) and Visual Basic (Microsoft Excel). After noise filtering and
                        bleaching correction, relative fluorescence changes (δF/F) were calculated as (F − F0 )/F0
                        (where F0 = reference background). For each glomerulus, the time course of δF/F was
                        calculated by averaging 25 pixels (5 × 5) at the center of each glomerulus.

                        2.7. Analysis of Electrophysiological Data
                              Analysis of firing activity was performed using custom programs developed under
                        R [56]. An instantaneous firing rate metric [57] was used to draw peri-stimulus firing
                        curves. For each individual recording, a firing rate was calculated for every spike using the
                        two preceding and two following spikes. Then, we calculated the average firing rates over
                        successive 75 ms-long time bin in each recording. Individual neuron firing rates/bin were
                        finally averaged over all sampled neurons to draw peri-stimulus curves.
                              We calculated the maximum firing frequency within four time-windows (TW) covering
                        the successive phases of the two stimuli. The limits of each TW are the valve opening
                        times shifted to consider the travel time of the odorized airflows from the valves to the
                        antenna (Figure 1). TW1 (from 0 to 5.2 s) covered the period before background application
                        and was used to measure the spontaneous activity. The phase corresponding to VPC
                        background onset until pheromone puff was split into two TWs. When a response to
                        background was visible, TW2 (5.2–7.0 s) covered the rise in the neuron firing that followed
                        the background onset; TW3 (7–8 s) covered the period during which the firing decreased
                        compared to the peak, but stayed above the spontaneous activity; TW4 (8–8.5) covered the
                        response to pheromone. To correct for differences in spontaneous activity between neurons,
                        we calculated the response to background by subtracting the mean firing frequencies
                        in TW1 (meanTW1 ) from the maximum firing frequency reached in TW2. Similarly, the
                        pheromone response was calculated by subtracting meanTW1 from the maximum firing
                        frequency reached within TW4 (maxTW4 ). We estimated the capacity of neurons to extract
                        the pheromone signal from the background, the pheromone salience, by subtracting pre-
                        pheromone activity level in TW3 from maxTW4 .
                              For experiments evaluating the effects of single VPCs we used pairwise paired t tests
                        on all possible pairs of background types to compare values of response to background,
                        response to pheromone and pheromone salience in the different backgrounds. False
                        discovery rate was controlled using the Benjamin-Hochsberg’s procedure (FDR < 0.05).
                              For experiments comparing blends to their components we used a permutational
                        MANOVA (PERMANOVA, function Adonis()) under R package vegan [58,59] to evaluate
                        how background composition and dose affected neuronal responses, the three measured
                        variables taken together. The PERMANOVA used a Euclidian distance matrix calculated
                        from response to background, response to pheromone, and pheromone salience. For
                        significance testing, permutations were restricted within individual recordings (parameter
                        “strata”) to account for the non-independence of observations made on the same neuron.
                        Whenever significant differences were found, we further tested differences between the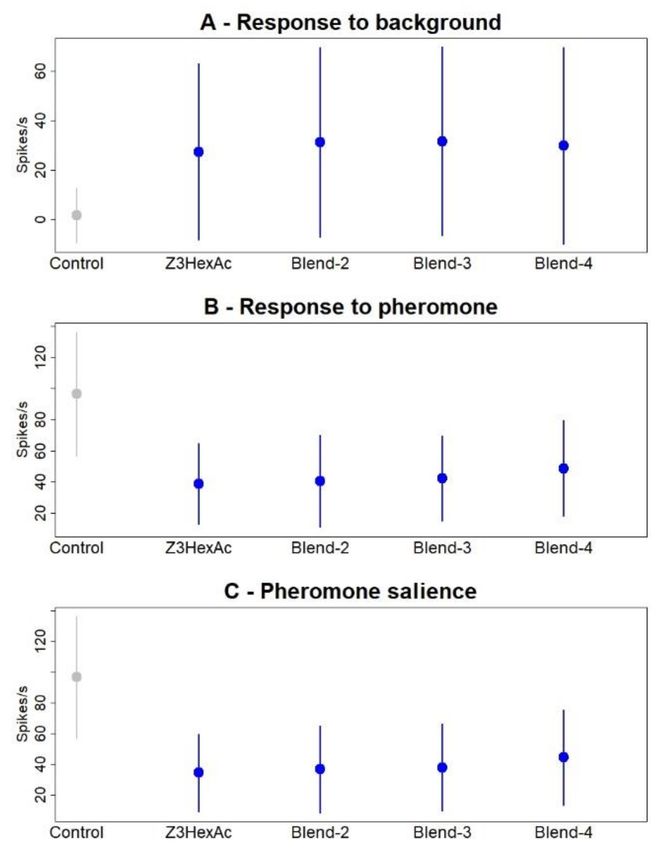
Insects 2021, 12, 409                                                                                            8 of 25

                        blend and each component using pairwise PERMANOVAs between all three pairs of
                        background types. False discovery rate was controlled using the Benjamin-Hochsberg’s
                        procedure (FDR < 0.05). Note that under this analysis, dose was considered a categorial
                        variable, which may not be sufficient to accurately describe the way neurons respond to a
                        blend of two agonistic components. Therefore, for the blend (Z)-3-hexenyl acetate/linalool
                        we further refined the analysis by taking the actual concentrations into account through
                        modeling the dose-response curves. Dose-responses to odorants are usually modeled using
                        Hill’s equation [60]: the response is described as a function of ligand concentration (C), and
                        depends on a maximal response intensity (Rmax ), a concentration at half maximum (EC50 ),
                        and Hill’s coefficient (n):
                                                                         C n ∗ Rmax
                                                           Response = n           n                                 (2)
                                                                        C + EC50
                             Our response to background data were not appropriate for a fit of Hill’s equation
                        because the saturation was never reached making it impossible to estimate Rmax . However,
                        in the case of pheromone response and of pheromone salience, the aim was to model
                        the decrease in response intensity observed in the presence of an agonist background.
                        For that purpose, response intensity or salience in the absence of background could be
                        considered as Rmax . Since individual neurons differed in their responsiveness to pheromone,
                        we normalized all observed pheromone response and salience values to the considered
                        neuron’s corresponding Rmax :

                                                                     TW4 − TW3
                                                           Rnorm =                                                  (3)
                                                                       Rmax

                        and
                                                                      TW4 − TW1
                                                           Snorm =                                                  (4)
                                                                        Smax
                             This also allowed to simplify Hill’s equation by setting Rmax = 1. Subtracting this
                        simplified Hill’s equation from 1 produces a curve that decreases with increasing C, which
                        is empirically appropriate for fitting on the observed decreasing response to pheromone or
                        pheromone salience as function of the background dose:

                                                                           Cn        EC n
                                               Rnorm or Snorm = 1 −            n  = n 50 n                          (5)
                                                                      Cn   + EC50  C + EC50

                             We fitted Equation (5) using the non-linear regression function nls2() (R package nls2,
                        G. Grothendieck, 2013, CRAN deposit) to estimate EC50 and n for the Z7-ORN recordings
                        pooled together (n = 16), and for each background type separately, using total background
                        concentration in arbitrary units as C. We compared the dose-responses observed under
                        blended background and under single compound’s background by checking whether the
                        confidence intervals for the fitted parameters did or did not overlap.

                        3. Results
                        3.1. Calcium Responses to Single VPCs in the MGC
                             Z7-12:Ac activated a large area in the AL that we identified as the MGC according to
                        its position, similar to previous observations in the same insect species [30,61] (Figure S3).
                        All tested VPCs induced a calcium response (Ca-response) in some areas of the antennal
                        lobes corresponding to different ordinary glomeruli (Figure S3). Activity patterns differed
                        according to VPCs, with (E)-2-hexenal, (Z)-3-hexenyl acetate, and linalool activating repeat-
                        edly large areas of the ALs, while β-caryophyllene, eucalyptol, and indole showed more
                        limited activity maps (Figure S3). α-pinene elicited a very localized increase in fluorescence
                        in only two preparations (Figure S3). (Z)-3-hexenyl acetate, linalool, and (E)-2-hexenal
                        triggered a strong Ca-response within the MGC (Figure 2). The Ca-responses to Z7-12:Ac
                        and VPCs were tonic, lasting the time of the odorant presentation (Figure 2). Eucalyptol,
                        indole, caryophyllene, and α-pinene did not evoke a significant Ca-response in the MGC.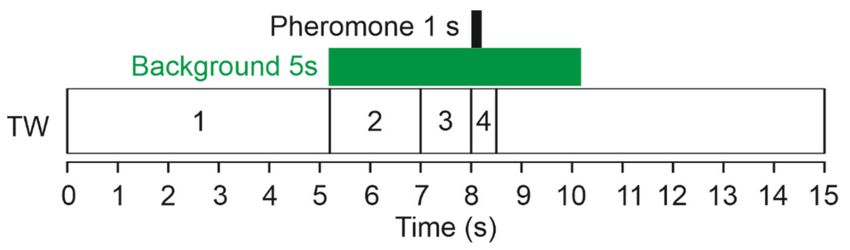
Insects 2021, 12, 409                                                                                               9 of 25

                        Figure 2. Effects of a VPC background on the calcium-response to pheromone in the MGC area of
                        the antennal lobe. Average time course (n = 15) of δF/F in response to VPCs (green curves) and
                        to the pheromone in a background of the same VPCs (black curves) and to pheromone in control
                        background (grey curves). The last panel presents the responses to the pheromone in the control
                        background (mineral oil only) and to the control background. Green and black bars at the bottom of
                        each graph mark the background and pheromone stimuli, respectively.

                             When pheromone was delivered during the VPC-background, Ca-responses to VPC
                        and to Z7-12:Ac merged to form a single fluorescence-peak (Figure 2). Thus, it was not
                        possible to quantify separately the contribution of the VPC and that of pheromone to
                        the Ca-response. However, in the MGC, the Ca-response to VPC plus Z7-12:Ac was
                        always significantly larger than that of VPC alone, independently of the VPC (Table 1, test
                        background vs. background + Phe). It was significantly larger compared to pheromone in
                        mineral oil for 2-hexenal, linalool, and Z3-hexenyl acetate, the three VPCs which triggered
                        a Ca-response within the MGC (Table 1). For the other four VPCs of the panel, the Ca-
                        response to Z7-12:Ac in a VPC background was not different from that to Z7-12:Ac in the
                        control background. The response to Z7-12:Ac alone was always above that to the VPC
                        alone, the difference was significant for α-pinene, Eucalyptol, Indole, β-caryophyllene
                        (Table 1).
Insects 2021, 12, 409 10 of 25
Table 1. Intensities of calcium responses in the MGC following a 5 s presentation of a background of single VPC or of
VPC-background plus 1 s puff of the pheromone component Z7-12:Ac. Means (n = 15) and standard deviations (in brackets)
of the maximum δF/F. Statistical tests: One-way ANOVA, 1 degree of freedom. Significant differences (p < 0.05) appear in
bold in the p column.
Background vs. Z7-12:Ac Z7-12:Ac vs. Z7-12:Ac Z7-12:Ac vs.
δF/F Mean (SD)
Type of in Background in Background Background
Background Background
Background F p F p F p
+ Z7-12:Ac
0.33
2-hexenal 1.27 (0.19) 15.4626 0.0005 7.60928 0.01012 2.63462 0.11576
(0.14)
0.48
Linalool 1.15 (0.19) 7.0363 0.01301 5.14534 0.03121 0.53650 0.46997
(0.17)
(Z)3-hexenyl 0.77
1.22 (0.15) 5.7185 0.02375 8.69025 0.00639 0.60096 0.44471
acetate (0.11)
0.05
α-pinene 0.89 (0.15) 21.8173 0.00007 1.61932 0.21365 13.73691 0.00092
(0.1)
0.1
Eucalyptol 0.93 (0.15) 22.1018 0.00006 2.17790 0.15116 12.51131 0.00143
(0.08)
0.05
Indole 0.64 (0.15) 12.8135 0.00128 0.00007 0.99343 18.21651 0.00020
(0.06)
0.05
β-caryophyllene 0.76 (0.14) 19.2145 0.00015 0.47821 0.49493 14.73026 0.00065
(0.09)
−0.13
Mineral oil 0.69 (0.14) 27.2565 0.00002 0.09661 0.75824 27.14252 0.00002
(0.08)
3.2. Some Single VPCs Activate MGC Neurons and Affect Their Responses to Z7-12:Ac
As the Ca-signal measured with bath applied calcium dye is generally considered
as mainly reflecting the sensory input from ORNs, we undertook to record the firing
activity of the MGC neurons. To specify at which VPC dose the MGC neurons are expected
to respond, we first tested linalool, a compound previously shown to stimulate MGC
neurons activity [29]. Overall, seven doses of linalool ranging from 0.00001 to 10% in
mineral oil were tested for their effects on the firing activity and responses to pheromone
in 5 MGC-neurons. It confirmed that linalool activates the firing of the MGC-neurons in a
dose-dependent manner (ANOVA, p < 0.0001), partially masking the response to Z7-12:Ac.
The lowest active dose was 1% (posthoc paired t-tests, compared to control: response to
background p = 0.0631; response to pheromone, p = 0.0019; pheromone salience, p < 0.0001).
Recordings showed a fast rise of the firing at the background onset, followed by a plateau
lasting the time of the linalool presentation. Linalool 1% was chosen as a reference stimulus
for further experiments.
Then, we stimulated moth antennae with the other VPCs of the panel, adjusting
their concentrations in the source vial according to their volatilities (Table S1). Responses
of MGC neurons (n = 10) varied according to the VPC (ANOVA, p > 0.00001). (Z)-3-
hexenyl acetate strongly stimulated the MGC-neurons (Figure 3A; posthoc t-test, response
to background: p < 0.0001). Compared to linalool, responses to (Z)-3-hexenyl acetate
were more dynamic, showing a fast initial peak with a short latency (Figure 3B), followed
by a decrease in firing and a sustained plateau until background offset. Increases in
firing were also observed in some recordings in response to (E)-2-hexenal (Figure 3A–C),
but the difference with the control background is not significant (response to background:
p = 0.0579) due to the variability of responsiveness of MGC-neurons to this VPC (Figure 3C).
Several MGC-neurons showed a decrease in their firing activity at eucalyptol presentation
(Figure 3C) suggesting an inhibitory activity but the difference with the control is not
globally significant (response to background: p = 0.0928).Insects 2021, 12, 409 11 of 25
Figure 3. Effects of a VPC background on the firing activity of MGC-neurons and their responses to
the pheromone. (A): raster plots of typical individual extracellular recordings. (B): Mean frequency
plots showing the fast firing peak at background onset, followed by a sustained firing activity, and
their effects on the amplitude of the firing peak at pheromone presentation. In (A,B), green and black
bars indicate background and pheromone stimuli, respectively. (C): Strip charts comparing individual
firing activities in each VPC background (green dots) with the control background (black dots). Firing
frequency was measured on appropriate time windows to evaluate: response to background (left
column), response to pheromone (middle column), and pheromone salience (right column). * and
*** indicate p-values of the paired t test below FDR threshold; NS = p-value above FDR threshold.
n = 5 for linalool and 10 for other compounds.
Contrary to the Ca-imaging experiments, it was possible to isolate the increase in
firing activity in response to the pheromone puff and to measure the pheromone salience.
Response to pheromone was dramatically reduced in a (Z)-3-hexenyl acetate background
(p < 0.0001), indicating the occurrence of mixture suppression and resulting in an almost
complete masking of pheromone (Figure 3C). Reduction in the response to pheromone was
also observed in the presence of (E)-2-hexenal background (p = 0.0169). The combination
of response to VPC background and reduction in response to pheromone resulted in a
significant reduction in pheromone salience in the presence of (E)-2-hexenal (p = 0.0061),
linalool (p = 0.0003), and (Z)-3-hexenyl acetate (p < 0.0001) backgrounds.
Although the firing activity seemed lower in the presence of eucalyptol in some MGC-
neurons (Figure 3C), this decrease was not significant (p = 0.0579) when pooling neurons
and response to pheromone and pheromone salience were not statically different between
eucalyptol and control background. β-caryophyllene, indole, isoprene, and α-pinene
neither elicited significant responses nor significantly altered the response to pheromone
(Figure S4).Insects 2021, 12, 409 12 of 25
3.3. Single VPCs Modulate the Z7-ORN Spontaneous Firing and Affect Their Responses
to Pheromone
We then recorded the responses of Z7-ORNs to pheromone in the presence of the same
VPCs and at the same concentrations as for MGC-neurons and compared the effects of VPC
backgrounds on Z7-ORNs and MGC-neurons to clarify whether interactions took place at
peripheral or AL levels. The impact of (Z)-3-hexenyl acetate background was similar on
ORNs as it was on MGC-neurons (Figure 4). Z7-ORNs responded to the background with a
significant increase in firing (p < 0.0001). However, compared to MGC-neurons, their firing
activity decreased more slowly with a longer tail (Figure 4B). The response to pheromone
was significantly reduced (p = 0.0004). The firing peak in response to pheromone was
hardly visible (Figure 4B) and accordingly pheromone salience was strongly decreased
(p < 0.0001) (Figure 4C).
Figure 4. A background of (Z)-3-hexenyl acetate, linalool, eucalyptol or (E)-2-hexenal modifies the
firing activity of Z7-ORNs and their responses to pheromone. (A): raster plots of samples of single
sensillum recordings. (B): Mean frequency plots showing the time-course of the firing in response to
background presentation and pheromone pulse. In (A,B), green and black bars indicate background
and pheromone stimuli, respectively. (C): Strip charts comparing individual neuron firing activities
in each VPC background (green dots) with the control background (black dots). Firing frequency
was measured on appropriate time-windows to evaluate the response to background (left column),
response to pheromone (middle column), and pheromone salience (right column). n = 26. Stars
indicate p-values of the paired t test below FDR threshold; NS = p-value above FDR threshold. n = 5
for linalool and 10 for other compounds.
Z7-ORNs did not respond to the linalool background (Figure 4B; p = 0.6724), unlike
MGC neurons, nor to a (E)-2-hexenal background (p = 0.6709). Response to pheromone
and pheromone salience were not altered by linalool (p = 0.5710 and 0.4598, respectively)
or (E)-2-hexenal (p = 0.9933 and 0.9883, respectively). In agreement with its lack of activity
in MGC-neurons, no significant effect of α-pinene was observed in Z7-ORNs, either for
response to background (Figure S5; p = 0.5447), response to pheromone (p = 0.6244),
or pheromone salience (p = 0.8908). The indole background did not activate Z7-ORNsInsects 2021, 12, 409 13 of 25
(Figure 4 and Figure S5; response to background p = 0.73542), and did not modify response
to pheromone (p = 0.8275) and pheromone salience (p = 0.1126).
To highlight putative inhibitions, we applied backgrounds as short pulses over a
sustained pheromone stimulation (Figure S6). Compared to control, Z7-ORNs stimulated
by pheromone had a lower activity during presentation of eucalyptol than before (Figure S6;
p = 0.023 for the comparison of the difference in number of spikes in TW4 and TW3). Such
inhibitory responses were not observed for (E)-2-hexenal (p = 0.0621), α-pinene (p = 0.254),
indole (p = 0.9611), β-caryophyllene (p = 0.1920), and linalool (p = 0.8499). We also noted
a significant increase for (Z)-3-hexenyl acetate (p = 0.0068), due to the response to the
background.
Altogether, Ca-imaging and electrophysiology allowed to identify (Z)-3-hexenyl ac-
etate, linalool, and to a lesser extent (E)-2-hexenal, as Z7-12:Ac agonists with masking
activity of the pheromone responses at the peripheral or AL levels. Eucalyptol was pos-
tulated to be a weak inhibitor. The other VPCs, indole, α-pinene, β-caryophyllene and
isoprene were postulated to be neutral at the tested concentration. In the next step we
combined these VPCs in 2 to 4 component blends to determine whether they interacted at
the level of Z7-ORNs.
3.4. Binary Blends Produce the Effects of Their Most Active Component
We prepared binary blends by combining VPCs having demonstrated contrasted
impacts on the pheromone perception and compared their effects on Z7-ORNs to those of
their individual components at different doses. To facilitate comparisons between single
components and their blends the concentrations delivered to the antenna were expressed
in arbitrary units (AU) as defined in the material and methods.
We first mixed the agonist (Z)-3-hexenyl acetate with α-pinene, which neither stimu-
lated MGC-neurons and Z7-ORNs nor modified their response to pheromone, to determine
whether the effect on pheromone response of a VPCs could be antagonized by another VPC.
To increase the probability of evidencing an interaction between these two VPCs when
blended we doubled the proportion of α-pinene relatively to that of (Z)-3-hexenyl acetate
(ratio 2:1). The effects of (Z)-3-hexenyl acetate on Z7-ORNs were clearly dose-dependent
(Figure 5; global PERMANOVA, dose effect p = 0.001) and responses to the background
increased with the concentration of (Z)-3-hexenyl acetate (Figure 5A,B). The responses to
pheromone were more strongly attenuated at higher concentrations (Figure 5C). Conse-
quently, the pheromone salience decreased when increasing the background concentration
(Figure 5D). The firing of Z7-ORNs was the same in a background of α-pinene as in the
control background, whatever the α-pinene concentration (Figure 5A,B; pairwise PER-
MANOVA, α-pinene versus control backgrounds, p = 0.939). When the binary blend was
presented as a background, neuron activities were not different from those observed un-
der a background of (Z)-3-hexenyl acetate alone (Figure 5; pairwise PERMANOVA on
(Z)-3-hexenyl acetate versus blend backgrounds, background type effect p = 0.262).
Next, we tested a blend of linalool, which showed agonist activity at AL level and
has been formerly reported to stimulate Z7-ORNs [27], with eucalyptol, a VPC that in-
hibited some MGC neurons and Z7-ORNs when presented over a sustained pheromone
stimulation, at a ratio of 1:2 (Figure 6). At the tested concentrations, eucalyptol alone
did not have any noticeable impact on the neuronal activity (Figure 6B; pairwise PER-
MANOVA eucalyptol vs. control backgrounds, background type effect p = 0.212). At high
concentrations, linalool activated Z7-ORN, confirming a dose-dependent agonist activity
at ORN level (global PERMANOVA, background type effect p = 0.001, dose effect p = 0.01).
Response to the linalool background was apparent only at 4AU (Figure 6B) while the
reduction in pheromone response and salience appeared from 2AU (Figure 6C,D). The
blended background did not modify neuronal activity any differently from linalool alone
(pairwise PERMANOVA linalool versus blended background, background type effect
p = 0.570, Figure 6B–D) suggesting eucalyptol did not interact with linalool.Insects 2021, 12, 409 14 of 25
Figure 5. Effects on Ph-ORNs of a blend of α-pinene and (Z)-3-hexenyl acetate at 2:1 ratio as background to pheromone.
(A): Mean frequency plots (n = 15) showing the time-course of the firing during background presentation and after
pheromone pulse at increasing concentrations of background; below the plots green (α-pinene), light violet ((Z)-3-hexenyl
acetate) or dark violet (blend) bars indicate background stimulus and black bars indicate pheromone stimulus. (B–D): Effects
of background dose and composition on response to background (B), response to pheromone (C) and pheromone salience
(D). Means and standard deviations, n = 15.Insects 2021, 12, 409 15 of 25
Figure 6. Effects on Z7-ORNs of blending linalool with eucalyptol at a 1:2 ratio as background to
a pheromone stimulus. (A): Mean frequency plots (n = 17) showing the time-course of the firing
during background presentation and after pheromone pulse; below each plot a green (linalool), light
violet (eucalyptol) or dark violet (blend) rectangle indicates background presentation and a black
rectangle the pheromone stimulus. (B–D): Effects of background dose and composition on response
to background (B), response to pheromone (C), and pheromone salience (D). Means and standard
deviations, n = 17.
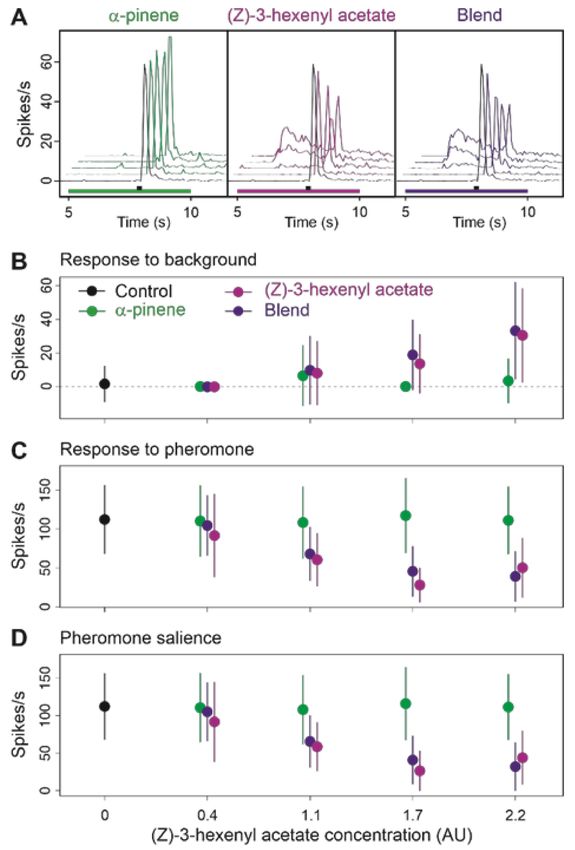
We then mixed the two agonists (Z)-3-hexenyl acetate and linalool at a 1:1 ratio and
compared the blend effects to that of its individual components. Comparison of the activity
of Z7-ORNs in response to increasing doses confirmed that linalool was a weaker agonist
than (Z)-3-hexenyl acetate (pairwise PERMANOVA (Z)-3-hexenyl acetate versus linalool,
background type effect, p = 0.0010; Figure 7A,B). Adding the two VPCs to each other
resulted in a significantly stronger activity of the blend compared to linalool alone (pairwise
PERMANOVA linalool versus blend, background type effect, p = 0.001). The blend was also
more active than (Z)-3-hexenyl acetate alone at the two highest concentrations (pairwise
PERMANOVA, (Z)-3-hexenyl acetate versus blend, background type effect p = 0.001).Insects 2021, 12, 409 16 of 25
Figure 7. Effects on Z7-ORNs of blending two agonists VPCs, (Z)-3-hexenyl acetate and linalool,
at a 1:1 ratio as background. (A): Mean frequency plots showing the time-course of firing during
background presentation and after pheromone pulse. Below the plots, green ((Z)-3-hexenyl acetate),
light violet (linalool) or dark violet (blend) rectangles indicate background presentation; a black
rectangle indicates the pheromone stimulus. (B–D): Effects of background dose and composition on
response to background (B), response to pheromone (C), and pheromone salience (D). Means and
standard deviations, n = 16.
However, since the global blend concentration was the sum of that of its components
we could not determine which type of blend interaction occurred between (Z)-3-hexenyl
acetate and linalool. To this end, we modeled the background doses-response to pheromone
and pheromone salience curves for each of the three background types (Figure 8). Our
modeling approach revealed that the parameters of the model curves for the blend were
always closer to the estimation for (Z)-3-hexenyl acetate than to linalool with stronger
estimated EC50 value and a lower coefficient (Figure 8 and Table S2) confirming (Z)-3-
hexenyl acetate salience in the background effects and indicating an hypo-additivity mode
of interaction.Insects 2021, 12, 409 17 of 25
Figure 8. Modeling the dose dependence of the effects of blend (Z)-3-hexenyl acetate and linalool
on (A) response to pheromone and (B) pheromone salience. Circles = experimental values after
normalization in linalool (black dots), (Z)-3 hexenyl acetate (green dots), and the 1:1 blend (blue dots).
n
EC50
Lines = predicted values obtained from fits of the modified Hill’s equation Rnorm or Snorm = Cn + EC n
50
by a non-linear regression (see estimated parameter values in Table S2).
3.5. Multi Component Blends Reproduced the Activity of Salient Compounds
Finally, we tested the effects of two more complex backgrounds on pheromone de-
tection by Z7-ORNs. A 3-component background was prepared by mixing the agonist
(Z)-3-hexenyl acetate with indole and β-caryophyllene, at a ratio of 1:1:0.3. A 4-component
background was prepared by mixing the two agonists, (Z)-3-hexenyl acetate and linalool
with α-pinene and eucalyptol, at a ratio of 1:1:2:2. The 2-component background obtained
by mixing linalool and (Z)-3-hexenyl acetate was included as a reference. All blends and
reference backgrounds were presented at (Z)-3-hexenyl acetate concentration = 1 AU. The
3-component background did not influence neuron firing and response to pheromone any
differently from (Z)-3-hexenyl acetate alone (pairwise PERMANOVA, p = 0.444, Figure 9B)
or the 2-component blend (p = 0.908). Similarly, the 4-component background did not influ-
ence neuron firing and response to pheromone any differently from either (Z)-3-hexenyl
acetate alone (pairwise PERMANOVA, p = 0.0088, Figure 9B) or the blend of the two
agonists (pairwise PERMANOVA, p = 0.0098, Figure 9). No significant difference was
observed between the 3- and 4-component blends either (p = 0.310).Insects 2021, 12, 409 18 of 25
Figure 9. Effects of backgrounds with blends of 3- and 4-components on the Z7-ORN firing activity.
Control = mineral oil. Z3HexAc = (Z)-3-hexenyl acetate. Blend-2 = (Z)-3-hexenyl acetate 1 AU plus
linalool at ratios of 1:1. Blend 3 = (Z)-3-hexenyl acetate 1 AU plus indole and β-caryophyllene at
ratios of 1:1:0.3. Blend 4 (Z)-3-hexenyl acetate 1 AU, linalool, α-pinene and eucalyptol at ratios of
1:1:2:2. (A) Response to the background, (B) Response to the pheromone, (C) Pheromone salience.
Means of n = 34 measures on 17 Z7-ORNs. Error bars = standard deviations.
4. Discussion
Our data confirm previous observations that a background of common VPCs interfere
with the moth pheromone system in a dose-dependent manner [29,30,62,63]. Interference
with the neuronal coding of the pheromone signal starts at the periphery: specialized Ph-
ORNs respond to some VPCs and their responses to the pheromone compound Z7-12:Ac
are affected by a VPC background. Such interactions between odorants can potentially
occur at many levels in the sensillum, which makes difficult to identify their precise
mechanisms. In rats, non-competitive interactions resulting in mixture suppressions play
a major role in the blend interactions that contribute to the perception of natural odorant
mixtures [60]. Competitive binding at the OR level has been firmly established in insects for
the HR13 pheromone receptor of Heliothis virescens [34]. With electrophysiology we mostly
observed a reduced response to the pheromone compound Z7-12:Ac when it was presented
over a single-VPC background. By contrast, in Ca-imaging, the response to Z7-12:Ac
was slightly increased in a VPC background. This contrasts with studies in bees where
Ca-imaging revealed a majority of mixture suppressions in the AL [64], but with a different
protocol, COVs being delivered simultaneously to the bee antenna. In the present study
while the firing response to VPCs decreased rapidly to a lower level after an initial peak,Insects 2021, 12, 409 19 of 25
the calcium-response stayed at the same level for the whole duration of the background
application to slowly decrease when it was turned off. Calcium fluorescence has a much
slower kinetics compared to firing activity, which makes difficult to interpret it in terms
of interaction between odors presented with a delay. Furthermore, to fully explain the
decreased response to pheromone it should be noted that in our experiments the Z7-ORNs
reached a certain degree of adaptation before the Z7-12:Ac puff because of their response
to the VPC background. Thus, in addition to a mixture suppression, cross-adaptation
between background and pheromone probably also contributed to reduce the response to
pheromone. Whether environmental VPC concentrations can induce similar adaptation
remains unknown.
VPCs differed in their capacity to stimulate Z7-ORNs and such differences cannot be
explained by stimulus intensities because we adjusted the source concentrations to vapor
pressures. Thus, these differences must be attributed to the binding selectivity of ORs or any
other olfactory proteins. Although in the present work the pheromone salience was lower
in a background of VPCs activating the Z7-ORNs, other studies revealed that responses to
pheromone can also be decreased by VPCs with no intrinsic activity [28]. A clear inhibition
of the pheromone response by linalool was observed in vivo in a noctuid moth, Spodoptera
littoralis, although at the concentrations used linalool did not activate Ph-ORNs (Party,
Hanot et al., 2009). This suggests that VPCs can alter the pheromone binding, whether
it be by syntopic or allosteric interactions. It makes difficult to predict the impact of one
VPC on pheromone detection. Interestingly, we observed large differences between VPCs
in the temporal dynamics of the firing responses. A fast response followed by a decrease
was observed for (Z)-3-hexenyl acetate, while linalool elicited a delayed increase in firing.
Differences in the time-course of odorant concentrations due to air-surface interactions
within the system delivering the stimuli have been measured by physical methods in an
olfactometer [65,66]. Odorants adsorb to the walls of the stimulator device and desorb later
on, resulting in slower stimulus rise and decline. Adsorption depends on the affinity of the
odorant molecules for the tubing which explain that stimulus rise and decline times vary
notably among compounds. It is not known whether a similar process also exists within
olfactory organs and contributes to shape in vivo the stimulus course. In natural conditions,
adsorption of volatiles like pheromones onto the vegetation is known to occur [67].
In several moth species the integration of pheromonal signal and host plant odors
occurs within the male ALs [33,68,69]. Behavioral data confirms that male moths are more
attracted in a flight tunnel by blends of pheromone and plant VPCs compared to the
pheromone alone suggesting an ecological adaptation [70,71]. However, the other side of
the coin is that sexual signals and environmental odorants from host and non-host-plants
become mixed. Neuronal treatment of the input generally improves the signal-to-noise
ratio in sensory-systems. The olfactory noise in natural environments is not only complex
because of the diversity of VPCs but it fluctuates largely independently of the pheromone
signal. Such an olfactory noise deteriorates intensity and quality coding of the pheromone
signal in laboratory conditions [63]. Furthermore, because of their responses to VPCs, the
Ph-ORN outputs may be ambiguous with respect to the nature of the chemical. Does the
AL neuronal network facilitate signal identification in downstream olfactory areas by refor-
matting the ORN input? The high convergence level of many ORNs expressing the same
functional type of OR onto a few PNs averages the responses of many ORNs. However, we
did not observe any increase in pheromone salience over background from Z7-ORNs to
MGC-neurons. The ALs reformat the ORN output, resulting in increased signal-to-noise
ratio [72,73]. Convergence should increase pheromone signal to background ratio in PNs,
provided not all Ph-ORNs have the same sensitivity to background odorants. However, if
most Z7-ORNs respond in a standard way to a background odorant, averaging will not
improve signal-to-noise ratio. Then, pooling Ph-ORN outputs might make more apparent
among AL neurons the odor stimuli that produce weak ORN responses. To explain this
contradiction, it is important to consider that separating signal from noise is not the only
challenge of pheromone communication because pheromone concentrations vary over aYou can also read