Firewood residential heating - local versus remote influence on the aerosol burden - Recent
←
→
Page content transcription
If your browser does not render page correctly, please read the page content below
Atmos. Chem. Phys., 21, 5953–5964, 2021
https://doi.org/10.5194/acp-21-5953-2021
© Author(s) 2021. This work is distributed under
the Creative Commons Attribution 4.0 License.

Firewood residential heating – local versus remote influence on the
aerosol burden
Clara Betancourt1,a , Christoph Küppers1 , Tammarat Piansawan1,b , Uta Sager4 , Andrea B. Hoyer4 , Heinz Kaminski4 ,
Gerhard Rapp4 , Astrid C. John4,c , Miriam Küpper4,d , Ulrich Quass4,e , Thomas Kuhlbusch4,f , Jochen Rudolph1 ,
Astrid Kiendler-Scharr1 , and Iulia Gensch1
1 Forschungszentrum   Jülich, IEK-8, 52428 Jülich, Germany
a now at: Forschungszentrum Jülich, JSC, 52428 Jülich, Germany
b now at: Max Planck Institute for Chemical Energy Conversion, 45470 Mülheim an der Ruhr, Germany
4 IUTA e.V., 47229 Duisburg, Germany
c now at: ANECO GmbH, 41068 Mönchengladbach, Germany
d now at: Projektträger Jülich (PTJ), 52425 Jülich, Germany
e now at: LANUV NRW, 45133 Essen, Germany
f now at: BAuA, 44149 Dortmund, Germany

Correspondence: Iulia Gensch (i.gensch@fz-juelich.de)

Received: 29 October 2020 – Discussion started: 19 November 2020
Revised: 26 February 2021 – Accepted: 6 March 2021 – Published: 20 April 2021

Abstract. We report the first-time use of the Lagrangian par-       ment with previous studies on levoglucosan source-specific
ticle dispersion model (LPDM) FLEXPART to simulate iso-             isotopic composition in biomass burning aerosol. Compari-
tope ratios of the biomass burning tracer levoglucosan. Here,       son between measured and estimated levoglucosan concen-
we combine the model results with observed levoglucosan             trations suggests that emissions are underestimated by a fac-
concentrations and δ 13 C to assess the contribution of local vs.   tor of 2 on average. These findings demonstrate that the
remote emissions from firewood domestic heating to the par-         aerosol burden from home heating in residential areas is not
ticulate matter sampled during the cold season at two mea-          of remote origin. In this work we show that combining La-
surements stations of the Environmental Agency of North             grangian modelling with isotope ratios is valuable to obtain
Rhine-Westphalia, Germany.                                          additional insight into source apportionment. Error analysis
   For the investigated samples, the simulations indicate that      shows that the largest source of uncertainty is limited infor-
the largest part of the sampled aerosol is 1 to 2 d old and         mation on isotope ratios of levoglucosan emissions. Based
thus originates from local to regional sources. Consequently,       on the observed low extent of photochemical processing dur-
ageing, also limited by the reduced photochemical activity in       ing the cold season, levoglucosan can be used under similar
the dark cold season, has a minor influence on the observed         conditions as a conservative tracer without introducing sub-
levoglucosan concentration and δ 13 C. The retro plume ages         stantial bias.
agree well with those derived from observed δ 13 C (the “iso-
topic” ages), demonstrating that the limitation of backwards
calculations to 7 d for this study does not introduce any sig-
nificant bias. A linear regression analysis applied to the ex-      1   Introduction
perimental levoglucosan δ 13 C vs. the inverse concentration
confirms the young age of aerosol. The high variability in the      Organic aerosol (OA) has anthropogenic and biogenic
observed δ 13 C implies that the local levoglucosan emissions       sources, being either released as primary OA (POA) or
are characterized by different isotopic ratios in the range         formed as secondary organic aerosol (SOA). Most of the an-
of −26.3 ‰ to −21.3 ‰. These values are in good agree-              thropogenic emissions originate from combustion of fossil
                                                                    fuels or biomass. The biogenic particles are predominately

Published by Copernicus Publications on behalf of the European Geosciences Union.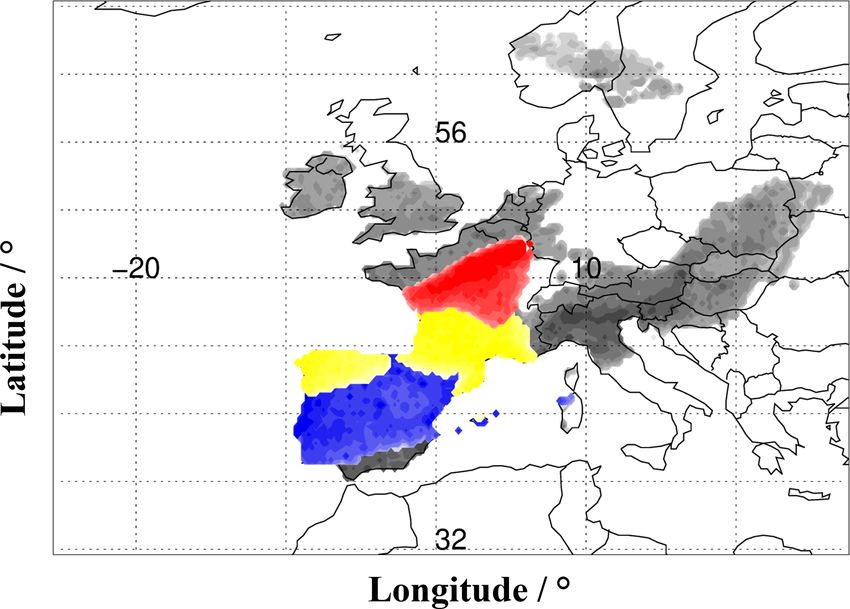
5954                                                                      C. Betancourt et al.: Firewood residential heating

SOA formed by the photo-oxidation of biogenic volatile or-        the “isotopic hydrocarbon clock” equation on the one hand
ganic compounds (VOCs). In the atmosphere, OA undergoes           and back trajectory simulations on the other. For the latter,
various physical and chemical processes, such as ageing by        a post-modelling numerical approach was developed to de-
photolysis and photo-oxidation or deposition by sedimenta-        scribe the mixing with freshly emitted levoglucosan and to
tion and wash-out. Particles have a direct radiative effect by    quantify this impact on the isotopic composition. The results
absorbing and scattering solar radiation. Moreover, they act      of these two independent methods agreed well on average.
as cloud condensation nuclei (CCN), leading to cloud for-         Moreover, the agreement between “isotopic” age and “retro
mation, which indirectly impacts the radiation budget. Being      plume” age demonstrates that the modelling results are not
exposed to OA containing hazardous components, humans             significantly influenced by limiting these to a few days for
experience severe health impairments such as cardiovascu-         this study. Isotopes are thus a useful tool to evaluate the ef-
lar and respiratory diseases (Li et al., 2008, and references     fect of the finite retro plumes. As a consequence, Gensch et
therein). Thus, OA affects air quality, health and climate.       al. (2018) showed that the degree of photo-oxidative ageing
    Biomass burning is an important source of OA. Hal-            of particulate levoglucosan can be quantified by combining
lquist et al. (2009) estimated that biomass burning releases      laboratory KIE studies and observed isotopic composition at
42 Tg C a−1 into the atmosphere, which is about a quarter of      sources and in the field, as well as back trajectory analyses.
the global emitted particulate carbon. Such estimates are as-     Yet, the scatter in the individual data pairs (model vs. ob-
sociated with considerable uncertainties. Parts of the uncer-     servation) pointed out the need to improve the identification
tainties result from the lacking knowledge on source distribu-    and distinction of contributions from different source types,
tion and strength, as well as from the incomplete understand-     which is possible by using the full dispersed output of FLEX-
ing of the loss processes. Since biomass burning substan-         PART.
tially contributes to the OA hazards, it is of great scientific      As a particular form of biomass burning, home heating
and societal interest to accurately apportion its sources and     with firewood is a major contributor to the fine dust in the
quantify its sinks. For the source apportionment of biomass       cold season in the mid-latitudes and high latitudes. Accord-
burning aerosol, factor analyses, chemical mass balance and       ing to the German Environmental Agency (UBA), small
Lagrangian techniques are employed (e.g. Busby et al., 2016;      wood stoves in the residential sector provide only 1.5 % of
Zheng et al., 2002). Chemical mass balance modelling used         the total energy supply but contribute 16 % to the total PM2.5
levoglucosan as the specific non-reactive molecular marker        emissions in Germany. This is comparable to the total road
of biomass burning in aerosol (e.g. Fine et al., 2002) because    traffic PM2.5 exhaust (Amann et al., 2018). For pollution mit-
it is only formed by the thermal breakdown of cellulose, and      igation, an accurate apportionment of local emissions ver-
it is then emitted in large quantities. The accuracy of such      sus remote transport is necessary. The main objective of this
studies is limited by considerable uncertainties in the emis-     study was to implement stable carbon isotopes in the full dis-
sion factors and by the fact that levoglucosan was recently       persed output of FLEXPART by explicitly tracking the lev-
proven to be chemically unstable. Recent laboratory studies       oglucosan fraction containing 13 C. In order to determine the
have shown that levoglucosan reacts with OH radicals within       model performance for given conditions, the sensitivity of
a lifetime of a few days under typical atmospheric conditions     the simulation responses to uncertainties of the governing
(Hennigan et al., 2010; Sang et al., 2016). This new finding      atmospheric processes described in FLEXPART was exam-
opens up new potential applications, especially in the field of   ined. Finally, the set of selected modelling routines were ap-
isotopic analyses.                                                plied in a case study with the goal to assess the contribution
    Sources of biomass burning aerosol can be significantly       of local vs. remote emissions from firewood domestic heat-
better constrained by taking into account the stable carbon       ing to the particulate matter (PM) sampled at two measure-
isotope ratio of levoglucosan (Gensch et al., 2014). This op-     ment stations of the North Rhine-Westphalia Environmental
tion is based on the fact that at the emission, levoglucosan      Agency, LANUV. Thereby, the measured levoglucosan con-
has a source-specific isotopic composition, the “isotopic fin-    centration and isotopic composition in the sampled aerosol
gerprint”. Furthermore, chemical processing leads to isotopic     were used to evaluate the model performance.
fractionation due to the kinetic isotope effect (KIE), which
is distinct for each reaction (making an “isotopic footprint”).
Consequently, highly innovative source apportionment meth-        2   Experimental
ods aim to combine trajectory and wind-based models with
isotopic analyses, which deliver additional information for       The aerosol PM2.5 fraction was sampled on quartz fil-
validation. Recently, Gensch et al. (2018) used isotopic mea-     ters at two of the numerous LANUV monitoring network
surements together with the Lagrangian particle dispersion        stations (Pfeffer et al., 2013). The sampling time was
model (LPDM) FLEXPART (Stohl et al., 2010) to investigate         24 h, and filters were changed daily at 00:00 UTC+1. For
photochemical ageing processes in biomass burning aerosol.        this study, two sampling sites with contrasting character-
To this end, the photochemical age of particulate levoglu-        istics were chosen. The “urban background” station, here-
cosan was derived from observed isotopic ratios, employing        inafter referred to as STYR, is situated in Mülheim-Styrum

Atmos. Chem. Phys., 21, 5953–5964, 2021                                            https://doi.org/10.5194/acp-21-5953-2021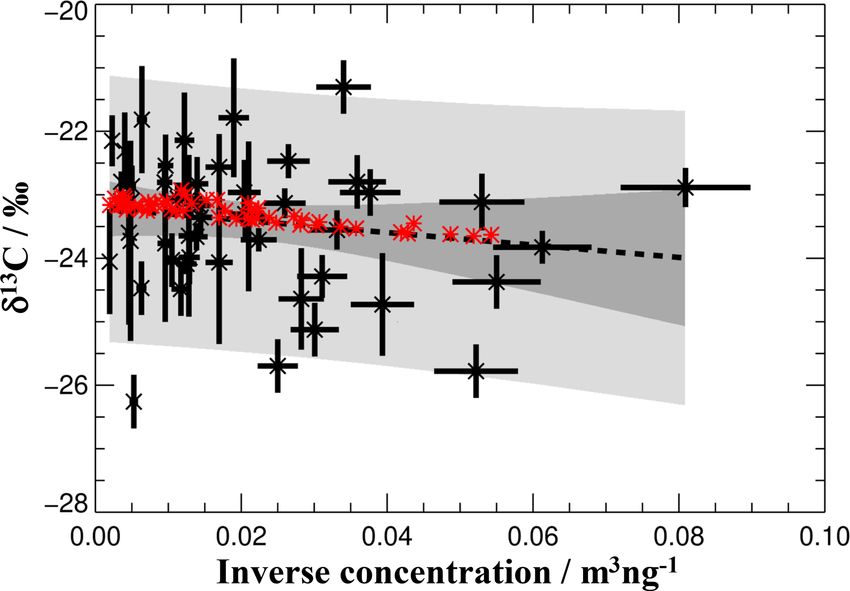
C. Betancourt et al.: Firewood residential heating                                                                            5955

(51.453459◦ N, 6.865050◦ E; with site information avail-           where δ 13 C0 and δ 13 Ct represent the isotopic composition
able at https://www.lanuv.nrw.de/luqs/messorte/pdf/STYR.           at the source and observation site, respectively, tav [OH]av is
pdf, last access: 27 September 2017), while the “re-               the average photochemical age, [OH]av is the average OH
mote/rural” one, hereinafter referred to as EIFE, is located       concentration during the photochemical processing, kOH is
in the hilly Eifel region (50.653234◦ N, 6.281008◦ E; with         the rate coefficient of the species of interest with OH and
site information available at https://www.lanuv.nrw.de/luqs/       OH ε is the KIE of the latter oxidation reaction.

messorte/pdf/EIFE.pdf, last access: 27 September 2017). For           Not only are the fractionation effects small, but also the
laboratory and model analyses, 25 pairs of aerosol filters col-    ratio of the rare isotope to the abundant one is very low.
                                                                                                              13 C
lected on the same day in the cold seasons 2015–2017 at each       Therefore, carbon isotope ratios 13 R = 12 C    are given using
of the two sites were decided on. The main criterion in se-        the delta value:
lecting those was to provide a broad geographical coverage
for the wind directions for the sampled air masses around                     (13 C/12 C)sample − (13 C/12 C)VPDB
                                                                   δ 13 C =                                       × 1000 ‰,    (3)
the measurement sites. A list of the selected samples can be                            (13 C/12 C)VPDB
found in the Supplement (Table S1 in Sect. S1, containing
the sampling dates, levoglucosan loading of the filters and        where (13 C/12 C)VPDB is the internationally accepted Vienna
the main origin of the sampled air masses estimated by HYS-        Pee Dee Belemnite (VPDB) value of 0.0111828 (Brand et al.,
PLIT trajectory analyses).                                         2010; Craig, 1957). The source-specific carbon isotope ratios
   Levoglucosan concentration was measured by ion chro-            of atmospheric trace organic components are introduced in
matography (Kuepper et al., 2018) at the LANUV. Iso-               the simulations considering the emission data for the investi-
topic analyses were carried out at IEK-8, Forschungszen-           gated VOC (details in the following sections).
trum Jülich, by liquid extraction–thermal desorption–two-             In this study, detailed information on origin and path-
dimensional gas chromatography, coupled with isotope ratio         way of the collected aerosol particles was obtained by cal-
mass spectroscopy (LE–TD–2D-GC-IRMS) (Gensch et al.,               culating retro plumes backwards from the sampling sites
2018). Details on the experimental approaches are given in         with the LPDM FLEXPART, version 10.2beta (Seibert and
the Supplement (Sect. S2). Basic statistical analysis of the       Frank, 2004; Stohl et al., 2010; source code available at https:
measurement results can be found in the Supplement (Ta-            //git.nilu.no/flexpart/flexpart, last access: 4 October 2018).
ble S3 in Sect. S3).                                               European Centre for Medium-Range Weather Forecasts
                                                                   (ECMWF) 3-hourly data with a resolution of 1◦ × 1◦ on
                                                                   91 vertical levels were used as driving meteorology (Owens
3   Modelling stable carbon isotopes with FLEXPART                 and Hewson, 2018). For every investigated day, ca. 200 000
                                                                   model particles were released hourly for 24 h at the measure-
Stable carbon isotope ratios of a VOC can be calculated
                                                                   ment stations. Levoglucosan (LG) was implemented as an
in numerical atmospheric models by considering 12 C and
13 C isotopologues as separate species. These are treated in-      aerosol biomass burning tracer which is subjected to pho-
                                                                   tochemical degradation by OH as well as to wet and dry
dividually during the simulations, taking into account the
                                                                   deposition. The aerosol particle population defined in the
slightly different physical and chemical behaviour. Mostly,
                                                                   input has a log-normal size distribution with d = 0.25 µm,
molecules containing 13 C react a little slower than the light
                                                                   σd = 1.5 and a density of 1.4 kg m−3 (Fiebig et al., 2003).
isotopologue due to the kinetic isotope effect (KIE). Denot-
                                                                   To simulate the wet aerosol particle removal, the new depo-
ing the rate constants for these two reactions by 13 k and 12 k,
                                                                   sition module from Grythe et al. (2017) was activated, us-
respectively, KIE is defined as 12 k/13 k and is typically ex-
                                                                   ing three-dimensional cloud water fields from the ECMWF
pressed using the epsilon notation in parts per thousand (‰):
                                                                   data. For below-cloud scavenging, a coalescence probability
                                  12 k
                                                                   of 1 was set for both rain and snow (Grythe et al., 2017).
ε = (1 − KIE) × 1000 ‰ = 1 − 13           × 1000 ‰.         (1)
                                      k                            For the chemical loss, the OH decay rate constant was set
                                                                   to 2.67 × 10⁻¹² cm3 molec.−1 s−1 (Sang et al., 2016). The
KIE can be experimentally determined in laboratory stud-
                                                                   model was run backwards over 7 d. This is at the higher end
ies (Anderson et al., 2003; Sang et al., 2016). Carbon iso-
                                                                   of the expected levoglucosan lifetime for a mean OH concen-
tope effects are generally so small that the relation between
                                                                   tration of 0.5×10⁶ molec. cm−3 in the cold season in Europe
the change in the isotopic ratios and the extent of chemi-
                                                                   (Gerasopoulos et al., 2012; Rohrer and Berresheim, 2006).
cal processing can be linearized without introducing signifi-
                                                                   The output resolution was set to 0.25◦ ×0.25◦ on five vertical
cant bias (Rudolph and Czuba, 2000). Based on the proposed
                                                                   levels. The resulting retro plumes entail the source–receptor
isotopic hydrocarbon clock equation, the photochemical age
                                                                   relationship reflecting the deposition- and decay-corrected
of a VOC can be determined from its isotopic composition
                                                                   receptor sensitivity to potential upwind sources. See Supple-
when the source signature and the KIE of the atmospheric
                                                                   ment (Sect. S4) for details.
degradation reaction are known.
                                                                      To investigate the contribution of relevant domestic heat-
δ 13 Ct = δ 13 C0 + tav [OH]av kOH
                                OH
                                   ε,                       (2)    ing sources to the biomass burning aerosol sampled at the

https://doi.org/10.5194/acp-21-5953-2021                                             Atmos. Chem. Phys., 21, 5953–5964, 2021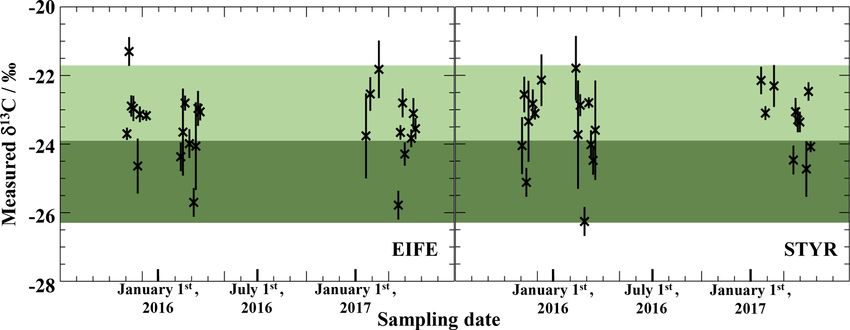
5956                                                                     C. Betancourt et al.: Firewood residential heating

receptors, the retro plumes were folded with monthly mean        4.1.1   Driving meteorological input data
gridded levoglucosan emissions during the cold season in
Europe (Seibert and Frank, 2004). The emission inventories       Unpredictability of the driving meteorology is one of the ma-
were derived from firewood consumption in the targeted Eu-       jor error sources in Lagrangian modelling (Angevine et al.,
ropean countries, population density and levoglucosan emis-      2014; Davis and Dacre, 2009; Lin, 2013), leading to concen-
sion factors of firewood burned in common wood stoves            tration uncertainties of up to 40 %. In this study, two global
(Akagi et al., 2011; Fine et al., 2004; Jimenez et al., 2017;    numerical weather prediction models, ECMWF and Global
Schauer et al., 2001) (firewood consumption by UN data:          Forecast System (GFS, with the same horizontal resolution
https://data.un.org, last access: 10 March 2017; population      but with 39 vertical levels) (Global Climate and Weather
density data by NASA: https://neo.sci.gsfc.nasa.gov, last ac-    Modeling Branch, 2003), delivered the input meteorologi-
cess: 6 February 2017). Details are given in the Supplement      cal fields for two otherwise identical simulations with FLEX-
(Sect. S5). Domestic heating is the main source of the sam-      PART. The derived concentration and δ 13 C values were com-
pled levoglucosan in this study, since FIRMS (Fire Infor-        pared.
mation for Resource Management System a NASA product:               Tables S6.1 and S6.2 present model results obtained with
https://firms.modaps.eosdis.nasa.gov, last access: 10 Jan-       the two meteorology sets (Supplement, Sect. S6). Differ-
uary 2019) fire inventories show no larger scale open fires      ences in the isotopic composition are well below the exper-
affecting the sampling during the considered periods. To de-     imental uncertainty of 0.6 ‰. Levoglucosan concentration
termine the receptor sensitivity to home heating emissions,      calculations based on ECMWF agree fairly well with the
a dynamic footprint layer from 100 to 300 m height was           measurements, showing mean deviations of 9.1 % and 4.2 %
considered (Hüser et al., 2017). The resulting folded retro      for the EIFE and STYR datasets, respectively. In general,
plumes quantify the contribution of each individual source in    the concentrations obtained when using the GFS meteorol-
kilograms per cubic metre (kg m−3 ) to the levoglucosan sam-     ogy are higher than for ECMWF initiated calculations, with
pled at the measurement site. The corresponding concentra-       a difference mean of 6.9 % and 4.6 %, respectively (Supple-
tion is then derived by summing up all contributions.            ment, Figs. S6.1 and S6.2).
   Levoglucosan δ 13 C at the sampling sites was determined         Two extreme cases are presented in Fig. 1. For 18 Febru-
by introducing 13 C-LG as an additional model tracer (Gen-       ary 2016, the simulations show a 1.5 % deviation between the
sch et al., 2011; Stein and Rudolph, 2007). It has the same      concentrations yielded using the ECMWF and GFS meteo-
physical and chemical properties as 12 C-LG, except for a re-    rology. This difference is largest (86.2 %) for 5 March 2016.
duced OH reactivity due to the kinetic isotope effect. In the    In the former example, similar mixing heights (Hmix ) and
simulations, the rate of the 13 C-LG chemical loss was derived   mixing events (when the centroid height Htraj < Hmix ) are
by using KIE = 1.00229 ± 0.00018 (Sang et al., 2016). 13 C-      predicted. For the latter case, higher GFS Hmix are derived.
LG at the source was calculated using 12 C-LG emissions to-      Lower receptor sensitivity to emissions, expressed as tres
gether with the specified source isotopic ratios. The isotopic   (Supplement, Sect. S5), is expected due to dilution. The tres
composition at the sampling point was derived as the ratio       from ECMWF runs is smaller though. A possible explana-
between the slightly different 13 C-LG/12 C-LG retro plumes      tion is that due to shallow mixing layers, a large part of the
folded with the corresponding 13 C-LG/12 C-LG emission in-       emitted particles likely leaves the investigated footprint layer
ventories (for details, see Supplement, Sects. S4, S5).          and does not contribute to the receptor (Hueser et al., 2017).
                                                                    Overall, the simulated concentration and δ 13 C based on
                                                                 ECMWF meteorological fields show good agreement with
4     Results and discussion                                     the values obtained when using GFS data, the uncertainties
                                                                 being in the same range as those of the experimental obser-
4.1    FLEXPART sensitivity studies                              vations. Differences in the modelled levoglucosan concentra-
                                                                 tion and isotopic composition are expected, mainly due to the
Different FLEXPART modules, describing chemical decay
                                                                 different parameterization of sub-grid processes in the atmo-
and dry and wet deposition, were successively activated.
                                                                 spheric boundary layer in the GFS and ERA5 models (Berris-
Modelling parameters, such as meteorology, levoglucosan
                                                                 ford, 2011; Han, 2011). Mixing influences the concentration
lifetime and emission data, were varied to reveal the gov-
                                                                 of a model tracer that is released in the planetary boundary
erning simulated processes and to assess the modelling per-
                                                                 layer. Yet, during the more stable cold season over Europe,
formance. Following the overall goal of this study to sepa-
                                                                 the differences are expected to be small. Due to the higher
rate local from remote sources of firewood domestic heating
                                                                 vertical resolution and ability to more accurately account for
aerosol, changes in output depending on selected input pa-
                                                                 topography, ECMWF meteorology was chosen to initialize
rameter modifications were evaluated for consistency.
                                                                 the model for the further runs.

Atmos. Chem. Phys., 21, 5953–5964, 2021                                            https://doi.org/10.5194/acp-21-5953-2021
C. Betancourt et al.: Firewood residential heating 5957
Figure 1. Simulated retro plumes (top; for the colour code, see legend) as well as centroid back-trajectory (bottom, solid lines) and the
corresponding mixing-layer heights (bottom, dashed lines) for each release hour, using the ECMWF and GFS meteorology, exemplarily
presented for the 18 February (left) and 5 March 2016 (right) samples. The FLEXPART analyses are done for the EIFE site (red star).
4.1.2 Photochemical ageing
Based on the FLEXPART full dispersed output of the “in-
ert tracer” scenario, the retro plumes were divided into age
classes, separating the data by the time the particles in the
considered portion need until they reach the sampling point.
Percentages of the total levoglucosan contribution to the sam-
pled air were calculated. The results show that emissions
during the last 24 h before sampling contribute on average
49 % of the sampled aerosol, being considered “1 d old”. De-
tailed model results are given in Table S7.1 (Supplement,
Sect. S7). A total of 30 % of the contributed emissions oc-
curred between 48 and 24 h and 10 % between 72 and 48 h
before sampling, being considered “2 and 3 d old”, respec-
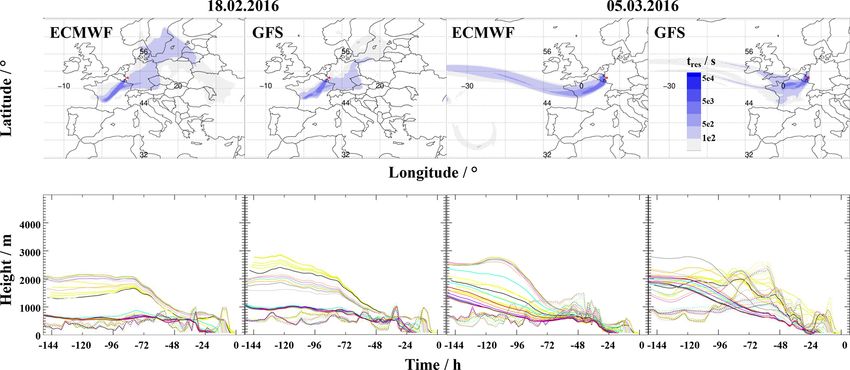
tively. Only 11 % of the total emitted particles were older Figure 2. Levoglucosan emission contribution to the EIFE site
than 3 d. The simulations thus show that the major part of (green star), divided into age classes, for 1 April 2017. The plot
the sampled aerosol originates from local to regional sources shows source regions for 1 d old (35 % of the collected levoglu-
cosan, red), 2 d old (35 %, yellow) and 3 d old (11 %, blue) particles,
being emitted during the sampling day and the day before.
as well as particles older than that (20 %, grey).
Exemplarily, Fig. 2 shows emission contributions of differ-
ent ages for 1 April 2017. Due to the young age of the sam-
pled aerosol and the typically low OH concentration in the
cold season, photochemical ageing is not expected to be the Overall, under the investigated conditions, both concentra-
governing loss process in this study. tion and isotopic composition at the sampling site are rather
To investigate the influence of the photochemical ageing determined by mixing with fresh emissions than by chemical
of the sampling aerosol, simulations were carried out, im- loss processes. This agrees well with the study by Busby et
plementing the chemical degradation of levoglucosan as de- al. (2016), which pointed out that levoglucosan is relatively
scribed by Sang et al. (2016). Indeed, differences between stable during winter due to the low OH concentration.
the results of the inert and “reactive tracer” scenarios are on
average 10 % and 7 % for the EIFE and STYR stations, re- 4.1.3 Deposition
spectively, both being within the experimental error range.
Changes in the isotopic composition are at both stations Simulations including dry as well as wet deposition were car-
0.2 ‰ on average, being smaller than the measurement pre- ried out. The calculated concentration and isotope ratios were
cision. compared with the reactive tracer (without deposition) sce-
https://doi.org/10.5194/acp-21-5953-2021 Atmos. Chem. Phys., 21, 5953–5964, 20215958 C. Betancourt et al.: Firewood residential heating
nario to quantify the contribution of dry and wet removal, the model outcome because of two counteracting effects. A
respectively. greater dilution reduces the impact of a source, while a wider
The initialized aerosol particle population has a mean di- spread of the emission increases the residence time of model
ameter of 0.2 µm, with a corresponding average settling ve- particles in the footprint layer.
locity of 5.6 × 10⁻⁶ m s−1 . Since the aerosol in this study is
relatively young, most of it stays in the accumulation mode. 4.2 Case study
Thus, gravitational settling concentration losses are negligi-
ble, amounting to 1.5 % and 0.7 % at the EIFE and STYR Based on the sensitivity study findings, modelling routines
stations, respectively. Consequently, changes in the isotopic and parameters were selected and applied in a case study
composition are minor as well (details in the Supplement, aiming to assess the contribution of local vs. remote emis-
Sect. S8). sions from firewood domestic heating to the aerosol sampled
Further, the existent simulations show that wet deposition at EIFE and STYR sites.
removed minimal amounts of the emissions. This might be The measured levoglucosan concentration for the inves-
explained by a short exposure of aerosol to weak precipita- tigated samples varies over more than 1 order of magni-
tion of less than 5 mm per 6 h in the investigated periods. tude (from ∼ 10 to 500 ng m−3 ), being lower overall at EIFE
Moreover, there were no in-cloud scavenging events for the (54.2 ng m−3 on average) than at STYR (152.1 ng m−3 on
investigated periods. Possible explanations are the absence average). The histograms depicted in Fig. 3 show further
of fog or spreading of emissions in layers lower than the differences between the sites with a unimodal vs. a multi-
cloud bottom layer height. Similarly to the low impact on modal distribution of the concentrations observed at EIFE
concentration, wet deposition had no significant influence on and STYR, respectively. According to this, there are two ma-
the isotopic composition of the sampled aerosol either. jor categories of sources contributing to the sampled aerosol,
i.e. regional and close-by sources. The urban site region is
4.1.4 Domestic biomass burning emission estimates affected not only by regional upwind emissions, like the re-
mote one, but also by sources very near to the receptor.
Given the lack of levoglucosan emission data from resi- Measured versus simulated concentrations are depicted in
dential heating, an approach was developed here to esti- Fig. 4. Generally, the model results are at the lower end of the
mate these from available information. Therefore, popula- observation range, showing mean absolute percentage devi-
tion density, country-specific firewood consumption and lev- ations of 42.0 % and 53.8 % for the EIFE and STYR sites,
oglucosan emission factors for typical fuel used in resi- respectively. For the rural station, the model overestimates
dential heating were considered (details in the Supplement, the concentration of levoglucosan outside the experimental
Sect. S5). Accordingly, uncertainties arising from potential error ranges in 20 % of cases and underestimates it in 44 % of
spatial and temporal variability of the emission intensities cases. By contrast, at the urban stations, there is only one case
are brought into the calculations, such as errors due to sea- of model overestimation. Here, the model predominantly un-
sonal and regional differences in the wood acquisition and derestimates levoglucosan concentrations, far outside the ex-
consumption. By considering the monthly mean consump- perimental error ranges.
tion of firewood, which is provided by a personal survey, Figure 5 shows the measured δ values of the sampled
weekly to diurnal variances in the emissions are neglected. levoglucosan for both measurement stations. The isotopic
Additionally, weighting with the population density does not composition ranges between −26.3 ‰ and −21.3 ‰. In the-
reflect the real spatial distribution of the wood consumption. ory, such high variance can be explained either by different
As an example, fireplace heating is rather unusual in cities source specific isotopic ratios of the contributing emissions
with high population densities. The conversion factor from or by a different extent of the chemical processing of levoglu-
wood weight to levoglucosan emission depends on the wood cosan in the sampled aerosol.
type and the combustion process (Akagi et al., 2011; Fine et Simulations showed that most contributing emissions are
al., 2004; Jimenez et al., 2017; Schauer et al., 2001). only 1 d old. As a consequence, levoglucosan degradation is
The injection height of a fire emission is usually parame- not expected to be significant for this study. This assump-
terized based on exhaust magnitude and temperature. These tion is supported by the reduced photochemical activity in
are quite similar for domestic woodstoves, unlike in the case the dark winter months (Busby et al., 2016). Thus, mixing
of large open fires. According to Zhang et al. (2014), the foot- of sources characterized by manifold isotopic composition is
print layer for domestic heating emissions stretches from 100 the more likely explanation of the measured δ 13 C. The com-
to 300 m. The model results are not sensitive to the footprint bination of isotope ratio with concentration ambient observa-
layer height as long as it is inside an effectively mixed layer tions in form of a Keeling plot (see below) was employed to
(Hüser et al., 2017). This is valid for the investigated period, verify this conclusion derived from the model. The δ 13 C dis-
since the FLEXPART-simulated mixing heights drop under tribution shown in Fig. 3 is narrower for the EIFE site than for
300 m in fewer than 10 % of cases. Furthermore, increasing STYR, where mixing of individual different sources seems
the thickness of the footprint layer has no major influence on likely.
Atmos. Chem. Phys., 21, 5953–5964, 2021 https://doi.org/10.5194/acp-21-5953-2021C. Betancourt et al.: Firewood residential heating 5959
Figure 3. Distribution frequency of the observed levoglucosan concentration and δ 13 C.
Figure 4. Comparison between observed and simulated levoglucosan concentration at the EIFE and STYR sites. Also, the 1 : 1 line is given
(dashed line).
A model–observation comparison analysis gives the pos- cally light”, high-concentrated emissions with aged, “heav-
sibility to assign individual isotopic signatures to different ier”, low-concentrated background (Lin, 2013). For this anal-
source regions. Within this study, retro plume analyses pro- ysis, the measured isotopic ratio was plotted vs. the inverse
viding the main wind direction were used to confine geo- concentration (Fig. 7). A linear regression analysis was car-
graphically source regions for the sampled aerosol (details ried out. Remarkably, according to the 95 % confidence in-
in the Supplement, Sect. S9). Weighted mean measured δ terval analysis, the yielded y-intercept range of −25.3 ‰ to
values of these assigned source regions are given in Fig. 6. −21.4 ‰, theoretically describing the sources, agrees well
Within measurement error ranges, there is no significant dif- within error ranges with the published isotopic composi-
ference in δ 13 C for the different source regions, indicating tion measured in aerosol from the combustion of various C3
that there is on average no significant spatial dependence of plants (Sang et al., 2012). A y intercept of −23.2 ± 0.1 ‰
the isotopic signature of levoglucosan emissions. was derived, theoretically representing the mean isotope ra-
tio of fresh emissions. The knowledge gained from the Keel-
4.3 Keeling plot analysis ing plot analysis was used to initialize the FLEXPART iso-
topic runs. Since the information on type of fuels consumed
To investigate the chemical stability of levoglucosan for in certain regions is very scarce, a constant source-specific
this study, a Keeling plot approach was employed. The δ 13 C0 of −23.2 ‰ was considered to calculate the 13 C emis-
test hypothesis was that chemical decay plays an impor- sions used in the simulations (Sect. S5 in the Supplement).
tant role here. Accordingly, the Keeling plot describes the This isotopic ratio is in the range of soft woods (conifers).
mixing of two reservoirs in this study of fresh, “isotopi- Since background levoglucosan concentration data were not
https://doi.org/10.5194/acp-21-5953-2021 Atmos. Chem. Phys., 21, 5953–5964, 20215960 C. Betancourt et al.: Firewood residential heating
Figure 5. δ 13 C of the sampled levoglucosan at EIFE and STYR sites. The shaded areas represent ranges of observed levoglucosan source
specific isotope ratios in aerosol formed during the combustion of soft (light green) and hard wood (dark green) (Sang et al., 2012).
centrations and delta values. Background levoglucosan can
originate either from a diffuse source that is not related to
the population density or from air masses that are not taken
into account by the 7 d retro plumes. The former hypothe-
sis is not plausible in winter. The latter is likely in terms
of the concentrations but not compatible with the delta val-
ues, since the isotopic ratio of 7 d older levoglucosan in-
creases by 2 ‰. The Keeling plot is therefore a strong in-
dication that a significant background cannot be reconciled
with the observed isotope values. Thus, a systematic under-
estimation of the source strength might be a better explana-
tion for the observed data. In the first model runs, the back-
ground levoglucosan concentration and isotopic ratio were
set to 12.4 ng m−3 and −24.0 ‰, respectively. Subsequently,
model runs were repeated by gradually reducing the back-
ground. The best fit between the observed and calculated
Figure 6. Isotopic signatures for different source regions, includ- concentrations was reached by setting the background to zero
ing corresponding sample number as well as the average δ 13 C. The (Supplement, Table S8.3). The linear regression analysis ad-
source regions for the sampled aerosol were designated based on ditionally shows a significant difference in the emission fac-
the main wind direction (see text). tors between EIFE and STYR. Nevertheless, emissions are
underestimated by a factor of 2 on average.
The modelled δ 13 C results shown in Fig. 7 are located
available, the lowest measured concentration (12.4 ng m−3 at next to the line fitted to the observations. Based on the iso-
the EIFE station on 10 November 2015) was considered to topic hydrocarbon clock equation (Eq. 3), the isotopic age
be a constant background value. A corresponding δ 13 C of was calculated from modelled and observed levoglucosan
−24.0 ± 0.3 ‰ was derived (see Fig. 7). The most important isotopic ratios, using a δ 13 C0 of −23.2 ‰ and kinetic data
outcome was that the slope of the fitted line to the experi- from Sang et al. (2016). The mean OH concentration was
mental data was found to be slightly negative, contradicting considered 0.5 × 10⁶ molec. cm−3 . This yields a “negative”
the assumption of an aged heavy background. This analysis age for the observations (Supplement, Table S7.3), probably
thus demonstrated that the initial hypothesis of levoglucosan a consequence of the inaccuracy of the emission isotope ratio
chemical instability was false. Consequently, the variability used, which is in the upper range of source-specific δ 13 C0 .
in the observed δ values is likely due to the contribution of Here it is to be noted that a levoglucosan lifetime that is 4
local to regional sources that possess different isotopic ratios times shorter, when using the kOH reported by Hennigan et
in the above-mentioned range and not due to chemical pro- al. (2010), would translate to even stronger emissions, char-
cessing. acterized by isotopic ratios 2 ‰ to 3 ‰ lighter. Then again,
The isotopic ratio of the assumed background, lower than these are at the lowermost end of the reported δ 13 C0 . The
that of sources, cannot describe the “expected” photochem- trajectory model has an age of around 1.5 d, with a small but
ically aged aerosol. This result calls into question whether very significant difference between EIFE and STYR (EIFE
the initially postulated reservoirs explain the observed con- is older, as expected). The observed delta values show a sim-
Atmos. Chem. Phys., 21, 5953–5964, 2021 https://doi.org/10.5194/acp-21-5953-2021C. Betancourt et al.: Firewood residential heating 5961
tribution to the receptor sites and its loss processes during the
atmospheric transport are quantified.
Sensitivity studies show that for this special case, vary-
ing model variables, such as meteorology, rate constant of
the photo-oxidation reaction or deposition processes, does
not yield significant changes in the simulation results. This
is justified by similar vertical mixing parameterization in the
wind models during the more stable cold season over Europe.
Lower OH concentrations cause less photochemical degrada-
tion of levoglucosan. This can also be associated with the
young age of the sampled aerosol derived from the simu-
lations. Furthermore, sedimentation is an insignificant loss
process for the fresh biomass burning aerosol. The activation
Figure 7. Keeling plot depicting the observed levoglucosan δ 13 C of the wet deposition module leads to minor levoglucosan
vs. the inverse concentration (black symbols). Model results are concentration reductions due to missing strong precipitation
given (red symbols), as well as the line fitted to the experimental events in winter. Levoglucosan isotope ratios close to δ 13 C0
data (dashed). The light and dark grey shaded areas represent the of emissions can be either explained by deposition or by local
95 % prediction and confidence intervals, respectively. to regional sources and dispersion. Since dry and wet deposi-
tion are insignificant, the latter hypothesis is the most likely.
The presented case study shows reasonable agreement
ilar difference under the premise used here that the emissions between modelled and observed data within error ranges.
contributing to EIFE and STYR have the isotopic composi- However, the frequent underestimations, especially at STYR,
tion. This is to be expected for the trajectory analyses in this might indicate unidentified sources or flaws in the levoglu-
study, since the mean age is greater than 1 d and therefore cosan emission strength. This comparison supports the fact
is regionally averaged. Moreover, due to the number and du- that sources,which are very close to the receptor but not ac-
ration of the sample collection, the averaging includes also curately described in the developed emission inventory ap-
a variety of prevailing conditions. In reverse, when assuming proach strongly influence the local aerosol burden, particu-
that the trajectory analyses correctly reflect the mean age, one larly for the STYR site. The Keeling plot analysis proved
can determine the emission isotopic ratios from the observa- that an aged background was insignificant for this study, sup-
tions. Noticeably here, the values for EIFE and STYR are porting the conclusion that long-range transport minimally
almost identical, supporting the good averaging conclusion. impacted the investigated aerosol. This can also explain the
Overall, this model–observation comparison study shows few overestimations of the derived concentration at EIFE,
good agreement between the model and observations. This which might be caused by overestimated background lev-
demonstrates that FLEXPART describes the atmospheric els rather than underestimated removal (Grythe et al., 2017).
processes investigated in this study well. Despite unknowns Repeated calculations reducing the background and increas-
expected to introduce biases in the analyses, FLEXPART ing the emissions indicated that in the initial model runs,
simulations provide a good description of the sources and the source strength is most likely underestimated and the
background. background levels overestimated. The measured δ 13 C values
show much higher variability compared with the simulated
isotopic ratios. This can be explained by possible individual
5 Conclusions source-to-source variation (e.g. due to differences in the fuel
used). Within the variability of δ 13 C of emissions, the retro-
In this study we have combined Lagrangian particle dis- plume-modelled age of levoglucosan agrees well with the
persion modelling with concentration and isotopic measure- age resulting from the observed isotopic ratios. This agree-
ments of levoglucosan in PM sampled during the cold sea- ment demonstrates that the limitation to 7 d backward cal-
son at two LANUV stations as an innovative tool to investi- culations does not create any significant bias. Finally, since
gate home heating aerosol sources and aerosol fate. To this observations as well as the retro plume analyse show that
end, we have successfully implemented 12 levoglucosan and chemical ageing does not play a significant role in the cold
13 levoglucosan as separate chemical species in the LPDM season in central Europe, levoglucosan can be used as a “con-
FLEXPART, to calculate the isotopic ratio distribution of the servative” tracer under similar conditions. All these findings
specific biomass burning tracer from the source to the sam- demonstrate the FLEXPART fitness to simulate aerosol pro-
pling site. The analysis of the full dispersed model output, cesses occurring between the source and receptor. The sen-
in combination with emission inventories using the folded sitivity studies revealed individual factors leading to poten-
retro plume technique, yielded very detailed information on tial biases, while the comparison between simulated and ob-
the source–receptor relationships. Thus, aerosol source con-
https://doi.org/10.5194/acp-21-5953-2021 Atmos. Chem. Phys., 21, 5953–5964, 20215962 C. Betancourt et al.: Firewood residential heating
served concentration assessed the most probable sources and Review statement. This paper was edited by Lynn M. Russell and
loss processes for the investigated aerosol. reviewed by two anonymous referees.
Both sensitivity and case studies unquestionably point out
that local/regional domestic heating is the major source con-
tributing to the biomass burning aerosol burden under the in-
vestigated conditions. Thus, we have demonstrated that the References
developed modelling strategies are suitable to assess sources
of biomass burning aerosol in living areas in winter. Under Akagi, S. K., Yokelson, R. J., Wiedinmyer, C., Alvarado, M. J.,
similar conditions, i.e. cold season in Europe, photochemical Reid, J. S., Karl, T., Crounse, J. D., and Wennberg, P. O.: Emis-
decay is negligible; therefore levoglucosan can be employed sion factors for open and domestic biomass burning for use
as an inert tracer in source–receptor studies, without intro- in atmospheric models, Atmos. Chem. Phys., 11, 4039–4072,
ducing considerable bias. https://doi.org/10.5194/acp-11-4039-2011, 2011.
For the future, more isotopic measurements of fuels used Amann, M., Cofala, J., Klimont, Z., Nagl, C., and Schieder,
for domestic heating in Europe are essential to better con- W.: Measures to address air pollution from small combustion
strain the isotopic signature of individual sources. Global sources, Environment Agency Austria, International Institute for
Applied Systems Analysis, 51 pp., 2018.
modelling together with more frequent ambient measure-
Anderson, R. S., Czuba, E., Ernst, D., Huang, L., Thompson, A.
ments is necessary to describe the concentration and isotopic E., and Rudolph, J.: Method for Measuring Carbon Kinetic Iso-
composition of background aerosol more accurately. Further tope Effects of Gas-Phase Reactions of Light Hydrocarbons
studies, preferably on summer fires, are needed to test pro- with the Hydroxyl Radical, J. Phys. Chem. A, 107, 6191–6199,
cesses described by FLEXPART. Isotopic information will https://doi.org/10.1021/jp034256d, 2003.
likely deliver the additional information to quantify aerosol Angevine, W. M., Brioude, J., McKeen, S., and Holloway, J. S.:
photochemical ageing in a OH-radical-rich atmosphere, as Uncertainty in Lagrangian pollutant transport simulations due
well as the wet deposition during strong precipitation, lead- to meteorological uncertainty from a mesoscale WRF ensemble,
ing to heavy levoglucosan removal. Geosci. Model Dev., 7, 2817–2829, https://doi.org/10.5194/gmd-
7-2817-2014, 2014.
Berrisford, P., Dee, D.P., Poli, P., Brugge, R., Fielding, M., Fuentes,
Data availability. Data are available from the corresponding author M., Kållberg, P.W., Kobayashi, S., Uppala, S., and Simmons, A.:
on request (i.gensch@fz-juelich.de). The ERA-Interim archive Version 2.0, ECMWF, Shinfield Park,
Reading, 23 pp., 2011.
Brand, W. A., Assonov, S. S., and Coplen, T. B.: Correc-
tion for the 17 O interference in δ(13 C) measurements when
Supplement. The supplement related to this article is available on-
analyzing CO2 with stable isotope mass spectrometry (IU-
line at: https://doi.org/10.5194/acp-21-5953-2021-supplement.
PAC Technical Report), Pure Appl. Chem., 82, 1719–1733,
https://doi.org/10.1351/pac-rep-09-01-05, 2010.
Busby, B. D., Ward, T. J., Turner, J. R., and Palmer, C. P.: Compari-
Author contributions. IG, AKS and TK were involved in research son and evaluation of methods to apportion ambient PM2.5 to res-
planning and experimental design. CB and IG developed the mod- idential wood heating in Fairbanks, AK, Aerosol Air Qual. Res.,
elling approach, and CB performed the simulations. TP and CK re- 16, 492–503, https://doi.org/10.4209/aaqr.2015.04.0235, 2016.
fined the experimental method and performed the levoglucosan iso- Craig, H.: Isotopic standards for carbon and oxygen and cor-
topic ratio measurements. CB, IG and JR analysed and synthesized rection factors for mass-spectrometric analysis of carbon
the experimental and simulation data. CB wrote the paper together dioxide, Geochimica et Cosmochimica Acta, 12, 133–149,
with IG. All other co-authors participated in data collection, exper- https://doi.org/10.1016/0016-7037(57)90024-8, 1957.
iment operations and paper discussion. Davis, L. S. and Dacre, H. F.: Can dispersion model predictions
be improved by increasing the temporal and spatial resolu-
tion of the meteorological input data?, Weather, 64, 232–237,
Competing interests. The authors declare that they have no conflict https://doi.org/10.1002/wea.421, 2009.
of interest. Fiebig, M., Stohl, A., Wendisch, M., Eckhardt, S., and Petzold, A.:
Dependence of solar radiative forcing of forest fire aerosol on
ageing and state of mixture, Atmos. Chem. Phys., 3, 881–891,
Acknowledgements. We thank Bo Zhang for providing us with the https://doi.org/10.5194/acp-3-881-2003, 2003.
FLEXPART IDL post-processing routines, which we adapted for Fine, P. M., Cass, G. R., and Simoneit, B. R. T.: Chemical Charac-
our calculations. terization of Fine Particle Emissions from the Fireplace Combus-
tion of Woods Grown in the Southern United States, Environ. Sci.
Technol., 36, 1442–1451, https://doi.org/10.1021/es0108988,
Financial support. The article processing charges for this open- 2002.
access publication were covered by a Research Centre of the Fine, P. M., Cass, G. R., and Simoneit, B. R. T.: Chemical Char-
Helmholtz Association. acterization of Fine Particle Emissions from the Wood Stove
Combustion of Prevalent United States Tree Species, Environ.
Atmos. Chem. Phys., 21, 5953–5964, 2021 https://doi.org/10.5194/acp-21-5953-2021C. Betancourt et al.: Firewood residential heating 5963 Eng. Sci., 21, 705–721, https://doi.org/10.1089/ees.2004.21.705, fossil emissions and biomass burning to PM10 in the 2004. Ruhr area, Germany, Atmos. Environ., 189, 174–186, Gensch, I., Laumer, W., Stein, O., Kammer, B., Hohaus, T., https://doi.org/10.1016/j.atmosenv.2018.06.039, 2018. Saathoff, H., Wegener, R., Wahner, A., and Kiendler-Scharr, Li, N., Xia, T., and Nel, A. E.: The role of oxidative A.: Temperature dependence of the kinetic isotope effect stress in ambient particulate matter-induced lung dis- in β-pinene ozonolysis, J. Geophys. Res., 116, D20301, eases and its implications in the toxicity of engineered https://doi.org/10.1029/2011JD016084, 2011. nanoparticles, Free Radical Biol. Med., 44, 1689–1699, Gensch, I., Kiendler-Scharr, A., and Rudolph, J.: Isotope ratio stud- https://doi.org/10.1016/j.freeradbiomed.2008.01.028, 2008. ies of atmospheric organic compounds: Principles, methods, ap- Lin, J. C.: An Introduction, in: Lagrangian Modeling of the At- plications and potential, Int. J. Mass Spectrom., 365–366, 206– mosphre, edited by: Lin, J., Brunner, D., Gerbig, C., Stohl, A., 221, https://doi.org/10.1016/j.ijms.2014.02.004, 2014. Luhar, A., and Webley, P., John Wiley & Sons, Washington, DC, Gensch, I., Sang-Arlt, X. F., Laumer, W., Chan, C. Y., Engling, G., 2013. Rudolph, J., and Kiendler-Scharr, A.: Using δ 13 C of Levoglu- Owens, R. G. and Hewson, T.: ECMWF Forecast User Guide, cosan As a Chemical Clock, Environ. Sci. Technol., 52, 11094– ECMWF, Reading, 2018. 11101, https://doi.org/10.1021/acs.est.8b03054, 2018. Pfeffer, U., Breuer, L., Gladtke, D., and Schuck, T. J.: Contribution Gerasopoulos, E., Kazadzis, S., Vrekoussis, M., Kouvarakis, G., of wood burning to the exceedance of PM10 limit values in north Liakakou, E., Kouremeti, N., Giannadaki, D., Kanakidou, M., rhine-westphalia, Gefahrst. Reinhalt. L., 73, 239–245, 2013. Bohn, B., and Mihalopoulos, N.: Factors affecting O3 and NO2 Rohrer, F. and Berresheim, H.: Strong correlation between lev- photolysis frequencies measured in the eastern Mediterranean els of tropospheric hydroxyl radicals and solar ultraviolet radia- during the five-year period 2002–2006, J. Geophys. Res.-Atmos., tion, Nature, 442, 184–187, https://doi.org/10.1038/nature04924, 117, D22305, https://doi.org/10.1029/2012JD017622, 2012. 2006. Global Climate & Weather Modeling Branch: The GFS atmospheric Rudolph, J. and Czuba, E.: On the use of isotopic composition mea- model, NCEP Office Note 442, 14 pp., 2003. surements of volatile organic compounds to determine the “pho- Grythe, H., Kristiansen, N. I., Groot Zwaaftink, C. D., Eck- tochemical age” of an air mass, Geophys. Res. Lett., 27, 3865– hardt, S., Ström, J., Tunved, P., Krejci, R., and Stohl, A.: A 3868, https://doi.org/10.1029/2000gl011385, 2000. new aerosol wet removal scheme for the Lagrangian particle Sang, X. F., Gensch, I., Laumer, W., Kammer, B., Chan, C. Y., En- model FLEXPART v10, Geosci. Model Dev., 10, 1447–1466, gling, G., Wahner, A., Wissel, H., and Kiendler-Scharr, A.: Sta- https://doi.org/10.5194/gmd-10-1447-2017, 2017. ble Carbon Isotope Ratio Analysis of Anhydrosugars in Biomass Hallquist, M., Wenger, J. C., Baltensperger, U., Rudich, Y., Simp- Burning Aerosol Particles from Source Samples, Environ. Sci. son, D., Claeys, M., Dommen, J., Donahue, N. M., George, Technol., 46, 3312–3318, https://doi.org/10.1021/es204094v, C., Goldstein, A. H., Hamilton, J. F., Herrmann, H., Hoff- 2012. mann, T., Iinuma, Y., Jang, M., Jenkin, M. E., Jimenez, J. L., Sang, X. F., Gensch, I., Kammer, B., Khan, A., Kleist, E., Laumer, Kiendler-Scharr, A., Maenhaut, W., McFiggans, G., Mentel, Th. W., Schlag, P., Schmitt, S. H., Wildt, J., Zhao, R., Mungall, E. L., F., Monod, A., Prévôt, A. S. H., Seinfeld, J. H., Surratt, J. D., Abbatt, J. P. D., and Kiendler-Scharr, A.: Chemical stability of Szmigielski, R., and Wildt, J.: The formation, properties and im- levoglucosan: An isotopic perspective, Geophys. Res. Lett., 43, pact of secondary organic aerosol: current and emerging issues, 5419–5424, https://doi.org/10.1002/2016gl069179, 2016. Atmos. Chem. Phys., 9, 5155–5236, https://doi.org/10.5194/acp- Schauer, J. J., Kleeman, M. J., Cass, G. R., and Simoneit, 9-5155-2009, 2009. B. R. T.: Measurement of Emissions from Air Pollution Han, J. and Pan, H. L.: Revision of Convection and Verti- Sources. 3. C1 -C29 Organic Compounds from Fireplace Com- cal Diffusion Schemes in the NCEP Global Forecast System, bustion of Wood, Environ. Sci. Technol., 35, 1716–1728, Weather Forecast., 26, 520–533, https://doi.org/10.1175/WAF- https://doi.org/10.1021/es001331e, 2001. D-10-05038.1 2011. Seibert, P. and Frank, A.: Source-receptor matrix calculation with Hennigan, C. J., Sullivan, A. P., Collett Jr., J. L., and Robinson, a Lagrangian particle dispersion model in backward mode, At- A. L.: Levoglucosan stability in biomass burning particles ex- mos. Chem. Phys., 4, 51–63, https://doi.org/10.5194/acp-4-51- posed to hydroxyl radicals, Geophys. Res. Lett., 37, L09806, 2004, 2004. https://doi.org/10.1029/2010gl043088, 2010. Stein, O. and Rudolph, J.: Modeling and interpretation of Hüser, I., Harder, H., Heil, A., and Kaiser, J. W.: Assumptions stable carbon isotope ratios of ethane in global chem- about footprint layer heights influence the quantification of emis- ical transport models, J. Geophys. Res., 112, D14308, sion sources: a case study for Cyprus, Atmos. Chem. Phys., https://doi.org/10.1029/2006JD008062, 2007. 17, 10955–10967, https://doi.org/10.5194/acp-17-10955-2017, Stohl, A., Sodemann, H., Eckhardt, S., Frank, A., Seibert, P., and 2017. Wotawa, G.: The Lagrangian particle dispersion model FLEX- Jimenez, J., Farias, O., Quiroz, R., and Yañez, J.: Emission PART version 8.2, 33 pp., 2010. factors of particulate matter, polycyclic aromatic hydrocar- Zhang, B., Owen, R. C., Perlinger, J. A., Kumar, A., Wu, S., Val bons, and levoglucosan from wood combustion in south- Martin, M., Kramer, L., Helmig, D., and Honrath, R. E.: A central Chile, J. Air Waste Manage. Assoc., 67, 806–813, semi-Lagrangian view of ozone production tendency in North https://doi.org/10.1080/10962247.2017.1295114, 2017. American outflow in the summers of 2009 and 2010, Atmos. Kuepper, M., Quass, U., John, A. C., Kaminski, H., Lein- Chem. Phys., 14, 2267–2287, https://doi.org/10.5194/acp-14- ert, S., Breuer, L., Gladtke, D., Weber, S., and Kuhlbusch, 2267-2014, 2014. T. A. J.: Contributions of carbonaceous particles from https://doi.org/10.5194/acp-21-5953-2021 Atmos. Chem. Phys., 21, 5953–5964, 2021
5964                                                          C. Betancourt et al.: Firewood residential heating

Zheng, M., Cass, G. R., Schauer, J. J., and Edgerton, E.
  S.: Source Apportionment of PM2.5 in the Southeast-
  ern United States Using Solvent-Extractable Organic Com-
  pounds as Tracers, Environ. Sci. Technol., 36, 2361–2371,
  https://doi.org/10.1021/es011275x, 2002.

Atmos. Chem. Phys., 21, 5953–5964, 2021                               https://doi.org/10.5194/acp-21-5953-2021
You can also read