Genome wide comparative analyses reveal selection signatures underlying adaptation and production in Tibetan and Poll Dorset sheep
←
→
Page content transcription
If your browser does not render page correctly, please read the page content below

www.nature.com/scientificreports
OPEN Genome‑wide comparative
analyses reveal selection
signatures underlying adaptation
and production in Tibetan and Poll
Dorset sheep
Yingyue Zhang1,2,7, Xianglan Xue1,2,7, Yue Liu1,2, Adam Abied1, Yangyang Ding1,2,
Shengguo Zhao3, Wenqiang Wang3, Liqing Ma4, Jijun Guo5, Weijun Guan1,2, Yabin Pu1,2,
Joram M. Mwacharo6, Jianlin Han1,2, Yuehui Ma1,2* & Qianjun Zhao1,2*
The identification of genome-wide selection signatures can provide insights on the mechanisms of
natural and/or artificial selection and uncover genes related to biological functions and/or phenotypes.
Tibetan sheep are an important livestock in Tibet, providing meat and wool for Tibetans who are
renown for breeding livestock that adapt well to high altitudes. Using whole-genome sequences
with an effective sequencing depth of 5×, we investigated the genomic diversity and structure and,
identified selection signatures of White Tibetan, Oula and Poll Dorset sheep. We obtained 30,163,679
Single Nucleotide Polymorphisms (SNPs) and 5,388,372 indels benchmarked against the ovine
Oar_v4.0 genome assembly. Next, using FST, ZHp and XP-EHH approaches, we identified selection
signatures spanning a set of candidate genes, including HIF1A, CAPN3, PRKAA1, RXFP2, TRHR
and HOXA10 that are associated with pathways and GO categories putatively related to hypoxia
responses, meat traits and disease resistance. Candidate genes and GO terms associated with
coat color were also identified. Finally, quantification of blood physiological parameters, revealed
higher levels of mean corpuscular hemoglobin measurement and mean corpuscular hemoglobin
concentration in Tibetan sheep compared with Poll Dorset, suggesting a greater oxygen-carrying
capacity in the Tibetan sheep and thus better adaptation to high-altitude hypoxia. In conclusion, this
study provides a greater understanding of genome diversity and variations associated with adaptive
and production traits in sheep.
Sheep (Ovis aries) is one of the first domesticated livestock species whose ancestors were primarily distributed
in the Fertile Crescent approximately 10,000 years a go1. Here, we focus the genome-wide analysis on the Tibetan
sheep, an economically important livestock breed in the high altitude Qinghai-Tibetan plateau2, which provides
meat, milk, wool and skins for nomadic and semi-nomadic people3. For instance, the sheep skins can be a source
of coat and mattress for local people. In this study, three sheep breeds were used, two local breeds, the Qinghai
White Tibetan sheep (BZ) and Oula sheep (OL), and one introduced breed, the Poll Dorset (TST) (Supplemen-
tary Table S11). Both OL and BZ are local Tibetan sheep b reeds4,5. BZ is an ancient breed that is raised for wool
and meat production. Notablely, BZ has undergone long-term selection and is characterized by excellent wool
quality (long, uniform and elastic fiber) and white coats, which was mainly raised to provide wool for producing
the Tibetan-style b lanket6. TST has been introduced to crossbred with local breeds to improve the meat-yield
1
Institute of Animal Sciences, Chinese Academy of Agricultural Sciences (CAAS), Beijing 100193, People’s Republic
of China. 2CAAS‑ILRI Joint Laboratory On Livestock and Forage Genetic Resources, Institute of Animal Sciences,
Chinese Academy of Agricultural Sciences (CAAS), Beijing 100193, People’s Republic of China. 3College of Animal
Science and Technology, Gansu Agricultural University, Lanzhou, People’s Republic of China. 4Qinghai Academy
of Animal Science and Veterinary Medicine, Xining 810016, People’s Republic of China. 5Animal Husbandry and
Veterinary Service of Qinghai, Xining 810001, People’s Republic of China. 6International Centre for Agricultural
Research in the Dry Areas (ICARDA), P.O. Box 5689, Addis Ababa, Ethiopia. 7These authors contributed equally:
Yingyue Zhang and Xianglan Xue. *email: yuehui.ma@263.net; zhaoqianjun@caas.cn
Scientific Reports | (2021) 11:2466 | https://doi.org/10.1038/s41598-021-81932-y 1
Vol.:(0123456789)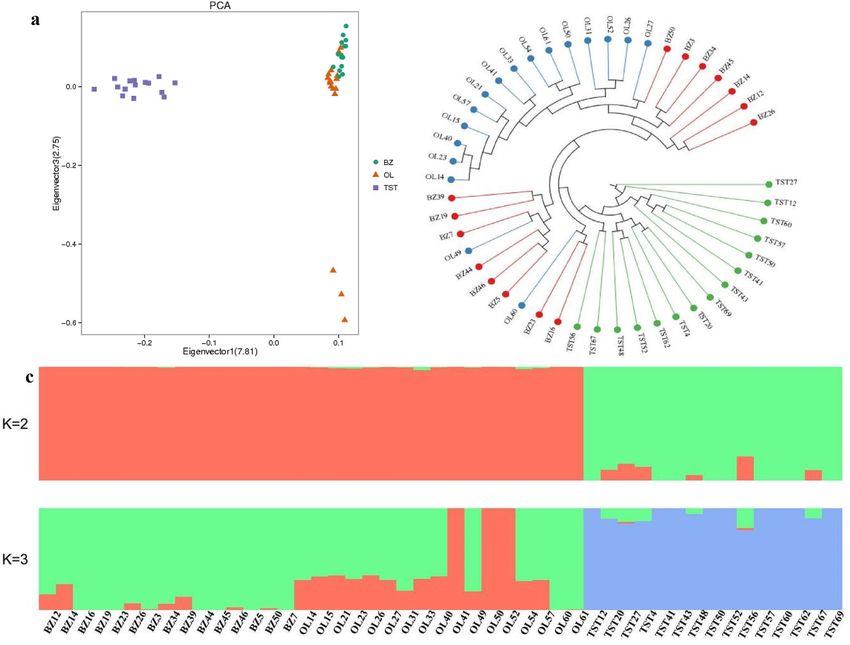
www.nature.com/scientificreports/
performance in China. Its distinguishing features include polledness, rapid growth, muscular development and
their hardiness and ability to thrive, particularly under hot and dry c onditions7.
Through long-term natural and artificial selection, livestock leave signals on the genome by which many
functional genes can be identified8. The identification of selection signals is one of the most important strategies
for studying functional g enomics9. Selection is a vital driving force of evolution. Since the dawn of agriculture,
artificial selection has continuously added to, and/or deducted from, existing variations the same way natural
selection has impacted biodiversity in nature. Following their domestication and dispersal, the Tibetan sheep
gradually adapted to the plateau environment and human requirements. A variety of natural or artificial fac-
tors, such as environmental pressure, human migration and socioeconomic practices, have shaped the genome
profiles of Tibetan sheep to thrive in the Tibetan environment. The diverse production potentials and extensive
adaptations to a wide range of agroecological conditions are believed to result from advantageous mutations
and selection pressures, providing the opportunity for identifying selection signatures associated with adaptive
and production p henotypes10,11.
Next-generation sequencing technologies have been widely used to investigate diverse signatures of selec-
tion across a wide range of s pecies12. Candidate genes contributing to environmental adaptation have been
identified in h umans12–15, yaks16, Tibetan a ntelopes17, gray w
olves18, dogs19–21, cattle22–25, pigs26,27, chickens28,
19,29,30 31,32 33
sheep , goats and Tibetan m
astiffs . Similar methodologies have been used to identified genes associ-
ated to production traits and the impact of domestication in livestock chickens34,35, cattle36, goats32,37, dogs38,
rabbits39, salmon40 and sheep25,37,41,42. In sheep, several studies on selective signatures have identified genes linked
to domestication and productive traits. Kijas et al.43 identified BMP2, a gene associated with bone morphology
and body shape, in a selection signature analysis of a large number of globally distributed sheep breeds. Lv et al.
identified genomic regions and genes associated with environmental adaptation based on climate variables and
genomic data of a larger set of native sheep breeds from a worldwide range of geographic areas and climate10.
Using FST analysis, Zhang et al. conducted a genome-wide selection signal detection in five sheep breeds and
identified genes related to important traits. For instance, RXFP2, GHR and ASIP are associated with the shape of
horn, growth, and lipid m etabolism44. Genome-wide selective signature analysis of resequencing data from 77
Chinese domestic and three wild sheep revealed several novel candidate genes related to extreme environmental
adaptation. The study detected the selected regions mostly spanned milk- and meat-related QTLs, reflecting
human demands for milk and meat during sheep domestication. The SOCS2 was identified as an important
candidate gene in Tibetan sheep for responding to high-altitude stress through the regulating the EPO gene in
the HIF-1 p athway45.
Blood physiological parameters indicate not only health and metabolic conditions but also shed light on
adaptation to specific e nvironments46,47 Long-term severe reduction in oxygen availability at high altitudes con-
tributes to physiological adjustments in response to hypoxia adaptation48,49. Dramatic hematological differences
have also been observed between species living at high-altitudes and the ones at low a ltitudes50–52.
To explore the genetic variance and genetic structure as well as to identify candidate regions and genes related
to important traits, we resequenced the whole genomes of 47 sheep from two Tibetan sheep breeds and an
imported breed and performed a within and between breed comparative selection signature analysis. In addition,
we also calculated indices for several blood parameters to get insights on the physiology of adaptation. The study
is aimed to provide a theoretical basis for improving economically important traits in Tibetan local sheep breeds
and to further provide insights on the mechanisms underlying the adaptation to high altitudes.
Results and discussion
Data production. Blood physiological indices and parameters. To obtain deeper insights on the physiol-
ogy of adaptation, we measured nine blood physiological parameters including WBC, RBC, HGB, HCT, MCV,
MCH, MCHC,RDW-SD and LYM for 186 individuals from three breeds. The levels of MCH and MCHC for the
two local Tibetan sheep breeds were higher compared to those of Poll Dorset (P < 0.01; Supplementary Fig. S1). It
may indicate a higher oxygen-carrying capacity in the blood of Tibetan sheep due to the fact that Tibetan sheep
are long-term inhabitants of high altitude environments. Though it remains to be ascertained, it has been sug-
gested in other literature that blood physiological parameters such as hemoglobin levels often play a major role
in mediating adaptive response to plateau hypoxia. It has been reported that physiological adaptation to higher
CV52. Previ-
altitudes in yak has been attributed to increases in RBC and blood oxygen affinity but decreases in M
ous studies revealed higher levels of MCH and MCHC in s heep29 and horse53,54 from the Tibetan plateau com-
pared with animals in low altitudes. Nevertheless, genome-wide association analysis (GWAS) between genomic
loci and the blood physiological parameters was not performed due to the relatively small number of sheep that
were resequenced. MCV was found to divergent among humans living at high altitudes and at sea level, with
significantly higher values associated with humans living at higher a ltitudes55.
SNP identification and annotation. To characterize the genetic variance of three sheep breeds, the whole-
genome resequencing of 47 individuals was performed on an Illumina HiSeq 2500 system. More than 860 Gb,
2 × 125 bp paired-end reads were generated and aligned using Burrows-Wheeler Aligner (BWA)56 software
against the sheep reference genome assembly. Over 99.38% of the sequence reads were mapped to the reference
genome. We achieved an average sequencing depth of 5.84× for each breed, and more than 99.33% of the total
clean reads mapped against the sheep reference genome, indicating high-quality sequences were obtained in this
study (Supplementary Table S1). We ultimately identified 30,163,679 SNPs and 5,388,372 indels for subsequent
analysis using SAM tools v0.1.1957. All raw data were deposited into a NCBI BioProject section under accession
number PRJNA675420.
Scientific Reports | (2021) 11:2466 | https://doi.org/10.1038/s41598-021-81932-y 2
Vol:.(1234567890)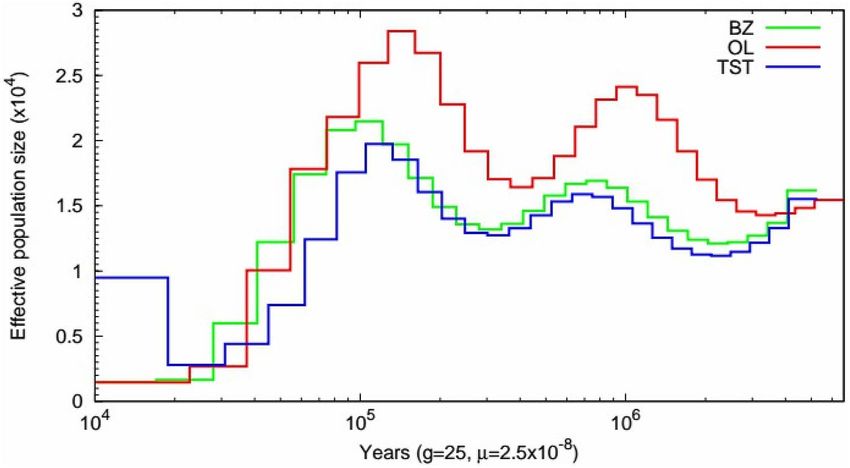
www.nature.com/scientificreports/
To detect genomic regions under selection, we used SAMTools v0.1.1940 to collect summary information from
the input BAM (Binary Alignment Map) files and calculated the probability of the data given for each possible
genotype and stored the probabilities in the BCF (Binary Variant Call Format) file. BCF tools was applied to
the prior data for SNP calling and to convert the data to VCF (Variant Call Format) files, which can be used in
subsequent analysis58. We obtained over 30 million high-quality SNPs from the 47 resequenced sheep, most of
which were located in intergenic regions (18.83 million, 62.06%), and only 0.71% (214,098) were located in exonic
regions (Supplementary Table S2). A total of 62,154 non-synonymous (29.03%) and 81,504 synonymous, SNPs
(38.07%) were localized within exons, resulting in a non-synonymous/synonymous ratio of 0.762 (Supplementary
Table S3). We identified 5,388,372 indels, of which 44,557 were exonic, and the frequency of indels decreased
as their sizes increased (Supplementary Table S4). The proportion of indels in intergenic, intronic, and exonic
regions were 60.48% (3,258,720), 35.0% (1,885,711) and 0.83% (44,557), respectively (Supplementary Table S5).
Genetic diversity and variation. To gain insights on genetic diversity of the three sheep breeds, the expected
heterozygosity (HE), observed heterozygosity (HO) and minor allele frequency (MAF) were estimated based
on genotype frequencies (Supplementary Table S6). The estimates of HE, HO and MAF among the three sheep
breeds were 0.22, 0.19 and 0.15, respectively. These values are lower than those observed in free ranging and
random mating Egyptian Barki sheep populations that are adapted to a hot arid environment59. OL displayed a
lower level of genetic diversity compared with TST and BZ. TST had the lowest inbreeding coefficient (FIS = 0.14),
while OL had the highest value of inbreeding coefficient (FIS = 0.20). This corresponds to the breed character-
istics and breeding history of OL. OL is a breed with a long-term artificial selection for meat production trait
and has been bred in a considerable isolated environment, which result in the low genetic diversity but higher
inbreeding coefficient. In future, a resonable breeding plan for OL breed should be implemented to conserve its
genetic diversity.
Phylogenetic analysis. Principal component analysis (PCA). To examine genetic relationships among
and within the three breeds, we first performed PCA a nalysis60. The first eigenvector clearly distinguished the
TST breed from BZ and OL, and the second eigenvector distinguished the two Tibetan sheep breeds (Fig. 1a).
In general, and as expected, the PCA distinguished the introduced TST breed from the two local Tibetan breeds
(BZ and OL) which showed close genetic proximity. Unexpectedly, 14 individuals of BZ clustered together with
OL, suggesting very close genetic relationships due to either close geographic proximity or deliberate intercross-
ing. Although OL and BZ are classified as Tibetan sheep breeds category, they have distinct morphological
characteristics and breeding histories. BZ is an ancient breed bred by Tibetans and is adapted to the high-altitude
Qinghai-Tibet plateau environment. The breed is known for outstanding wool quality but low meat production.
OL originated from local Tibetan sheep and wild sheep61.
Phylogenetic tree. To further investigate the genetic relationships of the three sheep breeds, a phylogenetic tree
was constructed with the filtered SNP set using the neighbor joining (NJ) algorithm. The NJ tree clustered the
three studied breeds into separate genetic groups confirming their genetic distinction (Fig. 1b). Consistent with
the PCA results, 14 individuals of OL clustered with the BZ, confirming close genetic relationship or gene flow
between the two breeds due to close geographic proximity.
Population genetic structure. To determine the proportion of shared genetic ancestry and/or levels of admix-
ture, we used Frappe62 to explore population genetic structure, at 2 ≤ K ≤ 3 corresponding to the maximum num-
ber of breeds analysed in the study and following the results of the PCA and NJ phylogenetic tree. At K = 2, the
three sheep breeds are genetically divided into the TST breed and the two Tibetan breeds. At K = 3, majority
of BZ individuals separate from the OL ones, except for three OL individuals that remain clustered with BZ
(Fig. 1c). Furthermore, with the exception of only three individuals of OL, the rest had the similar genetic back-
ground of BZ. Consistent with the results of PCA and NJ, the admixture analysis further confirms with higher
resolution, the intermixed genetic makeup of the two Tibetan sheep breeds. Long-term mating of OL and other
Tibetan sheep breeds with non-desirable meat traits is a common practice for improvement of the meat produc-
tion, which result in gene flow of these breeds.
Linkage disequilibrium (LD) analysis, runs of homozygosity (ROH) and pairwise sequentially Markovian coales‑
cent (PSMC). To better understand the population genetic and demographic dynamics of each breed, we used
PopLDdecay software to explore genome-wide patterns of LD in each breed-group invoking the default param-
eters. The LD patterns and ROH analysis result are presented in Fig. 2. The OL and BZ breeds had lower LD
values, suggesting a relatively early origin of the Tibetan sheep breeds. The TST group had higher LD value,
indicating that it was probably derived from a relatively small ancestral population or long-term selection has
retained relatively large LD blocks in its genome. The length, frequency and distribution of ROHs can provide
opulation63. Selection process may give
useful information regarding an animal’s ancestry and the history of the p
rise to high level of homozygosity, also called runs of homozygosity (ROH). The size, frequency and distribution
of ROHs in the genomes from three sheep breeds were investigated. A variety of lengths of ROHs existed in the
genomes of the three sheep breeds (Fig. 2). Consistent with the LD findings, ROH distribution analysis showed
that the average size and frequency of ROHs in TST were relatively higher than those of BZ and OL, respectively.
The PSMC approach can estimate trajectories in changes in genomic effective population sizes ( NE) over
considerable time periods for the ancestor of specific population64. The change in the trends in NE for the three
breeds was the same 20,000 years ago (Fig. 3). There were two peaks in the trends in N E, one at 300,000 years
and the other about one million years ago. At 100,000 years ago, population size shrinkage was observed in
Scientific Reports | (2021) 11:2466 | https://doi.org/10.1038/s41598-021-81932-y 3
Vol.:(0123456789)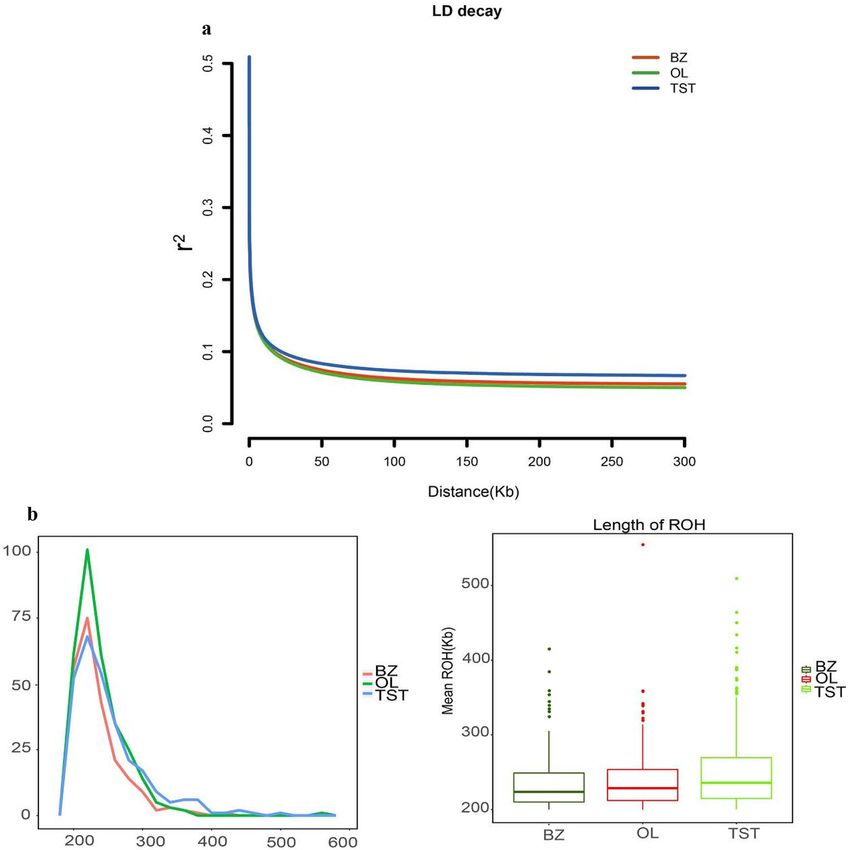
www.nature.com/scientificreports/
Figure 1. Population genetics analyses of samples. (a) Principal component analysis (PCA) results of three
sheep breeds. (b) NJ tree constructed using p-distances between individuals. (c) Population genetic structure
of the sheep inferred from the program FRAPPE v1.1. The length of each colored segment represents the
proportion of the individual genome inferred from ancestral populations (K = 2 or 3).
the three breeds. OL and BZ showed a strong correlation since 100,000 years ago. At 20,000 years, the effective
population size of TST i ncreased65,66.
Genome‑wide selection signature analysis. Over the past a few years, the identification of selection
signatures has led to significant improvements in understanding the genetics of important economic and adap-
tive traits67. Selection signatures have been used to identify differentially selected genes and genomic regions in
different populations. To better understand the underlying genetics of phenotypic traits, production traits and
adaptation among the three sheep breeds, three methods (FST, ZHp and XPEHH) were used to identify selec-
tion signatures. First, we measured the heterozygosity68 (Hp) in 100-kb windows with half-step sliding along the
genomes of the three breeds. The candidate regions defined by ZHp spanned 279, 377 and 450 genes for BZ, OL
and TST, respectively. Of these genes, 45 genes were shared across all the three breeds (Supplementary Table S10).
The fixation index69 (FST) and the Cross-population Extended Haplotype Homozygosity (XPEHH)70,71 tests
involving BZ-OL, OL-TST and BZ-TST, were also performed in 100-kb windows with 50-kb sliding step. Puta-
tive selection targets were extracted from the extreme ends of the distributions by applying a ZHp < − 4, ZFST > 4
cut-off thresholds and top 1% of SNPs for XPEHH. The distributions of the ZFST, ZHp and XPEHH scores sug-
gested the evidence of putative selection in the genomes of the examined breeds (Fig. 4, Supplementary Fig. S2).
The fixation index ( FST) reflect the degree of population difference, which has been wildly applied to scan the
selective sweeps. Several genomic regions with high F ST values were detected, such as GMDS, KIT and PRKAA1.
Up to 421 genes were positively selected for FST(OL-TST) comparison, 359 genes for FST(BZ-TST) comparison and 344
genes for the F ST(BZ-OL) comparison. In addition, XP-EHH method, which tracks down long-range haplotypes
with high frequency, as are indicatives of chromosomal regions under recent selection, was applied for detect-
ing the selective signatures. A total of 750 genes were spanned by the candidate regions identified by XP-EHH
method among the three comparisons performed: 331 genes were positively selected for XPEHH(OL-TST) com-
parison, 105 genes for XPEHH(BZ-TST) comparison and 314 genes for the X PEHH(BZ-OL) comparison. Compared
to other Tibetan sheep breeds, large body size is its strking features for OL. In addition, coat colour pattern and
Scientific Reports | (2021) 11:2466 | https://doi.org/10.1038/s41598-021-81932-y 4
Vol:.(1234567890)www.nature.com/scientificreports/
Figure 2. The population genetic and demographic dynamics of each Sheep breed. (a) Decay of linkage
disequilibrium (LD) in the Chinese native sheep breeds, with one line per breed. (b) The length and distribution
of ROH provide information regarding.
Figure 3. Demographic history of the sheep populations. PSMC analysis results for the representative
individuals sequenced at a high read coverage (~ 42×) exhibit inferred variations in Ne over the last 106 years.
Scientific Reports | (2021) 11:2466 | https://doi.org/10.1038/s41598-021-81932-y 5
Vol.:(0123456789)www.nature.com/scientificreports/
Figure 4. Analysis of the signatures of positive selection in the genome of samples. Genomic landscape of the
(a) ZHP values and (b) ZFST values.
fiber trait of OL and BZ are different. In the comparison of two local Tibetan breeds (BZ and OL), KIT, SOX6,
Scientific Reports | (2021) 11:2466 | https://doi.org/10.1038/s41598-021-81932-y 6
Vol:.(1234567890)www.nature.com/scientificreports/
PRKAA1 and FGF7 were identified as putative candidate genes through the genome-wide analysis of selective
sweep. Previous studied showed KIT and FGF7 are associated with coat colour traits and wool growth develo
pment,respectively72,73. SOX6 is related to muscle development in chicken and z ebrafish74. PRKAA1 functions
as a cellular energy sensor under ATP-deprived conditions such as those experienced in hypoxia, suggesting a
biologically-plausible role for the PRKAA1 (AMPKa1)-mTOR pathway in metabolic responses to hypoxic envi-
ronments. To improve the confidence in the selected outlier windows of putative genomic regions under selec-
tion, we identified 88 overlapped genes, which may contribute to growth and development, behavioral, immune,
and morphological differences among breeds using the criterion of Fst > 4 and a top 1% outlier of XP-EHH. The
list of non-synonymous mutations of overlapping genes in both Fst and XP-EHH methods was showed (Sup-
plementary Table S7).
We conducted a Gene Ontology analysis and Kyoto Encyclopedia of Genes and Genomes of candidate genes
identified in the three breeds by individual selection methods (Supplementary Table S8, Supplementary Table S9).
It revealed enrichments in 529 biological processes GO terms, 98 molecular functions GO terms, and 65 cellular
components GO terms based on the P value of 5%. A few genes were related to reproduction (GO: 0000003), the
immune system (GO: 0002682), embryo development (GO: 0009790, GO: 0048598), growth (GO: 0060173), hair
development (GO: 0001942), nervous-system development (GO: 0050951, GO: 0007632) biological processes,
as well as interleukin (GO: 0070555), skeletal-system development (GO: 0001501), heart development (GO:
0021591), response to hypoxia (GO: 0097411), inflammatory response (GO: 0045088) and sensory perception
(GO: 0050951). All the enriched functional terms had a significant enrichment score (P value < 0.05). These
findings implied genes relating to growth and development, immune response, adaptation for hypoxia and wool
traits could be targets of selection in BZ and OL during domestication and breeding improvement.
Putative sweeps related to high‑altitude adaptation. Tibetan sheep are capable of surviving in high-altitude
cold and dry environments ranging from 2900 to 4500 m above sea level. High-altitude adaptation is the most
significant feature for Tibetan sheep compared to sheep populations from lowland. We therefore focused on the
candidate genomic regions spanning genes related to hypoxia adaptation. Several genes associated with high-
altitude adaptation were detected in our selection signature analysis, including HIF1A, ATR, SLC24A4, PPA2,
and ROCK2. Recent studies have indicated that the regulation of HIF1A stability and transactivation activity
involves several proteins and their well-coordinated interaction, raising the possibility that a wide range of con-
trol mechanisms could be involved in mediating physiological responses to oxygen a vailability74–77. ATR, which
functions in DNA repair, was reported to regulate the expression of hypoxia-inducible factor (HIF)-1 alpha
and confers hypoxia t olerance78. Here, we found that ATR was detected in candidate region on chromosome 1
in BZ and OL but not in TST, suggesting its involvement in high-altitude adaptation in the two Tibetan breeds.
SLC24A4 (sodium/potassium/calcium exchanger 4) is located in the classical HIF-1 pathway, which plays a
ypoxia45. A previous study suggested that PPA2 is a cardiomy-
central role in regulating cellular responses to h
opathy-associated protein that plays a physiological role in mitochondrial function78. Another study suggested
that polymorphisms and the haplotype of ROCK2 are associated with high-altitude essential hypertension in the
Ladakhi Indian population that resides at a high-altitude79.
Candidate genes related to meat and wool traits. Genes associated with meat quality, including CAPN334,36,38,
SOX672–76, FGF580–83, FGF7 and VEPH184,85, were identified in several candidate genomic regions under selec-
tion. Calpain 3 (Capn3), a skeletal muscle-specific member of the calpain family, was suggested to be related with
muscle growth in c attle36,71,77,86 and c hicken34,87. Fibroblast growth factor (FGF) 5 regulates the development and
periodicity of hair follicles, which is related to wool or cashmere growth in cats, sheep and goats80,81,83. FGF5
knockout sheep or goats have significantly increased hair follicles, fiber length and growth rates80. As a famous
local breed due to its superior wool production performance in the Qinghai-Tibetan Pleatau, BZ has longer
fiber compared to OL and TST, which have undergone long-term selection for wool trait. Fiber from BZ is used
by local Tibetans to weave blankets. VEPH1 (ventricular zone expressed PH domain containing 1) is associ-
ated with lipid metabolism and has been reported to be involved in diabetes in humans, fat deposition in pigs
and rump fat thickness and carcass traits in sheep. These findings suggest that VEPH1 may function to regulate
growth and overall body size in mammals80,81.
Candidate genes related to disease and immunity. Selective sweep analysis also identified candidate genes asso-
ciated with disease resistance and immunity, including GMDS88, GMEB289, TNFAIP390,91 and TET292 in several
candidate genomic regions in three sheep breeds. A deficiency in GMDS leads to escape from NK cell-mediated
tumor surveillance through the modulation of TRAIL signaling93. The variant in TNFAIP3 has been associated
with systemic lupus erythematosus, an autoimmune disease. B2M has been implicated in antigen processing and
presentation of peptide antigens via MHC Class Ib88,89.
Candidate genes related to reproduction and body size. The thyroid-stimulating hormone recep-
tor gene (TSHR) was identified in our study by high ZFST and XPEHH values in one candidate region. TSHR
has been reported to play crucial roles in metabolic regulation and the photoperiod control of reproduction in
vertebrates such as domestic chickens35,94 and sheep79. Whole genome scans revealed a distinct selective sweep
located at the locus for TSHR in domestic chickens, which suggested TSHR is likely related to seasonal repro-
duction in vertebrates. ARFRP1 encodes androgen receptor and is essential for prostate gland development and
reproduction91. In our study, the ARFRP1 gene was found in a candidate selection sweep region in the Tibetan
breeds. HOXA10 is a well-known transcriptional factor and is regarded as one of the most promising candidate
genes to play major roles in endometrial differentiation and development through establishing the conditions
Scientific Reports | (2021) 11:2466 | https://doi.org/10.1038/s41598-021-81932-y 7
Vol.:(0123456789)www.nature.com/scientificreports/
required for implantation and normal pregnancy m aintenance92,95. It has been widely studied in humans, mice
and other species. In our study, HOXA10 occurred in a candidate region defined by a strong selection signature
in the Poll Dorset and we suggest that this gene could be an important factor underlying reproductive perfor-
mance.
Conclusion
Our study provides comprehensive insights into the phylogenetic relationship among BZ, OL and TST sheep.
Analysis of blood parameters revealed higher levels of mean corpuscular hemoglobin measurement and hemo-
globin concentration in the Tibetan sheep, which may contribute to their adaptation to high altitudes. We identi-
fied several candidate genes under selection in three sheep breeds, which exert their essential roles in hypoxia
adaptation, growth and development, wool trait as well as other traits. The large number of genetic variants
identified in this study provides the opportunity to further explore the genetic diversity in sheep and the genetic
basis underlying different phenotypes. Our results contribute to the growing knowledge base on genomics of
adaptation in livestock and provide valuable information for future studies on genotype–phenotype relationships
and the improvement of sheep breeding.
Methods
Sample collection. Three sheep breeds were sampled from the northeast part of Qinghai province as fol-
lows: White Tibetan sheep (BZ) from Qilian County, Oula sheep (OL) from Henan County and the introduced
Poll Dorset sheep (TST) from Haiyan County. The average altitude of these counties is 3500 m above sea level.
We collected two sets of 5 ml jugular venous blood samples from each animal. The first set was collected in coag-
ulant tubes while the second set was collected in anticoagulant (4% (w/v) sodium citrate) tubes. The latter were
stored at − 80 °C until further processing. We carried out a test on blood physiological parameters and calculated
indices for White (WBC) and Red Blood Cell counts (RBC), Hemoglobin concentration (HGB), Hematocrit
(HCT), mean corpuscular volume (MCV), Mean corpuscular hemoglobin measurement (MCH) and Mean
corpuscular hemoglobin concentration (MCHC) from 186 unrelated individuals (63 OL, 53 BZ and 70 TST).
All blood parameter measurements were performed within three hours following sampling with Vet Autoread
Blood Analyzer (IDEXX, America) . From the 186 individuals, samples from 47 three-year old individuals (15
BZ, 15 OL and 17 TST) were selected at random and resequenced.
Ethic statement. All experimental procedures used in this study were approved by the Animal Care and
Use Committee of the Institute of Animal Sciences of Chinese Academy of Agricultural Sciences (CAAS) and
conducted in accordance with animal welfare and ethics guidelines of the academy.
DNA isolation and sequencing. DNA was extracted from blood using the QIAamp DNA Blood Mini Kit
(Qiagen) according to the manufacturer’s instructions. The extracted DNA was electrophoresed through a 2%
agarose gel and stained with ethidium bromide to assess overall quality. The DNA concentration was determined
using the Quant-iT PicoGreen dsDNA Reagent Kit (Thermo Fisher Scientific, USA) according to the manu-
facturer’s instructions. Libraries were prepared using Illumina kits with an insert size of approximately 500 bp.
Two × 125-bp paired-end sequencing was carried out on an Illumina HiSeq 2500 instrument (Illumina; CA,
USA). To produce “high quality clean data” from the “raw data,” filtration was performed as follows: (1) Removal
of adapter reads: An adapter read is defined as one that includes more than 5 adapter base pairs. The paired-end
read was discarded if either read contained adapter bases. (2) Removal of low-quality reads: If more than 50% of
the bases in a read were low-quality, defined as a base quality of less than or equal to 5, we designated the read
as a low-quality read and removed it from the raw FASTQ data. The paired reads were discarded when either
read contained more than 50% low-quality nucleotides. (3) Removal of reads with more than 5% unknown bases
(Ns): The paired reads were discarded when either end of one read contained more than 5% unknown bases. All
bioinformatic analyses were based on the clean reads resulting from Illumina quality control filter.
Read alignment and variant calling. The Burrows–Wheeler aligner (v0.7.9a; MEM model) was used to
map the clean reads to the Oar_4.0 Ovis aries genome assembly. Duplicate reads were removed from individual
alignments using the Picard MarkDuplicates tool (v1.115). Reads mapping to more than two genomic locations
were filtered out. The Genome Analysis Toolkit (GATK) Haplotype Caller protocol was used to call SNPs and
indels via local re-assembly of haplotypes. The SNPs and indels were filtered prior to analysis with the GATK
Variant Filtration protocol. The filter settings were as follows: QD < 10.0, ReadPos RankSum < − 8.0, FS > 10,
QUAL < 30, DP < 4.
Variant annotation. ANNOVAR was used to assign SNPs and indels based on gene models from GFF
annotation.
Phylogenetic analysis and demographic dynamics. Principal component analysis (PCA) was per-
formed using the EIGENSOFT package on the filtered SNP set. The top four principal components accounting
for variation in the dataset were identified. A phylogenetic tree was constructed with the filtered SNP set with
the neighbor joining (NJ) algorithm. PHYLIP60 was used to generate genetic distance matrix which were used
in MEGA96 to construct the phylogenetic tree. Frappe (version 1.1) was run using the filtered SNP set to analyze
population structure. The filtered SNP set was also used to estimate genome-wide linkage disequilibrium (LD).
The LD decay was calculated with the PopLDdecay using default parameters. We performed ROH detection
Scientific Reports | (2021) 11:2466 | https://doi.org/10.1038/s41598-021-81932-y 8
Vol:.(1234567890)www.nature.com/scientificreports/
using PLINK v1.09 based on the identified high-quality SNP sites with the following parameters: “--homozyg
--noweb --sheep --allow-no-sex --homozyg-window-kb 5000 --homozyg-window-snp 50 --homozyg-window-
het 1 --homozyg-window-missing 5 --homozyg-snp 10 --homozyg-kb 200 --homozyg-density 50 --homozyg-
gap 1000”.
Selective sweep analysis. Allele counts and allele frequencies at filtered SNP sites were used to detect
genomic regions that may have been affected by selective breeding, migration and adaptation in the genomes of
the study sheep breeds. First, the average pooled heterozygosity (HP) was calculated in 100-kb windows with a
sliding step of 50 kb for each breed. The resulting distribution of HP scores was then Z-transformed into ZHp
values. Second, the fixation index (FST) between the breeds was calculated using VCFtools (0.1.12b) to evalu-
ate genetic differentiation. We averaged the FST across 100-kb windows, with a sliding frame of 50 kb at a time
and Z-transformed the resulting distribution. The parameters for the VCFtools program were as follows: “--fst-
window-size 100,000 --fst-window-step 50,000”. Putative selection targets were extracted from the extreme tail
ends of the distribution by applying a Z (FST) value > 4 and the corresponding ZHp < − 4 as cut-off thresholds.
Additionally, cross population extended haplotype homozygosity (XP-EHH) method was used to scan the
selection signals. We compared the extended haplotype homozygosity (EHH) among the three sheep breeds (OL
vs. TST, BZvs TST and BZ vs. OL) using XP-EHH statistic implemented in the rehh package. Candidate regions
with a P value ≤ 0.01 were considered as signals of selection in the test.
Functional enrichment analysis. Enrichment analysis was performed to determine functional clusters
for the candidate genes using gene ontology (GO) and KEGG pathway analysis. GO enrichment analyses was
performed using OmicShare tools (http://www.omicshare.com/tools). First, all candidate genes were mapped
to GO terms in the GO database (http://www.geneontology.org/) and the significant number of genes for every
term were determined using a P value ≤ 0.05 as the threshold. The GO terms satisfying this criterion were defined
as significantly enriched GO terms for the candidate genes. Second, all candidate genes were mapped to GO
terms in the KEGG pathway database (http://www.genome.jp/kegg/ko.html). KEGG pathway-enrichment anal-
ysis identified significantly enriched metabolic and/or signal transduction, pathways for genes found in the can-
didate regions compared to the whole genome97–99. The calculations and criteria for determining the significantly
enriched pathways was the same as that used in GO analysis.
Data availability
The datasets generated in this paper can be found at Sequence Read Archive: PRJNA675420.
Received: 15 January 2020; Accepted: 11 January 2021
References
1. Ryder, M. L, Sheep. In Evolution of Domestication Animals (ed. Mason, I. L.) 63–85 (Longman, New York, 1984).
2. Li, J. & Zhang, Y. P. Advances in research of the origin and domestication of domestic animals. Biodivers. Sci. 17(4), 319 (2009).
3. Easterling, M. R., Ellner, S. P. & Dixon, P. M. Size-specific sensitivity: applying a new structured population model. Ecology 81,
694–708 (2000).
4. Xian, J. et al. Study on complete mitochondrial genome of Oula sheep (Ovis aries). J. Agric. Sci. Technol. 18(8), 1365–1366 (2017).
5. Yun, S. X. et al. Effect of high content of sulfur in forage on serum biochemical values in grazing Oula sheep. J. Hist. Teach. 3(1),
56–57 (2014).
6. Malau-Aduli, A. E. O. et al. Correlations between growth and wool quality traits of genetically divergent Australian lambs in
response to canola or flaxseed oil supplementation. PLoS ONE 14(1), e0208229. https://doi.org/10.1371/journal.pone.0208229
(2019).
7. Timmins, L., Meat, A., & Corporation, L. S. Handbook of Australian Livestock. M. Australian Meat and Live-stock Corporation
(1989).
8. Hallin, J. & Landry, C. R. Regulation plays a multifaceted role in the retention of gene duplicates. PLoS Biol. 17(11), e3000519
(2019).
9. Pan, Z. Y. et al. Selection signature in domesticated animals. Yi Chuan 38(12), 1069–1080. https://doi.org/10.16288/j.yczz.16-195
(2016).
10. Bigham, A. et al. Identifying signatures of natural selection in Tibetan and Andean populations using dense genome scan data.
PLoS Genet. 6(9), e1001116 (2010).
11. Lv, F. H. et al. Adaptations to climate-mediated selective pressures in sheep. J. Mol. Biol. Evol. 31(12), 3324–3343 (2014).
12. Pan, Z. Y. et al. Selection signature in domesticated animals. Yi Chuan 38, 1069–1080. https://doi.org/10.16288/j.yczz.16-195
(2016).
13. Peng, Y. et al. Genetic variations in Tibetan populations and high-altitude adaptation at the Himalayas. J. Mol. Biol. Evol. 28,
1075–1081 (2011).
14. Simonson, T. S. et al. Genetic evidence for high-altitude adaptation in Tibet. J. Sci. 329, 72–75 (2010).
15. Wang, B. B. et al. On the origin of Tibetans and their genetic basis in adapting high-altitude environments. PLoS ONE 6, e17002
(2011).
16. Qiu, Q. et al. The yak genome and adaptation to life at high altitude. Nat. Genet. 44, 946–949. https://doi.org/10.1038/ng.2343
(2012).
17. Ge, R. L. et al. Draft genome sequence of the Tibetan antelope. Nat. Commun. 4, 1858. https: //doi.org/10.1038/ncomms 2860 (2013).
18. Zhang, W. P. et al. Hypoxia adaptations in the grey wolf (Canis lupus chanco) from Qinghai-Tibet Plateau. PLoS Genet. 10, e1004466
(2014).
19. Gou, X. et al. Whole genome sequencing of six dog breeds from continuous altitudes reveals adaption to high-altitude hypoxia.
Genome Res. 24(8), 1308–1315 (2014).
20. Wang, G. D. et al. Genetic convergence in the adaptation of dogs and humans to the high-altitude environment of the Tibetan
plateau. Genome Biol. Evol. 6, 2122–2128 (2014).
21. Akey, J. M. et al. Tracking footprints of artificial selection in the dog genome. J. Proc. Natl. Acad. Sci. 107, 1160–1165 (2010).
Scientific Reports | (2021) 11:2466 | https://doi.org/10.1038/s41598-021-81932-y 9
Vol.:(0123456789)www.nature.com/scientificreports/
22. Kim, J. et al. The genome landscape of indigenous African cattle. Genome Biol. 18, 34. https://doi.org/10.1186/s13059-017-1153-y
(2017).
23. Yurchenko, A. A. et al. Scans for signatures of selection in Russian cattle breed genomes reveal new candidate genes for environ-
mental adaptation and acclimation. Sci. Rep. 8, 12984. https://doi.org/10.1038/s41598-018-31304-w (2018).
24. Bahbahani, H., Afana, A. & Wragg, D. Genomic signatures of adaptive introgression and environmental adaptation in the Sheko
cattle of southwest Ethiopia. PLoS ONE 13, e0202479. https://doi.org/10.1371/journal.pone.0202479 (2018).
25. Naval-Sanchez, M. et al. Selection signatures in tropical cattle are enriched for promoter and coding regions and reveal missense
mutations in the damage response gene HELB. Genet. Sel. Evol. 52, 27. https://doi.org/10.1186/s12711-020-00546-6 (2020).
26. Ai, H. et al. Population history and genomic signatures for high-altitude adaptation in Tibetan pigs. BMC Genom. 15, 834. https
://doi.org/10.1186/1471-2164-15-834 (2014).
27. Dong, K. et al. Genomic scan reveals loci under altitude adaptation in Tibetan and Dahe pigs. PLoS ONE 9, e110520. https://doi.
org/10.1371/journal.pone.0110520 (2014).
28. Wang, M. S. et al. Genomic analyses reveal potential independent adaptation to high altitude in Tibetan chickens. Mol. Biol. Evol.
32, 1880–1889. https://doi.org/10.1093/molbev/msv071 (2015).
29. Wei, C. et al. Genome-wide analysis reveals adaptation to high altitudes in Tibetan sheep. Sci. Rep. 6, 26770. https: //doi.org/10.1038/
srep26770 (2016).
30. Gorkhali, N. A. et al. Genomic analysis identified a potential novel molecular mechanism for high-altitude adaptation in sheep at
the Himalayas. Sci. Rep. UK https://doi.org/10.1038/srep29963 (2016).
31. Song, S. et al. Exome sequencing reveals genetic differentiation due to high-altitude adaptation in the Tibetan cashmere goat (Capra
hircus). BMC Genom. https://doi.org/10.1186/s12864-016-2449-0 (2016).
32. Bertolini, F. et al. Signatures of selection and environmental adaptation across the goat genome post-domestication. Genet. Sel.
Evol. https://doi.org/10.1186/s12711-018-0421-y (2018).
33. Li, Y. et al. Population variation revealed high-altitude adaptation of Tibetan mastiffs. Mol. Biol. Evol. 31, 1200–1205. https://doi.
org/10.1093/molbev/msu070 (2014).
34. Felicio, A. M. et al. Identification and association of polymorphisms in CAPN1 and CAPN3 candidate genes related to performance
and meat quality traits in chickens. Genet. Mol. Res. 12, 472–482. https://doi.org/10.4238/2013.February.8.12 (2013).
35. Rubin, C. J. et al. TSHR has also been proposed to be a possible domestication gene in chicken. Nature 464, 587–591 (2010).
36. Liu, S. Y. et al. Characterization of a novel CAPN3 transcript generated by alternative splicing in cattle. Genet. Mol. Res. 14, 457–463.
https://doi.org/10.4238/2015.Januar y.23.20 (2015).
37. Alberto, F. J. et al. Convergent genomic signatures of domestication in sheep and goats. Nat. Commun. 9, 813. https://doi.
org/10.1038/s41467-018-03206-y (2018).
38. Axelsson, E. et al. The genomic signature of dog domestication reveals adaptation to a starch-rich diet. Nature 495, 360–364. https
://doi.org/10.1038/nature11837 (2013).
39. Carneiro, M. et al. Rabbit genome analysis reveals a polygenic basis for phenotypic change during domestication. Science 345,
1074–1079. https://doi.org/10.1126/science.1253714 (2014).
40. Naval-Sanchez, M. et al. Changed patterns of genomic variation following recent domestication: selection sweeps in farmed Atlantic
Salmon. Front. Genet. 11, 264. https://doi.org/10.3389/fgene.2020.00264 (2020).
41. Naval-Sanchez, M. et al. Sheep genome functional annotation reveals proximal regulatory elements contributed to the evolution
of modern breeds. Nat. Commun. https://doi.org/10.1038/s41467-017-02809-1 (2018).
42. Mcrae, K. M., McEwan, J. C., Dodds, K. G. & Gemmell, N. J. Signatures of selection in sheep bred for resistance or susceptibility
to gastrointestinal nematodes. BMC Genom. https://doi.org/10.1186/1471-2164-15-637 (2014).
43. Kijas, J. W. et al. Genome-wide analysis of the world’s sheep breeds reveals high levels of historic mixture and strong recent selec-
tion. PLoS Biol. https://doi.org/10.1371/journal.pbio.1001258 (2012).
44. Zhang, L. F. et al. Genome-wide genetic diversity and differentially selected regions among Suffolk, Rambouillet, Columbia, Polypay,
and Targhee sheep. PLoS ONE https://doi.org/10.1371/journal.pone.0065942 (2013).
45. Yang, J. et al. Whole-genome sequencing of native sheep provides insights into rapid adaptations to extreme environments. Mol.
Biol. Evol. 33, 2576–2592. https://doi.org/10.1093/molbev/msw129 (2016).
46. Ramirez, G., Bittle, P. A., Rosen, R., Rabb, H. & Pineda, D. High altitude living: genetic and environmental adaptation. Aviat Space
Environ. Med. 70(1), 73–81 (1999).
47. León-Velarde, F. et al. Hematological parameters in high altitude residents living at 4,355, 4,660, and 5,500 meters above sea level.
High Alt Med. Biol. 1(2), 97–104. https://doi.org/10.1089/15270290050074233 (2000).
48. Gassmann, M. et al. The increase in hemoglobin concentration with altitude varies among human populations. Ann. N. Y. Acad.
Sci. 1450(1), 204–220. https://doi.org/10.1111/nyas.14136 (2019).
49. Moore, L. G. Measuring high-altitude adaptation. J. Appl. Physiol. 123(5), 1371–1385. https://doi.org/10.1152/japplphysiol.00321
.2017 (1985).
50. Murray, A. J., Montgomery, H. E., Feelisch, M., Grocott, M. P. W. & Martin, D. S. Metabolic adjustment to high-altitude hypoxia:
from genetic signals to physiological implications. Biochem. Soc. Trans. 46, 599–607. https://doi.org/10.1042/Bst20170502 (2018).
51. Zhang, Z. G. et al. Convergent evolution of rumen microbiomes in high-altitude mammals. Curr. Biol. 26, 1873–1879. https://doi.
org/10.1016/j.cub.2016.05.012 (2016).
52. Ding, X. Z. et al. Physiological insight into the high-altitude adaptations in domesticated yaks (Bos grunniens) along the Qinghai-
Tibetan Plateau altitudinal gradient. Livest. Sci. 162, 233–239. https://doi.org/10.1016/j.livsci.2014.01.012 (2014).
53. Schweizer, R. M. et al. Physiological and genomic evidence that selection on the transcription factor Epas1 has altered cardiovas-
cular function in high-altitude deer mice. PLoS Genet. 15, e1008420. https://doi.org/10.1371/journal.pgen.1008420 (2019).
54. Xuexue, L. et al. EPAS1 gain-of-function mutation contributes to high altitude adaptation in tibetan horses. Mol. Biol. Evol. 36(11),
2591–2603 (2019).
55. Al-Sweedan, S. A. & Alhaj, M. The effect of low altitude on blood count parameters. Hematol. Oncol. Stem Cell Ther. 5, 158–161.
https://doi.org/10.5144/1658-3876.2012.158 (2012).
56. Li, H. & Durbin, R. Fast and accurate short read alignment with Burrows–Wheeler transform. Bioinformatics 25, 1754–1760 (2009).
57. Li, H. et al. The sequence alignment/map format and SAMtools. Bioinformatics 25(16), 2078–2079 (2009).
58. Alkes, L. et al. Principal components analysis corrects for stratification in genome-wide association studies. Nat. Genet. 38, 904–909
(2006).
59. Kim, E. S. et al. Multiple genomic signatures of selection in goats and sheep indigenous to a hot arid environment. Heredity 116,
255–264 (2016).
60. Cummings, M. P. PHYLIP (Phylogeny Inference Package). In Bioinformatics and Computational Biology (2004)
61. Hu, X. J. et al. The genome landscape of tibetan sheep reveals adaptive introgression from Argali and the history of early human
settlements on the Qinghai-Tibetan plateau. Mol. Biol. Evol. 36(2), 283–303. https://doi.org/10.1093/molbev/msy208 (2019).
62. Tang, H., Peng, J., Wang, P. & Risch, N. J. Estimation of individual admixture: analytical and study design considerations. Genet.
Epidemiol. 28(4), 289–301 (2005).
Scientific Reports | (2021) 11:2466 | https://doi.org/10.1038/s41598-021-81932-y 10
Vol:.(1234567890)www.nature.com/scientificreports/
63. Purfield, D. C., Berry, D. P., McParland, S. & Bradley, D. G. Runs of homozygosity and population history in cattle. BMC Genet.
13(1), 1–11 (2012).
64. Li, H. & Durbin, R. Inference of human population history from individual whole-genome sequences. Nature 475, 493–496. https
://doi.org/10.1038/nature10231 (2011).
65. Liu, S. & Hansen, M. M. PSMC (pairwise sequentially Markovian coalescent) analysis of RAD (restriction site associated DNA)
sequencing data. Mol. Ecol. Resour. 17(4), 631–641. https://doi.org/10.1111/1755-0998.12606 (2017).
66. Zheng, Z. et al. The origin of domestication genes in goats. Sci Adv. 6(21), eaaz5216. https: //doi.org/10.1126/sciadv .aaz521 6 (2020).
67. Tang, H. et al. Estimation of individual admixture: analytical and study design considerations. Genet. Epidemiol. 28(4), 289–301
(2005).
68. Rubin, C. J. et al. Whole-genome resequencing reveals loci under selection during chicken domestication. Nature 464(7288), 587
(2010).
69. Weir, B. S. & Cockerham, C. C. Estimating F-statistics for the analysis of population structure. Evolution 38(6), 1358–1370 (1984).
70. Sabeti, P. C. et al. Genome-wide detection and characterization of positive selection in human populations. Nature 449, 913–918.
https://doi.org/10.1038/nature06250 (2007).
71. Rothammer, S., Seichter, D., Forster, M. & Medugorac, I. A genome-wide scan for signatures of differential artificial selection in
ten cattle breeds. BMC Genom. 14, 908. https://doi.org/10.1186/1471-2164-14-908 (2013).
72. Lawal, R. A. et al. Whole-genome resequencing of red junglefowl and indigenous village chicken reveal new insights on the genome
dynamics of the species. Front. Genet. 9, 264 (2018).
73. Bard, J., Yamazaki, K., Curran, M., Boyse, E. A. & Beauchamp, G. K. Effect of B2m gene disruption on MHC-determined odortypes.
Immunogenetics 51, 514–518. https://doi.org/10.1007/s002510000165 (2000).
74. Lin, S. D. et al. Copy number variation in SOX6 contributes to chicken muscle development. Genes Basel. 9, 1–42 (2018).
75. Jackson, H. E. et al. The role of Sox6 in zebrafish muscle fiber type specification. Skelet Muscle 5(1), 2 (2015).
76. Pevny, L. H. & Lovell-Badge, R. Sox genes find their feet. Curr. Opin. Genet. Dev. 7(3), 338–344 (1997).
77. Ivan, M. et al. HIFalpha targeted for VHL-mediated destruction by proline hydroxylation: implications for O2 sensing. Science
292, 464–468. https://doi.org/10.1126/science.1059817 (2001).
78. Ollerenshaw, M., Page, T., Hammonds, J. & Demaine, A. Polymorphisms in the hypoxia inducible factor-1alpha gene (HIF1A) are
associated with the renal cell carcinoma phenotype. Cancer Genet. Cytogen. 153, 122–126. https://doi.org/10.1016/j.cancergenc
yto.2004.01.014 (2004).
79. Erzurum, S. C. et al. Higher blood flow and circulating NO products offset high-altitude hypoxia among Tibetans. Proc. Natl.
Acad. Sci. U.S.A. 104(45), 17593–17598 (2007).
80. Kennedy, H. et al. Sudden cardiac death due to deficiency of the mitochondrial inorganic pyrophosphatase PPA2. Am. J. Hum.
Genet. 99(3), 674 (2016).
81. Pandey, P., Mohammad, G., Singh, Y. & Pasha, M. A. Polymorphisms and haplotype of ROCK2 associate with high altitude essential
hypertension in native high altitude Ladakhi Indian population: a preliminary study. Clin. Exp. Hypertens. 38, 238–244. https://
doi.org/10.3109/10641963.2015.1081231 (2016).
82. Zhang, Z. R. et al. Identification and association of the single nucleotide polymorphisms in calpain3 (CAPN3) gene with carcass
traits in chickens. BMC Genet. 10, 10. https://doi.org/10.1186/1471-2156-10-10 (2009).
83. Zhang, R., Wu, H. & Lian, Z. Bioinformatics analysis of evolutionary characteristics and biochemical structure of FGF5 gene in
sheep. Gene 702, 123–132. https://doi.org/10.1016/j.gene.2019.03.040 (2019).
84. Zhu, X. J. et al. MP-FGF signaling axis mediates Wnt-induced epidermal stratification in developing mammalian skin. PLoS Genet.
10(10), e1004687 (2014).
85. Lee, C. Y. et al. Hair growth is promoted by BeauTop via expression of EGF and FGF-7. Mol. Med. Rep. 17, 8047–8052. https://doi.
org/10.3892/mmr.2018.8917 (2018).
86. Li, W. R. et al. CRISPR/Cas9-mediated loss of FGF5 function increases wool staple length in sheep. FEBS J. 284, 2764–2773. https
://doi.org/10.1111/febs.14144(2017).
87. Hayes, B. J. et al. Genetic architecture of complex traits and accuracy of genomic prediction: coat color, milk-fat percentage, and
type in holstein cattle as contrasting model traits. PLoS Genet. 6(9), e1001139 (2010).
88. Moriwaki, K. et al. Deficiency of GMDS leads to escape from NK cell-mediated tumor surveillance through modulation of TRAIL
signaling. Gastroenterology 137(1), 188–19800 (2009).
89. Kawabe, K. et al. IL-12 inhibits glucocorticoid-induced T cell apoptosis by inducing GMEB1 and activating PI3K/Akt pathway.
Immunobiology 217, 118–123 (2012).
90. Santana, M. H. A. et al. A genomewide association mapping study using ultrasound-scanned information identifies potential
genomic regions and candidate genes affecting carcass traits in Nellore cattle. J. Anim. Breed. Genet. 132, 420–427. https://doi.
org/10.1111/jbg.12167(2015).
91. Graham, R. R. et al. Genetic variants near TNFAIP3 on 6q23 are associated with systemic lupus erythematosus. Nat. Genet. 40,
1059–1061. https://doi.org/10.1038/ng.200 (2008).
92. Jafarpour, F. et al. Comparative dynamics of 5-methylcytosine reprogramming and TET family expression during preimplantation
mammalian development in mouse and sheep. J. Theriogenol. 89, 86–96 (2017).
93. Teleman, A. A., Chen, Y. W. & Cohen, S. M. Drosophila melted modulates FOXO and TOR activity. Dev. Cell. 9, 271–281. https://
doi.org/10.1016/j.devcel.2005.07.004 (2005).
94. Zhou, Q. et al. Loss-of-function mutations in TNFAIP3 leading to A20 haploinsufficiency cause an early-onset autoinflammatory
disease. Nat. Genet. 48, 67–73. https://doi.org/10.1038/ng.3459 (2016).
95. Aksentijevich, I. & Zhou, Q. NF-kappaB pathway in autoinflammatory diseases: dysregulation of protein modifications by ubiquitin
defines a new category of autoinflammatory diseases. Front. Immunol. 8, 399. https://doi.org/10.3389/fimmu.2017.00399 (2017).
96. Tamura, K., Stecher, G., Peterson, D., Filipski, A. & Kumar, S. MEGA6: molecular evolutionary genetics analysis version 6.0. Mol.
Biol. Evol. 30, 2725–2729 (2013).
97. Kanehisa, M. & Goto, S. KEGG: kyoto encyclopedia of genes and genomes. Nucl. Acids Res. 28(1), 27–30. https://doi.org/10.1093/
nar/28.1.27 (2000).
98. Kanehisa, M. Toward understanding the origin and evolution of cellular organisms. Protein Sci. 28(11), 1947–1951. https://doi.
org/10.1002/pro.3715 (2019).
99. Kanehisa M, Furumichi M, Sato Y, Ishiguro-Watanabe M, Tanabe M. KEGG: integrating viruses and cellular organisms [published
online ahead of print, 2020 Oct 30]. Nucl. Acids Res. https://doi.org/10.1093/nar/gkaa970 (2020).
Acknowledgements
This research was supported by the project of national wool sheep industry technology system (CARS-39-01)
and the project of Agricultural Science and Technology Innovation Program of China (ASTIP-IAS01). Mwacharo
JM was supported by the CGIAR Research Program on Livestock (Livestock CRP) and accordingly, ICARDA
thanks the donors supporting the Livestock CRP.
Scientific Reports | (2021) 11:2466 | https://doi.org/10.1038/s41598-021-81932-y 11
Vol.:(0123456789)www.nature.com/scientificreports/
Author contributions
Q.J.Z. and Y.H.M. designed the study. Y.Y.Z., Y.L., X.L.X., Y.Y.D., M.J.M. and Q.J.Z. contributed to data interpreta-
tion and manuscript writing. L.Q.M., J.J.G. and Y.B.P. contributed to collection of samples and DNA extraction.
Y.Y.Z., A.D.A.M.A., G.S.Z., W.Q.W., W.J.G. and J.L.H. analysed the data. All authors commented on the manu-
script and read and approved the final version.
Competing interests
The authors declare no competing interests.
Additional information
Supplementary Information The online version contains supplementary material available at https://doi.
org/10.1038/s41598-021-81932-y.
Correspondence and requests for materials should be addressed to Y.M. or Q.Z.
Reprints and permissions information is available at www.nature.com/reprints.
Publisher’s note Springer Nature remains neutral with regard to jurisdictional claims in published maps and
institutional affiliations.
Open Access This article is licensed under a Creative Commons Attribution 4.0 International
License, which permits use, sharing, adaptation, distribution and reproduction in any medium or
format, as long as you give appropriate credit to the original author(s) and the source, provide a link to the
Creative Commons licence, and indicate if changes were made. The images or other third party material in this
article are included in the article’s Creative Commons licence, unless indicated otherwise in a credit line to the
material. If material is not included in the article’s Creative Commons licence and your intended use is not
permitted by statutory regulation or exceeds the permitted use, you will need to obtain permission directly from
the copyright holder. To view a copy of this licence, visit http://creativecommons.org/licenses/by/4.0/.
© The Author(s) 2021
Scientific Reports | (2021) 11:2466 | https://doi.org/10.1038/s41598-021-81932-y 12
Vol:.(1234567890)You can also read