Meta analysis of whole genome gene expression datasets assessing the effects of IDH1 and IDH2 mutations in isogenic disease models - Nature
←
→
Page content transcription
If your browser does not render page correctly, please read the page content below
www.nature.com/scientificreports
OPEN Meta‑analysis of whole‑genome
gene expression datasets assessing
the effects of IDH1 and IDH2
mutations in isogenic disease
models
Hans‑Juergen Schulten1*, Fatima Al‑Adwani1, Haneen A. Bin Saddeq2, Heba Alkhatabi1,2,
Nofe Alganmi1,3, Sajjad Karim1, Deema Hussein4, Khalid B. Al‑Ghamdi5, Awatif Jamal6,
Jaudah Al‑Maghrabi6,7 & Mohammed H. Al‑Qahtani1
Mutations in isocitrate dehydrogenase 1 (IDH1) and IDH2 are oncogenic drivers to a variable extent in
several tumors, including gliomas, acute myeloid leukemia (AML), cholangiocarcinoma, melanoma,
and thyroid carcinoma. The pathobiological effects of these mutations vary considerably, impeding
the identification of common expression profiles. We performed an expression meta-analysis between
IDH-mutant (IDHmut) and IDH-wild-type (IDHwt) conditions in six human and mouse isogenic disease
models. The datasets included colon cancer cells, glioma cells, heart tissue, hepatoblasts, and
neural stem cells. Among differentially expressed genes (DEGs), serine protease 23 (PRSS23) was
upregulated in four datasets, i.e., in human colon carcinoma cells, mouse heart tissue, mouse neural
stem cells, and human glioma cells. Carbonic anhydrase 2 (CA2) and prolyl 3-hydroxylase 2 (P3H2)
were upregulated in three datasets, and SOX2 overlapping transcript (SOX2-OT) was downregulated
in three datasets. The most significantly overrepresented protein class was termed intercellular signal
molecules. An additional DEG set contained genes that were both up- and downregulated in different
datasets and included oxidases and extracellular matrix structural proteins as the most significantly
overrepresented protein classes. In conclusion, this meta-analysis provides a comprehensive overview
of the expression effects of IDH mutations shared between different isogenic disease models. The
generated dataset includes biomarkers, e.g., PRSS23 that may gain relevance for further research or
clinical applications in IDHmut tumors.
Abbreviations
α-KG α-Ketoglutarate
AML Acute myeloid leukemia
ANOVA Analysis of variance
CAC Citrate acid cycle
CEL file Affymetrix probe results file
CpG Cytosine-phosphate-guanine
DEG Differentially expressed gene
EMT Epithelial-to-mesenchymal transition
1
Center of Excellence in Genomic Medicine Research, Department of Medical Laboratory Technology, Faculty of
Applied Medical Science, King Abdulaziz University, P.O. Box 80216, Jeddah 21589, Saudi Arabia. 2Department
of Medical Laboratory Technology, Faculty of Applied Medical Science, King Abdulaziz University, Jeddah, Saudi
Arabia. 3Department of Computer Science, King Abdulaziz University, Jeddah, Saudi Arabia. 4King Fahad Medical
Research Center, Department of Medical Laboratory Technology, Faculty of Applied Medical Science, King
Abdulaziz University, Jeddah, Saudi Arabia. 5Department of Otolaryngology, Head and Neck Surgery, Faculty
of Medicine, King Abdulaziz University, Jeddah, Saudi Arabia. 6Department of Pathology, Faculty of Medicine,
King Abdulaziz University, Jeddah, Saudi Arabia. 7Department of Pathology, King Faisal Specialist Hospital and
Research Center, Jeddah, Saudi Arabia. *email: hschult2@msn.com
Scientific Reports | (2022) 12:57 | https://doi.org/10.1038/s41598-021-04214-7 1
Vol.:(0123456789)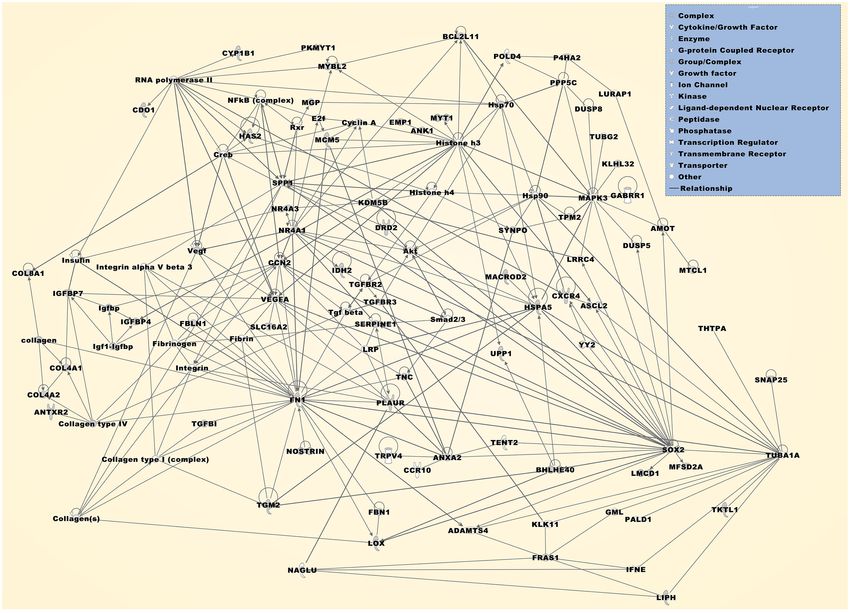
www.nature.com/scientificreports/
FC Fold change
FDR False discovery rate
GBM Glioblastoma multiforme
G-CIMP Glioma CpG island methylator phenotype
GEO Gene Expression Omnibus
GO Gene ontology
HG Hydroxyglutarate
IDH Isocitrate dehydrogenase
IPA Ingenuity Pathway Analysis
LIMMA Linear models for microarray data
lncRNA Long non-coding RNA
mut Mutant
RNA-seq RNA-sequencing
SRA Sequence Read Archive
TAC Transcriptome Analysis Console
wt Wild-type
Isocitrate dehydrogenases (IDHs) consist of three isozymes, i.e., IDH1, IDH2, and IDH3, which are key meta-
bolic enzymes catalyzing the conversion of isocitrate to α-ketoglutarate (α-KG) via oxidative decarboxylation.
IDH1 is located in the cytosol and peroxisomes, whereas IDH2 and IDH3 are located in the mitochondria. As
components of the citrate acid cycle (CAC), IDH1 and IDH2 use NADP + as a coenzyme, whereas IDH3 uses
NAD + as a coenzyme. The generated NADPH and NADH are reducing equivalents necessary for diverse meta-
bolic and physiological processes.
Recurrent IDH1 mutations affecting codon R132 were initially identified in glioblastoma multiforme (GBM),
where the mutation showed a significant prevalence in secondary G BM1. Subsequently, IDH2 mutations affect-
ing codon R172, which is homologous to IDH1 R132, were detected in WHO grade II and III astrocytomas and
oligodendrogliomas as well as in secondary G BM2. Virtually all IDH1 mutations in gliomas affect codon R132,
which in the vast majority (> 85%) is a heterozygous missense mutation of arginine to histidine (R132H)3. Other
less frequent IDH1 R132 mutations leading to different amino acid replacements, including R132C, R132G,
R132G, and R132L, have been described in a number of solid and hematopoietic neoplasms and related patho-
genic processes4,5. In anaplastic thyroid carcinoma, IDH1 mutations are relatively common and affect the highly
conserved residue G1236,7. In acute myeloid leukemia (AML), IDH2 mutations are more prevalent than IDH1
mutations and usually affect codon R140. No oncogenic IDH3 mutations have been reported so far.
The oncogenic capacity of IDH1/2 mutations is conferred by a catalytically active dimer, most likely consist-
ing of an IDH-mutant (IDHmut) and an IDH-wild-type (IDHwt) heterodimer, which reduces α-KG to D-2-hy-
droxyglutarate (D-2HG)8,9. D-2HG is an oncometabolite that induces diverse metabolic and cellular effects,
e.g., affecting CAC, inhibiting α-KG-dependent enzymes, such as histone and DNA demethylases, and blocking
transcriptionally regulated cellular differentiation4,10–12. In particular, a DNA methylation profile is induced that
varies between different I DHmut tumor types. For example, gliomas exhibit a DNA methylation profile, referred
to as a glioma cytosine-phosphate-guanine (CpG) island methylator phenotype (G-CIMP), which differs from
those in AML, cholangiocarcinoma, and melanoma13–15. The discrepancies observed in the DNA methylation
profiles of the investigated tumor types are also observed in the transcriptional profiles impeding the ability to
assess common effects of IDH mutations on the transcriptome. Research on epigenetic and transcriptional effects
of IDH mutations in cancer is ongoing, e.g., a recent study reported that transcriptional alterations in IDH1mut
glioma samples are primarily caused by chromatin-based DNA methylation-independent m echanisms16.
IDH mutations represent a valuable target for cancer treatment because they are commonly associated with
early oncogenesis and are retained through later cancer stages. However, the success of therapy strategies varies
between different IDHmut tumor types, and alternative treatment options, such as the application of glutaminase
inhibitors, are assessed17–19. Isogenic disease models have become a valuable method in cancer research and drug
discovery for studying the effects of a particular gene mutation in comparison to otherwise genetically identical
cells20. In particular, isogenic disease models have been repeatedly used to determine the transcriptional effects
of IDH mutations under nearly unbiased conditions. We therefore performed a meta-analysis on datasets that
compared expression profiles between I DHmut and IDHwt isogenic disease models with the aim of identifying
biomarkers that have prospects for research or clinical applications.
Results
Compilation of datasets. The meta-analysis included six studies that were extracted from a database
search and that compared the expression profiles between IDH1/2mut and IDH1/2wt conditions in isogenic dis-
ease models (Table 1). Four studies utilized microarrays, one used BeadChips, and one used RNA-sequencing
(RNA-seq) to generate sets of differentially expressed genes (DEGs). In two studies, expression experiments were
performed using human cell lines. In four studies, microarray expression experiments were performed using
mouse cells/cell lines, mouse tissues or tumors. DEGs were determined based on a false discovery rate (FDR)-
adjusted p-value ≤ 0.05 and a fold change (FC) ≥ 1.5.
Genes either up‑ or downregulated in the meta‑analysis dataset. The number of DEGs in the
individual datasets and the proportion of DEGs that were either up- or downregulated between at least two data-
sets varied considerably between the studies (Table 1, Fig. 1a). For example, in relation to the number of DEGs in
individual datasets, mouse glioma cells shared proportionally fewer genes while mouse neural stem cells shared
Scientific Reports | (2022) 12:57 | https://doi.org/10.1038/s41598-021-04214-7 2
Vol:.(1234567890)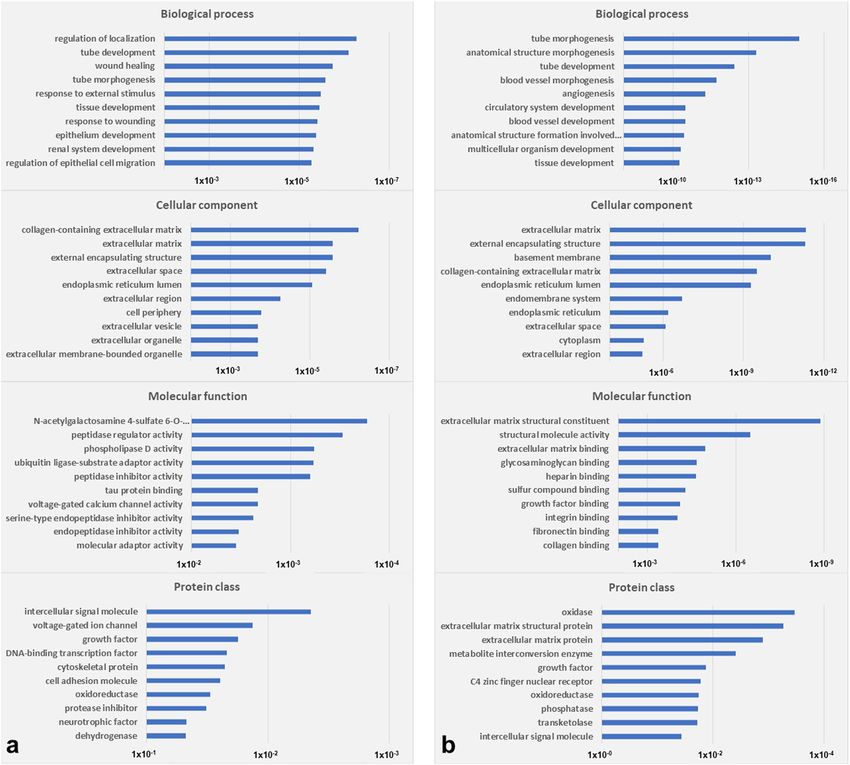
www.nature.com/scientificreports/
No. of samples
GEO dataset Cells/tissue origin IDHmut IDHwt Platform No. of D
EGsa Year/ref.
R132H wt Illumina MouseWG-6 v2.0 expression Bead-
GSE96979 Mouse glioma cells 3 IDH1 2 IDH1 250-500 201721
Chip
4 IDH1R132H
Affymetrix Human Genome U133 Plus 2.0
GSE41802 Human HCT116 colon carcinoma cellsb 2 IDH1R132C 2 IDH1/2wt > 500 201222
Array
4 IDH2R172K
GSE54838 Mouse heart tissue 4 IDH2R140Q 4 I DH2R172K 4 IDH2wt Affymetrix Mouse Gene 1.0 ST Array 250-500 201423
2 IDH1R132C 2 IDH1wt
GSE57002 Mouse hepatoblastsc Affymetrix Mouse Genome 430A 2.0 Array 50-250 201424
2 IDH2R172K 2 IDH2wt
R132H wt
GSE88828 Mouse neural stem cells 3 IDH1 3 IDH1 Affymetrix Mouse Gene 2.0 ST Array 50-250 201725
R132H
3 IDH1
GSE147223 Human U251 glioma cells 3 IDH1wt Illumina HiSeq 2500 250-500 202026
3 IDH1R132C
Table 1. Expression studies on isogenic disease models included in the meta-analysis. a For the four mouse
isogenic disease models, the percentage of mouse genes without corresponding human ortholog ranged
between approximately 8.6% (mouse hepatoblasts), 12.8% (mouse neural stem cells), 17.1% (mouse heart
tissue), and 18.7% (mouse glioma cells). bLow 2-HG expressing IDH2R140Q cells were excluded from analysis
and the respective parental cells were used as control. cThe batch grown on uncoated plates for hepatocyte
differentiation was excluded from analysis.
Figure 1. Bar charts illustrating the number of genes shared between at least two of the six analyzed DEG sets
of the isogenic disease models. (a) Genes, which are either up- (↑) or downregulated (↓) in different datasets. (b)
Genes, which are both up- and downregulated in different datasets.
proportionally more genes with the common DEG set. The shared dataset comprised 111 DEGs, of which 49%
were upregulated and 51% were downregulated (Table 2). Serine protease 23 (PRSS23) was upregulated in four
datasets, i.e., human colon carcinoma cells, mouse heart tissue, mouse neural stem cells, and human glioma cells.
Carbonic anhydrase 2 (CA2), and prolyl 3-hydroxylase 2 (P3H2) were upregulated in three datasets, whereas
SOX2 overlapping transcript (SOX2-OT) was downregulated in three datasets.
Ontology and pathway analysis of genes either up‑ or downregulated in the meta‑analysis
dataset. The most significantly overrepresented gene ontology (GO) annotations in the DEG set included
diverse morphogenic and developmental processes, extracellular matrix and organelle components, and molec-
ular activities in the categories of biological process, cellular component, and molecular function, respectively
(Fig. 2a). The most significantly overrepresented protein class (p = 2.04 × 10⁻³) was related to intercellular signal
Scientific Reports | (2022) 12:57 | https://doi.org/10.1038/s41598-021-04214-7 3
Vol.:(0123456789)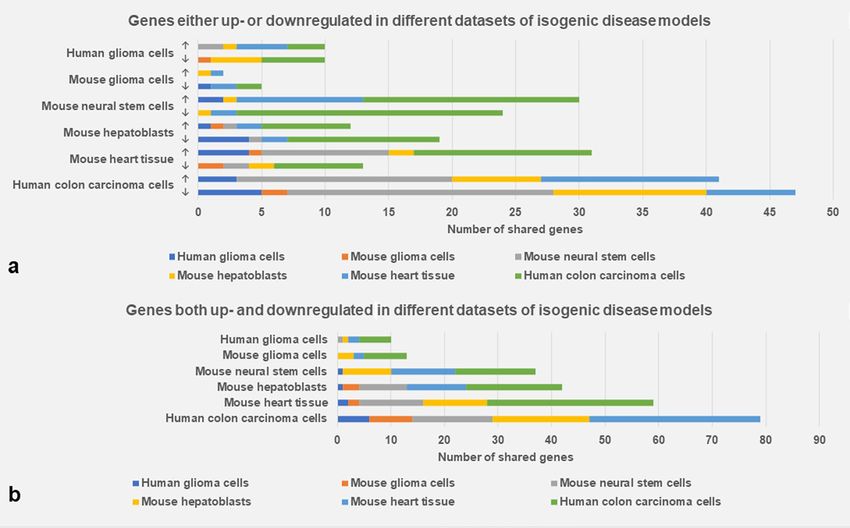
www.nature.com/scientificreports/
Deregulated genes shared between datasets of isogenic disease models
Genes either up- or downregulated
Upregulated genes
ARPC5, BDH1, BDNF, BMP4, CA2, CACHD1, CACNB4, CCDC80, CHST11, CHST15, CLU, CSF1, CYBRD1, DHX37, DPYSL5, EPAS1,
EPDR1, FAM189A1, FOXF1, FSCN1, GALNS, GIMAP6, GRK5, HMOX1, KBTBD8, KIF3C, LGR4, MAML2, MANEAL, MAP1A, MCAM,
MEST, MYBL1, OTUB2, P3H2, PLD1, PODXL, PRSS23, RCAN1, S100A2, SCARB1, SDC1, SEMA7A, SEPTIN11, SERINC2, SLC38A3,
SPRY1, STC1, STK17A, TBC1D4, TGFB2, WNT7A, ZBTB7C, ZGRF1
Downregulated genes
ABCA12, ARRDC4, AZGP1, CACNA2D1, CAPN6, Ccl9, CFB, COL3A1, COL6A3, CRYL1, CTNNA3, Cyp3a13 (related to human
CYP3A7),DHDH, DHRS7, ENPP2, F3, FBLIM1, GPC3, GPT2, HERPUD1, IFITM1, IFITM2, INAVA, KIZ, KLHDC1, KRT20, LARP1B,
LNCAROD, LONRF2, LRATD2, LRG1, MACROD1, MIA2, MMRN2, NT5DC2, PCDH10, PCDH7, PCOLCE, PDK1, PLEKHH1, PPL,
PPM1K, PRPH, PYCR1, RIMKLB, RPS6KA5, RTN2, SERPINH1, SLC7A11, SNCA, SOCS2, SOX2-OT, SPINT1, STRA6, TCAIM, TFPI,
TXNIP
Genes both up- and downregulated
ADGRG1, AGPAT5, AMOT, ANK1, ANKRD1, ANTXR2, ANXA2, APOL6, ARMH4, BCL2L11, BHLHE40, CCN2, CDC42EP3, CDO1,
CDS1, CELSR2, COL4A1, COL4A2, COL8A1, CTSH, CXCR4, CYP1B1, DNAH2, DRD2, DUSP5, ELFN2, EMP1, EPB41L4B, ERAP1,
FBLN1, FBN1, FN1, FRAS1, GCNT1, GPRC5B, HAS2, HDHD2, HIVEP2, HSPA5, IDH2, IGFBP4, IGFBP7, ISG20, KDELR3, KDM5B,
KLHL32, LIPH, LMCD1, LMNA, LOX, MACROD2, MCM5, MFSD2A, MGP, MTCL1, MYBL2, MYT1, NEBL, NOSTRIN, NR4A1, NR4A3,
NRG2, P4HA2, PDLIM3, PER3, PITPNC1, PKMYT1, PLAUR, PLPP2, PRODH, PRSS35, QSOX1, QSOX2, RGMA, SERPINE1, SH3GL3,
SLC16A2, SLC1A4, SLC25A28, SLC26A6, SLC2A1, SLC2A12, SNAP25, SOX2, SPP1, SYNPO, TEF, TGFBI, TGFBR2, TGFBR3, TGM2,
TKTL1, TNC, TPM2, TRNP1, UPP1, VEGFA, WDR90
Table 2. Meta-analysis DEG sets compiled from individual datasets of isogenic disease models.
molecules (Fig. 2a) and included BDNF, BMP4, RCAN1, SEMA7A, STC1, TGFB2, and WNT7A, all of which
were comparably upregulated under IDH1/2mut conditions. The most significantly overrepresented pathways
included extracellular matrix organization, collagen biosynthesis and modifying enzymes, and collagen for-
mation (Table 3). The most significantly associated networks were related to various diseases, conditions, and
cellular functions (Table 3). The top three networks were assembled with molecular relationship factors and
displayed as a merged network (Fig. 3). Further interpretation of the DEG set was performed with the upstream
regulator analysis tool (Supplementary Fig. 1). Activated upstream regulators that were predicted to be most
significantly associated with the DEG set comprised chorionic gonadotropin (CG) complex, cytokine WNT3A,
transmembrane receptor IL10RA, and transcription factor TP53. The transporter APOE and cytokine IFNG
were predicted to be the most significantly inhibited upstream regulators.
Genes both up‑ and downregulated in the meta‑analysis dataset. An additionally shared DEG
set comprised 98 genes that were both up- and downregulated in two or three individual datasets (Fig. 1b;
Table 2). Genes both up- and downregulated in three datasets included armadillo like helical domain containing
4 (ARMH4), cellular communication network factor 2 (CCN2), erythrocyte membrane protein band 4.1 like
4B (EPB41L4B), fibulin 1 (FBLN1), fibronectin 1 (FN1), G protein-coupled receptor class C group 5 member B
(GPRC5B), serine protease 35 (PRSS35), serpin family E member 1 (SERPINE1), solute carrier family 16 mem-
ber 2 (SLC16A2), secreted phosphoprotein 1 (SPP1), and synaptopodin (SYNPO).
Ontology and pathway analysis of genes both up‑ and downregulated in the meta‑analysis
dataset. The most significantly overrepresented GO annotations in the DEG set included diverse mor-
phogenic and developmental processes, extracellular matrix components, and various binding properties in
the categories of biological process, cellular component, and molecular function, respectively (Fig. 2b). The
most significantly overrepresented protein classes included oxidases (p = 3.36 × 10⁻⁴), comprising PRODH,
LOX, QSOX1, and QSOX2, and extracellular matrix structural proteins (p = 5.36 × 10⁻⁴) comprising COL4A1,
COL4A2, COL8A1, and FBN1 (Fig. 2b). The most significantly overrepresented pathways included integrin cell
surface interactions, extracellular matrix organization, and post-translational protein phosphorylation (Table.
3). The most significantly associated networks were related to various developmental processes, diseases, condi-
tions, and cellular functions (Table 3). The top three networks were assembled with molecular relationship fac-
tors and displayed as a merged network (Fig. 4).
Discussion
In this meta-analysis, we compared the expression profiles of different I DHmut vs. IDHwt isogenic disease models
to provide an overview of the nearly unbiased expression effects and the corresponding biological interpreta-
tions caused by the oncometabolite 2-HG. Although the statistical power of the IDHmut vs. IDHwt isogenic cell
model datasets is generally lower than that of larger datasets generated in clinical tumor cases, the number of
DEGs in proportion to the sample size is seemingly higher in isogenic cell m odels21. One likely explanation for
this fact is that individual expression profiles vary considerably within IDHmut tumors, similar to as in other
tumors, limiting the capacity to generate common expression profiles. However, in our meta-analysis, only a
relatively low number of DEGs were shared between individual datasets, which can be attributed to the fact
that different cancer and non-cancer isogenic disease models and experimental conditions were used as briefly
outlined as follows: Using colon carcinoma cells, in which IDH1/2 mutations were inserted via a recombinant
adeno-associated virus vector methodology, an epithelial-mesenchymal transition (EMT)-like phenotype and
Scientific Reports | (2022) 12:57 | https://doi.org/10.1038/s41598-021-04214-7 4
Vol:.(1234567890)www.nature.com/scientificreports/
Figure 2. GO annotations in the categories of biological process, cellular component, and molecular function,
and protein class ontology annotations. (a) Genes either up- or downregulated in the meta-analysis dataset
compiled from isogenic disease models. (b) Genes both up- and downregulated in the meta-analysis dataset
compiled from the isogenic disease models. A Fisher’s exact test p-value < 0.05 indicated statistical significance.
changes in gene expression and cell morphology were observed22. In transgenic mouse models with conditional
IDH2mut coding sequences, activation of I DH2mut expression at five weeks of age produced D-2HG leading to
cardiomyopathy and n eurodegeneration23. In hepatoblasts, isolated from mouse embryos at E14, a doxycy-
cline-inducible system led to IDH1/2mut gene e xpression24. The IDH1/2mut hepatoblasts, which were cultured on
collagen-coated plates, were refractory to differentiation. In neural stem cells derived from the cortex of mouse
embryos at E14.5, Idh1mut expression was induced via adenoviral-Cre-recombinase transduction25. In these
cells, neuronal lineage differentiation was blocked, although differentiation-promoting culture conditions were
utilized. Employing a mouse model that is susceptible to the development of gliomas, p53-deficient cells with
vector-integrated IDH1mut genes and cells containing a PDGF expression vector were coinjected into mice. The
induced PDGF-driven gliomas showed reduced immune infiltration in comparison to the corresponding IDH1wt
glioma mouse model21. In an in vitro study, glioma cells were infected with lentivirus IDH1mut coding sequences26.
Doxycycline-induced IDH1mut gene expression resulted in enhanced cell motility and morphological changes.
The heterogeneity between the six isogenic disease models is exemplarily demonstrated by the diverse classifica-
tion of the top pathways that were derived from the DEGs of each of the disease models (Supplementary Fig. 2).
The serine protease PRSS23 exhibits low tissue specificity in humans with the highest expression levels in
female genital tract tissue and smooth m uscle27. Studies in mice reported that PRSS23 is variably expressed in
the preimplantation uterus and is possibly involved in tissue remodeling in the ovary28,29. The expression of
PRSS23 has been detected in nuclei and extracellular vesicular exosomes where the protease is a component of
the human s ecretome30. Exosomal PRSS23 is, e.g., involved in cardiovascular disease where the protease likely
Scientific Reports | (2022) 12:57 | https://doi.org/10.1038/s41598-021-04214-7 5
Vol.:(0123456789)www.nature.com/scientificreports/
Category p-values Score
Top Reactome pathways
Genes either up- or downregulated
Extracellular matrix organization 3.96x10⁻⁵
Collagen biosynthesis and modifying enzymes 4.07x10⁻⁵
Collagen formation 1.46x10⁻⁴
Chondroitin sulfate/dermatan sulfate 1.81x10⁻⁴
NCAM signaling for neurite out-growth 3.53x10⁻⁴
Genes both up- and downregulated
Integrin cell surface interactions 2.7010x-7
Extracellular matrix organization 2.79x10⁻⁷
Post-translational protein phosphorylation 1.25x10⁻⁶
Regulation of insulin-like growth factor (IGF) transport and uptake by insulin-like growth factor binding proteins
3.18x10⁻⁶
(IGFBPs)
ECM proteoglycans 4.35x10⁻⁵
Top IPA networks
Genes either up- and downregulated
Cancer, cellular movement, organismal injury and abnormalities 48
Cancer, organismal injury and abnormalities, tissue morphology 33
Amino acid metabolism, molecular transport, small molecule biochemistry 28
Developmental disorder, hereditary disorder, ophthalmic disease 25
Nervous system development and function, tissue morphology, cell morphology 25
Genes both up- and downregulated
Cellular development, cellular growth and proliferation, cancer 50
Cardiovascular system development and function, organismal development, tissue development 44
Neurological disease, nucleic acid metabolism, small molecule biochemistry 26
Amino acid metabolism, small molecule biochemistry, cancer 19
Cell-to-cell signaling and interaction, cardiovascular system development and function, hereditary disorder 19
Table 3. Top pathways and networks compiled from the meta-analysis DEG sets.
mediates Snail/alpha‐smooth muscle actin signalling31. In cancer, PRSS23 is implicated in tumor progression, and
it was identified in a systematic network survey of a meta-analysis of breast cancer microarray expression data
as one of six genes involved in acquired lapatinib r esistance32. Promoter studies in breast cancer cells indicated
that PRSS23 is upregulated by estrogen receptor 1 (ESR1) and that its upregulated expression contributes to cell
proliferation33. shRNA-mediated knockdown of PRSS23 in a gastric cancer xenograft mouse model resulted
in a decrease in tumor volume and tumor w eight34. Further in vitro experiments revealed that PRSS23 knock-
down in gastric cancer cells apparently affected EIF2 pathway molecules. Based on a microarray study, PRSS23
was included in a gene classifier set that could discriminate papillary thyroid carcinoma from normal thyroid
samples35. In head and neck, renal, and pancreatic cancer, PRSS23 expression is significantly associated with an
unfavorable prognosis30. An epigenome-wide association study found, among several other DNA methylation
sites, a significant association between changes of DNA methylation of DNA methylation sites at the PRSS23
gene and having a smoking habit but found no significant association with risk for lung cancer36. The BioGRID
database currently curates about 50 PRSS23 interactors, among which actin and actin-related proteins constitute
the most overrepresented PANTHER protein class (p-value = 3 × 10⁻³) (Supplementary Fig. 3).
Cytosolic CA2 is the physiologically predominant CA isoform and is known to interact with various acid/
base transporters37. These interactions are predicted to promote high glycolytic activity and cell proliferation
in tumors. In lung cancer xenograft mouse models, shRNA-mediated knockdown of CA2 impaired tumor cell
proliferation and angiogenesis and induced a poptosis38. Pharmacological studies exploring CA2 inhibitors are
pursued to develop therapeutic options for the treatment of various conditions including cancer39. P3H fam-
ily members consist of three isoenzymes in vertebrates. From a knockout study on P3H2 in a mouse embryonal
carcinoma cell line, it can be presumed that the enzyme is the major posttranslational modifier of type IV col-
lagen with 3-hydroxyproline, which is of significance for interactions of type IV collagen with other m olecules40.
High P3H2 expression in different parts of the CNS, gastrointestinal tract, and some other tissues has been
reported; however, the enzyme exhibits no prognostic significance in cancer and reveals only weak-to-moderate
staining in most cancer tissues30. The long non-coding RNA (lncRNA) SOX2-OT consists of several splice vari-
ants. SOX2, located in an intron of SOX2-OT, is transcribed in the same orientation as SOX2-OT and both are
intensely expressed in embryonic stem cells41. SOX2-OT is implicated in neuronal and tumor development
and progression. A meta-analysis of cancer datasets indicated that cancers with elevated SOX2-OT expression
are significantly associated with unfavorable prognostic factors42. In two cervical cancer cell lines, a SOX2-OT
transcript variant promoted cell growth, migration and invasion of the cells, indicating that the lncRNA may
constitute a practical biomarker for cervical c ancer43. However, lower expression of SOX2-OT was observed in
Scientific Reports | (2022) 12:57 | https://doi.org/10.1038/s41598-021-04214-7 6
Vol:.(1234567890)www.nature.com/scientificreports/
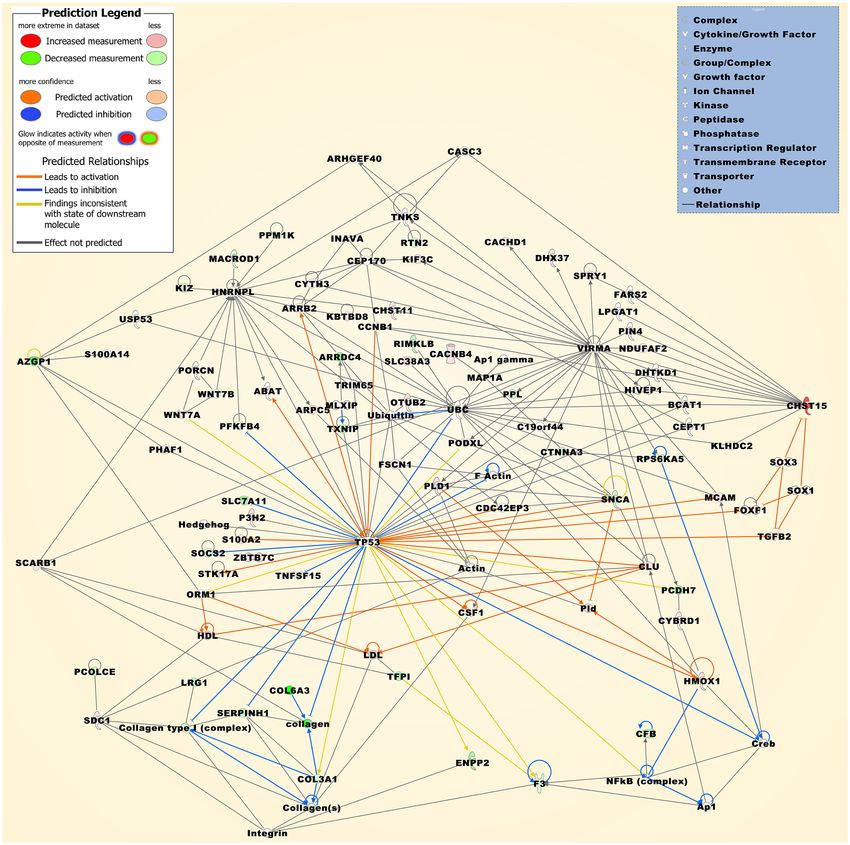
Figure 3. The merged network is compiled from the top three networks that were most significantly
associated with the DEGs, which were either up- or downregulated in at least two individual datasets (Table 3).
Upregulated molecules include ARPC5, CACHD1, CACNB4, CHST11, CHST15, CLU, CSF1, CYBRD1,
DHX37, FOXF1, FSCN1, HMOX1, KBTBD8, KIF3C, MAP1A, MCAM, OTUB2, PLD1, PODXL, S100A2,
SCARB1, SDC1, SLC38A3, SPRY1, STK17A, TGFB2, WNT7A, and ZBTB7C. Downregulated molecules include
ARRDC4, AZGP1, CFB, COL3A1, COL6A3, CTNNA3, ENPP2, F3, INAVA, KIZ, LRG1, MACROD1, P3H2,
PCDH7, PCOLCE, PPL, PPM1K, RIMKLB, RPS6KA5, RTN2, SERPINH1, SLC7A11, SNCA, SOCS2, TFPI, and
TXNIP. Molecular relationship factors were added from the Ingenuity knowledge base comprising ABAT, Actin,
Ap1, Ap1 gamma, ARHGEF40, ARRB2, BCAT1, C19orf44, CASC3, CCNB1, CDC42EP3, CEP170, CEPT1,
collagen, Collagen type I (complex), Collagen(s), Creb, CYTH3, DHTKD1, F Actin, FARS2, HDL, Hedgehog,
HIVEP1, HNRNPL, Integrin, KLHDC2, LDL, LPGAT1, MLXIP, NDUFAF2, NFkB (complex), ORM1, PFKFB4,
PHAF1, PIN4, Pld, PORCN, S100A14, SOX1, SOX3, TNFSF15, TNKS, TP53, TRIM65, UBC, Ubiquitin, USP53,
VIRMA, and WNT7B. The molecule activity predictor was implemented to display further molecular effects as
itemized in the prediction legend.
Scientific Reports | (2022) 12:57 | https://doi.org/10.1038/s41598-021-04214-7 7
Vol.:(0123456789)www.nature.com/scientificreports/
Figure 4. The merged network is compiled from the top three networks that were most significantly
associated with the DEGs, which were both up- and downregulated in at least two individual datasets (Table 3).
Deregulated molecules comprise AMOT, ANK1, ANTXR2, ANXA2, BCL2L11, BHLHE40, CCN2, CDO1,
COL4A1, COL4A2, COL8A1, CXCR4, CYP1B1, DRD2, DUSP5, EMP1, FBLN1, FBN1, FN1, FRAS1, HAS2,
HSPA5, IDH2, IGFBP4, IGFBP7, KDM5B, KLHL32, LIPH, LMCD1, LOX, MACROD2, MCM5, MFSD2A,
MGP, MTCL1, MYBL2, MYT1, NOSTRIN, NR4A1, NR4A3, P4HA2, PKMYT1, PLAUR, SERPINE1, SLC16A2,
SNAP25, SOX2, SPP1, SYNPO, TGFBI, TGFBR2, TGFBR3, TGM2, TKTL1, TNC, TPM2, UPP1, and VEGFA.
Molecular relationship factors were added from the Ingenuity knowledge base comprising ADAMTS4, Akt,
ASCL2, CCR10, collagen, Collagen type I (complex), Collagen type IV, Collagen(s), Creb, Cyclin A, DUSP8, E2f,
Fibrin, Fibrinogen, GABRR1, GML, Histone h3, Histone h4, Hsp70, Hsp90, IFNE, Igf1-Igfbp, Igfbp, Insulin,
Integrin, Integrin alpha V beta 3, KLK11, LRP, LRRC4, LURAP1, MAPK3, NAGLU, NFkB (complex), PALD1,
POLD4, PPP5C, RNA polymerase II, Rxr, Smad2/3, TENT2, Tgf beta, THTPA, TRPV4, TUBA1A, TUBG2,
Vegf, and YY2.
gastric tumors compared to matched normal gastric samples, and lower expression was observed in high-grade
rather than low-grade gastric t umors44.
Furthermore, we assessed the similarity of expression profiles between the either up- or downregulated gene
set from our meta-analysis with expression profiles of two publicly accessible datasets of low grade gliomas and
chondrosarcomas, enabling us to compare I DHmut with IDHwt cancer samples45–47. The Venn diagram demon-
strates that only a few DEGs are shared between our meta-analysis dataset and both clinical datasets (Supple-
mentary Fig. 4). One likely explanation for this fact is that primary expression effects of an IDH mutation that
emerge over days or weeks are measured in isogenic disease models, whereas clinical IDHmut tumors evolve over
months or years and acquire multiple other genomic alterations before they become clinically evident.
In summary, we generated a set of DEGs and biomarkers associated with IDHmut status in isogenic disease
models. Extracellular proteins and intercellular signaling are among the notable features of I DHmut conditions.
Biomarkers associated with various I DHmut conditions, including the less characterized protease PRSS23, have
considerable prospects for further research or clinical applications of IDHmut cancers and related diseases.
Scientific Reports | (2022) 12:57 | https://doi.org/10.1038/s41598-021-04214-7 8
Vol:.(1234567890)www.nature.com/scientificreports/
Methods
Compilation of datasets from IDH1/2mut vs. IDH1/2wt isogenic disease models. Using the search
term IDH to query the Gene Expression Omnibus (GEO), we designated 114 case series, out of which we iden-
tified seven whole-genome gene expression datasets derived from human and mouse isogenic disease models
that compared IDH1/2mut with IDH1/2wt samples48. One dataset without publication reference with detailed
information was deselected. We then selected the remaining six studies for further analysis. These studies con-
tained at least biologically IDH1/2mut triplicates and biologically IDH1/2wt duplicates and the datasets of each
of the studies were sufficiently significant to compile a DEG set based on an FDR-adjusted p-value ≤ 0.05 and
an FC ≥ 1.5. In studies that employed an isogenic disease model with different IDH1/2 mutations, the raw data-
sets of the different IDH1/2 mutations were pooled and processed as a single IDH1/2 mutation dataset. The
generated meta-analysis dataset includes GEO submissions GSE4180222, GSE5483823, GSE5700224, GSE8882825,
GSE9697921, and GSE14722326. Using the same above-quoted search strategy, no additional datasets were iden-
tified in another publicly accessible repository for high-throughput functional genomics experiments49. The
database repositories were essentially interrogated in November 2020.
Generation of DEG sets. For four microarray GEO datasets, the binary CEL files comprising the inten-
sity calculations were imported into Transcriptome Analysis Console (TAC) version 4.0.2.15 (Thermo Fisher
Scientific, Waltham, MA). TAC includes the LIMMA (linear models for microarray data) statistical package
from Bioconductor50. The binary CEL files were normalized in TAC and files of differentially expressed probe
sets were compiled using eBayes correction in ANOVA. For the study utilizing the expression BeadChips, the
normalized dataset was analyzed using the NetworkAnalyst 3.0 platform, which employs LIMMA statistics to
generate differentially expressed probe s ets51. For genes with more than one probe set in a dataset, the probe set
with the highest FC was selected for further analysis; however, genes, with both significantly up- and downregu-
lated probe sets in the same dataset, were excluded from further analysis. For the RNA-seq dataset, the publicly
accessible Sequence Read Archive (SRA) datasets were downloaded from the NCBI resource52. We aligned the
RNA-seq reads to the human reference genome assembly GRCh37 (hg19), using STAR aligner53. Then, the R
package DESeq2 was used to normalize count data, remove outliers, determine filtering thresholds, and find
genes that were significantly differentially expressed between the IDH1mut and IDH1wt groups54. Computation
of the RNA-seq dataset was supported by the University High Performance Computing (Aziz Supercomputer)
Center (http://hpc.kau.edu.sa). Mouse Genome Informatics (MGI), Ensembl release 101, BioMart software, and
HUGO Gene Nomenclature Committee (HGNC) resources were employed to update gene IDs and/or convert
mouse gene IDs to human gene IDs55–58. To illustrate intersecting and non-intersecting genes between the either
up- or downregulated gene set of our meta-analysis and external datasets, a web-based Venn diagram tool was
employed (http://bioinformatics.psb.ugent.be/webtools/Venn/).
Ontology and pathway analysis. For further analysis of DEGs, which were based on an FDR-adjusted
p-value ≤ 0.05 and an FC ≥ 1.5, the statistical overrepresentation test of the GO program PANTHER v. 16.0 was
employed to interrogate annotation datasets in the categories of biological process, cellular component, molecu-
lar function, protein classes, and Reactome pathways59. The PANTHER protein class ontology comprises com-
monly used classes of protein functions. The Reactome pathway analysis specifies the biological relationships
between interacting molecules such as nucleic acids, proteins, and compounds. For all annotation datasets, a
Fisher’s exact test p-value < 0.05 indicated statistical significance. The BioGRID build 4.1 database was queried
for protein interactors60. BioGRID curates protein, genetic and chemical interactions from various biomedical
studies and datasets. The Ingenuity Pathway Analysis (IPA) software v. 68,752,261 (Qiagen, Hilden, Germany)
was employed for further multifactorial interpretation of the gene sets. IPA utilizes the curated Ingenuity knowl-
edge base as a reference dataset to interfere molecular relationships. Fisher’s exact test p-values indicated the
significance of associations between analyzed dataset molecules and functional frameworks prebuilt or gener-
ated de novo by IPA. The molecule activity predictor was applied to predict expression effects/coherence of the
expression effects of a molecule on other network molecules. Direct molecular relationships were used to survey
the significance of fit, indicated as a score value, between molecules of uploaded gene sets and networks associ-
ated with specific functions or diseases. Direct and indirect molecular relationships were used for upstream
regulator network analysis to investigate how upstream regulators affect differences in target gene expression. A
z-score value indicates the activation/inhibition state of an upstream regulator.
Data availability
The raw datasets analyzed in the study are available at the GEO repository.
Received: 22 December 2020; Accepted: 16 December 2021
References
1. Parsons, D. W. et al. An integrated genomic analysis of human glioblastoma multiforme. Science (New York, N. Y.) 321, 1807–1812.
https://doi.org/10.1126/science.1164382 (2008).
2. Yan, H. et al. IDH1 and IDH2 mutations in gliomas. N. Engl. J. Med. 360, 765–773. https://d oi.o
rg/1 0.1 056/N
EJMoa 08087 10 (2009).
3. Watanabe, T., Nobusawa, S., Kleihues, P. & Ohgaki, H. IDH1 mutations are early events in the development of astrocytomas and
oligodendrogliomas. Am. J. Pathol. 174, 1149–1153. https://doi.org/10.2353/ajpath.2009.080958 (2009).
4. Dang, L., Yen, K. & Attar, E. C. IDH mutations in cancer and progress toward development of targeted therapeutics. Ann. Oncol.
Off. J. Eur. Soc. Med. Oncol. 27, 599–608. https://doi.org/10.1093/annonc/mdw013 (2016).
Scientific Reports | (2022) 12:57 | https://doi.org/10.1038/s41598-021-04214-7 9
Vol.:(0123456789)www.nature.com/scientificreports/
5. Hartman, D. J. et al. Isocitrate dehydrogenase-1 is mutated in inflammatory bowel disease-associated intestinal adenocarcinoma
with low-grade tubuloglandular histology but not in sporadic intestinal adenocarcinoma. Am. J. Surg. Pathol. 38, 1147–1156.
https://doi.org/10.1097/pas.0000000000000239 (2014).
6. Murugan, A. K., Bojdani, E. & Xing, M. Identification and functional characterization of isocitrate dehydrogenase 1 (IDH1) muta-
tions in thyroid cancer. Biochem. Biophys. Res. Commun. 393, 555–559. https://doi.org/10.1016/j.bbrc.2010.02.095 (2010).
7. Xing, M. Molecular pathogenesis and mechanisms of thyroid cancer. Nat. Rev. Cancer 13, 184–199. https://doi.org/10.1038/nrc34
31 (2013).
8. Golub, D. et al. Mutant isocitrate dehydrogenase inhibitors as targeted cancer therapeutics. Front. Oncol. 9, 417. https://doi.org/
10.3389/fonc.2019.00417 (2019).
9. Han, S. et al. IDH mutation in glioma: Molecular mechanisms and potential therapeutic targets. Br. J. Cancer 122, 1580–1589.
https://doi.org/10.1038/s41416-020-0814-x (2020).
10. Rakheja, D., Medeiros, L. J., Bevan, S. & Chen, W. The emerging role of d-2-hydroxyglutarate as an oncometabolite in hematol-
ymphoid and central nervous system neoplasms. Front. Oncol. 3, 169. https://doi.org/10.3389/fonc.2013.00169 (2013).
11. Schvartzman, J. M., Reuter, V. P., Koche, R. P. & Thompson, C. B. 2-hydroxyglutarate inhibits MyoD-mediated differentiation by
preventing H3K9 demethylation. Proc. Natl. Acad. Sci. U.S.A. 116, 12851–12856. https://d oi.o
rg/1 0.1 073/p nas.1 81766 2116 (2019).
12. Reitman, Z. J. et al. Profiling the effects of isocitrate dehydrogenase 1 and 2 mutations on the cellular metabolome. Proc. Natl.
Acad. Sci. U.S.A. 108, 3270–3275. https://doi.org/10.1073/pnas.1019393108 (2011).
13. Unruh, D. et al. Methylation and transcription patterns are distinct in IDH mutant gliomas compared to other IDH mutant cancers.
Sci. Rep. 9, 8946. https://doi.org/10.1038/s41598-019-45346-1 (2019).
14. Turcan, S. et al. IDH1 mutation is sufficient to establish the glioma hypermethylator phenotype. Nature 483, 479–483. https://doi.
org/10.1038/nature10866 (2012).
15. Malta, T. M. et al. Glioma CpG island methylator phenotype (G-CIMP): Biological and clinical implications. Neuro Oncol. 20,
608–620. https://doi.org/10.1093/neuonc/nox183 (2018).
16. Court, F. et al. Transcriptional alterations in glioma result primarily from DNA methylation-independent mechanisms. Genome
Res. 29, 1605–1621. https://doi.org/10.1101/gr.249219.119 (2019).
17. Waitkus, M. S., Diplas, B. H. & Yan, H. Biological role and therapeutic potential of IDH mutations in cancer. Cancer Cell 34,
186–195. https://doi.org/10.1016/j.ccell.2018.04.011 (2018).
18. Seltzer, M. J. et al. Inhibition of glutaminase preferentially slows growth of glioma cells with mutant IDH1. Can. Res. 70, 8981–8987.
https://doi.org/10.1158/0008-5472.Can-10-1666 (2010).
19. Kaminska, B., Czapski, B., Guzik, R., Król, S. K. & Gielniewski, B. Consequences of IDH1/2 mutations in gliomas and an assessment
of inhibitors targeting mutated IDH proteins. Molecules (Basel, Switzerland) 24, 968. https://doi.org/10.3390/molecules24050968
(2019).
20. Torrance, C. J., Agrawal, V., Vogelstein, B. & Kinzler, K. W. Use of isogenic human cancer cells for high-throughput screening and
drug discovery. Nat. Biotechnol. 19, 940–945. https://doi.org/10.1038/nbt1001-940 (2001).
21. Amankulor, N. M. et al. Mutant IDH1 regulates the tumor-associated immune system in gliomas. Genes Dev. 31, 774–786. https://
doi.org/10.1101/gad.294991.116 (2017).
22. Grassian, A. R. et al. Isocitrate dehydrogenase (IDH) mutations promote a reversible ZEB1/microRNA (miR)-200-dependent
epithelial-mesenchymal transition (EMT). J. Biol. Chem. 287, 42180–42194. https://doi.org/10.1074/jbc.M112.417832 (2012).
23. Akbay, E. A. et al. D-2-hydroxyglutarate produced by mutant IDH2 causes cardiomyopathy and neurodegeneration in mice. Genes
Dev. 28, 479–490. https://doi.org/10.1101/gad.231233.113 (2014).
24. Saha, S. K. et al. Mutant IDH inhibits HNF-4α to block hepatocyte differentiation and promote biliary cancer. Nature 513, 110–114.
https://doi.org/10.1038/nature13441 (2014).
25. Pirozzi, C. J. et al. Mutant IDH1 disrupts the mouse subventricular zone and alters brain tumor progression. Mol. Cancer Res. MCR
15, 507–520. https://doi.org/10.1158/1541-7786.Mcr-16-0485 (2017).
26. Liu, Y. et al. mTORC2/Rac1 pathway predisposes cancer aggressiveness in IDH1-mutated glioma. Cancers 12, 787 (2020).
27. Thul, P. J. et al. A subcellular map of the human proteome. Science (New York, N. Y.) https://d oi.o
rg/1 0.1 126/s cienc e.a al332 1 (2017).
28. Diao, H., Xiao, S., Li, R., Zhao, F. & Ye, X. Distinct spatiotemporal expression of serine proteases Prss23 and Prss35 in periimplan-
tation mouse uterus and dispensable function of Prss35 in fertility. PLoS ONE 8, e56757. https://doi.org/10.1371/journal.pone.
0056757 (2013).
29. Wahlberg, P., Nylander, A., Ahlskog, N., Liu, K. & Ny, T. Expression and localization of the serine proteases high-temperature
requirement factor A1, serine protease 23, and serine protease 35 in the mouse ovary. Endocrinology 149, 5070–5077. https://doi.
org/10.1210/en.2007-1736 (2008).
30. Uhlen, M. et al. A pathology atlas of the human cancer transcriptome. Science 357, 2507. https://doi.org/10.1126/science.aan25
07 (2017).
31. Wang, Z. et al. Exosomal microRNA-1246 from human umbilical cord mesenchymal stem cells potentiates myocardial angiogenesis
in chronic heart failure. Cell Biol. Int. https://doi.org/10.1002/cbin.11664 (2021).
32. Lee, Y. S. et al. Identification of novel therapeutic target genes in acquired lapatinib-resistant breast cancer by integrative meta-
analysis. Tumour Biol. J. Int. Soc. Oncodevelop. Biol. Med. 37, 2285–2297. https://doi.org/10.1007/s13277-015-4033-7 (2016).
33. Chan, H. S. et al. Serine protease PRSS23 is upregulated by estrogen receptor α and associated with proliferation of breast cancer
cells. PLoS ONE 7, e30397. https://doi.org/10.1371/journal.pone.0030397 (2012).
34. Han, B. et al. PRSS23 knockdown inhibits gastric tumorigenesis through EIF2 signaling. Pharmacol. Res. 142, 50–57. https://doi.
org/10.1016/j.phrs.2019.02.008 (2019).
35. Jarzab, B. et al. Gene expression profile of papillary thyroid cancer: Sources of variability and diagnostic implications. Can. Res.
65, 1587–1597. https://doi.org/10.1158/0008-5472.Can-04-3078 (2005).
36. Sun, Y. Q. et al. Assessing the role of genome-wide DNA methylation between smoking and risk of lung cancer using repeated
measurements: The HUNT study. Int. J. Epidemiol. https://doi.org/10.1093/ije/dyab044 (2021).
37. Becker, H. M. & Deitmer, J. W. Transport metabolons and acid/base balance in tumor cells. Cancers 12, 899. https://doi.org/10.
3390/cancers12040899 (2020).
38. Zhou, Y., Mokhtari, R. B., Pan, J., Cutz, E. & Yeger, H. Carbonic anhydrase II mediates malignant behavior of pulmonary neuroen-
docrine tumors. Am. J. Respir. Cell Mol. Biol. 52, 183–192. https://doi.org/10.1165/rcmb.2014-0054OC (2015).
39. Akin, S. et al. Synthesis of 1,2,4-triazole-5-on derivatives and determination of carbonic anhydrase II isoenzyme inhibition effects.
Bioorg. Chem. 83, 170–179. https://doi.org/10.1016/j.bioorg.2018.10.042 (2019).
40. Montgomery, N. T., Zientek, K. D., Pokidysheva, E. N. & Bächinger, H. P. Post-translational modification of type IV collagen with
3-hydroxyproline affects its interactions with glycoprotein VI and nidogens 1 and 2. J. Biol. Chem. 293, 5987–5999. https://doi.
org/10.1074/jbc.RA117.000406 (2018).
41. Shahryari, A., Jazi, M. S., Samaei, N. M. & Mowla, S. J. Long non-coding RNA SOX2OT: Expression signature, splicing patterns,
and emerging roles in pluripotency and tumorigenesis. Front. Genet. 6, 196. https://doi.org/10.3389/fgene.2015.00196 (2015).
42. Li, Y. et al. Clinicopathological implication of long non-coding RNAs SOX2 overlapping transcript and its potential target gene
network in various cancers. Front. Genet. 10, 1375. https://doi.org/10.3389/fgene.2019.01375 (2019).
43. Chang, X., Zhang, H., Yang, Q. & Pang, L. LncRNA SOX2OT affects cervical cancer cell growth, migration and invasion by regulat-
ing SOX2. Cell Cycle (Georgetown, Tex.) 19, 1391–1403. https://doi.org/10.1080/15384101.2020.1750812 (2020).
Scientific Reports | (2022) 12:57 | https://doi.org/10.1038/s41598-021-04214-7 10
Vol:.(1234567890)www.nature.com/scientificreports/
44. Farhangian, P., Jahandoost, S., Mowla, S. J. & Khalili, M. Differential expression of long non-coding RNA SOX2OT in gastric
adenocarcinoma. Cancer Biomarkers Sect. A Dis. Markers 23, 221–225. https://doi.org/10.3233/cbm-181325 (2018).
45. Nicolle, R. et al. Integrated molecular characterization of chondrosarcoma reveals critical determinants of disease progression.
Nat. Commun. 10, 4622. https://doi.org/10.1038/s41467-019-12525-7 (2019).
46. Ceccarelli, M. et al. Molecular profiling reveals biologically discrete subsets and pathways of progression in diffuse glioma. Cell
164, 550–563. https://doi.org/10.1016/j.cell.2015.12.028 (2016).
47. Grossman, R. L. et al. Toward a shared vision for cancer genomic data. N. Engl. J. Med. 375, 1109–1112. https://doi.org/10.1056/
NEJMp1607591 (2016).
48. Barrett, T. et al. NCBI GEO: Archive for functional genomics data sets—update. Nucleic Acids Res. 41, D991–D995. https://doi.
org/10.1093/nar/gks1193 (2012).
49. Athar, A. et al. ArrayExpress update—From bulk to single-cell expression data. Nucleic Acids Res. 47, D711–D715. https://doi.org/
10.1093/nar/gky964 (2018).
50. Ritchie, M. E. et al. limma powers differential expression analyses for RNA-sequencing and microarray studies. Nucleic Acids Res.
43, e47. https://doi.org/10.1093/nar/gkv007 (2015).
51. Zhou, G. et al. NetworkAnalyst 3.0: A visual analytics platform for comprehensive gene expression profiling and meta-analysis.
Nucleic Acids Res. 47, W234-w241. https://doi.org/10.1093/nar/gkz240 (2019).
52. Leinonen, R., Sugawara, H. & Shumway, M. The sequence read archive. Nucleic Acids Res. 39, D19-21. https://doi.org/10.1093/
nar/gkq1019 (2011).
53. Dobin, A. et al. STAR: Ultrafast universal RNA-seq aligner. Bioinformatics (Oxford, England) 29, 15–21. https://doi.org/10.1093/
bioinformatics/bts635 (2013).
54. Love, M. I., Huber, W. & Anders, S. Moderated estimation of fold change and dispersion for RNA-seq data with DESeq2. Genome
Biol. 15, 550. https://doi.org/10.1186/s13059-014-0550-8 (2014).
55. Yates, A. D. et al. Ensembl 2020. Nucleic Acids Res. 48, D682-d688. https://doi.org/10.1093/nar/gkz966 (2020).
56. Bult, C. J., Blake, J. A., Smith, C. L., Kadin, J. A. & Richardson, J. E. Mouse Genome Database (MGD) 2019. Nucleic Acids Res. 47,
D801-d806. https://doi.org/10.1093/nar/gky1056 (2019).
57. Smedley, D. et al. The BioMart community portal: An innovative alternative to large, centralized data repositories. Nucleic Acids
Res. 43, W589–W598. https://doi.org/10.1093/nar/gkv350 (2015).
58. Braschi, B. et al. Genenames.org: the HGNC and VGNC resources in 2019. Nucleic Acids Res. 47, 786–792. https://doi.org/10.
1093/nar/gky930 (2019).
59. Mi, H. et al. PANTHER version 16: A revised family classification, tree-based classification tool, enhancer regions and extensive
API. Nucleic Acids Res. 49, D394-d403. https://doi.org/10.1093/nar/gkaa1106 (2021).
60. Oughtred, R. et al. The BioGRID interaction database: 2019 update. Nucleic Acids Res. 47, D529-d541. https://doi.org/10.1093/
nar/gky1079 (2019).
Acknowledgements
H.J.S. (PI), K.B.G., A.J., and J.M. (Co-Is) were supported by the National Plan for Science, Technology and Inno-
vation (MAARIFAH)—King Abdulaziz City for Science and Technology—The Kingdom of Saudi Arabia—award
number: 13-BIO2289-03. The authors also acknowledge with thanks the Science and Technology Unit, King
Abdulaziz University for technical support.
Author contributions
H.J.S, F.A., H.A.S., and H.K. conceived and designed the study. H.J.S., N.G., S.K., and D.H. analyzed the raw
data and prepared the figures. H.J.S., K.B.G., A.J., and J.M. interpreted the data. H.J.S. and M.H.Q. drafted and
revised the manuscript. All authors reviewed the manuscript.
Competing interests
The authors declare no competing interests.
Additional information
Supplementary Information The online version contains supplementary material available at https://doi.org/
10.1038/s41598-021-04214-7.
Correspondence and requests for materials should be addressed to H.-J.S.
Reprints and permissions information is available at www.nature.com/reprints.
Publisher’s note Springer Nature remains neutral with regard to jurisdictional claims in published maps and
institutional affiliations.
Open Access This article is licensed under a Creative Commons Attribution 4.0 International
License, which permits use, sharing, adaptation, distribution and reproduction in any medium or
format, as long as you give appropriate credit to the original author(s) and the source, provide a link to the
Creative Commons licence, and indicate if changes were made. The images or other third party material in this
article are included in the article’s Creative Commons licence, unless indicated otherwise in a credit line to the
material. If material is not included in the article’s Creative Commons licence and your intended use is not
permitted by statutory regulation or exceeds the permitted use, you will need to obtain permission directly from
the copyright holder. To view a copy of this licence, visit http://creativecommons.org/licenses/by/4.0/.
© The Author(s) 2022
Scientific Reports | (2022) 12:57 | https://doi.org/10.1038/s41598-021-04214-7 11
Vol.:(0123456789)You can also read