Detection of subtype-specific breast cancer surface protein biomarkers via a novel transcriptomics approach
←
→
Page content transcription
If your browser does not render page correctly, please read the page content below
Bioscience Reports (2021) 41 BSR20212218
https://doi.org/10.1042/BSR20212218

Research Article

Detection of subtype-specific breast cancer surface
protein biomarkers via a novel transcriptomics
approach
Daniele Mercatelli1 , Francesco Formaggio1 , Marco Caprini1 ,                                                   Andrew Holding2 and                         Federico M. Giorgi1

                                                                                                                                                                                           Downloaded from http://portlandpress.com/bioscirep/article-pdf/41/12/BSR20212218/925782/bsr-2021-2218.pdf by guest on 29 December 2021
1 Department   of Pharmacy and Biotechnology, University of Bologna, 40126 Bologna, Italy; 2 York Biomedical Research Institute, University of York, Heslington, York, YO10 5DD, U.K.
Correspondence: Daniele Mercatelli (daniele.mercatelli2@unibo.it) or Andrew Holding (andrew.holding@york.ac.uk) or Federico M. Giorgi (federico.giorgi@unibo.it)

                                           Background: Cell-surface proteins have been widely used as diagnostic and prognostic
                                           markers in cancer research and as targets for the development of anticancer agents. So far,
                                           very few attempts have been made to characterize the surfaceome of patients with breast
                                           cancer, particularly in relation with the current molecular breast cancer (BRCA) classification.
                                           In this view, we developed a new computational method to infer cell-surface protein activities
                                           from transcriptomics data, termed ‘SURFACER’.
                                           Methods: Gene expression data from GTEx were used to build a normal breast network
                                           model as input to infer differential cell-surface proteins activity in BRCA tissue samples re-
                                           trieved from TCGA versus normal samples. Data were stratified according to the PAM50
                                           transcriptional subtypes (Luminal A, Luminal B, HER2 and Basal), while unsupervised clus-
                                           tering techniques were applied to define BRCA subtypes according to cell-surface proteins
                                           activity.
                                           Results: Our approach led to the identification of 213 PAM50 subtypes-specific deregu-
                                           lated surface genes and the definition of five BRCA subtypes, whose prognostic value was
                                           assessed by survival analysis, identifying a cell-surface activity configuration at increased
                                           risk. The value of the SURFACER method in BRCA genotyping was tested by evaluating the
                                           performance of 11 different machine learning classification algorithms.
                                           Conclusions: BRCA patients can be stratified into five surface activity-specific groups hav-
                                           ing the potential to identify subtype-specific actionable targets to design tailored targeted
                                           therapies or for diagnostic purposes. SURFACER-defined subtypes show also a prognostic
                                           value, identifying surface-activity profiles at higher risk.

                                         Introduction
                                         While advances in therapeutic options and diagnostic tools have significantly improved breast cancer
                                         (BRCA) survival, BRCA incidence has continuously increased over the years, especially in high-income
                                         countries [1,2]. It is expected that almost 3.2 million women will be diagnosed with BRCA by 2040,
                                         counting about 1 million new deaths [3]. Clinically, the classification of BRCA relies on histopatho-
Received: 17 September 2021
                                         logical appearance and expression of hormone and growth factors receptors. Transcriptome profiling of
Revised: 29 October 2021                 BRCA patients based on the expression levels of 50 selected genes (PAM50) led to the definition of five
Accepted: 08 November 2021               clinically relevant BRCA intrinsic molecular subtypes, namely Luminal A (LumA), Luminal B (LumB),
                                         HER2-enriched (HER2+), Basal (Basal) and Normal-like (Normal) [4–7]. However, the PAM50 intrinsic
Accepted Manuscript Online:
09 November 2021                         subtype classification did not identify claudin-low tumors [7]. Identifying new cancer subtype-specific
Version of Record published:             biomarkers will provide a more rapid diagnosis and finely tuned classification of BRCA patients to im-
07 December 2021                         prove disease management.

© 2021 The Author(s). This is an open access article published by Portland Press Limited on behalf of the Biochemical Society and distributed under the Creative Commons Attribution   1
License 4.0 (CC BY).
Bioscience Reports (2021) 41 BSR20212218
                                                                                                                                         https://doi.org/10.1042/BSR20212218

              For decades, surface antigens have been frequently adopted for diagnostic and classification purposes in oncol-
           ogy. Surface antigens are usually optimal biomarker candidates because they are accessible for both antibody-based
           diagnostic and pharmacological interventions [8]. Surface antigens can also be frequently detected from blood sam-
           ples for diagnosis and to monitor response to therapy, for example, CA 15-3 or carcinoembryonic antigen (CEA)
           [9]. Testing expression levels of HER2 has been a well-established method to identify endocrine-sensitive BRCA pa-
           tients or to select patients that would benefit from anti-HER2 therapy, respectively [10]. Human proteins exposed
           on the cell-surface represent an important determinant of the complex interface regulating interactions between the
           intracellular and the extracellular space, and collectively form the surface proteome or ‘surfaceome’ [11]. Surface
           proteins are ideal candidate nodes in cellular networks due to four properties: (1) accessibility: they can be targeted
           by drugs and molecular detectors without crossing the plasma membrane [12], (2) pleiotropicity: every human cell
           possesses surface proteins [11], (3) precedence: surface receptors often act as the trigger of signaling cascades [13]

                                                                                                                                                                                           Downloaded from http://portlandpress.com/bioscirep/article-pdf/41/12/BSR20212218/925782/bsr-2021-2218.pdf by guest on 29 December 2021
           and (4) specificity: cell surface markers are frequently associated with specific cell lineages and differentiation states,
           both in normal development and diseases such as cancer [14]. Therefore, a focused analysis on cell-surface protein
           expression and relationships has the potential to improve molecular characterization of distinct BRCA subtypes to
           sustain disease management. For example, it has been recently demonstrated that expression of genes encoding for
           cell-surface proteins can distinguish between two different molecular and histologic prostate cancer subtypes, prostate
           adenocarcinoma and neuroendocrine prostate cancer [15]. While mass spectrometry-based proteomics techniques
           are far from being implemented in routine clinical settings, RNA-seq has successfully entered clinical diagnostic pro-
           tocols as demonstrated with the PAM50 classification [5,6]. However, individual gene expression profiles are often
           not sufficient at predicting actual surface protein abundance [16]. Therefore, we have developed a novel method,
           called ‘SURFace marker Assessment from Combined Expression analysis in R’ (SURFACER), to infer surface pro-
           tein abundance from RNA-Seq data on a sample-by-sample basis. SURFACER is a direct extension of experimentally
           validated algorithms to accurately predict protein activity in cancer using weighted aggregation of gene expression
           profiles [17,18]. The SURFACER method relies on the interrogation of a context-specific surface protein network
           to successfully predict driver genes (also known as ‘Master Regulators’) explaining the observed phenotype [17,19].
           This approach, usually applied to the identification of transcription factors driving specific disease states, has been ex-
           tended to identify surface proteins acting as master regulators. Thus, SURFACER can define transcriptional modules
           linked to a subset of surface proteins expression that can be furtherly used as models to stratify BRCA subtypes on the
           basis of cell-surface protein expression patterns. This approach is an extension of our previously validated method to
           infer surface protein activity accurately in response to plant toxins in leukemia cells [20].
              The aim of the present study is to analyze and integrate clinical and transcriptomic data of BRCA tumor samples
           from The Cancer Genome Atlas (TCGA) database [6], to identify clinically relevant BRCA surface-specific subtypes
           and to validate our findings on tumor samples from an independent cohort, the Molecular Taxonomy of Breast Cancer
           International Consortium (METABRIC) database [21]. Relationships between surface-specific BRCA subtypes and
           PAM50 molecular subtypes will be highlighted.

           Materials and methods
           Datasets information
           Three independent datasets were used in the present study: the TCGA breast cancer dataset, the GTEx normal breast
           dataset and the METABRIC breast cancer dataset. Data from both the TCGA and GTEx cohorts were download
           following the recount pipeline, which is designed to remove batch effects present in the two large human datasets
           [22]. First, we analyzed 909 cancer samples from 909 patients from the TCGA BRCA cohort, including only patients
           with survival clinical information, from the Firehose web portal (https://gdac.broadinstitute.org/). In order to have a
           consistent normal tissue reference of similar size, we extracted transcriptional data from 212 healthy breast samples
           from the GTEx database (https://gtexportal.org/home/datasets). As a second breast cancer dataset, we downloaded
           data from METABRIC, including 1980 primary breast cancer gene expression (microarray) samples, via the European
           Genome-phenome Archive (EGA) portal [21]. Associated clinical data were downloaded from cBioPortal (https:
           //www.cbioportal.org/study/summary?id=brca metabric) on 22 February 2021.

           SURFACER Pipeline
           The full code to reproduce our analysis is given at the following GitHub URL: github.com/N0toriou5/SURFACER.
           All computational steps were performed on a Windows 10 Pro 64 bit workstation with a eight cores i7 processor (3.0
           GhZ), 64 GB of RAM. Briefly, the SURFACER pipeline is divided into the following major steps:
           •     Network analysis to infer the context-specific surface proteins activity network.

2   © 2021 The Author(s). This is an open access article published by Portland Press Limited on behalf of the Biochemical Society and distributed under the Creative Commons Attribution
    License 4.0 (CC BY).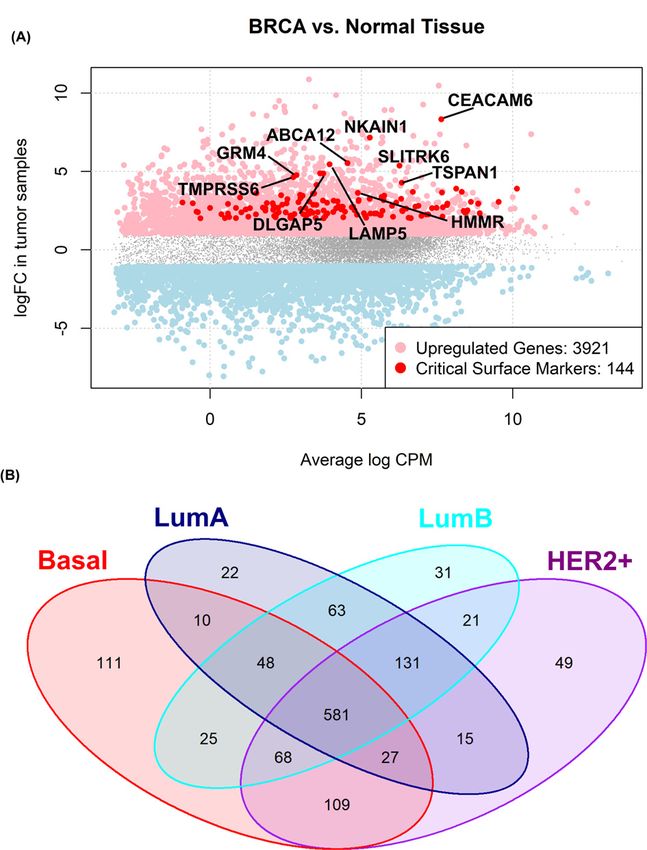
Bioscience Reports (2021) 41 BSR20212218
https://doi.org/10.1042/BSR20212218

•     Cluster Analysis for SURFACER subtypes definition.
•     Combined Differential Gene Expression/ Master Regulator Analysis to prioritize surface markers.
    Below, a description of each major part of the pipeline.

Coexpression-based normal breast surface activity network
We applied a recently developed coexpression-based gene network inference and interrogation algorithm, corto
[18], to build a normal breast network model considering relationships between surface protein-encoding genes
and the whole human transcriptome. Normal breast gene expression data were retrieved from GTEx breast tissue
dataset (n=212). A list of 3088 unique identifiers corresponding to human surface-protein encoding genes was
obtained by manual curation of a larger list obtained by intersection of the terms ‘cell surface’ (GO:0009986), ‘an-
chored component of external side of plasma membrane’ (GO:0031362), ‘apical plasma membrane’ (GO:0016324),

                                                                                                                                                                                           Downloaded from http://portlandpress.com/bioscirep/article-pdf/41/12/BSR20212218/925782/bsr-2021-2218.pdf by guest on 29 December 2021
‘external side of plasma membrane’ (GO:0009897), ‘extrinsic component of external side of plasma membrane’
(GO:0031232), ‘intrinsic component of external side of plasma membrane’ (GO:0031233), ‘plasma membrane protein
complex’ (GO:0098797), ‘plasma membrane signaling receptor complex’ (GO:0098802), ‘plasma membrane region’
(GO:0098590) and the in silico human surfaceome [11]. This manually curated list of surface proteins, expressed as
gene symbols and NCBI gene ids, is available as Supplementary File S1.
   All surface proteins were used as potential hubs (‘centroids’) to run the corto function, in order to build surface
protein-centered coexpression networks. We used the following arguments: nbootstraps = 1000, P=10−10 , nthreads
= 8. The network was used as input to infer differential surface protein activity in tumor samples versus normal sam-
ples by using the mra-Corto function included in the corto package with the following settings: regulon = the normal
reference surface network built with the corto function corto, minsize = 15, nperm = 1000. The mra-Corto func-
tion performs Master Regulator Analysis (MRA), an algorithm aiming at inferring protein activity by interrogating a
regulon with specific transcriptional signatures [17,18]. MRA can be performed between sample groups (e.g. cancer
versus non-cancer) or on a sample-by-sample basis, providing protein activity relative to the median of the dataset
[23]. A surface activity matrix calculating surface proteins activity on a single-patient basis was therefore obtained
by running the mra-Corto algorithm on the Variance-Stabilizing-Transformed (VST) [24] TCGA-BRCA expression
matrix. For every surface protein subnetwork, genes are ranked according to the maximums of their correlation scores
with the network centroid (i.e. the surface gene of interest), then the mra-Corto function calculates an enrichment
score to reflect the enrichment of a given surface gene’s targets toward the top of the corresponding gene ranking
generated, that is a positive value if target genes are up-regulated in the dataset, or a negative value if target genes are
down-regulated. Then, a normalized enrichment score (NES) is obtained for a particular subnetwork, considering
the size of the subnetwork itself.

Differential gene expression analysis
We used EdgeR Bioconductor Package [25] to perform differential gene expression analysis on raw counts data tumor
versus normal samples. PAM50 subtype classification was performed through the pamr package [26]. For differential
expression, false discovery rate (FDR) values were obtained by Benjamini and Hochberg method [27]. If not differ-
ently stated, differentially expressed genes (DEG) where defined as showing a |log2FC| > 1 and an FDR ≤ 0.05. To
define critical surface markers, DEGs were filtered for genes showing an absolute NES > 2 (FDR ≤ 0.05) calculated
by MRA tumor versus healthy tissue (i.e. TCGA versus GTEx). Enrichment analysis was performed on Enrichr web
server [28]. Limma Bioconductor package [29] was used to perform differential expression analysis on gene expres-
sion data from the METABRIC cohort versus normal samples from the GTEx cohort.

Heatmap construction and cluster analysis
VST expression matrices of 909 patients from the TCGA cohort were used to calculate a single-patient surface protein
activity heatmap through the mra-Corto function as described above. The rows (proteins) and columns (samples)
were then ordered based on a hierarchical cluster by applying Ward’s method [30] with average linkage and Pearson’s
correlation distance. According to elbow method, which suggested an optimal number of clusters between 4 and 6
(Supplementary Figure S1), patients were grouped into five clusters, renamed for similarity with PAM50 classification
as follows: Basal-like, Lum1, Lum2, Lum3 and Mixed.

PAM50 and SURFACER subtype classifications
The expression levels of the PAM50 panel genes from each of the 909 tumor samples from TCGA were used to carry
out the intrinsic subtype classification of tumors by using the pamr R package. SURFACER network transcriptional

© 2021 The Author(s). This is an open access article published by Portland Press Limited on behalf of the Biochemical Society and distributed under the Creative Commons Attribution   3
License 4.0 (CC BY).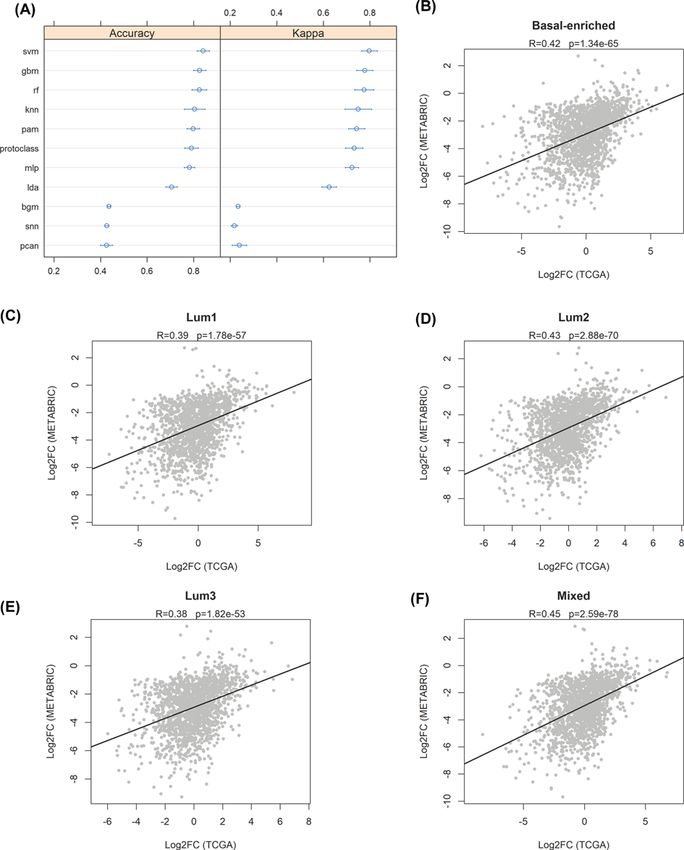
Bioscience Reports (2021) 41 BSR20212218
                                                                                                                                         https://doi.org/10.1042/BSR20212218

           models were generated, and assignment of METABRIC patients to the most likely SURFACER subtypes was obtained
           by Pearson correlation following the nearest shrunken centroids classifier method [26].

           SURFACER genotyping validation
           To explore the accuracy of SURFACER in BRCA patient samples genotyping, TCGA dataset was divided into a train-
           ing and a validation set (80–20%, respectively). The performance and accuracy of the following classification algo-
           rithms from the caret R package (v 6.0-90) [31] were assessed using 10-fold Cross-Validation: Support Vector Ma-
           chines with Radial Basis Function Kernel (svm), Stochastic Gradient Boosting (gbm), Random Forest (rf), k-Nearest
           Neighbors (knn), Nearest Shrunken Centroids (pam), Greedy Prototype Selection (protoclass), Multi-Layer Percep-
           tron (mlp), Linear Discriminant Analysis (lda), Bayesian Generalized Linear Model (bgm), Stabilized Nearest Neigh-
           bor Classifier (snn) and Neural Networks with Feature Extraction (pcan). The performance of the different ML algo-

                                                                                                                                                                                           Downloaded from http://portlandpress.com/bioscirep/article-pdf/41/12/BSR20212218/925782/bsr-2021-2218.pdf by guest on 29 December 2021
           rithms was tested using the following two parameters: accuracy and the Cohen’s Kappa statistics.

           Survival model
           Survival analysis was performed using the survival and survminer R CRAN packages. The effect of each selected
           surface gene on survival was estimated using a univariate Cox proportional hazard model with the survival informa-
           tion of the 909 patients of the TCGA cohort. Kaplan–Meier curves for each group were generated, and the survival
           distributions were compared using Log-Rank test. The same approach was followed with METABRIC data.

           Results
           The surfaceome of PAM50 subtypes
           Batch-corrected raw counts data from TCGA-BRCA and GTEx breast tissue patients were merged together in a single
           raw gene expression counts matrix. In total, 954 tumor samples from the TCGA-BRCA dataset and 212 normal breast
           tissue reference counts from GTEx were kept in our analysis. Forty-five patients from TCGA lacking overall survival
           status information were discarded, leaving a total of 909 BRCA patients expression data. Single patients were assigned
           to histological groups using PAM50 gene markers [4,6,26] and differential expression analysis BRCA–TCGA versus
           normal breast tissue reference was performed on the whole cohort and on a subtype-specific basis. The complete
           transcriptome wide differential expression analysis is available in Supplementary Table S1 for the global breast cancer
           (TCGA) versus normal breast (GTEX) contrast, and for individual breast cancer subtypes versus normal breast in
           Supplementary Table S2 (PAM50 subtypes) and Supplementary Table S3 (SURFACER subtypes). Differential expres-
           sion analysis results were furtherly filtered to focus on surface protein coding genes; this was attained by filtering
           differential expression results for the 3088 surface proteins included in the SURFACER curated list (Supplementary
           File S1). A normalized enrichment score for each surface protein was obtained by applying the mra-Corto algorithm,
           as explained in Materials and Methods. A total of 32 surface genes were found to be critically altered in BRCA ver-
           sus normal tissue, 144 of which showed up-regulation at both mRNA expression, and inferred protein activity level
           (Figure 1A).
              We then investigated differential activity of surface proteins for each intrinsic subtype versus normal reference.
           A total of 581 surface coding genes are differentially expressed in all PAM50 intrinsic subtypes versus normal ref-
           erence tissue expression, while a subset of surface genes shows restricted differential expression characterizing each
           subtype: 111 genes are differentially expressed in basal patients only, 22 in luminal A, 31 genes in luminal B and 49
           in HER2+ patients (Figure 1B). The surface protein HER2 (encoded by the ERBB2 gene) is in fact up-regulated in all
           subtypes when compared with normal breast tissue, however showing great differences in fold changes. In fact, while
           a log2FC = 5.5 can be detected in HER2+ patients versus normal reference, 2.2 and 3.4 log2FC characterized LumA
           and LumB samples, respectively. Basal samples showed the smallest difference, with an up-regulation of 1.5 versus
           normal samples. Differential expression values of all significant surface targets for each intrinsic subtype are given in
           Supplementary Table S1.
              The 213 PAM50 subtype-specific surface genes are showed in Figure 2. As previously reported [32], up-regulation
           of Folate Receptor alpha (FOLR1) is characterizing the basal subtype, together with programmed death ligand 1
           (PD-L1, CD274) [33], while the discovery of many other targets that are readily suitable for immunotargeted therapy
           can be enhanced by the SURFACER approach. Among these genes, a total of 35 differentially expressed surface genes
           were found to be significantly associated with overall survival in BRCA patients. Thirteen genes out of the 111 genes
           characterizing the basal subtype-restricted surface signature showed a prognostic value: an increased risk is expected
           for patients expressing high levels of FFAR2, IGSF9B, L1CAM, MPZL3, PTPRH and SLC20A2 (sodium-dependent
           phosphate transporter 2, PiT-2), while a protective effect was observed for ADORA1, CXCL16, FZD7, HLA-A,

4   © 2021 The Author(s). This is an open access article published by Portland Press Limited on behalf of the Biochemical Society and distributed under the Creative Commons Attribution
    License 4.0 (CC BY).
Bioscience Reports (2021) 41 BSR20212218
https://doi.org/10.1042/BSR20212218

                                                                                                                                                                                           Downloaded from http://portlandpress.com/bioscirep/article-pdf/41/12/BSR20212218/925782/bsr-2021-2218.pdf by guest on 29 December 2021

Figure 1. Up-regulated surface genes in BRCA
(A) EdgeR logFC versus average log Counts Per Million (CPM) plot. In red, critically up-regulated surface proteins are highlighted.
Top 10 critically enhanced BRCA surface markers are labeled. (B) Venn diagram showing the intersection between significant
critically altered surface proteins in PAM50 intrinsic subtypes versus normal reference tissue from GTEx.

© 2021 The Author(s). This is an open access article published by Portland Press Limited on behalf of the Biochemical Society and distributed under the Creative Commons Attribution   5
License 4.0 (CC BY).
Bioscience Reports (2021) 41 BSR20212218
                                                                                                                                         https://doi.org/10.1042/BSR20212218

                                                                                                                                                                                           Downloaded from http://portlandpress.com/bioscirep/article-pdf/41/12/BSR20212218/925782/bsr-2021-2218.pdf by guest on 29 December 2021
           Figure 2. Heatmap of 213 PAM50 subtype-specific significant surface markers
           Association of surface markers with prognosis was evaluated by univariate Cox’s regression model coefficients, with positives
           coefficients indicating a poor prognosis (pink side bars), and negative coefficients indicating good prognosis (green-blue side
           bars). A black box corresponding to FDR value for Cox’s coefficients < 0.05 was indicated.

           HLA-B, SMO and TSPAN15. Among the 8 genes mostly characterizing the HER2+ subtype, an increased risk was de-
           tected for SCARB2 and SPPL2A only, while the remaining (ANO9, CLCNKB, SGCE, CRB2, ICAM3 and KLRB1) were
           associated with an increased risk when down-regulated. Luminal subtypes showed a total of 14 genes significantly
           associated with overall survival, 6 in subtype A and 8 in subtype B. Increased risk was detected for ABCC5, SCN8A
           (another sodium channel) and SLC33A1. Indeed, sodium homeostasis is frequently altered in cancer, possibly due to
           the misexpression of key sodium channels and transporters like those identified by our study [34]. Down-regulation
           is associated with an increased risk for ATP13A2, CD1D, FCER1A, IL4R, KCNK17, LPHN2, LRRC4, MR1, SIP4R,
           SORCS and TNFRSF1. Surface genes were annotated to four functional classes, namely enzymes, receptors, trans-
           porters and structural molecules, and color labeled accordingly in Figure 2.

6   © 2021 The Author(s). This is an open access article published by Portland Press Limited on behalf of the Biochemical Society and distributed under the Creative Commons Attribution
    License 4.0 (CC BY).
Bioscience Reports (2021) 41 BSR20212218
https://doi.org/10.1042/BSR20212218
TCGA breast cancer patients clustering according to surface protein
activity
The mra-Corto algorithm was run in sample-by-sample mode to obtain a single-patient surface activity score for
each surface protein coding gene in the SURFACER list. This way, we obtained a dataset-wide readout of normalized
surface activity scores across patients that we used to group patients into clusters showing similar patterns of surface
protein activities: sample-to-sample distance was determined as 1-Pearson correlation coefficient, and hierarchical
clustering was performed by Ward’s method [30]. Elbow method suggested 5 as the optimal number of clusters to
subdivide TCGA patients according to surface proteins inferred activity (Supplementary Figure S1). Relationships
between SURFACER subtypes and PAM50 classification are shown in Figure 3A: TCGA patients belonging to the
basal PAM50 intrinsic subtype (red bar) were similarly clustered to the SURFACER subtype indicated in light pink,
and therefore named ‘basal-like’. A small cluster mainly composed by PAM50 HER2+ and luminal samples, therefore
Downloaded from http://portlandpress.com/bioscirep/article-pdf/41/12/BSR20212218/925782/bsr-2021-2218.pdf by guest on 29 December 2021
renamed as ‘mixed’ subtype, was labelled by a khaki green bar. PAM50 Luminal A and B patients were represented
by three different SURFACER clusters that we named as Lum1-3. To note, most of the TCGA cohort was assigned
to the Luminal A subtype that may introduce a potential source of bias in the fine classification of luminal breast
cancers according to surface proteins expression data. However, the current PAM50 classification is considered by
several authors to be insufficient to fully recapitulate BRCA complexity. In fact, the PAM50 panel and intrinsic sub-
types gene signature prototypes were obtained from bulk tissue data, and this can introduce a bias due to sampling
procedures, as also discussed in [35]. Furthermore, one has to take into account that currently available large expres-
sion sets are poorly able to reflect BRCA at the population level [36]; thus, larger curated datasets will be required
to refine predictions. In Supplementary Figure S2, the relative abundance of each SURFACER subtype into classic
PAM50-assigned patients clusters is showed. To note, while few patients would be assigned to the normal-like sub-
type by PAM50 classification, our method identifies those samples as mostly basal-enriched samples. The advantage
of SURFACER subtypes classification is, however, the possibility to identify subtype-specific actionable markers on
the basis of protein activity at network level. Other BRCA classifications do exist, such as [37], but none is specifically
surfaceome-oriented.
Identification of the top markers of SURFACER subtypes
The surfaceome of the five SURFACER clusters was then investigated following the same approach used to character-
ize PAM50 subtypes-specific surfaceomes. Raw differential expression tables containing the differential expression
analysis versus normal reference for each SURFACER subtype is given in Supplementary Table S1, while a selection of
all significant surface markers is given in Supplementary Table S2. Venn diagram showed that 491 surface protein cod-
ing genes are commonly deregulated in all SURFACER subtypes when compared with normal reference tissue gene
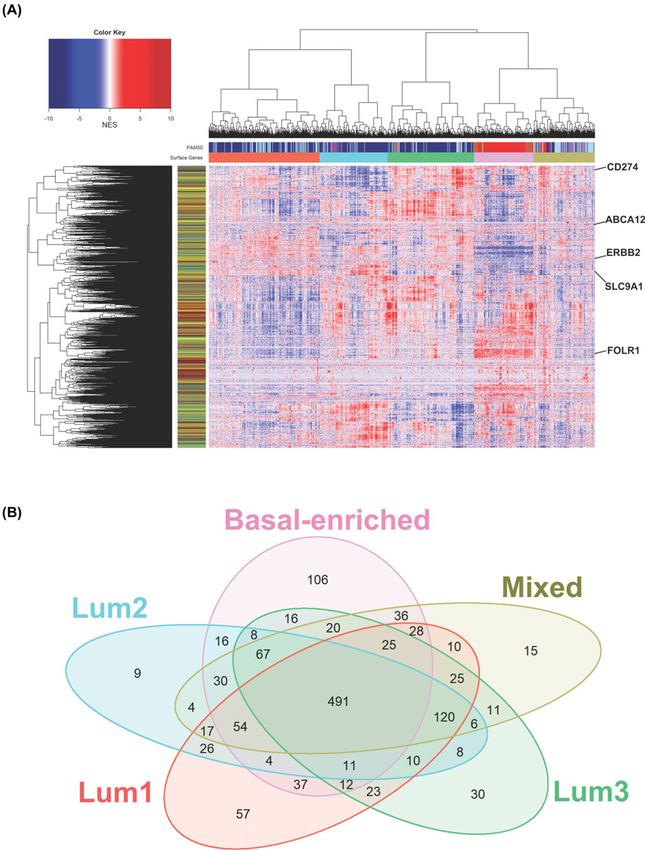
expression, while few genes specifically characterize each subtype (Figure 3B). A 106 proteins signature defines the
basal-enriched subtype (Figure 4A). Many genes that were showed to characterize PAM50 basal subtype are included
in this signature, like FOLR1, CD274, and all markers also showing a significant prognostic value, as discussed above.
Enrichment analysis was performed by uploading up-regulated and down-regulated basal-enriched genes into En-
richer web server separately and interrogating the WikiPathways gene sets. While no significant positive enrichment
for any pathway was detected, a significant negative enrichment of the ACE Inhibitor Pathway (FDR = 0.006379) was
observed in basal-enriched subtype-restricted down-regulated surface markers. The Lum1 subtype was mostly char-
acterized by down-regulation of 45 surface markers. By uploading these 45 genes into Enrichr web server, a significant
enrichment of the following WikiPathways was observed: Platelet-mediated interactions with vascular and circulating
cells, Small Ligand GPCRs, Apoptosis Modulation by HSP70 (FDR = 0.021). The Lum2 subtype was characterized by
a small signature of nine genes. Three genes (Membrane Metalloendopeptidase Like 1 [MMEL1], Sphingolipid Trans-
porter 3 [SPNS3] and Intercellular Adhesion Molecule 3 [ICAM3]) were found to be significantly up-regulated in this
subtype, which makes these genes ideal candidates for Lum2-specific targeting. Among these, ICAM3 up-regulation
was previously shown to be correlated with tumor staging and to mediate tumor metastasis [38]. No relevant pathway
enrichment was detected for the Lum2 subtype. Up-regulation of canonical and non-canonical Notch signaling (FDR
= 0.020) was observed in Lum3, while a positive enrichment of RalA downstream regulated genes (FDR = 0.029)
was observed in the mixed subtype.
Validation of the SURFACER method in BRCA genotyping
The accuracy of SURFACER in breast cancer genotyping was tested by estimating the performance of 11 different
machine learning (ML) algorithms on assigning patients to the correct SURFACER subtype. The 10-fold cross val-
idation procedure was performed to test accuracy, sensitivity and specificity of ML predictions. The TCGA dataset
© 2021 The Author(s). This is an open access article published by Portland Press Limited on behalf of the Biochemical Society and distributed under the Creative Commons Attribution 7
License 4.0 (CC BY).Bioscience Reports (2021) 41 BSR20212218
https://doi.org/10.1042/BSR20212218
Downloaded from http://portlandpress.com/bioscirep/article-pdf/41/12/BSR20212218/925782/bsr-2021-2218.pdf by guest on 29 December 2021
Figure 3. BRCA patients subtyping according to surface protein network activity
(A) Surface protein network activity heatmap of the TCGA BRCA cohort. Patients were clustered together for surface proteins
inferred activity, and relationships with PAM50 classification were indicated by PAM50 side bar (column). Rowside colors were
added to label surface markers for functional class: enzymes (dark gray), receptors (dark red), structural molecules (yellow) and
transporters (green). Few key surface markers are highlighted. (B) Venn diagram showing the intersection between significant
critically altered surface proteins in SURFACER clusters versus normal reference tissue from GTEx.
8 © 2021 The Author(s). This is an open access article published by Portland Press Limited on behalf of the Biochemical Society and distributed under the Creative Commons Attribution
License 4.0 (CC BY).Bioscience Reports (2021) 41 BSR20212218
https://doi.org/10.1042/BSR20212218
Downloaded from http://portlandpress.com/bioscirep/article-pdf/41/12/BSR20212218/925782/bsr-2021-2218.pdf by guest on 29 December 2021
Figure 4. SURFACER subtypes-specific altered genes
Heatmaps showing genes whose activity was differentially altered only in (A) Basal-enriched, (B–D) Lum1-3 and (E) mixed SUR-
FACER subtypes.
© 2021 The Author(s). This is an open access article published by Portland Press Limited on behalf of the Biochemical Society and distributed under the Creative Commons Attribution 9
License 4.0 (CC BY).Bioscience Reports (2021) 41 BSR20212218
https://doi.org/10.1042/BSR20212218
was randomly splitted into two datasets, a training set and a validation set, with a 80–20% split. Thus, the 909 samples
in the TCGA cohort were allocated as follows: 638 samples in the training set, 271 samples in the validation set. A
very good balance in class representation was achieved between training and validation (Basal-enriched, 15.3–15.0%;
Lum1, 28.7–28.9%; Lum2, 17.6–17.8%; Lum3, 22.5–22.2%; Mixed, 15.9–16.1%, respectively). Accuracy and Cohen’s
Kappa were used to estimate the performance of both linear and non-linear ML classification algorithms. Figure
5A shows the results of the analysis: among top performers, Support Vector Machines with Radial Basis Function
Kernel (svm), Stochastic Gradient Boosting (gbm) and Random Forest (rf) showed the highest accuracy (over 0.8),
while k-Nearest Neighbors (knn), Nearest Shrunken Centroids (pam), Greedy Prototype Selection (protoclass) and
Multi-Layer Perceptron (mlp) showed good performances, with accuracy values near 0.8. Worst performances were
showed by Bayesian Generalized Linear Model (bgm), Stabilized Nearest Neighbor Classifier (snn) and Neural Net-
works with Feature Extraction (pcan) algorithms. The svm algorithm was found to be the best performer, showing
an overall accuracy of 0.833 in predicting the correct class in the validation set (confidence interval = 0.777 < 0.833
Downloaded from http://portlandpress.com/bioscirep/article-pdf/41/12/BSR20212218/925782/bsr-2021-2218.pdf by guest on 29 December 2021
< 0.8846, PBioscience Reports (2021) 41 BSR20212218
https://doi.org/10.1042/BSR20212218
Downloaded from http://portlandpress.com/bioscirep/article-pdf/41/12/BSR20212218/925782/bsr-2021-2218.pdf by guest on 29 December 2021
Figure 5. SURFACER genotyping validation
(A) Estimation of the performance of several ML algorithm on sample classification. Accuracy and Cohen’s Kappa of the following
ML algorithms were plotted (confidence level: 0.95): Support Vector Machines with Radial Basis Function Kernel (svm), Stochastic
Gradient Boosting (gbm), Random Forest (rf), k-Nearest Neighbors (knn), Nearest Shrunken Centroids (pam), Greedy Prototype
Selection (protoclass), Multi-Layer Perceptron (mlp), Linear Discriminant Analysis (lda), Bayesian Generalized Linear Model (bgm),
Stabilized Nearest Neighbor Classifier (snn) and Neural Networks with Feature Extraction (pcan). (B–D) Scatterplots showing the
Log2 fold changes of differential expression analysis in TCGA (x-axis) and METABRIC (y-axis) samples versus normal breast tissue
reference samples. Pearson correlation coefficients (R) and significance of each analysis are reported.
© 2021 The Author(s). This is an open access article published by Portland Press Limited on behalf of the Biochemical Society and distributed under the Creative Commons Attribution 11
License 4.0 (CC BY).Bioscience Reports (2021) 41 BSR20212218
https://doi.org/10.1042/BSR20212218
Downloaded from http://portlandpress.com/bioscirep/article-pdf/41/12/BSR20212218/925782/bsr-2021-2218.pdf by guest on 29 December 2021
Figure 6. Survival analysis
Overall survival of SURFACER clusters. Kaplan–Meier curves corresponding to the 5 SURFACER clusters were analyzed in both
the (A) TCGA and (B) METABRIC cohorts. Statistical significance was evaluated by Log-Rank test.
BRCA molecular subtype classification, defined by PAM50, was originally proposed to add prognostic/predictive
value to invasive BRCA molecular characterization. However, most of the relevant information about tumor intrinsic
biology can be masked by bulk sequencing, and some specific properties for the PAM50 subtypes reflect changes
in the patients’ tumor microenvironment (TME) instead of specific molecular changes occurring in cancer cells.
Considering that BRCA can be seen as a disease shaped through the complex relationship between cancer cells and the
local environment, and that this relationship can be partly investigated by focusing on cell surface proteins, which are
the direct mediators of most of the exchanges occurring between cancer cells and the TME, we developed SURFACER,
a bioinformatics approach to infer cell-surface protein activity from context-specific gene regulatory networks [18,42].
One of the major advantages of our approach is that it may infer protein abundance from gene expression data, by
overcoming known limitations in predicting actual surface protein abundance by applying weighted aggregation of
gene expression profiles and gene network analysis to rank all differential surface protein activities in tumor samples
versus healthy tissues [17,18,42].
We showed that each PAM50 intrinsic subtype can be described by a specific surface protein activity signature,
which includes both known surface markers (like e.g. FOLR1 up-regulation in the basal subtype [32]) and less char-
acterized proteins that may be studied for subtype-specific diagnostic or therapeutic purposes (e.g. targeted therapy).
Since no clear membrane protein markers have been described so far for LumA, LumB and TNBC subtypes, our novel
approach opened the possibility to identify such markers also for these subtypes, raising the possibility to target them
in a subtype-specific manner.
BRCA patients can be stratified into five surface activity-specific groups, showing some similarities with PAM50
intrinsic subtypes, but having the potential to identify subtype-specific actionable targets to design tailored tar-
geted therapies, or for diagnostic purposes. SURFACER-defined subtypes show also a prognostic value, identifying
surface-activity profiles at higher risk. The mixed phenotype, the one showing the worst prognosis, is characterized by
the restricted deregulation of 15 genes at network level, including some motility/metastatic potential related genes,
like G-protein RalA (RALA) [43], T-cell lymphoma invasion and metastasis-inducing protein (TIAM1) [39], and
NaV 1.6 channels, encoded by the SCN8A gene [40], which may cooperate in shaping an aggressive behavior.
12 © 2021 The Author(s). This is an open access article published by Portland Press Limited on behalf of the Biochemical Society and distributed under the Creative Commons Attribution
License 4.0 (CC BY).Bioscience Reports (2021) 41 BSR20212218
https://doi.org/10.1042/BSR20212218
The identification of optimal surface markers for both diagnostic and therapeutic purposes is a known challenge
in the development of clinically relevant cancer-targeting therapies [44]. While most of the quantitative proteomic
techniques to identify protein markers are currently far from being implemented in routine clinical settings, expres-
sion data are increasingly available from large patients cohorts, along with clinical information. A previous attempt
to investigate BRCA surfaceome was performed by da Cunha in [45], where the authors identified targets to be vali-
dated for diagnostic or therapeutic purposes. However, the advantage of our approach is that it not only relies on gene
expression profiles but also can predict surface protein abundance by inference from coexpression network data, thus
identifying potential targets having a functional relevance in the specific disease. Here, we showed that our network
activity approach may identify functional alterations whereas the only differential expression information is not suffi-
cient to identify relevant cell-surface markers, and that BRCA genotyping according to the surfaceome can be achived
by our pipeline with a good reproducibility. The availability of large-scale -omics datasets, in this case the TCGA and
Downloaded from http://portlandpress.com/bioscirep/article-pdf/41/12/BSR20212218/925782/bsr-2021-2218.pdf by guest on 29 December 2021
METABRIC breast cancer datasets, combined by the development of specific pipelines like SURFACER, is pivotal in
identifying future cancer biomarkers.
Together with transcriptional regulators, surface proteins act as checkpoint modules [46] for tumor-sustaining
signal transduction, and as obvious subjects for future molecular and translational cancer research. Their convenient
accessibility makes them also ideal biomarkers and biotargets for diagnostic tests and personalized therapeutical
strategies, both for traditional pharmacology [47] and for T-cell-mediated immunotherapy [48].
By analyzing patients’ transcriptomes and associated clinical data, SURFACER is able to predict tissue-specific
cell-surface markers showing altered activity in pathological states, also making it possible to stratify patients ac-
cording to clinically relevant specific molecular subtypes. The SURFACER approach can be extended to every cancer
type, and an integrated pan-cancer approach will help defining critical surface markers beyond canonical cancer type
borders [49]. SURFACER is fully generalizable to other human pathologies as well, which may benefit from the char-
acterization of specific biomarkers, such as autoimmune syndromes [50], genetic diseases [51] and virus-mediated
neuroinflammation, where central nervous systems cells are presenting peculiar surfaceomes upon infection [52].
Data Availability
All data used in the present study is available on the TCGA (https://portal.gdc.cancer.gov/), METABRIC (https://ega-archive.org/
studies/EGAS00000000083) and GTEX (https://gtexportal.org/home/datasets) web portals.
Competing Interests
The authors declare that there are no competing interests associated with the manuscript.
Funding
This work was partially supported by the Department of Pharmacy and Biotechnology, University of Bologna, Italy (to F.M.G. and
D.M.); Fondazione Carisbo [grant number 2021.0167 (to F.M.G.)]; CINECA [grant numbers HP10CB1R7T, HP10CPQJBV, and
HP10CC5F89 (to F.M.G.)] under the ISCRA initiative; the Department of Pharmacy and Biotechnology, University of Bologna, Italy
[RFO2020 (to M.C.)]; and the Department of Biology, University of York and Alan Turing Institute [EPSRC grant EP/N510129/129/1
(to A.H.)].
Open Access
Open access for this article was enabled by the participation of University of York in an all-inclusive Read & Publish pilot with
Portland Press and the Biochemical Society under a transformative agreement with JISC.
CRediT Author Contribution
Daniele Mercatelli: Data curation, Software, Formal analysis, Investigation, Visualization, Methodology, Writing—original draft.
Francesco Formaggio: Validation, Methodology. Marco Caprini: Conceptualization, Supervision, Validation. Andrew Holding:
Resources, Supervision, Writing—review & editing. Federico M. Giorgi: Resources, Supervision, Funding acquisition, Methodol-
ogy, Writing—original draft, Project administration, Writing—review & editing.
Acknowledgements
This study makes use of data generated by the Molecular Taxonomy of Breast Cancer International Consortium. Funding for the
project was provided by Cancer Research UK and the British Columbia Cancer Agency Branch.
© 2021 The Author(s). This is an open access article published by Portland Press Limited on behalf of the Biochemical Society and distributed under the Creative Commons 13
Attribution License 4.0 (CC BY).Bioscience Reports (2021) 41 BSR20212218
https://doi.org/10.1042/BSR20212218
Abbreviations
BRCA, breast cancer; CEA, carcinoembryonic antigen; DEG, differentially expressed gene; FDR, false discovery rate; ML, ma-
chine learning; MRA, master regulator analysis; NES, normalized enrichment score; NGS, next-generation sequencing; OS,
overall survival; TME, tumor microenvironment; VST, variance-stabilizing-transformed.
References
1 Fitzmaurice, C., Akinyemiju, T.F., Al Lami, F.H., Alam, T., Alizadeh-Navaei, R., Global Burden of Disease Cancer Collaboration et al. (2018) Global,
Regional, and National Cancer Incidence, Mortality, Years of Life Lost, Years Lived With Disability, and Disability-Adjusted Life-Years for 29 Cancer
Groups, 1990 to 2016: A Systematic Analysis for the Global Burden of Disease Study. JAMA Oncol. 4, 1553–1568,
https://doi.org/10.1001/jamaoncol.2018.2706
2 Britt, K.L., Cuzick, J. and Phillips, K.-A. (2020) Key steps for effective breast cancer prevention. Nat. Rev. Cancer 20, 417–436,
Downloaded from http://portlandpress.com/bioscirep/article-pdf/41/12/BSR20212218/925782/bsr-2021-2218.pdf by guest on 29 December 2021
https://doi.org/10.1038/s41568-020-0266-x
3 IARC – INTERNATIONAL AGENCY FOR RESEARCH ON CANCER. [Internet]. [cited 2021 Jun 21]. Available from: https://www.iarc.who.int/
4 Perou, C.M., Sørlie, T., Eisen, M.B., van de Rijn, M., Jeffrey, S.S., Rees, C.A. et al. (2000) Molecular portraits of human breast tumours. Nature 406,
747–752, https://doi.org/10.1038/35021093
5 Parker, J.S., Mullins, M., Cheang, M.C.U., Leung, S., Voduc, D., Vickery, T. et al. (2009) Supervised risk predictor of breast cancer based on intrinsic
subtypes. J. Clin. Oncol. 27, 1160–1167, https://doi.org/10.1200/JCO.2008.18.1370
6 Koboldt, D.C., Fulton, R.S., McLellan, M.D., Schmidt, H., Kalicki-Veizer, J., McMichael, J.F. et al. (2012) Comprehensive molecular portraits of human
breast tumours. Nature 490, 61–70, https://doi.org/10.1038/nature11412
7 Fougner, C., Bergholtz, H., Norum, J.H. and Sørlie, T. (2020) Re-definition of claudin-low as a breast cancer phenotype. Nat. Commun. 11, 1787,
https://doi.org/10.1038/s41467-020-15574-5
8 Nicolò, E., Zagami, P. and Curigliano, G. (2020) Antibody-drug conjugates in breast cancer: the chemotherapy of the future? Curr. Opin. Oncol. 32,
494–502, https://doi.org/10.1097/CCO.0000000000000656
9 Shao, Y., Sun, X., He, Y., Liu, C. and Liu, H. (2015) Elevated levels of serum tumor markers CEA and CA15-3 are prognostic parameters for different
molecular subtypes of breast cancer. PLoS ONE 10, e0133830, https://doi.org/10.1371/journal.pone.0133830
10 Duffy, M.J., Walsh, S., McDermott, E.W. and Crown, J. (2015) Chapter One - Biomarkers in Breast Cancer: Where Are We and Where Are We Going? In
Advances in Clin. Chem. (Makowski, GS, ed.), pp. 1–23, Elsevier, [Internet] [cited 2021 Feb 19] Available from:
https://www.sciencedirect.com/science/article/pii/S0065242315000475
11 Bausch-Fluck, D., Goldmann, U., Müller, S., Oostrum, M. van, Müller, M., Schubert, O.T. et al. (2018) The in silico human surfaceome. Proc. Natl. Acad.
Sci. 115, E10988–E10997, https://doi.org/10.1073/pnas.1808790115
12 Bock, T., Moest, H., Omasits, U., Dolski, S., Lundberg, E., Frei, A. et al. (2012) Proteomic analysis reveals drug accessible cell surface N-glycoproteins
of primary and established glioblastoma cell lines. J. Proteome Res. 11, 4885–4893, https://doi.org/10.1021/pr300360a
13 Barnea, G., Strapps, W., Herrada, G., Berman, Y., Ong, J., Kloss, B. et al. (2008) The genetic design of signaling cascades to record receptor activation.
Proc. Natl. Acad. Sci. 105, 64–69, https://doi.org/10.1073/pnas.0710487105
14 Castillo, J., Bernard, V., Lucas, F.A.S., Allenson, K., Capello, M., Kim, D.U. et al. (2018) Surfaceome profiling enables isolation of cancer-specific
exosomal cargo in liquid biopsies from pancreatic cancer patients. Ann. Oncol. 29, 223–229, https://doi.org/10.1093/annonc/mdx542
15 Lee, J.K., Bangayan, N.J., Chai, T., Smith, B.A., Pariva, T.E., Yun, S. et al. (2018) Systemic surfaceome profiling identifies target antigens for
immune-based therapy in subtypes of advanced prostate cancer. Proc. Natl. Acad. Sci. 115, E4473–E4482, https://doi.org/10.1073/pnas.1802354115
16 Liu, Y., Beyer, A. and Aebersold, R. (2016) On the dependency of cellular protein levels on mRNA abundance. Cell 165, 535–550,
https://doi.org/10.1016/j.cell.2016.03.014
17 Paull, E.O., Aytes, A., Jones, S.J., Subramaniam, P.S., Giorgi, F.M., Douglass, E.F. et al. (2021) A modular master regulator landscape controls cancer
transcriptional identity. Cell 184, 334.e20–351.e20, https://doi.org/10.1016/j.cell.2020.11.045
18 Mercatelli, D., Lopez-Garcia, G. and Giorgi, F.M. (2020) corto: a lightweight R package for gene network inference and master regulator analysis.
Bioinformatics 36, 3916–3917, https://doi.org/10.1093/bioinformatics/btaa223
19 Aytes, A., Mitrofanova, A., Lefebvre, C., Alvarez, M.J., Castillo-Martin, M., Zheng, T. et al. (2014) Cross-species analysis of genome-wide regulatory
networks identifies a synergistic interaction between FOXM1 and CENPF that drives prostate cancer malignancy. Cancer Cell. 25, 638,
https://doi.org/10.1016/j.ccr.2014.03.017
20 Mercatelli, D., Bortolotti, M. and Giorgi, F.M. (2020) Transcriptional network inference and master regulator analysis of the response to
ribosome-inactivating proteins in leukemia cells. Toxicology 441, 152531, https://doi.org/10.1016/j.tox.2020.152531
21 Curtis, C., Shah, S.P., Chin, S.-F., Turashvili, G., Rueda, O.M., Dunning, M.J. et al. (2012) The genomic and transcriptomic architecture of 2,000 breast
tumours reveals novel subgroups. Nature 486, 346–352, https://doi.org/10.1038/nature10983
22 Collado-Torres, L., Nellore, A., Kammers, K., Ellis, S.E., Taub, M.A., Hansen, K.D. et al. (2017) Reproducible RNA-seq analysis using recount2. Nat.
Biotechnol. 35, 319–321, https://doi.org/10.1038/nbt.3838
23 Mercatelli, D., Balboni, N., Palma, A., Aleo, E., Sanna, P.P., Perini, G. et al. (2021) Single-cell gene network analysis and transcriptional landscape of
MYCN-amplified neuroblastoma cell lines. Biomolecules 11, 177, https://doi.org/10.3390/biom11020177
24 Giorgi, F.M., Del Fabbro, C. and Licausi, F. (2013) Comparative study of RNA-seq- and Microarray-derived coexpression networks in Arabidopsis
thaliana. Bioinformatics 29, 717–724, https://doi.org/10.1093/bioinformatics/btt053
25 Robinson, M.D., McCarthy, D.J. and Smyth, G.K. (2010) edgeR: a Bioconductor package for differential expression analysis of digital gene expression
data. Bioinformatics 26, 139–140, https://doi.org/10.1093/bioinformatics/btp616
14 © 2021 The Author(s). This is an open access article published by Portland Press Limited on behalf of the Biochemical Society and distributed under the Creative Commons
Attribution License 4.0 (CC BY).Bioscience Reports (2021) 41 BSR20212218
https://doi.org/10.1042/BSR20212218
26 Tibshirani, R., Hastie, T., Narasimhan, B. and Chu, G. (2002) Diagnosis of multiple cancer types by shrunken centroids of gene expression. Proc. Natl.
Acad. Sci. U.S.A. 99, 6567–6572, https://doi.org/10.1073/pnas.082099299
27 Benjamini, Y. and Hochberg, Y. (1995) Controlling the false discovery rate: a practical and powerful approach to multiple testing. J. R. Stat. Soc. Series
B (Methodological) 57, 289–300, https://doi.org/10.1111/j.2517-6161.1995.tb02031.x
28 Kuleshov, M.V., Jones, M.R., Rouillard, A.D., Fernandez, N.F., Duan, Q., Wang, Z. et al. (2016) Enrichr: a comprehensive gene set enrichment analysis
web server 2016 update. Nucleic Acids Res. 44, W90–W97, https://doi.org/10.1093/nar/gkw377
29 Ritchie, M.E., Phipson, B., Wu, D., Hu, Y., Law, C.W., Shi, W. et al. (2015) limma powers differential expression analyses for RNA-sequencing and
microarray studies. Nucleic Acids Res. 43, e47, https://doi.org/10.1093/nar/gkv007
30 Ogasawara, Y. and Kon, M. (2021) Two clustering methods based on the Ward’s method and dendrograms with interval-valued dissimilarities for
interval-valued data. Int. J. Approxim. Reas. 129, 103–121, https://doi.org/10.1016/j.ijar.2020.11.001
31 Kuhn, M. (2008) Building predictive models in R using the caret package. J. Statistical Software 28, 1–26, https://doi.org/10.18637/jss.v028.i05
32 Necela, B.M., Crozier, J.A., Andorfer, C.A., Lewis-Tuffin, L., Kachergus, J.M., Geiger, X.J. et al. (2015) Folate receptor-α (FOLR1) expression and
Downloaded from http://portlandpress.com/bioscirep/article-pdf/41/12/BSR20212218/925782/bsr-2021-2218.pdf by guest on 29 December 2021
function in triple negative tumors. PLoS ONE 10, e0122209, https://doi.org/10.1371/journal.pone.0122209
33 Ali, H.R., Glont, S.-E., Blows, F.M., Provenzano, E., Dawson, S.-J., Liu, B. et al. (2015) PD-L1 protein expression in breast cancer is rare, enriched in
basal-like tumours and associated with infiltrating lymphocytes. Ann. Oncol. 26, 1488–1493, https://doi.org/10.1093/annonc/mdv192
34 Lopez-Charcas, O., Pukkanasut, P., Velu, S.E., Brackenbury, W.J., Hales, T.G., Besson, P. et al. (2021) Pharmacological and nutritional targeting of
voltage-gated sodium channels in the treatment of cancers. iScience 24, 102270, https://doi.org/10.1016/j.isci.2021.102270
35 Kumar, N., Zhao, D., Bhaumik, D., Sethi, A. and Gann, P.H. (2019) Quantification of intrinsic subtype ambiguity in Luminal A breast cancer and its
relationship to clinical outcomes. BMC Cancer 19, 215, https://doi.org/10.1186/s12885-019-5392-z
36 Xie, Y., Davis Lynn, B.C., Moir, N., Cameron, D.A., Figueroa, J.D. and Sims, A.H. (2020) Breast cancer gene expression datasets do not reflect the
disease at the population level. NPJ Breast Cancer 6, 39, https://doi.org/10.1038/s41523-020-00180-x
37 Dawson, S.-J., Rueda, O.M., Aparicio, S. and Caldas, C. (2013) A new genome-driven integrated classification of breast cancer and its implications.
EMBO J. 32, 617–628, https://doi.org/10.1038/emboj.2013.19
38 Shen, W., Zhang, X., Du, R., Fan, Y., Luo, D., Bao, Y. et al. (2018) ICAM3 mediates tumor metastasis via a LFA-1-ICAM3-ERM dependent manner.
Biochim. Biophys. Acta (BBA) - Mol. Basis Dis. 1864, 2566–2578, https://doi.org/10.1016/j.bbadis.2018.05.002
39 Adams, H.C., Chen, R., Liu, Z. and Whitehead, I.P. (2010) Regulation of breast cancer cell motility by T-cell lymphoma invasion and metastasis-inducing
protein. Breast Cancer Res. 12, R69, https://doi.org/10.1186/bcr2637
40 Hernandez-Plata, E., Ortiz, C.S., Marquina-Castillo, B., Medina-Martinez, I., Alfaro, A., Berumen, J. et al. (2012) Overexpression of NaV 1.6 channels is
associated with the invasion capacity of human cervical cancer. Int. J. Cancer 130, 2013–2023, https://doi.org/10.1002/ijc.26210
41 Schick, J., Ritchie, R.P. and Restini, C. (2021) Breast cancer therapeutics and biomarkers: past, present, and future approaches. Breast Cancer (Auckl)
15, [Internet]. [cited 2021 Jun 18] Available from: https://www.ncbi.nlm.nih.gov/pmc/articles/PMC8100889/,
https://doi.org/10.1177/1178223421995854
42 Mercatelli, D., Scalambra, L., Triboli, L., Ray, F. and Giorgi, F.M. (2020) Gene regulatory network inference resources: a practical overview. Biochim.
Biophys. Acta Gene Regul. Mech. 1863, 194430, https://doi.org/10.1016/j.bbagrm.2019.194430
43 Ghoroghi, S., Mary, B., Larnicol, A., Asokan, N., Klein, A., Osmani, N. et al. (2021) Ral GTPases promote breast cancer metastasis by controlling
biogenesis and organ targeting of exosomes. Elife 10, e61539, https://doi.org/10.7554/eLife.61539
44 Mercatelli, D., Bortolotti, M., Bazzocchi, A., Bolognesi, A. and Polito, L. (2018) Immunoconjugates for osteosarcoma therapy: preclinical experiences and
future perspectives. Biomedicines 6, E19, https://doi.org/10.3390/biomedicines6010019
45 da Cunha, J.P.C., Galante, P.A.F., de Souza, J.E.S., Pieprzyk, M., Carraro, D.M., Old, L.J. et al. (2013) The human cell surfaceome of breast tumors.
Biomed. Res. Int. 2013, 976816, https://doi.org/10.1155/2013/976816
46 Califano, A. and Alvarez, M.J. (2017) The recurrent architecture of tumour initiation, progression and drug sensitivity. Nat. Rev. Cancer 17, 116–130,
https://doi.org/10.1038/nrc.2016.124
47 Schilsky, R.L. (2010) Personalized medicine in oncology: the future is now. Nat. Rev. Drug Discov. 9, 363–366, https://doi.org/10.1038/nrd3181
48 Bethune, M.T. and Joglekar, A.V. (2017) Personalized T cell-mediated cancer immunotherapy: progress and challenges. Curr. Opin. Biotechnol. 48,
142–152, https://doi.org/10.1016/j.copbio.2017.03.024
49 Ciriello, G., Miller, M.L., Aksoy, B.A., Senbabaoglu, Y., Schultz, N. and Sander, C. (2013) Emerging landscape of oncogenic signatures across human
cancers. Nat. Genet. 45, 1127–1133, https://doi.org/10.1038/ng.2762
50 Miura, K., Aoun, K., Yoshida, S. and Kurosawa, Y. (2012) Autoantibodies directed against labile epitopes on cell surface proteins in autoimmune disease
patients: proposal of a novel ELISA for the detection of anti-endothelial cell antibodies. J. Immunol. Methods 382, 32–39,
https://doi.org/10.1016/j.jim.2012.05.002
51 Li, B.C.M., Huh, S.M., Prieto, M.D., Hong, G., Schwarz, C., Moss, R.B. et al. (2021) Biomarkers for the diagnosis of allergic bronchopulmonary
aspergillosis in cystic fibrosis: a systematic review and meta-analysis. J. Allergy Clin. Immunol. Pract. 9, 1909.e4–1930.e4,
https://doi.org/10.1016/j.jaip.2020.12.064
52 Minagar, A., Commins, D., Alexander, J.S., Hoque, R., Chiappelli, F., Singer, E.J. et al. (2008) NeuroAIDS: characteristics and diagnosis of the
neurological complications of AIDS. Mol. Diagn. Ther. 12, 25–43, https://doi.org/10.1007/BF03256266
© 2021 The Author(s). This is an open access article published by Portland Press Limited on behalf of the Biochemical Society and distributed under the Creative Commons Attribution 15
License 4.0 (CC BY).You can also read