HHS Public Access Author manuscript Appl Sci (Basel). Author manuscript; available in PMC 2021 July 22 - Semantic Scholar
←
→
Page content transcription
If your browser does not render page correctly, please read the page content below
HHS Public Access
                                 Author manuscript
                                 Appl Sci (Basel). Author manuscript; available in PMC 2021 July 22.
Author Manuscript

                    Published in final edited form as:
                     Appl Sci (Basel). 2020 September 2; 10(18): . doi:10.3390/app10186187.

                    ACDC: Automated Cell Detection and Counting for Time-Lapse
                    Fluorescence Microscopy
                    Leonardo Rundo1,2,†, Andrea Tangherloni3,4,5,†, Darren R. Tyson6,†,‡, Riccardo Betta7,
                    Carmelo Militello8, Simone Spolaor7, Marco S. Nobile9,10, Daniela Besozzi7, Alexander L. R.
                    Lubbock6, Vito Quaranta6, Giancarlo Mauri7,10, Carlos F. Lopez6,*,‡, Paolo Cazzaniga10,11,*,‡
Author Manuscript

                    1Department    of Radiology, University of Cambridge, Cambridge CB2 0QQ, UK 2Cancer Research
                    UK Cambridge Centre, University of Cambridge, Cambridge CB2 0RE, UK 3Department of
                    Haematology, University of Cambridge, Cambridge CB2 0XY, UK 4Wellcome Trust Sanger
                    Institute, Wellcome Trust Genome Campus, Hinxton CB10 1HH, UK 5Wellcome Trust—Medical
                    Research Council Cambridge, Stem Cell Institute, Cambridge CB2 0AW, UK 6Department of
                    Biochemistry, Vanderbilt University School of Medicine, Nashville, TN 37232, USA 7Department of
                    Informatics, Systems and Communication, University of Milano-Bicocca, 20126 Milan, Italy
                    8Institute of Molecular Bioimaging and Physiology, Italian National Research Council, 90015

                    Cefalù (PA), Italy 9Department of Industrial Engineering & Innovation Sciences, Eindhoven
                    University of Technology, 5612 AZ Eindhoven, The Netherlands 10SYSBIO/ISBE.IT Centre for
                    Systems Biology, 20126 Milan, Italy 11Department of Human and Social Sciences, University of
                    Bergamo, 24129 Bergamo, Italy
Author Manuscript

                    Abstract
                         Advances in microscopy imaging technologies have enabled the visualization of live-cell dynamic
                         processes using time-lapse microscopy imaging. However, modern methods exhibit several
                         limitations related to the training phases and to time constraints, hindering their application in the
                         laboratory practice. In this work, we present a novel method, named Automated Cell Detection
                         and Counting (ACDC), designed for activity detection of fluorescent labeled cell nuclei in time-
                         lapse microscopy. ACDC overcomes the limitations of the literature methods, by first applying
                         bilateral filtering on the original image to smooth the input cell images while preserving edge
                         sharpness, and then by exploiting the watershed transform and morphological filtering. Moreover,
                         ACDC represents a feasible solution for the laboratory practice, as it can leverage multi-core
                         architectures in computer clusters to efficiently handle large-scale imaging datasets. Indeed, our
Author Manuscript

                         Parent-Workers implementation of ACDC allows to obtain up to a 3.7× speed-up compared to the

                    Licensee MDPI, Basel, Switzerland. This article is an open access article distributed under the terms and conditions of the Creative
                    Commons Attribution (CC BY) license (http://creativecommons.org/licenses/by/4.0/).
                    *
                     Correspondence: c.lopez@vanderbilt.edu (C.F.L.); paolo.cazzaniga@unibg.it (P.C.).
                    †These authors contributed equally to this work.
                    ‡Co-corresponding authors.
                    Author Contributions: Conceptualization, L.R., A.T., D.R.T., C.F.L., and P.C.; Investigation, L.R., A.T., D.R.T., D.B., V.Q., C.F.L.,
                    and P.C.; Methodology, L.R., A.T., D.R.T., C.F.L., and P.C.; Software, L.R., A.T., D.R.T., and A.L.R.L.; Validation, L.R., A.T., D.R.T.,
                    R.B., C.M., C.F.L., and P.C.; Writing—original draft, L.R., A.T., D.R.T., A.L.R.L., C.F.L., and P.C.; Writing—review & editing, R.B.,
                    C.M., S.S., M.S.N., D.B., A.L.R.L., V.Q., and G.M.; Visualization, L.R., A.T., D.R.T., C.F.L., and P.C.; Supervision, D.R.T., G.M.,
                    C.F.L., and P.C. All authors read and approved the final manuscript.
                    Conflicts of Interest: The authors declare no conflict of interest.
Rundo et al.                                                                                                  Page 2

                             sequential counterpart. ACDC was tested on two distinct cell imaging datasets to assess its
Author Manuscript

                             accuracy and effectiveness on images with different characteristics. We achieved an accurate cell-
                             count and nuclei segmentation without relying on large-scale annotated datasets, a result
                             confirmed by the average Dice Similarity Coefficients of 76.84 and 88.64 and the Pearson
                             coefficients of 0.99 and 0.96, calculated against the manual cell counting, on the two tested
                             datasets.

                       Keywords
                             bioimage informatics; time-lapse microscopy; fluorescence imaging; cell counting; nuclei
                             segmentation

                       1.     Introduction
Author Manuscript

                                       Advances in microscopy imaging technologies have enabled the visualization of dynamic
                                       live-cell processes using time-lapse microscopy methodologies [1–3]. Therefore, collections
                                       of microscopy images have become a primary source of data to unravel the complex
                                       mechanisms and functions of living cells [4]. The vast quantity and complexity of the data
                                       generated by modern visualization techniques preclude visual or manual analysis, therefore
                                       requiring computational methods to infer biological knowledge from large datasets [5,6]. In
                                       particular, the objects of interest in cellular images are characterized by high variations of
                                       morphology and intensity from image to image [6], which make features such as cell
                                       boundaries and intracellular features difficult to accurately identify. For this reason, cell
                                       segmentation analysis has gained increasing attention over the last decade [7].

                                       The most commonly used free and open-source software tools for microscopy applications
Author Manuscript

                                       in the laboratory are ImageJ [8] or Fiji [9], and CellProfiler [10]. Although these tools offer
                                       customization capabilities, they do not provide suitable functionalities for fast and efficient
                                       high-throughput cell image analysis on large-scale datasets. In addition, CellProfiler Analyst
                                       [11] allows the user to explore and visualize image-based data and to classify complex
                                       biological phenotypes with classic supervised Machine Learning (e.g., Random Forests,
                                       Support Vector Machines). Taken together, these tools provide accurate performance for
                                       image quantification on high-quality annotated datasets but generally lack capabilities to
                                       work in the laboratory practice, because training and model setup phases are required; in
                                       addition, the user is often forced to transfer data from one tool to another for achieving the
                                       desired analysis outcome. Therefore, this hinders these tools to match the time constraints
                                       imposed by time-lapse microscopy studies.
Author Manuscript

                                       Various mathematical morphology methodologies have been extensively used in cell
                                       imaging to tackle the problem of cell segmentation [7]. Wählby et al. [12] presented a
                                       region-based segmentation approach in which both foreground and background seeds are
                                       used as starting points for the watershed segmentation of the gradient magnitude image.
                                       Since more than one seed could be assigned to a single object, initial over-segmentation
                                       might occur. In [13], the authors developed an automated approach based on the Voronoi
                                       tessellation [14] built from the centers of mass of the cell nuclei, to estimate morphological
                                       features of epithelial cells. Similarly to the approach presented in this paper, the authors

                                           Appl Sci (Basel). Author manuscript; available in PMC 2021 July 22.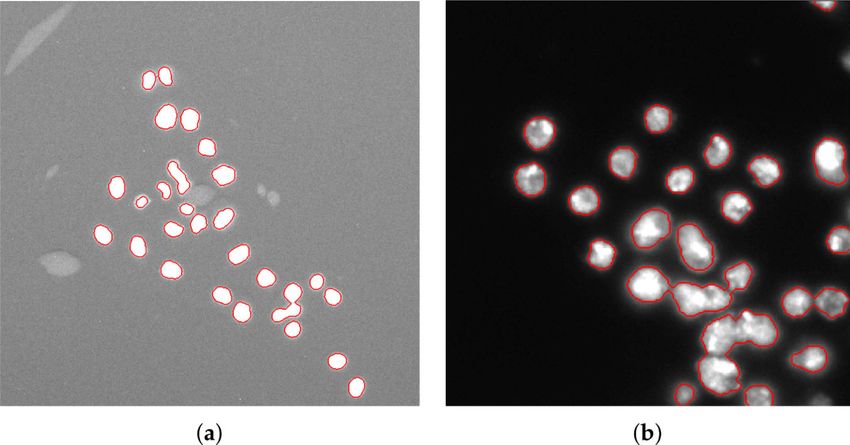
Rundo et al.                                                                                             Page 3

                                   leveraged the watershed algorithm to correctly segment cell nuclei. It is worth noting that we
Author Manuscript

                                   do not exploit Voronoi tessellation since our objective disregards the morphological
                                   properties of adjacent cells in a tissue. Kostrykin et al. [15] introduced an approach based on
                                   globally optimal models for cell nuclei segmentation, which exploits both shape and
                                   intensity information of fluorescence microscopy images. This globally optimal model-
                                   based approach relies on convex level set energies and parameterized elliptical shape priors.
                                   Differently, no detection with ellipse fitting was exploited in [16], as this shape prior is not
                                   always suitable for representing the shape of the cell nuclei because of the highly variable
                                   appearance. In particular, a two-stage method combining the split-and-merge and watershed
                                   algorithms was proposed. In the first splitting stage, the method identifies the clusters by
                                   using inherent characteristics of the cell (such as size and convexity) and separates them by
                                   watershed. The second merging stage aims at detecting the over-segmented regions
                                   according to the area and eccentricity of the segmented regions. These sub-divisions are
Author Manuscript

                                   eliminated by morphological closing.

                                   Machine Learning techniques have been applied to bioimage analysis [17,18]. For instance,
                                   CellCognition aims at annotating complex cellular dynamics in live-cell microscopic movies
                                   [19] by combining Support Vector Machines with hidden Markov models to evaluate the
                                   progression by using morphologically distinct biological states. More recently, it has been
                                   shown that methods based on Deep Convolutional Neural Networks (DCNNs) [20,21] can
                                   successfully address detection and segmentation problems otherwise difficult to solve by
                                   exploiting traditional image processing methods [22]. Further, an ensemble of DCNNs
                                   defined to segment cell images was presented in [23], where a gating network automatically
                                   divides the input image into several sub-problems and assigns them to specialized networks,
                                   allowing for a more efficient learning with respect to a single DCNN.
Author Manuscript

                                   With regard to the most popular architectures for object detection and instance segmentation,
                                   such as Faster Region-CNN (R-CNN) [24] and You Only Look Once (YOLO) [25], these
                                   approaches require a considerable amount of labeled images and yield only a coarse-grained
                                   segmentation in cell imaging [26] and medical image analysis [27]. This does not ensure a
                                   precise separation between adjacent cells. Even though transfer learning (i.e., the use of pre-
                                   trained CNNs on large-scale datasets of natural images) could be applied, hundreds of
                                   accurately annotated input samples should be available [28]. Therefore, parameter-efficient
                                   architectures, including simple trainable activation functions [29] or mixed-scale dense
                                   CNNs [30], might be beneficial to deal with the paucity of manually labeled and validated
                                   datasets. Alternatively, also data augmentation techniques based on Generative Adversarial
                                   Networks (GANs) [31,32] or interactive solutions [33], require time-consuming annotation
                                   by experts.
Author Manuscript

                                   Traditional image segmentation approaches often require experiment-specific parameter
                                   tuning, while DCNNs require large amounts of high-quality annotated samples or ground
                                   truth. The ground truth, representing the extent to which an object is actually present, is
                                   usually delineated by a domain expert, via a tedious, cumbersome and time-consuming
                                   visual and manual approach. The annotated samples for one dataset may not be useful for
                                   another dataset, so new ground truth generation may be needed for a new dataset, thus
                                   limiting the effectiveness of DCNNs. The authors of [22] proposed an approach for

                                       Appl Sci (Basel). Author manuscript; available in PMC 2021 July 22.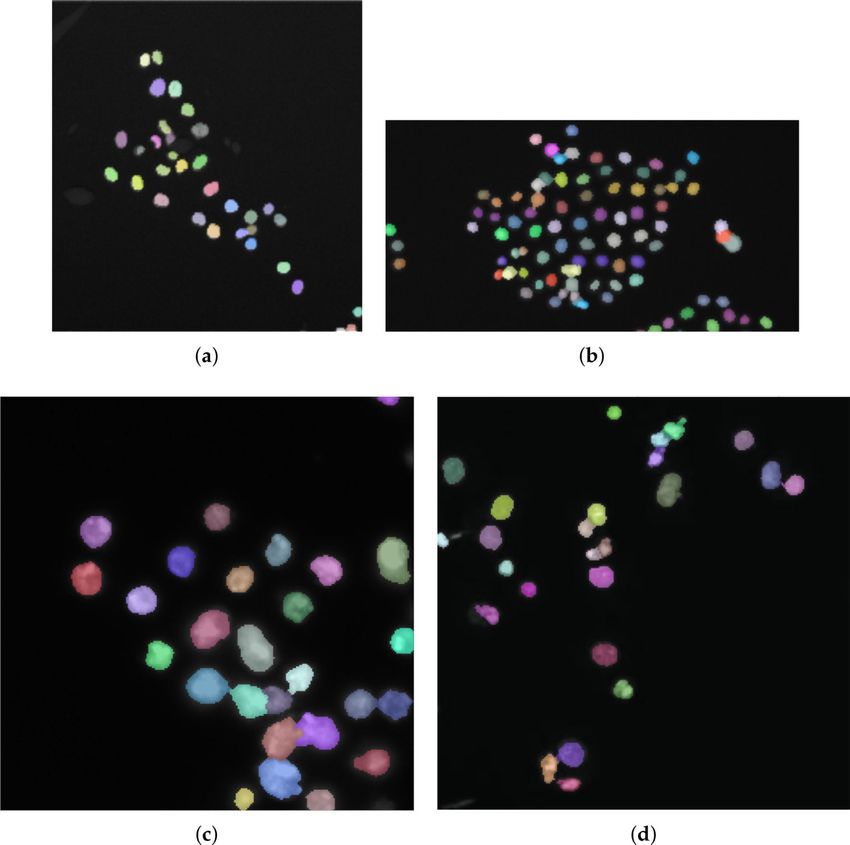
Rundo et al.                                                                                               Page 4

                                   automatically creating high-quality experiment-specific ground truth for segmentation of
Author Manuscript

                                   bright-field images of cultured cells based on end-point fluorescent staining, then exploited
                                   to train a DCNN [34]. In general, applying DCNNs to microscopy images is still challenging
                                   due to the lack of large datasets labeled at the single cell level [34]; moreover, Gamarra et al.
                                   [16] showed that watershed-based methods can achieve performance comparable to DCNN-
                                   based approaches. Thus, unsupervised techniques that do not require a training phase (i.e.,
                                   data fitting or modeling) represent valuable solutions in this practical context [19,35].

                                   In this work, we present a novel method named Automated Cell Detection and Counting
                                   (ACDC), designed for time-lapse microscopy activity detection of fluorescent-labeled cell
                                   nuclei. ACDC is capable of overcoming the practical limitations of the literature approaches,
                                   mainly related to the training phases or time constraints, making it a feasible solution for the
                                   laboratory practice. Recent developments of automated microscopy imaging systems has
                                   allowed for the generation of very large datasets [36], which are typically ~3TB, including
Author Manuscript

                                   over 300,000 images, for each experiment. Each dataset produces novel features due to
                                   differences in the cells used, their fluorescence label intensity, and their specific responses to
                                   anti-cancer treatment conditions. This variation poses challenges to using deep learning-
                                   based segmentation [37] that is trained without including the new data: for any comparisons
                                   across datasets, the segmentation would need to be repeated/updated to include every new
                                   dataset and re-applied to all previous data. To cope with these issues, ACDC uses bilateral
                                   filtering [38] applied on the original image to smooth the input cell image while preserving
                                   edge sharpness. This is followed by watershed transform [39,40] and morphological filtering
                                   [41,42], applied in a fully automatic manner. Thus, ACDC efficiently yields reliable results
                                   by only requiring the settings of a few parameters, which may be conveniently adjusted by
                                   the user. Therefore, unlike sophisticated solutions that do not provide any interactive control,
                                   ACDC makes the end-user sufficiently aware of the underlying automated analysis, thanks
Author Manuscript

                                   to the resulting interpretability of the segmentation model. We demonstrate applications of
                                   ACDC on two different cell imaging datasets in order to show its reliability in different
                                   experimental conditions.

                                   The main contributions of this work are summarized hereafter:

                                       •       ACDC is a fully automatic pipeline for cell detection and counting that exploits
                                               watershed transform [39,40], morphological filtering operations [41,42], and
                                               bilateral filtering [38];

                                       •       ACDC is designed and developed to cope with the analysis of stacks of time-
                                               lapse microscopy images in real-time;

                                       •       ACDC does not require any training phase, and represents a reliable solution
Author Manuscript

                                               even without the availability of large-scale annotated datasets.

                                   The manuscript is structured as follows. Section 2 describes the analyzed fluorescence
                                   imaging datasets, as well as the proposed method. Section 3 presents the results achieved by
                                   ACDC. Discussions and final remarks are provided in Section 4.

                                       Appl Sci (Basel). Author manuscript; available in PMC 2021 July 22.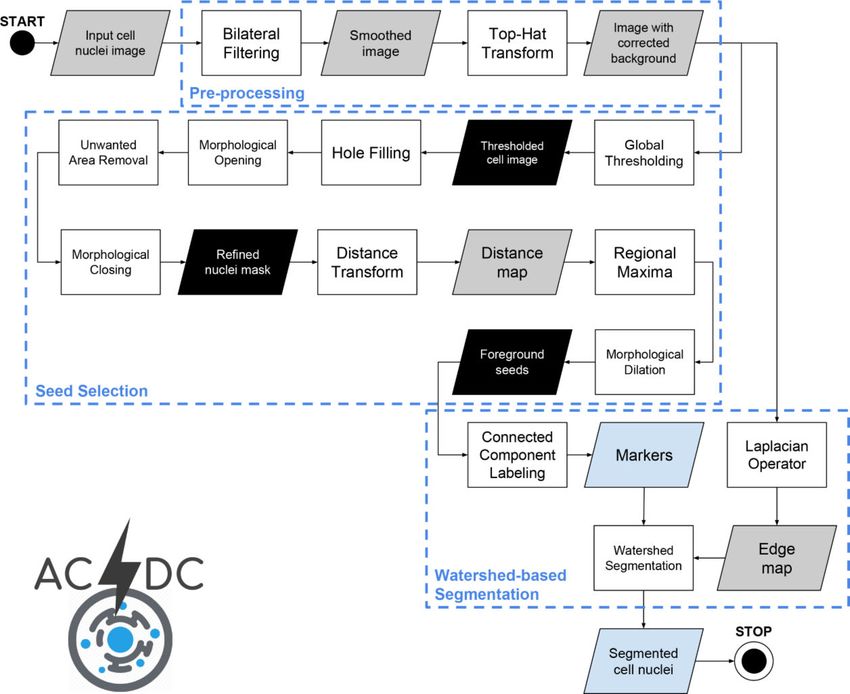
Rundo et al.                                                                                              Page 5

                       2.     Materials and Methods
Author Manuscript

                                     In this section, we first present the fluorescence imaging datasets analyzed in this work, then
                                     we describe the pipeline at the basis of ACDC.

                       2.1.    Fluorescence Microscopy Imaging Data
                                     2.1.1. Vanderbilt University Dataset—This dataset (VU) collected time-lapse
                                     microscopy images from two experiments performed in the Vanderbilt High-Throughput
                                     Screening (HTS) Core Facility at Vanderbilt University (Nashville, TN) with assistance
                                     provided by Dr. Joshua A. Bauer. All images were acquired by using Molecular Devices
                                     (San Jose, CA, USA) from ImageXpress Micro XL using a PCO.EDGE 5.5 CMOS camera
                                     with a 2560 × 2160 image sensor format (6.5 × 6.5 micron pixel size). The center 2160 ×
                                     2160 pixels were extracted during plate acquisition to ensure adequate illumination
                                     uniformity. Images were obtained using a 10× objective in the red channel (Cy3) and
Author Manuscript

                                     sometimes in the green channel (FITC) for the same well and location (overlapping
                                     information). Pixel intensity from the camera has a range of 12 bits stored in a 16-bit format.
                                     The PC-9 human lung adenocarcinoma cell line used in these studies had previously been
                                     engineered to express histone 2B conjugated to monomeric red fluorescent protein and
                                     geminin 1–110 fused to monomeric azami green [43–45]. The total number of the analyzed
                                     images with the corresponding manual cell segmentation was 46, related to two distinct
                                     experiments. The manual annotation was performed with a custom MatLab tool by a
                                     biologist (R.B.) and then validated by another expert with expertise in biochemistry and
                                     cancer biology (D.R.T.). For images with sparse cell nuclei, the manual procedure took
                                     approximately 1–2 min, while it took 30–40 min on images with high cell coverage. Two
                                     examples of input images are shown in Figure 1.
Author Manuscript

                                     2.1.2. 2018 Data Science Bowl—With the goal of validating ACDC on imaging data
                                     coming from different sources, we considered a selection of the training set of the Data
                                     Science Bowl (DSB) dataset [37,46], which was a competition organized by Kaggle (San
                                     Francisco, CA, USA). We used only the human-annotated training set because the gold
                                     standard for the test set is not publicly provided by the organizers. The annotations were
                                     manually performed by a team of expert biologists in a collaborative manner, where a single
                                     expert outlined the nuclei and the other collaborators reviewed the result.

                                     The goal of the DSB regarded the detection of the nuclei of the cells to identify each
                                     individual cell in a sample, a mandatory operation to understand the underlying biological
                                     processes. This dataset includes a large number of labelled nuclei images acquired under a
                                     variety of conditions, magnification, and imaging modality (i.e., bright-field and
Author Manuscript

                                     fluorescence microscopy). Image size varies among 256 × 256, 256 × 320, 260 × 347, 360 ×
                                     360, 512 × 640, 520 × 696, 603 × 1272, and 1040 × 1388 pixels.

                                     The DSB dataset aimed at evaluating the generalization capabilities of computational
                                     methods when dealing with significantly different data. Therefore, to run tests with ACDC,
                                     we first extracted the fluorescence microscopy images from the training set; then, we
                                     selected images where the maximum size of the region cells segmented in the ground truth
                                     was equal or less than 1000 pixels to obtain a magnification factor roughly comparable to

                                         Appl Sci (Basel). Author manuscript; available in PMC 2021 July 22.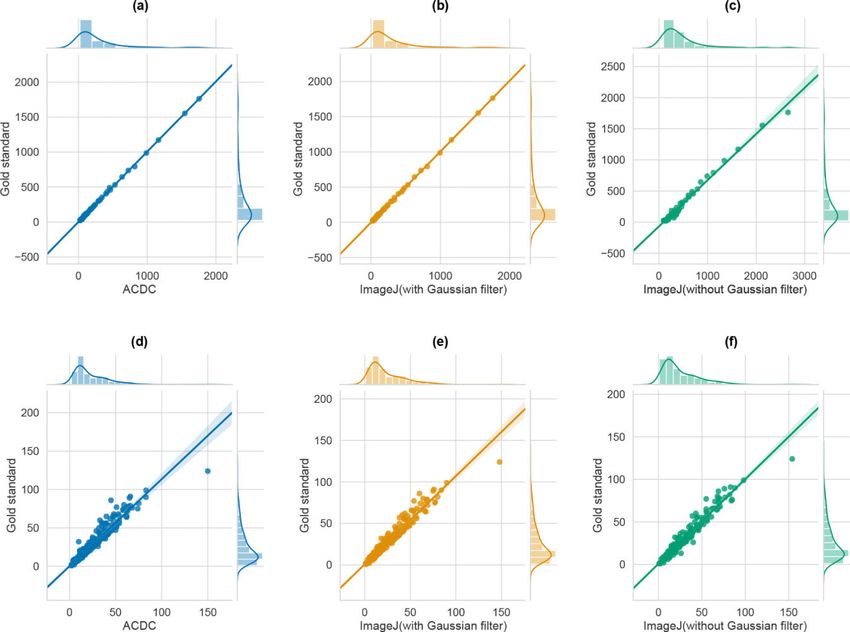
Rundo et al.                                                                                               Page 6

                                     the Vanderbilt University dataset, for a total of 301 images. According to the work presented
Author Manuscript

                                     in [37], we considered only the small fluorescent nuclei images (e.g., those obtained using a
                                     microscope objective of 10× or 20×), which are very common in biomedical research.

                                     Three examples of input images with highly different characteristics are shown in Figure 2.

                                     Finally, Figure 3 shows the boxplots the reveal the high variability of the analyzed
                                     microscopy imaging datasets, in terms of the number of cells and cell coverage, to support
                                     the validity of the experiments carried out in this study.

                       2.2.    Acdc: A Method for the Automatic Cell Detection and Counting
                                     Advances in optics and imaging systems have enabled biologists to visualize live-cell
                                     dynamic processes by time-lapse microscopy images. However, the imaging data recorded
                                     during even a single experiment may consist of hundreds of objects over thousands of
Author Manuscript

                                     images, which makes manual inspection a tedious, time-consuming and inaccurate option.
                                     Traditional segmentation techniques proposed in the literature generally exhibit low
                                     performance on live unstained cell images. These limitations are mainly due to low contrast,
                                     intensity-variant, and non-uniform illuminated images [1]. Therefore, novel automated
                                     computational tools tailored to quantitative system-level biology are required.

                                     ACDC is a method designed for time-lapse microscopy that aims at overcoming the main
                                     limitations of the literature methods [10,19,47], especially in terms of efficiency and
                                     execution time, by means of a fully automatic strategy that allows for reproducible
                                     measurements [48]. Each step of the pipeline underlying ACDC has been carefully
                                     optimized to reduce the running time required by large size images. We also provide two
                                     distributed versions of ACDC that allow the users to analyse a stack of images in real-time.
Author Manuscript

                                     The processing pipeline of ACDC exploits classic image processing techniques in a smart
                                     fashion, enabling feasible analyses in real laboratory environments. Figure 4 outlines the
                                     overall flow diagram of the ACDC segmentation pipeline, as described hereafter. It is worth
                                     noting that the number of parameters that need to be set in the underlying image processing
                                     operations involves only the kernel size of spatial filters and the structuring element sizes in
                                     morphological operations, providing a reliable yet simple solution. Nevertheless, these
                                     parameters allow the user to have control over the achieved cell segmentation results. Unlike
                                     DCNN-based black- or opaque-boxes, ACDC offers an interpretable model for biologists
                                     that may conveniently adjust the parameters values according to the cell lines under
                                     investigations. Differently from supervised Machine Learning approaches [11,18,22], ACDC
                                     does not require any training phase, thus representing a reliable and practical solution even
                                     without the availability of large-scale annotated datasets.
Author Manuscript

                                     2.2.1. Pre-Processing—The input microscopy image is pre-processed to yield a
                                     convenient input to the downstream watershed-based segmentation by means of the
                                     following steps:

                                         1.      Application of bilateral filtering that allows for denoising the image ℐ while
                                                 preserving the edges by means of a non-linear combination of nearby image
                                                 values [38]. This noise-reducing smoothing filter combines gray levels (colors)

                                         Appl Sci (Basel). Author manuscript; available in PMC 2021 July 22.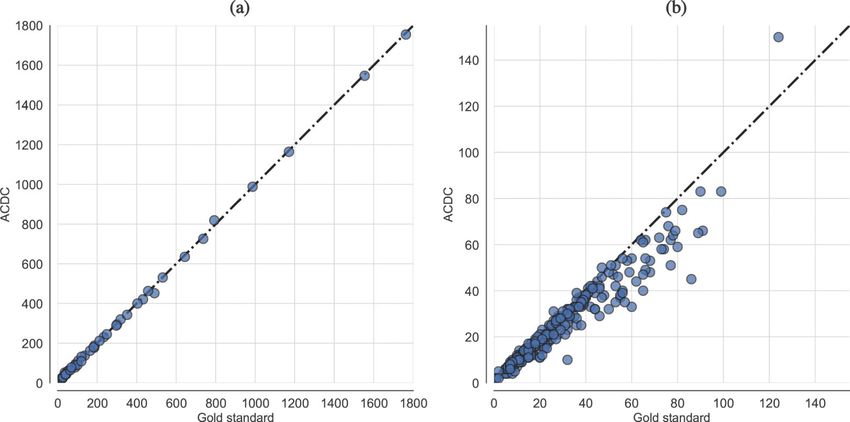
Rundo et al.                                                                                                 Page 7

                                               according to both a geometric closeness function c and a radiometric
Author Manuscript

                                               (photometric) similarity function s. This combination is used to strengthen near
                                               values with respect to distant values in both spatial and intensity domains. This
                                               simple yet effective strategy allows for contrast enhancement [49]. Bilateral filter
                                               has been shown to work properly in fluorescence imaging even preserving the
                                               directional information, such as in the case of the F-actin filaments [50]. This
                                               denoising technique was effectively applied to biological electron microscopy
                                               [51], as well as to cell detection [52], revealing better performance—compared to
                                               low-pass filtering—in noise reduction without removing the structural features
                                               conveyed by strong edges. The most commonly used version of bilateral filtering
                                               is the shift-invariant Gaussian filtering, wherein both the closeness function c and
                                               the similarity function s are Gaussian functions of the Euclidean distance
                                               between their arguments [38]. With more details, c is radially symmetric:
                                                             1   p−q 2
Author Manuscript

                                               c(p, q) = e− 2     σs  .    Consistently, the similarity function s can be defined as:
                                                            1    I(p) − I(q 2
                                               s(p, q) = e− 2        σc
                                                                           ) .
                                                                             In ACDC we set σc = 1 and σs = σglobal (where
                                               σglobal is the the standard deviation of the input image ℐ) for the standard
                                               deviation of the Gaussian functions c and s, respectively. This smart denoising
                                               approach allows us to keep the edge sharpness while reducing the noise of the
                                               processed image, so avoiding cell region under-estimation.

                                       2.      Application of top-hat transform for background correction with a binary circular
                                               structuring element (radius: 21 pixels) on the smoothed image. This operation
                                               accounts for non-uniform illumination artifacts, by extracting the nuclei from the
                                               background. The white top-hat transform is the difference between the input
                                               image I and the opening of ℐ with a gray-scale structuring element b:
Author Manuscript

                                               Tw = ℐ − ℐ ∘ b [53].

                                   The results of the pre-processing images applied to Figures 1a and 2a are shown in Figure
                                   5a,b, respectively. For the pre-processing step, ACDC requires only 3 parameters, namely:
                                   σc and σs for the bilateral filtering, and a structuring element for the hat-top transform.

                                   2.2.2. Nucleus Seed Selection—The following steps are executed to obtain a reliable
                                   seed selection, so that the cells nuclei can be accurately extracted from the pre-processed
                                   images:

                                       1.      A thresholding technique has to be first applied to detect the cell regions. Both
                                               global and local thresholding techniques aim at separating foreground objects of
                                               interest from the background in an image, considering differences in pixel
Author Manuscript

                                               intensities [54]. Global thresholding determines a single threshold for all pixels
                                               and works well if the histogram of the input image contains well-separated peaks
                                               corresponding to the desired foreground objects and background [55]. Local
                                               adaptive thresholding techniques estimate the threshold locally over sub-regions
                                               of the entire image, by considering only a user-defined window with a specific
                                               size and exploiting local image properties to calculate a variable threshold
                                               [53,54]. These algorithms find the threshold by locally examining the intensity

                                       Appl Sci (Basel). Author manuscript; available in PMC 2021 July 22.
Rundo et al. Page 8
values of the neighborhood of each pixel according to image intensity statistics.
Author Manuscript
To avoid unwanted pixels in the thresholded image, mainly due to small noisy
hyper-intense regions caused by non-uniform illumination, we apply the Otsu
global thresholding method [55] instead of local adaptive thresholding based on
the mean value in a neighborhood [56]. Moreover, global threshold techniques
are significantly faster than local adaptive strategies.
2. Hole filling is applied to remove possible holes in the detected nuclei due to
small hypo-intense regions included in the nuclei regions.
3. Morphological opening (using a disk with 1-pixel radius as a structuring
element) is used to remove loosely connected-components, such as in the case of
almost overlapping cells.
4. Unwanted areas are removed according to the connected-components size. In
Author Manuscript
particular, the detected candidate regions with areas smaller than 40 pixels are
removed to refine the achieved segmentation results by robustly avoiding false
positives.
5. Morphological closing (using a 2-pixel radius circular structuring element) is
applied to smooth the boundaries of the detected nuclei and avoid the under-
estimation of the detected nuclei regions.
6. The approximate Euclidean distance transform (EDT) from the binary mask,
achieved by applying the Otsu algorithm and refined by using the previous 3
steps, is used to obtain the matrix of distances of each pixel to the background by
exploiting the ℓ2 Euclidean distance [57] (with a 5 × 5 pixel mask for a more
accurate distance estimation). This algorithm calculates the distance to the
closest background pixel for each pixel of the source image. Let G be a regular
Author Manuscript
grid and f : G ℝ an arbitrary function on the grid, called a sampled function
[58]. We define the distance transform Df : G ℝ of f as:
Df (p) = min (d(p, q) + f(q)), (1)
q∈G
where d(p, q) is a measure of the distance between the pixels p and q. Owing to
the fact that cells have a pseudo-circular shape, we used the Euclidean distance,
achieving the EDT of f. In the case of binary images, with a set of points P ⊆ G,
the distance transform DP is a real-valued image of the same size:
DP = min (d(p, q) + 1(q)), (2)
q∈P
Author Manuscript
where:
0, if q ∈ P
1(q) =
∞, otherwise
Appl Sci (Basel). Author manuscript; available in PMC 2021 July 22.Rundo et al. Page 9
is an indicator function for the membership in P [58]. The computed distance
Author Manuscript
map is normalized by applying contrast linear stretching to the full 8-bit dynamic
range.
7. Regional maxima computation allows for estimating foreground peaks on the
normalized distance map. Regional maxima are connected-components of pixels
with a constant intensity value, whose external boundary pixels have all a lower
intensity value [42]. The resulting binary mask contains pixels that are set to 1
for identifying regional maxima, while all other pixels are set to 0. A 5 × 5 pixel
square was employed as structuring element.
8. Morphological dilation (using a 3-pixel radius circular structuring element) is
applied to the foreground peaks previously detected for better defining the
foreground regions and merging neighboring local minima into a single seed
point. The segmentation results on Figure 5a,b are shown in Figure 6a,b,
Author Manuscript
respectively. The detail in Figure 5a shows that ACDC is highly specific to cell
nuclei detection, discarding non-cell regions related to acquisition artifacts.
For the Nucleus Seed Selection step of the pipeline, the user can set the following
parameters: a structuring element for the morphological opening; a structuring element for
the morphological closing; a structuring element for the morphological dilation; the
minimum size (in pixels) for the unwanted area removal.
2.2.3. Cell Nuclei Segmentation Using the Watershed Transform—The
watershed transform [39] is one of the most used approaches in cell image segmentation [7],
while it was originally proposed in the field of mathematical morphology [42].
The intuitive description of this transform is straightforward: assuming an image as a
Author Manuscript
topographic relief, where the height of each point is directly related to its gray level, and
considering rain gradually falling on the terrain, then the watersheds are the lines that
separate the resulting catchment basins [40]. This technique is valuable because the
watershed lines generally correspond to the most significant edges among the markers [41]
and are useful to separate overlapping objects, such as in the case of the nuclei separation in
cell segmentation in human-derived cardiospheres (i.e., 3D clusters of cardiac progenitor
cells) [59]. Even when no strong edges between the markers exist, the watershed method is
able to detect a contour in the area. This contour is detected on the pixels with higher
contrast [39]. As a matter of fact, edge-based segmentation techniques—which strongly rely
on local discontinuities in gray levels—often do not yield unbroken edge curves, thus
heavily limiting their performance in cell segmentation [12]. Unfortunately, it is also well-
known that the watershed transform may be affected by over-segmentation issues, thus
Author Manuscript
requiring further processing [60].
From a computational perspective, the watershed algorithm analyzes a gray-scale image by
means of a flooding-based procedure. Since the flooding process is performed on either a
gradient image or edge map, the basins should emerge along the edges. As a matter of fact,
during the watershed process, the edge information allows for a better discrimination of the
boundary pixels with respect to the original image. Finally, only the markers of the resulting
Appl Sci (Basel). Author manuscript; available in PMC 2021 July 22.Rundo et al. Page 10
foreground cells are selected. ACDC uses an efficient version of the watershed algorithm
Author Manuscript
that exploits a priority queue to store the pixels according to the pixel value (i.e., the height
in the gray-scale image landscape) and the entry order into the queue (giving precedence to
the closest marker). More specifically, during the flooding procedure, this process sorts the
pixels in increasing order of their intensity value by relying on a breadth-first scan of the
plateaus based on a first-in-first-out data structure [40].
Although the watershed transform can detect also weak edges, it may not accurately detect
the edge of interest in the case of blurred boundaries [60]. This sensitivity to noise could be
worsened by the use of high pass filters to estimate the gradient and the edges, which
amplify the noise. We address this issue by formerly applying the bilateral filter that reduces
the halo effects [38]. Accordingly, we implemented the following steps:
1. Connected-component labeling [61] of the foreground region binary mask for
Author Manuscript
encoding the markers employed in the following watershed algorithm.
2. Laplacian operator for producing the edge image [53] to feed the edge map as
input to the watershed transform.
3. Watershed segmentation on the edge image according to the previously defined
markers [62,63].
ACDC does not require any settings for the Cell Nuclei Segmentation Using the Watershed
Transform step.
2.2.4. Implementation Details—The sequential version of ACDC has been entirely
developed using the Python programming language (version 2.7.12), exploiting the
following libraries and packages: NumPy, SciPy, OpenCV, scikit-image [64], and Mahotas
Author Manuscript
[65]. The resulting processing pipeline makes use of classic image processing techniques in
a smart fashion [66], thus enabling an efficient and feasible solution in time-lapse
microscopy environments.
For laboratory feasibility purposes, an asynchronous job queue, based on a distributed
message passing paradigm—namely Advanced Message Queuing Protocol (AMQP)—was
developed using Celery [67] (implementing workers that execute tasks in parallel) and
RabbitMQ [68] (exploited as a message broker to handle communications among workers)
for leveraging modern multi-core processors and computer clusters.
We also developed a Parent-Workers strategy using mpi4py, which provides bindings of the
Message Passing Interface (MPI) specifications for Python to leverage multi-core and many-
core resources [69]. The distributed strategy used to accelerate ACDC is similar to that
Author Manuscript
employed in [70–72], where the Parent allocates the resources and orchestrates the workers,
which run ACDC to analyze the assigned images. This distributed version of ACDC is 3.7×
faster than the sequential version by exploiting 6 cores of a CPU Intel Core E5–2650 v4
(clock 2.2 GHz).
Appl Sci (Basel). Author manuscript; available in PMC 2021 July 22.Rundo et al. Page 11
2.3. Segmentation Evaluation Metrics
Author Manuscript
The accuracy of the achieved segmentation results S was quantitatively evaluated with
respect to the real measurement—i.e., the ground truth T obtained manually by an
experienced biologist—by using the Dice Similarity Coefficient (DSC):
2× S∩T
DSC = × 100(%), (3)
S + T
as well as the Intersection over Union (IoU) metrics, also known as Jaccard coefficient:
S∩T S∩T DSC
IoU = × 100(%) = × 100(%) = . (4)
S∪T S + T − S∩T 2 − DSC
3. Results
Author Manuscript
3.1. ACDC Performance
In this section, we present the results obtained with ACDC on the VU dataset and the 2018
DSB training dataset [37,46]. Figure 7 shows an example of results obtained on VU and
DSB datasets, where the detected cells are displayed with different colors to highlight the
separation among overlapping and merging cells. We note that the analyzed images are
characterized by a considerable variability in terms of cell density. Figure 8 shows a
representative case for both the VU and DSB datasets, where the results of ACDC are
slightly different from the gold standard. In the case of the VU dataset (Figure 8a), it is clear
that some groups of small cells, characterized by very similar intensity values without strong
discontinuities are detected by ACDC as a single connected-component (orange arrows). On
the contrary, for the 2018 DSB dataset (Figure 8b), ACDC is capable of accurately
Author Manuscript
separating groups of cells that were erroneously delineated as single connected-components
in the gold standard (green arrows); moreover, the spurious speckles included in the 2018
DSB gold standard (highlighted by blue dashed boxes), are not detected by ACDC since
these very small regions are characterized by hypo-intense fluorescence levels.
The assessment of cell count was quantified by means of the Pearson coefficient to measure
the linear correlation between the automated and manual cell counts. The accuracy of the
achieved segmentation results was evaluated by using the DSC and the IoU metrics. Table 1
reports the results—by also comparing the performance of ACDC with and without bilateral
filtering—achieved on the VU and 2018 DSB datasets, which are supported by the scatter
plots in Figure 9 that reports the results concerning the case of the bilateral filter. The
achieved high ρ coefficient values confirm the effectiveness of the proposed approach,
Author Manuscript
according to a validation performed against the manual cell counting, which is considered as
the gold standard.
A strong positive correlation between the cell counts computed automatically by ACDC and
the manual measurements was observed for both datasets analyzed in this study. In
particular, in the case of the VU dataset, the automated cell counting is strongly consistent
with the corresponding manual measurements, by denoting also a unity slope, as shown in
Figure 9a. In the case of the DSB dataset (Figure 9b), the identity straight-line reveals a
Appl Sci (Basel). Author manuscript; available in PMC 2021 July 22.Rundo et al. Page 12
negative offset in the ACDC measurements. This finding means that the cell counts achieved
Author Manuscript
by ACDC slightly under-estimated the gold standard in approximately 55% of cases.
Besides the high variability of the fluorescence images included in the DSB dataset, this
systematic error often depends on the gold standard binary masks, where the cell nuclei are
not always precisely separated (since the DSB challenge was focused on the segmentation
task), and consider also partial connected-components of cell nuclei smaller than 40 pixels
located at the cropped image borders. Notice that no ACDC setting was modified, so some
very small partial cell components were removed according to the morphological
refinements based on the connected-component size.
The agreement between ACDC and the manual cell counting measurements can be
graphically represented also by using a Bland-Altman plot [73], as reported in Figure 10 for
both datasets. The Bland-Altman analysis allows for a better data visualization by showing
the pairwise difference between the measurements obtained with the two methods, against
Author Manuscript
their mean value. In this way, we can assess any possible relationship between the estimation
errors and easily detect any outlier (i.e., observations outside the 95% limits of agreement).
Figure 10 reveals that ACDC achieved reproducible results also by considering the whole
range of the cell counts concerning the analyzed cell microscopy images; only about the 4%
and 6% of outliers are observed in the ACDC results achieved on the VU and DSB datasets,
respectively. This confirms the observations on the scatter plots in Figure 9; neither
systematic discrepancy between the measurements nor bias can be observed in the VU
dataset, while a negative bias is visible in the case of the DSB dataset.
The analysis of the DSC and IoU mean values reported in Table 1, calculated on the VU
images, reveals a good agreement between the segmentation results achieved by ACDC and
the gold standard. The standard deviation values confirm the high variability encountered in
Author Manuscript
the input datasets. In particular, in the case of the VU images, this evidence strongly depends
on the density of the cells represented in the input image. As a matter of fact, the DSC and
IoU metrics is highly affected by the size of the foreground regions with respect to the
background. This behavior is confirmed by the results achieved on the DSB dataset, where
the IoU values are considerably higher than those achieved on the VU images, even though
the Pearson coefficient is slightly lower in this case. Accordingly, the high standard
deviation for the DSB dataset is due to the intrinsic variety of the images—in terms of image
size, zoom factor, and specimen type—included in this dataset (see Section 2.1.2). In
general, the bilateral filtering allows us to achieve better segmentation performance, while
no appreciable difference was found in the ρ values. Therefore, we incorporated the bilateral
filtering into the ACDC pipeline tested in the experiments.
Author Manuscript
The mean execution times concerning the segmentation tests are shown in Table 1. These
experiments were run on a personal computer equipped with a quad-core Intel Core 7700HQ
(clock frequency 3.80 GHz), 16 GB RAM, and Ubuntu 16.04 LTS operating system. The
computational efficiency of ACDC is confirmed in both cases, as cell detection and counting
tasks can be completed in respect of the time constraints imposed by the high-throughput
laboratory routine. As expected, the execution times are dependent on the image size. This
trend is mainly due to the bilateral filtering operation, as it can be observed in the execution
times measured on the VU dataset reported in Table 1.
Appl Sci (Basel). Author manuscript; available in PMC 2021 July 22.Rundo et al. Page 13
3.2. Comparison with Other Cell Imaging Tools and Segmentation Methods
Author Manuscript
We compared the performance of ACDC against two pipelines realized with ImageJ v1.53c
[8]. Since filtering operations typically represent the initial step used to enhance the
subsequent segmentation, in order to assess any performance improvement introduced by
low-pass filtering, we implemented the processing pipelines in ImageJ, to perform cell
segmentation and counting, with and without a Gaussian filtering. To be more precise, the
steps are: (i) Gaussian low-pass filtering; (ii) uneven background removal by an histogram-
based rolling-ball algorithm; (iii) Otsu global thresholding; (iv) morphological operations
including hole-filling; (v) watershed algorithm for cell nuclei separation. The pipelines have
been tested on both VU and DSB datasets.
Figure 11 shows the results concerning cell counting achieved by ACDC and the two ImageJ
pipelines. In the case of the VU dataset (plots a–c), the ImageJ pipelines tend to over-
Author Manuscript
estimate the number of cells in the images; on the contrary, considering the DSB dataset
(plots d-f), the results are comparable. The segmentation results shown in Figure 12 present
a different scenario. ACDC is generally better than the ImageJ pipelines; we also note that
the application of Gaussian filtering in the ImageJ pipelines does not allow us to markedly
improve the segmentation outcome. However, over-segmentation can be observed when low-
pass filtering is not applied.
Table 2 reports the values of DSC and IoU achieved by ACDC and the tested ImageJ
pipelines. The highest values for these metrics are obtained by ACDC both in the case of VU
and DSB datasets. Moreover, the very high ρ coefficients indicate that all approaches are
effective, when validated against the gold standard. To assess whether the difference in the
achieved segmentation performance between ACDC and ImageJ with Gaussian filter is
statistically significant, we performed a two-sided Wilcoxon signed rank test on both paired
Author Manuscript
DSC and IoU results [74], with the null hypothesis that the samples come from continuous
distributions with equal medians, and considering a significance level of 0.05. The results of
the test confirmed that both the achieved DSC and IoU values are statistically different in the
case of ACDC and ImageJ with Gaussian filtering (p < 0.001 and p < 0.01 for the VU and
DSB datasets, respectively).
As a final test, we considered a recently published work that takes into account the SNP
HEp-2 Cell Dataset (SNPHEp-2) [75]. SNPHEp-2 is composed of images acquired using a
monochrome high dynamic range microscopy camera, equipped with a plan-Apochromat
20×/0.8 objective lens and an LED illumination source, resulting in a dataset considerably
different compared to VU and DSB datasets. Specifically, we compared ACDC against
CellProfiler [10], Marker-Controlled Watershed algorithm (MC-Watershed), and Split and
Author Manuscript
Merge Watershed (SM-Watershed) [16].
The DSC and IoU metrics reported in Table 3 are computed against the gold standard
automatically obtained by processing the DAPI channel. To obtain a fair comparison with
the results presented in [16], we processed the 40 cell images from the homogeneous class
used in that work. Even if the SNPHEp-2 dataset consists of cell images with different
characteristics with respect to those contained in the VU and 2018 DSB datasets, ACDC
achieved better results than CellProfiler, and slightly worse results than MC-Watershed and
Appl Sci (Basel). Author manuscript; available in PMC 2021 July 22.Rundo et al. Page 14
SM-Watershed approaches, which were specifically tailored to analyze this kind of images
Author Manuscript
(see Table 3). These results were achieved by using the same settings in the pipeline, further
showing that ACDC is a reliable method that can also be easily tuned to obtain satisfactory
segmentation and cell counting outcomes on different datasets.
4. Discussion and Conclusions
The fully automatic pipeline for cell detection and counting proposed in this paper, called
ACDC, exploits watershed transform [39,40] and morphological filtering operations [41,42],
and also benefits from the edge-preserving smoothing achieved by the bilateral filtering [38].
Notably, this pipeline does not depend on expert knowledge and can be deployed by setting
only a few parameters. The capabilities of ACDC were tested on two different cell imaging
datasets characterized by significantly different acquisition devices, specimens, image
characteristics, and experimental conditions. ACDC was shown to be accurate and reliable in
Author Manuscript
terms of cell counting and segmentation accuracy, thus representing a laboratory feasible
solution also thanks to its computational efficiency. As a matter of fact, the Pearson
coefficient achieved both in the case of the VU and DSB datasets was higher than 0.96,
demonstrating an excellent agreement between automated cell count achieved with ACDC
and the manual gold standard. The performance of ACDC were also compared with two
pipelines defined with ImageJ; our results highlighted that while the cell counting was
comparable, ACDC allowed us to achieved better segmentation outcomes. Moreover, we
considered an additional cell images dataset and compared the outcome achieved with
ACDC against CellProfiler, Marker-Controlled Watershed and Split and Merge Watershed,
further showing the reliability of ACDC for what concerns segmentation and cell counting
results. Finally, with the current ACDC implementation, it is also possible to distribute the
computation on multi-core architectures and computer clusters, to further reduce the running
Author Manuscript
time required to analyze large single image stacks. To this end, an asynchronous job queue,
based on a distributed message passing paradigm was developed exploiting Celery and
RabbitMQ.
The time-lapse microscopy image samples analyzed in this study are considerably different
from to the publicly available microscopy images of cell nuclei, such as in [75–77]. Indeed,
these datasets were captured under highly different microscope configurations compared to
the VU experiments; with particular interest to magnification, a 40×/0.9 numerical aperture
and a 20×/0.8 objective lens were used in [75–77], respectively. These acquisition
characteristics, summarized in Table 4, produce substantially different images, compared to
the datasets analyzed in this work, as in the case of the average coverage (i.e., the percentage
of pixels covered by cell nuclei), which is remarkably different. As a future development, we
Author Manuscript
plan to improve ACDC, to achieve accurate cell nuclei detection and analysis for different
cell imaging scenarios, independently from the acquisition methods.
We also aim at exploiting the most recent Machine Learning techniques [78] to accurately
refine the segmentation results. The improvements may be achieved by classifying the
geometrical and textural features extracted from the detected cells [79]. This advanced
computational analysis can allow us to gain biological insights into complex cellular
processes [17]. Finally, as a biological application, in the near future we plan to focus on the
Appl Sci (Basel). Author manuscript; available in PMC 2021 July 22.Rundo et al. Page 15
Fluorescent, Ubiquitination-based Cell-Cycle Indicator (FUCCI) reporter system for
Author Manuscript
investigating cell-cycle states [45], by combining accurate nuclei segmentation results, on
multiple fluorescent proteins for cell labeling [80], and live-cell imaging of cell cycle and
division.
Acknowledgments:
The authors would like to thank Margarita Gamarra for her help with the analysis performed on the SNP HEp-2
Cell Dataset.
Funding: The Vanderbilt HTS Core receives support from the Vanderbilt Institute of Chemical Biology and the
Vanderbilt Ingram Cancer Center (P30 CA68485). Research reported in this publication was supported by National
Cancer Institute of the National Institutes of Health under award numbers: R50CA243783 (DRT) and
U54CA186193 (DRT, VQ). The content is solely the responsibility of the authors and does not necessarily represent
the official views of the National Institutes of Health.
Author Manuscript
References
1. Kanade T; Yin Z; Bise R; Huh S; Eom S; Sandbothe MF; Chen M Cell image analysis: Algorithms,
system and applications. In Proceedings of the IEEE Workshop on Applications of Computer Vision
(WACV), Kona, HI, USA, 5–7 January 2011; pp. 374–381.
2. Orth JD; Kohler RH; Foijer F; Sorger PK; Weissleder R; Mitchison TJ Analysis of mitosis and
antimitotic drug responses in tumors by in vivo microscopy and single-cell pharmacodynamics.
Cancer Res. 2011, 71, 4608–4616. [PubMed: 21712408]
3. Manandhar S; Bouthemy P; Welf E; Danuser G; Roudot P; Kervrann C 3D flow field estimation and
assessment for live cell fluorescence microscopy. Bioinformatics 2020, 36, 1317–1325. [PubMed:
31633779]
4. Peng H Bioimage informatics: A new area of engineering biology. Bioinformatics 2008, 24, 1827–
1836. [PubMed: 18603566]
5. Meijering E; Carpenter AE; Peng H; Hamprecht FA; Olivo-Marin JC Imagining the future of
bioimage analysis. Nat. Biotechnol. 2016, 34, 1250. [PubMed: 27926723]
Author Manuscript
6. Peng H; Bateman A; Valencia A; Wren JD Bioimage informatics: a new category in Bioinformatics.
Bioinformatics 2012, 28, 1057–1057. [PubMed: 22399678]
7. Meijering E Cell segmentation: 50 years down the road [life sciences]. IEEE Signal Process. Mag.
2012, 29, 140–145.
8. Schneider CA; Rasband WS; Eliceiri KW NIH Image to ImageJ: 25 years of image analysis. Nat.
Methods 2012, 9, 671. [PubMed: 22930834]
9. Schindelin J; Arganda-Carreras I; Frise E; Kaynig V; Longair M; Pietzsch T; Preibisch S; Rueden C;
Saalfeld S; Schmid B; et al. Fiji: An open-source platform for biological-image analysis. Nat.
Methods 2012, 9, 676. [PubMed: 22743772]
10. Carpenter AE; Jones TR; Lamprecht MR; Clarke C; Kang IH; Friman O CellProfiler: Image
analysis software for identifying and quantifying cell phenotypes. Genome Biol. 2006, 7, R100.
[PubMed: 17076895]
11. Dao D; Fraser AN; Hung J; Ljosa V; Singh S; Carpenter AE CellProfiler Analyst: Interactive data
exploration, analysis and classification of large biological image sets. Bioinformatics 2016, 32,
Author Manuscript
3210–3212. [PubMed: 27354701]
12. Wählby C; Sintorn IM; Erlandsson F; Borgefors G; Bengtsson E Combining intensity, edge and
shape information for 2D and 3D segmentation of cell nuclei in tissue sections. J. Microsc. 2004,
215, 67–76. [PubMed: 15230877]
13. Kaliman S; Jayachandran C; Rehfeldt F; Smith AS Limits of Applicability of the Voronoi
Tessellation Determined by Centers of Cell Nuclei to Epithelium Morphology. Front. Physiol.
2016, 7, 551. [PubMed: 27932987]
14. Honda H Description of cellular patterns by Dirichlet domains: The two-dimensional case. J.
Theor. Biol. 1978, 72, 523–543. [PubMed: 672241]
Appl Sci (Basel). Author manuscript; available in PMC 2021 July 22.Rundo et al. Page 16
15. Kostrykin L; Schnörr C; Rohr K Globally optimal segmentation of cell nuclei in fluorescence
microscopy images using shape and intensity information. Med. Image Anal. 2019, 58, 101536.
Author Manuscript
[PubMed: 31369995]
16. Gamarra M; Zurek E; Escalante HJ; Hurtado L; San-Juan-Vergara H Split and merge watershed: A
two-step method for cell segmentation in fluorescence microscopy images. Biomed. Signal
Process. Control 2019, 53, 101575. [PubMed: 33719364]
17. Angermueller C; Pärnamaa T; Parts L; Stegle O Deep learning for computational biology. Mol.
Syst. Biol. 2016, 12, 878. [PubMed: 27474269]
18. Berg S; Kutra D; Kroeger T; Straehle CN; Kausler BX; Haubold C; Schiegg M; Ales J; Beier T;
Rudy M; et al..ilastik: Interactive machine learning for (bio) image analysis. Nat. Methods 2019,
16, 1226–1232. [PubMed: 31570887]
19. Held M; Schmitz MH; Fischer B; Walter T; Neumann B; Olma MH; Peter M; Ellenberg J; Gerlich
DW CellCognition: time-resolved phenotype annotation in high-throughput live cell imaging. Nat.
Methods 2010, 7, 747. [PubMed: 20693996]
20. Ciresan D; Giusti A; Gambardella LM; Schmidhuber J Deep Neural Networks Segment Neuronal
Membranes in Electron Microscopy Images; Advances in Neural Information Processing Systems
Author Manuscript
(NIPS) : Lake Tahoe, NV, USA, 2012; pp. 2843–2851.
21. Rosati R; Romeo L; Silvestri S; Marcheggiani F; Tiano L; Frontoni E Faster R-CNN approach for
detection and quantification of DNA damage in comet assay images. Comput. Biol. Med. 2020,
103912. [PubMed: 32658777]
22. Sadanandan SK; Ranefall P; Le Guyader S; Wählby C Automated Training of Deep Convolutional
Neural Networks for Cell Segmentation. Sci. Rep. 2017, 7, 7860. [PubMed: 28798336]
23. Hiramatsu Y; Hotta K; Imanishi A; Matsuda M; Terai K; Liu D; Zhang D; Song Y; Zhang C;
Huang H; et al. Cell Image Segmentation by Integrating Multiple CNNs. In Proceedings of the
IEEE Conference on Computer Vision and Pattern Recognition (CVPR) Workshops, Salt Lake
City, UT, USA, 18–22 June 2018; pp. 2205–2211.
24. Ren S; He K; Girshick R; Sun J Faster R-CNN: Towards real-time object detection with region
proposal networks. In Proceedings of the Advances in Neural Information Processing Systems
(NIPS), Montrea, QC, Canada, 7–12 December 2015; pp. 91–99.
25. Redmon J; Divvala S; Girshick R; Farhadi A You only look once: Unified, real-time object
detection. In Proceedings of the Conference on Computer Vision and Pattern Recognition (CVPR),
Author Manuscript
Las Vegas, NV, USA, 27–30 June 2016; pp. 779–788.
26. Alam MM; Islam MT Machine learning approach of automatic identification and counting of
blood cells. Healthc. Technol. Lett. 2019, 6, 103–108. [PubMed: 31531224]
27. Han C; Kitamura Y; Kudo A; Ichinose A; Rundo L; Furukawa Y; Umemoto K; Li Y; Nakayama H
Synthesizing diverse lung nodules wherever massively: 3D multi-conditional GAN-based CT
image augmentation for object detection. In Proceedings of the International Conference on 3D
Vision (3DV), Quebec, QC, Canada, 16–19 September 2019; pp. 729–737.
28. Bayramoglu N; Heikkilä J Transfer learning for cell nuclei classification in histopathology images.
In Proceedings of the European Conference on Computer Vision (ECCV) Workshops; Springer:
Berlin/Heidelberg, Germany, 2016; Volume 9915, pp. 532–539.
29. Apicella A; Isgrò F; Prevete R A simple and efficient architecture for trainable activation functions.
Neurocomputing 2019, 370, 1–15.
30. Pelt DM; Sethian JA A mixed-scale dense convolutional neural network for image analysis. Proc.
Natl. Acad. Sci. USA 2018, 115, 254–259. [PubMed: 29279403]
Author Manuscript
31. Osokin A; Chessel A; Carazo Salas RE; Vaggi F GANs for biological image synthesis. In
Proceedings of the IEEE International Conference on Computer Vision (ICCV), Venice, Italy, 22–
29 October 2017; pp. 2233–2242.
32. Han C; Rundo L; Araki R; Furukawa Y; Mauri G; Nakayama H; Hayashi H Infinite brain MR
images: PGGAN-based data augmentation for tumor detection. In Neural Approaches to Dynamics
of Signal Exchanges; Smart Innovation, Systems and Technologies; Springer: Berlin/Heidelberg,
Germany, 2019; Volume 151, pp. 291–303.
33. Lo Castro D; Tegolo D; Valenti C A visual framework to create photorealistic retinal vessels for
diagnosis purposes. J. Biomed. Inform. 2020, 103490. [PubMed: 32640292]
Appl Sci (Basel). Author manuscript; available in PMC 2021 July 22.Rundo et al. Page 17
34. Kraus OZ; Ba JL; Frey BJ Classifying and segmenting microscopy images with deep multiple
instance learning. Bioinformatics 2016, 32, i52–i59. [PubMed: 27307644]
Author Manuscript
35. Militello C; Rundo L; Minafra L; Cammarata FP; Calvaruso M; Conti V; Russo G MF2C3: Multi-
Feature Fuzzy Clustering to Enhance Cell Colony Detection in Automated Clonogenic Assay
Evaluation. Symmetry 2020, 12, 773.
36. Meyer CT; Wooten DJ; Paudel BB; Bauer J; Hardeman KN; Westover D; Lovly CM; Harris LA;
Tyson DR; Quaranta V Quantifying drug combination synergy along potency and efficacy axes.
Cell Syst. 2019, 8, 97–108. [PubMed: 30797775]
37. Caicedo JC; Goodman A; Karhohs KW; Cimini BA; Ackerman J; Haghighi M; Heng C; Becker T;
Doan M; McQuin C; et al. Nucleus segmentation across imaging experiments: The 2018 Data
Science Bowl. Nat. Methods 2019, 16, 1247–1253. [PubMed: 31636459]
38. Tomasi C; Manduchi R Bilateral filtering for gray and color images. In Proceedings of the Sixth
International Conference on Computer Vision (ICCV), Bombay, India, 4–7 January 1998; pp. 839–
846.
39. Soille PJ; Ansoult MM Automated basin delineation from digital elevation models using
mathematical morphology. Signal Process. 1990, 20, 171–182.
Author Manuscript
40. Vincent L; Soille P Watersheds in digital spaces: an efficient algorithm based on immersion
simulations. IEEE Trans. Pattern Anal. Mach. Intell. 1991, 13, 583–598.
41. Beucher S; Meyer F The morphological approach to segmentation: The watershed transformation.
In Mathematical Morphology in Image Processing; Marcel Dekker Inc.: New York, NY, USA,
1993; Volume 34, pp. 433–481.
42. Soille P Morphological Image Analysis: Principles and Applications, 2nd ed.; Springer Science &
Business Media: Secaucus, NJ, USA, 2004.
43. Tyson DR; Garbett SP; Frick PL; Quaranta V Fractional proliferation: A method to deconvolve cell
population dynamics from single-cell data. Nat. Methods 2012, 9, 923. [PubMed: 22886092]
44. Harris LA; Frick PL; Garbett SP; Hardeman KN; Paudel BB; Lopez CF; Quaranta V; Tyson DR
An unbiased metric of antiproliferative drug effect in vitro. Nat. Methods 2016, 13, 497–500.
[PubMed: 27135974]
45. Sakaue-Sawano A; Kurokawa H; Morimura T; Hanyu A; Hama H; Osawa H; Kashiwagi S; Fukami
K; Miyata T; Miyoshi H; et al. Visualizing spatiotemporal dynamics of multicellular cell-cycle
Author Manuscript
progression. Cell 2008, 132, 487–498. [PubMed: 18267078]
46. Kaggle. 2018 Data Science Bowl. 2018. Available online: https://www.kaggle.com/c/data-science-
bowl-2018 (accessed on 14 December 2019).
47. Georgescu W; Wikswo JP; Quaranta V CellAnimation: An open source MATLAB framework for
microscopy assays. Bioinformatics 2011, 28, 138–139. [PubMed: 22121157]
48. Sansone M; Zeni O; Esposito G Automated segmentation of comet assay images using Gaussian
filtering and fuzzy clustering. Med. Biol. Eng. Comput. 2012, 50, 523–532. [PubMed: 22402889]
49. Schettini R; Gasparini F; Corchs S; Marini F; Capra A; Castorina A Contrast image correction
method. J. Electron. Imaging 2010, 19, 023005.
50. Venkatesh M; Mohan K; Seelamantula CS Directional bilateral filters for smoothing fluorescence
microscopy images. AIP Advances 2015, 5, 084805.
51. Jiang W; Baker ML; Wu Q; Bajaj C; Chiu W Applications of a bilateral denoising filter in
biological electron microscopy. J. Struct. Biol. 2003, 144, 114–122. [PubMed: 14643214]
52. Li K; Miller ED; Chen M; Kanade T; Weiss LE; Campbell PG Computer vision tracking of
stemness. In Proceedings of the 5th IEEE International Symposium on Biomedical Imaging: From
Author Manuscript
Nano to Macro (ISBI), Paris, France, 14–17 May 2008; pp. 847–850.
53. Gonzalez R; Woods R Digital Image Processing, 3rd ed.; Prentice Hall Press: Upper Saddle River,
NJ, USA, 2002.
54. Jain AK Fundamentals of Digital Image Processing, 1st ed.; Prentice Hall Press: Upper Saddle
River, NJ, USA, 2002.
55. Otsu N A threshold selection method from gray-level histograms. IEEE Trans. Syst. Man Cybern.
1975, 11, 23–27.
Appl Sci (Basel). Author manuscript; available in PMC 2021 July 22.You can also read