Mechanistic models of signaling pathways deconvolute the glioblastoma single-cell functional landscape
←
→
Page content transcription
If your browser does not render page correctly, please read the page content below
Published online 25 June 2020                                                                                NAR Cancer, 2020, Vol. 2, No. 2 1
                                                                                                                  doi: 10.1093/narcan/zcaa011

Mechanistic models of signaling pathways
deconvolute the glioblastoma single-cell functional
landscape
Matı́as M. Falco1,2 , Marı́a Peña-Chilet1,2 , Carlos Loucera1 , Marta R. Hidalgo3 and
Joaquı́n Dopazo 1,2,4,5,*
1
 Clinical Bioinformatics Area, Fundación Progreso y Salud (FPS), Hospital Virgen del Rocı́o, 41013 Sevilla, Spain,

                                                                                                                                                              Downloaded from https://academic.oup.com/narcancer/article/2/2/zcaa011/5862620 by guest on 14 October 2020
2
 Bioinformatics in Rare Diseases (BiER), Centro de Investigaciones Biomédicas en Red en Enfermedades Raras
(CIBERER), 41013 Sevilla, Spain, 3 Unidad de Bioinformática y Bioestadı́stica, Centro de Investigación Prı́ncipe
Felipe (CIPF), 46012 Valencia, Spain, 4 Functional Genomics Node, FPS/ELIXIR-ES, Hospital Virgen del Rocı́o,
41013 Sevilla, Spain and 5 Computational Systems Medicine Group, Institute of Biomedicine of Seville (IBIS), Hospital
Virgen del Rocı́o, 41013 Sevilla, Spain

Received March 10, 2020; Revised June 08, 2020; Editorial Decision June 10, 2020; Accepted June 11, 2020

ABSTRACT                                                                        INTRODUCTION
Single-cell RNA sequencing is revealing an unex-                                Since the beginning of the century, transcriptomic tech-
pectedly large degree of heterogeneity in gene ex-                              nologies, which evolved from microarrays (1) to RNA se-
pression levels across cell populations. However, lit-                          quencing (RNA-seq) (2), have provided an increasingly
tle is known on the functional consequences of this                             accurate insight into mRNA expression (3). The techno-
                                                                                logical advances of RNA-seq technologies have increased
heterogeneity and the contribution of individual cell
                                                                                the resolution in the quantification of transcripts until
fate decisions to the collective behavior of the tis-
                                                                                the unprecedented level of the mRNA component of in-
sues these cells are part of. Here, we use mecha-                               dividual single cells. The possibility of studying gene ex-
nistic modeling of signaling circuits, which reveals                            pression at the single-cell level opens the door to novel
a complex functional landscape at single-cell level.                            biological questions that were not possible using cur-
Different clusters of neoplastic glioblastoma cells                             rent tissue-level RNA-seq approaches. For example, single-
have been defined according to their differences in                             cell RNA-seq (scRNA-seq) has allowed a high-resolution
signaling circuit activity profiles triggering specific                         analysis of developmental trajectories (4,5), the detailed
cancer hallmarks, which suggest different functional                            characterization of tissues (6,7), the identification of rare
strategies with distinct degrees of aggressiveness.                             cell types (8) or the analysis of stochastic gene expres-
Moreover, mechanistic modeling of effects of tar-                               sion and transcriptional kinetics (9,10), just to cite a few
                                                                                cases.
geted drug inhibitions at single-cell level revealed,
                                                                                   The continuous publication of scRNA-seq studies is pro-
how in some cells, the substitution of VEGFA, the                               ducing an increasingly large wealth of data on cell-level gene
target of bevacizumab, by other expressed proteins,                             activity measurements under countless conditions. How-
like PDGFD, KITLG and FGF2, keeps the VEGF path-                                ever, the functional consequences of such gene activity at
way active, insensitive to the VEGFA inhibition by                              single-cell level remains mostly unknown. Among the many
the drug. Here, we describe for the first time mecha-                           methods and applications published for the management
nisms that individual cells use to avoid the effect of                          of scRNA-seq data (11), only a small proportion of them
a targeted therapy, providing an explanation for the                            provide some functional insights on the results. For exam-
innate resistance to the treatment displayed by some                            ple, MetaNeighbor (12), SCDE (13) or PAGODA (14) an-
cells. Our results suggest that mechanistic modeling                            notates cell types based on conventional gene set enrich-
could become an important asset for the definition of                           ment analysis (15,16). Other algorithms, such as SCENIC
personalized therapeutic interventions.                                         (17), PIDC (18), SCODE (19) or SINCERITIES (20), of-
                                                                                fer the possibility of inferring regulatory networks as well.
                                                                                However, functional profiling methods have evolved from

* To   whom correspondence should be addressed. Tel: +34 677910887; Email: joaquin.dopazo@juntadeandalucia.es


C The Author(s) 2020. Published by Oxford University Press on behalf of NAR Cancer.
This is an Open Access article distributed under the terms of the Creative Commons Attribution License (http://creativecommons.org/licenses/by/4.0/), which
permits unrestricted reuse, distribution, and reproduction in any medium, provided the original work is properly cited.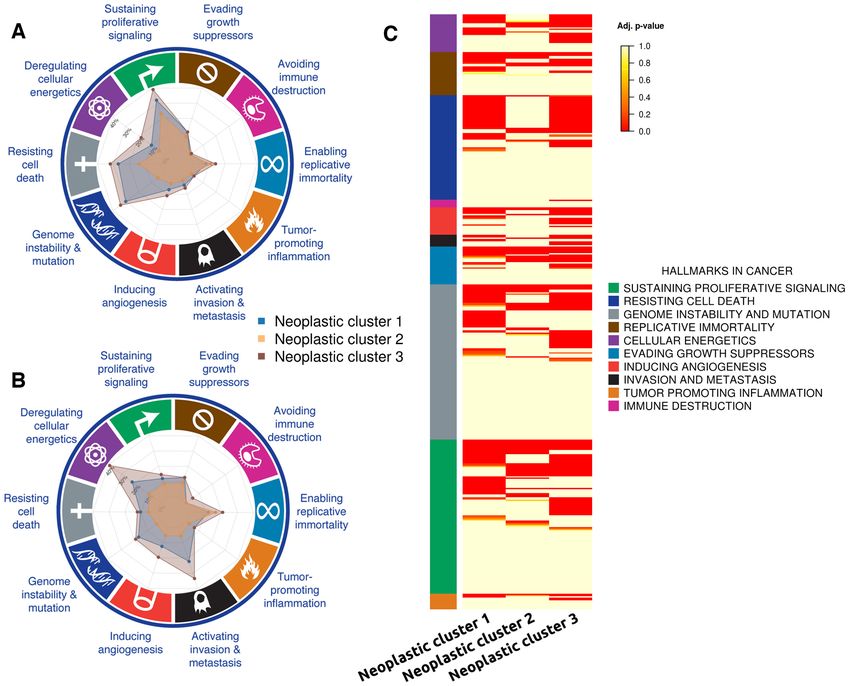
2 NAR Cancer, 2020, Vol. 2, No. 2

the analysis of simple gene sets or inferred regulatory gene         MATERIALS AND METHODS
networks to more sophisticated computational systems bi-
                                                                     Data
ology approaches that allow a mechanistic understanding
on how molecular cell signaling networks enable cells to             A large scRNA-seq dataset containing 3589 cells of dif-
make cell fate decisions that ultimately define a healthy tis-       ferent types obtained in four patients from a glioblastoma
sue or organ, and how deregulation of these signaling net-           study (45) was downloaded from GEO (GSE84465). Cells
works leads to pathological conditions (21–23). Specifically,        corresponded to the tumor, and to the periphery of the tu-
mechanistic models have helped to understand the disease             mor.
mechanisms behind different cancers (24–27), rare diseases
(28,29), the mechanisms of action of drugs (29,30) and other
                                                                     Data imputation and primary processing
physiologically interesting scenarios such as obesity (31) or
the postmortem cell behavior of a tissue (32). Although              Count values for the scRNA-seq were downloaded from

                                                                                                                                          Downloaded from https://academic.oup.com/narcancer/article/2/2/zcaa011/5862620 by guest on 14 October 2020
there are several mechanistic modeling algorithms available          GEO. Since many of these data are affected by dropout
that model different aspects of signaling pathway activity,          events (13), they were subjected to the three imputation
Hipathia (24) has been demonstrated to outperform other              methods, MAGIC (46), scImpute (47) and DrImpute (48),
competing algorithms in terms of sensitivity and specificity         as implemented in the corresponding software packages.
(23).                                                                Each method has its own preprocessing pipeline explained
   Here, we propose the use of mechanistic models of signal-         in the corresponding publication. The Rand index (49),
ing activities (24,33) that trigger cell functionalities related     which represents the frequency of occurrence of agreements
with cancer hallmarks (34), as well as other cancer-related          of elements in the same cluster with respect to the random
relevant cellular functions to understand the consequences           expectation, was used as an objective criterion for clustering
of gene expression profiles on cell functionality at single-cell     comparison.
level. Such mechanistic models use gene expression data to             Once imputed, samples were log transformed and a trun-
produce an estimation of activity profiles of signaling cir-         cation by quantile 0.99 was applied. Finally, the values were
cuits defined within pathways (24,33). An additional advan-          normalized between 0 and 1, as required by the downstream
tage of mechanistic models is that they can be used not only         functional analysis with Hipathia.
to understand molecular mechanisms of disease or of drug
action but also to predict the potential consequences of gene        Hipathia mechanistic model
perturbations over the circuit activity in a given condition
(35). Actually, in a recent work, our group has successfully         The Hipathia method uses KEGG pathways (50) to de-
predicted therapeutic targets in cancer cell lines with a pre-       fine circuits that connect any possible receptor protein to
cision of over 60% (25).                                             specific effector proteins. Gene expression values are used
   An interesting model to be studied from the viewpoint             in the context of these circuits to model signaling activity,
of mechanistic models is glioblastoma, the most common               which ultimately triggers specific cell activities, as described
and aggressive of gliomas (36). The current treatment for            in (24). A total of 98 KEGG pathways involving a total of
glioblastoma includes maximal safe surgical resection fol-           3057 genes that form part of 4726 nodes were used to define
lowed by radiotherapy and chemotherapy (37), often com-              a total of 1287 signaling circuits. The intensity value of sig-
bined with other drugs such as bevacizumab in an at-                 nal transduced to the effector is estimated by the following
tempt to overcome resistances (38). Despite this intense             recursive formula:
treatment, the mean survival of glioblastoma patients is                                ⎛                  ⎞
only 15 months and resistances to the therapy are quite
                                                                              Sn = υn · ⎝1 −      (1 − sa )⎠ ·    (1 − si ) ,      (1)
common (39–41). This high rate of treatment failure has
                                                                                              sa ∈A            si ∈I
been attributed to the lack of specific therapies for indi-
vidual tumor types (42,43). Moreover, it is well known               where Sn is the signal intensity for the current node n, vn is
that glioblastoma tumors with a common morphologi-                   its normalized gene expression value, A is the set of activa-
cal diagnosis display a high heterogeneity at the genomic            tion signals (sa ) arriving to the current node from activation
level (44).                                                          edges and I is the set of inhibitory signals (si ) arriving to the
   The availability of glioblastoma single-cell gene expres-         node from inhibition edges (24).
sion data (45) provides a unique opportunity to understand              The Hipathia algorithm (27) is implemented as an R
the behavior of a cancer type at the cell level. Here, we show       package available in Bioconductor (https://bioconductor.
for the first time how mechanistic models applied at single-         org/packages/release/bioc/html/hipathia.html) as well as
cell level provide an unprecedentedly detailed dissection of         at a web server (http://hipathia.babelomics.org/) and as
the tumor into functional profiles at the scale of individ-          a Cytoscape application (http://apps.cytoscape.org/apps/
ual cells that throw new light on how cells ultimately de-           cypathia).
termine its behavior. Moreover, since mechanistic models
allow simulating interventions on the system studied, we
show a comprehensive simulation of the potential effect of           Differential signaling activity
drugs at single-cell level that discloses, for the first time, the   Two groups of circuit activity profiles can be compared
mechanisms and strategies used by subpopulations of cells            and the differences in activity of any circuit can be tested
to evade the effect of the drug.                                     by means of different tests. Although non-parametric tests
NAR Cancer, 2020, Vol. 2, No. 2 3

seem more adequate, and are suitable for small size stud-          with k-means. They found 12 main clusters with a homo-
ies, it has been noted that for larger sizes and, especially,      geneous cell composition that was further experimentally
when data display a highly skewed distribution, which is ex-       validated, which were astrocytes, two myeloid cell clus-
actly this case, they tend to systematically give smaller P-       ters, three neoplastic cell clusters, neurons, oligodendro-
values and parametric tests are preferable (51). In partic-        cytes, oligodendrocyte progenitor cells and three vascular
ular, limma (52), which has been demonstrated to be very           cell clusters. Then, gene expression values were imputed
efficient for gene expression data analysis, will be used.         using the above-mentioned methods (MAGIC, scImpute
                                                                   and DrImpute). Next, gene expression values were used
Signaling circuits associated with cancer hallmarks                to infer signaling circuit activities with the Hipathia algo-
                                                                   rithm (24) as implemented in the Bioconductor applica-
Each effector is known to be associated with one or several        tion (https://bioconductor.org/packages/release/bioc/html/
cell functions. This information is extracted from both the        hipathia.html). The values of circuit activity were subjected

                                                                                                                                     Downloaded from https://academic.oup.com/narcancer/article/2/2/zcaa011/5862620 by guest on 14 October 2020
UniProt (53) and Gene Ontology (54) annotations corre-             to the same procedure (t-SNE dimensionality reduction and
sponding to the effector gene (24). However, in some cases,        k-means clustering) and the resulting clusters were com-
the annotations are too ambiguous or refer to roles of the         pared to the original ones obtained in the glioblastoma
gene in many different conditions, tissues, developmental          study using the Rand index (49). Figure 1A shows the clus-
stages, etc., thus making it difficult to understand its ulti-     tering obtained with the genes following the procedure de-
mate functional role. In addition, in this study the activity of   scribed above [equivalent to Figure 2 of the original study
signaling circuits relevant in cancer is particularly interest-    (45)], which can be compared with the clustering of the sam-
ing. Since a number of these effector genes have been related      ples using the circuit activities obtained with the gene ex-
specifically with one or several cancer hallmarks (34) in the      pression values imputed with scImpute (Figure 1B), DrIm-
scientific literature, the CHAT tool (55), a text mining-based     pute (Figure 1C) and MAGIC (Figure 1D). The compari-
application to organize and evaluate scientific literature on      son of the clusters obtained with the three imputation meth-
cancer, allows linking gene names with cancer hallmarks.           ods was follows: scImpute, 0.745; DrImpute, 0.852; and
                                                                   MAGIC, 0.858. Although MAGIC rendered a slightly bet-
Subtyping of cancer cells                                          ter Rand index, DrImpute was chosen as the imputation
                                                                   method because the dispersion of the clusters obtained was
The SubtypeME tool from the GlioVis data portal (56) was           very similar to the one observed in the ground truth cluster-
used to obtain the subtype of cancer (classical, proneural         ing (Figure 1A). The similarity in the clustering, which ac-
or mesenchymal), based on the signature of 50 genes (57).          counts for cell types, suggests that the imputation method
This tool provides three methods to assign subtype: single-        is rendering values that result in coherent signaling circuit
sample gene set enrichment analysis, K-nearest neighbors           estimations.
and support vector machine. Subtype was assigned when at
least two of the methods made an identical subtype predic-
tion. The subtyping tools use gene data without imputation.
                                                                   Functional characterization of cancer cells
RESULTS                                                            Once verified that cell types defined by gene expression pro-
                                                                   files (45) are supported by signaling profiles as well, the ob-
Selection of the optimal imputation method
                                                                   vious comparison is the glioblastoma cell clusters versus the
Since mechanistic models consider the topology of signal-          clusters composed by the different brain cells (oligodendro-
ing circuits to estimate signal transduction activity in the       cytes, neurons, astrocytes and oligodendrocyte progenitor
cell, the discrimination between genes with missing expres-        cells). It is interesting to note that normal cells, no mat-
sion values and genes that are not expressed is crucial, given     ter which patient they were sampled from, display a simi-
that, depending on the location of the gene within the cir-        lar functional profile; that is, the patients are intermingled
cuit, it can play the role of a switch. Since dropout events       within the clusters corresponding to any cell type. However,
(the observation of a gene at a moderate expression level in       in the case of the neoplastic clusters, although some among-
one cell that cannot be detected in another cell) are quite        cluster overlap exists, their composition is mainly driven by
common in scRNA-seq experiments (13), and taking them              the patient sampling origin (see Supplementary Figure S1).
as zero values can disturb the inferred activity of the circuit,   Since circuit activity bridges gene expression to signaling ac-
the use of imputation methods is crucial for the application       tivity and ultimately cell functionality, an assessment of the
of the mechanistic model. Among the best performer impu-           differences between cell types from a functional perspective
tation methods available (58), three of them were checked          can be achieved by means of a differential cell activity sta-
to decide which one is optimal in the context of signaling         tistical contrast. The cell functional responses triggered by
pathway activity inference: MAGIC (46), scImpute (47) and          the circuits differentially activated can be easily retrieved,
DrImpute (48).                                                     and among them, those related with cancer hallmarks (34)
   In order to decide which imputation method produced             can be identified using the CHAT tool (55), as explained in
the most realistic results, we used the clustering produced        the ‘Materials and Methods’ section.
by the highly expressed genes in the original single-cell             In order to detect which of the circuits display a signifi-
glioblastoma study (45) as ground truth. There, the au-            cant change in activity, the three neoplastic cell clusters (1,
thors applied t-SNE (59) over the 500 most variable and            2 and 3 in Figure 1C) are compared to the normal brain
highly expressed genes and then clustered the resulting data       cells (oligodendrocytes, oligodendrocyte precursor cells, as-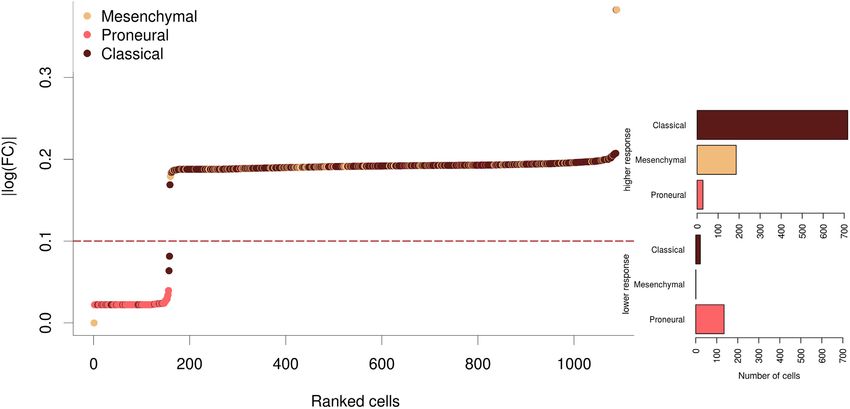
4 NAR Cancer, 2020, Vol. 2, No. 2

                                                                                                                                                             Downloaded from https://academic.oup.com/narcancer/article/2/2/zcaa011/5862620 by guest on 14 October 2020
Figure 1. Clustering of the samples based on gene expression and signaling circuit activities obtained with different gene imputation methods. Data were
subjected to t-SNE dimensionality reduction and the k-means clustering of the two main components is represented. (A) The clustering obtained with
the gene expression values following the procedure described in the original glioblastoma study (45). Clustering obtained using all the circuit activities
inferred using gene expression values imputed with (B) scImpute, which imputes 48% of the genes, (C) DrImpute, which imputes 85% of the genes, and
(D) MAGIC, which makes the imputation over the whole set of genes. Cell types are labeled with colors.

trocytes and neurons, labeled as O, OPC, A and N, respec-                      circuits; see Supplementary Table S1). Figure 2 represents
tively, in Figure 1C).                                                         the number of differentially activated signaling circuits in-
   The comparison between the neoplastic clusters against                      volved in cancer hallmarks observed in the three neoplastic
the brain normal cells resulted in two different patterns of                   cell clusters. This representation provides a summary of the
circuit activity: neoplastic clusters 1 and 3 present a higher                 strategy used by any particular neoplastic cluster in terms
number of signaling circuits differentially activated (309                     of the number of signaling circuits that control cell func-
and 336, respectively) than neoplastic cluster 2 (only 96                      tionalities identifiable as cancer hallmarks. Figure 2A de-
NAR Cancer, 2020, Vol. 2, No. 2 5
Downloaded from https://academic.oup.com/narcancer/article/2/2/zcaa011/5862620 by guest on 14 October 2020
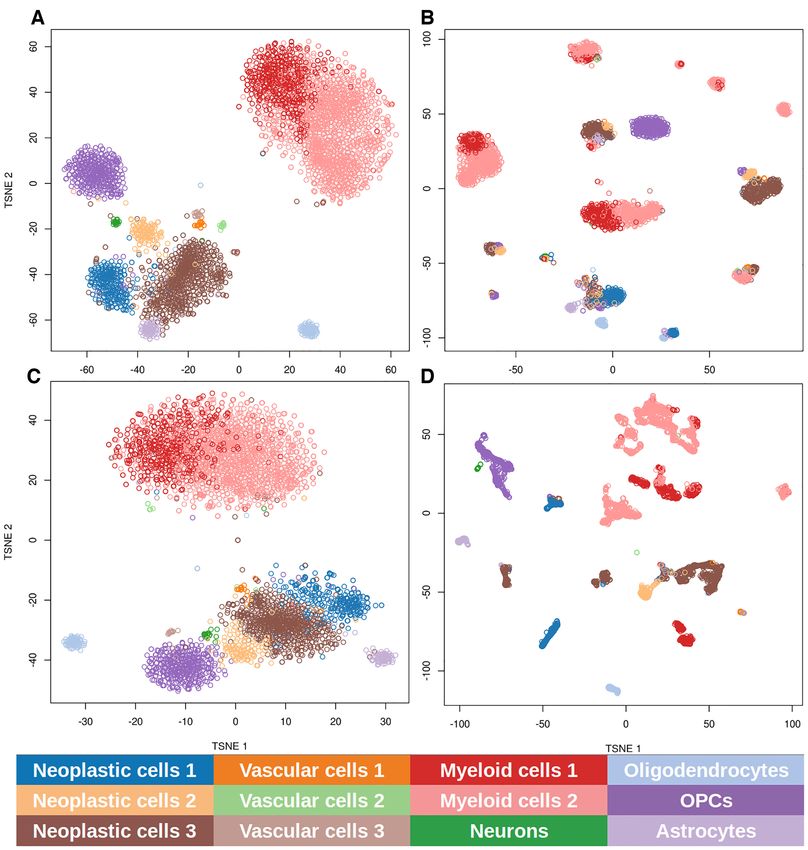
Figure 2. Circuits related to cancer hallmarks observed in the three neoplastic cell clusters. (A) Percentage of the total number of circuits with a significant
differential activity in the neoplastic cells. The most internal division is 10% and every division increases a 10%. (B) Percentage of circuits with a differential
activity with respect to the total number of circuits annotated to any of the cancer hallmarks. (C) Heat map with the signaling circuits related to the different
cancer hallmarks that have been found to be differentially activated in cells of each neoplastic cluster.
picts the absolute number of circuits with a significant dif- both clusters have circuit activity related to ‘Deregulation of
ferential activity in the neoplastic cells and Figure 2B de- cellular energetics’, ‘Genome instability and mutation’ and
picts the same results but as percentages with respect to the ‘Invasion and metastasis’ hallmarks (see Table 1 and Fig-
total number of circuits annotated to any of the cancer hall- ure 2C for details). It is also interesting to note from Fig-
marks. Table 1 summarizes the number of signaling circuits ure 2C that the individual circuits involved in triggering the
related to cancer hallmarks common to the three clusters same functions are not exactly the same across the neoplas-
(first column) and specific for each cancer type (subsequent tic clusters (Supplementary Table S2 lists details of the cir-
columns). The common functional signature of this cancer cuits involved in the figure). Conversely, neoplastic cluster 2
is clearly driven by circuits related to ‘Resisting cell death’, does not seem to have much more extra functional activity
‘Sustaining proliferative signaling’ and ‘Enabling replicative beyond the common functional signature, which suggests a
immortality’ hallmarks, completed with circuits related to less aggressive character, especially because of the absence
‘Evading growth suppressors’, ‘Inducing angiogenesis’ and of circuit activity related to cell energetics or to invasion and
‘Tumor promoting inflammation’ hallmarks. From Table 1 metastasis.
it becomes apparent that neoplastic clusters 1 and 3 are us-
ing a functional strategy different from that used by neo-
Function-based stratification of glioblastoma cells
plastic cluster 2. The first two display a functional signa-
ture compatible with a more aggressive behavior: they have Neoplastic clusters have been defined according to the in-
many extra circuits related to ‘Resisting cell death’ and ‘Sus- dividual profiles of signaling circuit activities observed for
taining proliferative signaling’ hallmarks but, in addition, each cell. The advantage of this way of cell stratification6 NAR Cancer, 2020, Vol. 2, No. 2
Table 1. Summary of the different functional strategies followed by the different cells in the three neoplastic clusters in terms of the circuits differentially
activated with respect to the normal tissue
Cancer hallmark Common circuits Neoplastic cluster 1 Neoplastic cluster 3 Neoplastic cluster 2
Resisting cell death 4 13 14 2
Sustaining proliferative signaling 8 14 14 2
Deregulating cellular energetics 4 8
Genome instability and mutation 5 6
Inducing angiogenesis 2 2 5
Enabling replicative immortality 5 1 3
Activating invasion and metastasis 2 3
Evading growth suppressors 3 3 2
Tumor promoting inflammation 1 1 1
Avoiding immune destruction 1
Downloaded from https://academic.oup.com/narcancer/article/2/2/zcaa011/5862620 by guest on 14 October 2020
Table 2. Distribution of the different glioblastoma subtypes across the overcome resistances (38). Moreover, bevacizumab, which
three neoplastic cell clusters is indicated for several advanced cancer types, has recently
Classical Mesenchymal Proneural Total been suggested for glioblastoma targeted treatment (60–62).
Actually, the effect of bevacizumab, a humanized murine
Neoplastic cell cluster 1 92 44 135 271 monoclonal antibody targeting the vascular endothelial
Neoplastic cell cluster 2 107 3 15 125
Neoplastic cell cluster 3 540 141 14 697 growth factor ligand (VEGFA), can easily be simulated
in the mechanistic model. VEGFA gene participates in six
pathways (‘VEGF signaling pathway’, ‘Ras signaling path-
is that the functional profiles of each group are well de- way’, ‘Rap1 signaling pathway’, ‘HIF-1 signaling pathway’,
fined. Current glioblastoma classification stratifies tumors ‘PI3K–Akt signaling pathway’ and ‘Focal adhesion path-
into three subtypes, classical, proneural, and mesenchymal, way’) and is part of 81 circuits, 39 of them directly related
from less to more aggressive, based on the signature of 50 to cancer hallmarks (18 to ‘Resisting cell death’, 9 to ‘Sus-
genes (58). The SubtypeME tool from the GlioVis data por- taining proliferative signaling’, 4 to ‘Genome instability and
tal (56) was used to assign subtype to each individual cell mutation’, 3 to ‘Evading growth suppressors’, 2 to ‘En-
using this signature. Interestingly, when cells of the three abling replicative immortality’, 2 to ‘Inducing angiogene-
neoplastic clusters are typed, the distribution of markers is sis’ and 1 to ‘Deregulation of cellular energetics’). As de-
very coherent with their functional activity profiles. Thus, scribed in the ‘Materials and Methods’ section, the inhibi-
neoplastic cluster 2 is mainly composed by cells belonging tion of VEGFA can be simulated by taking the gene expres-
to the classical subtype (see Table 2), in coincidence with its sion profile of a single cell, creating a simulated profile by
functional profile being less aggressive. On the other hand, setting the inhibited gene to a low value and comparing two
neoplastic cluster 1 has an important component of proneu- profiles (24,35).
ral cells, as well as a smaller proportion of mesenchymal Figure 3 shows the impact of the inhibition of VEGFA
cells, which is coherent with its more aggressive function- on the different cells in terms of changes in the activities
ality triggered by its signaling activity, which includes mod- of signaling circuits in which this protein participates. The
ifications in circuits related to cell metabolism, genomic in- Y-axis depicts the magnitude of this change in the activi-
stability and metastasis. Moreover, the functional profile of ties of signaling circuits. There are clearly two different be-
neoplastic cluster 3 seems to be even more aggressive than haviors in the response: most of the cells present a dras-
that of neoplastic cluster 1. This group of glioblastoma cells tic change in many signaling circuit activities (responders),
not only has more circuits related to the same hallmarks as while a smaller number of them present a much lower af-
neoplastic cluster 1 but also has circuits that trigger func- fectation on them (low responders). It is interesting to note
tionalities for ‘Avoiding immune destruction’ (Table 2 and that the distribution of cell types between both groups is
Figure 1). It is interesting to note that, although the conven- also asymmetric: the responder group is mainly composed
tional stratification in classical, mesenchymal and proneu- of cells that have been typed as classical or mesenchymal,
ral classes is illustrative of the behavior of the cells, it does while the non-responder group is predominantly composed
not completely fit with the stratification based on whole cell of proneural cells.
functional profiles. A close look at the consequences of the inhibition of
VEGFA in different cells provides an interesting explana-
tion for the observed differences. VEGFA is upstream in
Effect of a drug at single-cell level the chain of signal transduction in several circuits of dif-
Mechanistic models can be used to simulate the effect of ferent pathways. In the circuits within ‘Ras signaling path-
an intervention over the system studied (25,35). Specifically, way’, ‘Rap1 signaling pathway’ and ‘PI3K–Akt signaling
single-cell transcriptomic data offer, for the first time, the pathway’, the VEGFA protein potentially shares the role of
possibility of modeling the effects of a targeted drug at the signal transducer with other 40 proteins. Figure 4A clearly
level of individual cells. depicts how the balance between the expression level of
The current indication for the treatment of glioblastoma VEGFA in the responsive cells and KITLG and FGF2 pro-
patients is temozolomide, which induces DNA damage, that teins, which can take a similar signaling role, changes. Sup-
can be combined with other drugs such as bevacizumab to plementary Figure S2 shows the impact of the simulationNAR Cancer, 2020, Vol. 2, No. 2 7
Downloaded from https://academic.oup.com/narcancer/article/2/2/zcaa011/5862620 by guest on 14 October 2020
Figure 3. Impact of the inhibition of VEGFA by bevacizumab over the different neoplastic cells in terms of changes in the activities of signaling circuits
in which this protein participates. The Y-axis depicts the magnitude of this change in the activities of signaling circuits. In the right part, two bar plots
represent the proportion of the different cell types in the responder and non-responder groups.
of VEGFA inhibition in the ‘PI3K–Akt signaling pathway’, man genomic data with mouse phenotypes has suggested
where the differences in the impact of this inhibition, mea- the possible utility of a number of drugs with different in-
sured as the log fold change in signaling activity, are re- dications (see Table 3) for potential glioblastoma treatment
markable between responder and low-responder cells. The (63). The intensity and the degree of heterogeneity in the re-
inhibition of VEGFA in the responsive cells will radically sponse are very variable across the eight drugs tested here.
inhibit the signal. However, the low-responder cells have At the scale we tested the drugs, there are no correlations
already VEGFA at low expression levels and the signal is either between the number of genes targeted by the drug
transmitted by KITLG and FGF2 instead, which ultimately and the intensity of the effect or between the number of
compromises the success of the drug. A similar scenario oc- circuits potentially affected and the intensity of the effect.
curs with the ‘Focal adhesion pathway’, in which VEGFA For example, pentoxifylline targets four proteins (PDE4B,
shares the signal transduction role with other 12 proteins. In ADORA1, PDE4A and ADORA2A) that participate in a
this case, the low-responder cells are characterized by a low total of 111 circuits and the fold change caused in the cir-
level of VEGFA compensated with a high level of PDGFD, cuit activity after simulating its effect is comparatively low
which makes these signaling circuits in the low-responder (log fold change 2 for all the cell types; see Supplementary
ducer in the node. In this case, low-responder cells have this Figure S4). It is interesting to note that, depending on the
circuit constitutively down and, consequently, are not af- case, the different drug effects simulated can affect a larger
fected by the inhibition (Figure 4C). Actually, except for or a smaller number of cells with distinct intensity in their
FGF2, the genes potentially responsible for this switch pre- impacts on the activity of the signaling circuits affected, but
sented a significant differential expression when respon- always, no matter which drug is simulated, there are some
ders were compared to low-responders [applying the limma cells that manage to escape from the inhibitory effect of the
(52) test, the FDR-adjusted P-values for VEGFA, PGDFD, drug.
KITLG and FGF2 were, respectively, 6.4 × 10⁻⁴ , 9.2 × 10⁻² ,
1.39 × 10⁻² and 5.59 × 10⁻¹ , using the gene expression
DISCUSSION
values prior to the imputation). Supplementary Figure S3
represents the expression values of the same genes as in The goal of most scRNA-seq publications revolves around
Figure 4 but with no imputation, showing no significant the characterization of cell populations, which can be accu-
differences. rately achieved using only a subset of the total number of
The same modeling strategy used with bevacizumab can genes (those displaying the highest variability across cells).
be applied to simulate the effect of other drugs. Recently, However, the use of mechanistic models to estimate global
a drug repurposing in silico experiment that combines hu- signaling circuit activity profiles for individual cells requires8 NAR Cancer, 2020, Vol. 2, No. 2
Downloaded from https://academic.oup.com/narcancer/article/2/2/zcaa011/5862620 by guest on 14 October 2020
Figure 4. Distribution of the values of imputed and normalized gene expression values of the genes located within the effector node of the different signaling
circuits affected by the bevacizumab inhibition. The distribution of observed expression levels in responder cells appears in red and in the low-responder
cells in blue. (A) In the receptor node of the circuits within ‘Ras signaling pathway’, ‘Rap1 signaling pathway’ and ‘PI3K–Akt signaling pathway’, the
VEGFA protein potentially shares the role of signal transducer with other 40 proteins (CSF1, EFNA1, PDGFA, FGF1, HGF, FGF12, VEGFB, FGF11,
PDGFC, FGF14, KITLG, FGF2, ANGPT1, EGF, PDGFD, EFNA5, ANGPT2, PGF, VEGFC, FGF18, EFNA3, FGF5, EFNA4, IGF1, EFNA2,
FGF9, FGF13, FGF17, PDGFB, NGF, ANGPT4, FGF7, FGF22, FGF16, FGF23, FGF19, FGF20, FGF8 and VEGFD). (B) In the receptor node of
the circuits within ‘Focal adhesion pathway’, the VEGFA potentially shares the signal transduction role with other 12 proteins (PDGFA, HGF, VEGFB,
PDGFC, EGF, PDGFD, PGF, VEGFC, IGF1, PDGFB and VEGFD). (C) In the six signaling circuits belonging to the ‘HIF signaling pathway’ and
‘VEGF signaling pathway,’ the protein VEGFA is the only signal transducer in the node.NAR Cancer, 2020, Vol. 2, No. 2 9
reasonably accurate measures of the expression levels of all
promoting
inflamma-
Tumor
the genes involved in the signaling circuits. Dropout events,
tion
4
quite common in scRNA-seq experiments (13), are partic-
ularly problematic given that taking by mistake a missing
value by a real zero value can cause erroneous determina-
proliferative
Sustaining
signaling
9
tions of the inferred activity of the circuits. Thus, we ex-
4
5
4
plored the performance of three different imputation meth-
ods in producing cell-specific profiles of signaling circuit
activity whose clustering resulted in a grouping similar to
Resisting cell
that observed and validated in the original glioblastoma
death
18
study. Here, two machine learning-based methods, DrIm-
1
6
3
3
2
pute and MAGIC, produced a clustering compatible with
Downloaded from https://academic.oup.com/narcancer/article/2/2/zcaa011/5862620 by guest on 14 October 2020
the original validated clustering, and specifically, DrImpute,
angiogenesis
the method of choice, rendered clusters with a similar shape
Inducing
as well (see Figure 1).
2
1
1
1
1
Focusing on neoplastic cells, the existence of three differ-
ent clusters is also apparent at the level of functional pro-
files, which suggests the existence of different functional be-
instability
mutation
Genome
haviors. Several attempts to stratify glioblastoma patients
and
4
1
1
7
6
1
5
have been proposed by discriminating different subtypes ac-
cording to different properties, such as patient survival (64),
mutational status of some genes (65) or the tumor microen-
suppressors
Evading
growth
vironment (66). In the most used classification, glioblas-
3
toma tumors were divided into three subtypes (from less
to more aggressive: classical, proneural and mesenchymal)
based on the signature of 50 genes (57). Although this con-
immortality
Replicative
ventional subtyping provides an approximate descriptor of
2
tumor aggressiveness, subtyping based on functional pro-
files related to cancer hallmarks provides an interesting al-
ternative for the stratification of glioblastoma that offers, in
energetics
addition, a mechanistic description on the functional activ-
Cellular
ity of the tumor. Actually, it has been reported in neurob-
1
2
1
lastoma that signaling pathway models used as biomarkers
Table 3. The eight drugs whose effect on the neoplastic population cell has been simulated
outperform traditional biomarkers as predictors of patient
destruction
survival (26). Supplementary Figure S5 provides an inter-
Immune
active view of the circuits activated and deactivated within
1
the different pathways.
The hallmarks affected are displayed in the columns on the right-hand side of the table.
Among pathways that are commonly altered in all three
Invasion and
clusters, we find well-known factors contributing to car-
metastasis
cinogenesis, such as those related to hypoxia (HIF-1,
SOD2), cancer stem cells (CSCs), cell cycle proteins, like
CDK family, signal transduction pathways and hormone
signaling (67–69). Moreover, these are mainly related to
Circuits
‘Sustaining proliferative signaling’, ‘Enabling replicative
81
11
21
59
50
32
13
52
14
5
2
1
1
4
0
immortality’ and ‘Resisting cell death’ hallmarks that can
be defined as the core cell functions involved in glioblas-
toma initiation and proliferation.
Antagonist
Antagonist
Antagonist
Antagonist
Antagonist
Antagonist
Each cluster exhibits a characteristic deregulation of
Inhibitor
Inhibitor
Inhibitor
Inhibitor
Inhibitor
Inhibitor
Agonist
Agonist
Agonist
Action
pathways; however, cluster 2 barely has four unique sub-
pathways, all related to common hallmarks ‘Resisting cell
death’ and ‘Sustaining proliferative signaling’. Neoplastic
clusters 1 and 3, but not cluster 2, exhibit ‘Genome instabil-
ADORA2A
Gene name
ADORA1
HTR2A
PPARG
PPARA
VEGFA
PDE4A
PDE4B
PTGS2
PTGS1
ity’, a hallmark observed in almost all sporadic human can-
HRH1
HRH2
DRD2
TLR7
ABL1
cers, including glioblastoma (70,71). Besides, clusters 1 and
3 show deregulated ‘Cellular energetics’, a process that has
been suggested as a suitable target for tumor cell elimination
(72). Furthermore, both clusters show pathways associated
Pentoxifylline
Pentoxifylline
Pentoxifylline
Pentoxifylline
with matrix metalloproteins and Snail family that have been
Sulfasalazine
Sulfasalazine
Sulfasalazine
Bevacizumab
Drug name
Fenofibrate
Quetiapine
Quetiapine
Imiquimod
linked to cancer invasion and metastasis also in glioblas-
Nilotinib
Doxepin
Doxepin
toma (73–75). Interestingly, only cluster 3 may be avoid-
ing immune destruction due to the deregulation of ‘Toll-10 NAR Cancer, 2020, Vol. 2, No. 2
like receptor signaling pathway’. Glioblastoma is known plied by clinical community to forward tailored treatment,
to have a strongly immunosuppressive microenvironment; therefore improving patient’s prognosis.
thus, blocking these cells by activating downstream TLR Supplementary Figure S4 depicts the simulated response
signaling pathways can reduce tumor growth and disrupt of individual cells to the treatment with different targeted
CSC self-renewal (76,77). drugs. Despite the variety of effects in the cells, it is worth
We have demonstrated that not all the cells in a tumor noting that there is always a group of cells that manages
are driven by the same cancer processes, and that those to escape from the inhibition of the drug. The heterogene-
alterations can define subpopulations that may confer tu- ity observed in the cell population in terms of use of dif-
mors different aggressiveness and invasion abilities, high- ferent strategies to activate the essential cancer hallmark
lighting the relevance of heterogeneity, beyond the widely through different signaling circuits produces a consequent
accepted stratification of glioblastoma in three/four sub- diversity in the response to drugs. Although the number
types (78,79). of drugs simulated is relatively low, given that drug repur-
Downloaded from https://academic.oup.com/narcancer/article/2/2/zcaa011/5862620 by guest on 14 October 2020
The emergence of mechanisms of resistance in targeted posing was beyond the scope of this paper, the results ob-
therapies has been attributed to either the selection of rare tained here suggest that the escape of a relatively small
pre-existing genetic alterations upon drug treatment (80) number of cells from the effect of the drug could be a
or the transient acquisition of a drug-refractory phenotype relatively frequent event that occurs as a natural conse-
by a small proportion of cancer cells through epigenetic quence of the heterogeneity in the signaling strategies fol-
modifications (81). In both cases, these alterations would lowed by the cell population. When this subpopulation be-
be detectable in the expression of the corresponding genes. comes dominant some time later, it becomes resistant to
An interesting property of mechanistic models is that they the drug.
can be used to model the effect of an intervention over
the system studied (25,35). Thus, the use of mechanistic
models on single-cell transcriptomic data offers for the first CONCLUSIONS
time the possibility of modeling the effects of a targeted
drug in individual cells. From Figure 4 it becomes apparent The use of mechanistic models provides a detailed insight
that low-responder cells have a constitutive level of VEGFA into the functional strategies used by tumors to proliferate
lower than high-responder cells. However, these cells main- and open new avenues for the design of interventions à la
tain active the same VEGFA-activated pathways by the up- carte. The extension of this analytical approach to single-
regulation of others alternative TRK receptor ligands (i.e. cell transcriptomic data allows an unprecedented detail on
FGF2, PDGFD and KITLG) that have been implicated in how cancer cells display different functional strategies to
the development and drug resistance in other cancer types proliferate that have consequences in their respective vul-
(82–84). Interestingly, the switch in the expression levels of nerabilities to targeted therapies.
FGF1 and FGF2 (downregulated and upregulated in low- Although the existence of resistant clones in a tumoral
responder cells, respectively) as well as the upregulation of cell population is well known, the specific mechanisms used
one member of the PDGF family (i.e. PDGFD) might be po- by resistant cells to escape from the inhibitory effects of tar-
tentially driving the tumor progression in these GBM low- geted therapies remain unknown yet. Mechanistic models
responder cells. Specifically, FGF2 is the main member of offer for the first time a plausible and contrastable hypothe-
the FGF family implicated in cancer development and drug sis on how and why some cells are insensitive to treatments,
resistance (85), and PDGFD and its receptor (PDGFRB) illustrated here with bevacizumab in the case of glioblas-
have been recently defined as key drivers of tumor progres- toma. Mechanistic modeling of effects of bevacizumab in-
sion since a PDGFRB downregulation impairs immediately hibitions at single-cell level revealed, how in some cells, with
GBM progression (A.C.V.-B. Fuentes-Fayos et al., submit- low VEGFA expression, the VEGF pathway remains ac-
ted for publication). Moreover, although the relevance of tive because the initial signaling was assumed by other pro-
KITLG has not been defined in GBM, the upregulation teins like PDGFD, KITLG and FGF2, thus making the
found in GBM low-responder cells might be linked to the signaling circuit insensitive to the VEGFA inhibition by
drug resistance of these cells as has been reported in other the drug.
tumor pathologies (84). In fact, this particular expression The use of this modeling strategy offers a systematic way
phenotype found in low-responder cells could be similar for detecting tumoral cells that may be resistant to specific
to that previously described in neural stem cell progenitors targeted treatments. Conversely, the same models could be
that are directly associated with the development and drug used to find an alternative treatment for resistant drugs. In
resistance in GBMs (86,87). Thus, the mechanistic model fact, our results suggest that the search for new, more effi-
provides a simple potential interpretation of the molecular cient therapeutic targets would be benefited by the use of
mechanisms behind the differential effect of drugs over cells mechanistic models that guide to the intervention points
with different signaling profiles that ultimately cause dif- with more likelihood of success in inhibiting the prolifer-
ferent functional strategies. Obviously, in order to gain in- ation of the largest possible part of the spectrum of func-
sights into the true mechanisms driving cell resistance, fur- tional strategies in the tumor cell ecosystem.
ther studies are needed in line with these findings. Never-
theless, we have proven that functional single-cell analyses,
and the methodology here presented, are a helpful tool for SUPPLEMENTARY DATA
discovering tumor heterogeneity, and the results can be ap- Supplementary Data are available at NAR Cancer Online.NAR Cancer, 2020, Vol. 2, No. 2 11
ACKNOWLEDGEMENTS 17. Aibar,S., González-Blas,C.B., Moerman,T., Huynh-Thu,V.A.,
Imrichova,H., Hulselmans,G., Rambow,F., Marine,J.-C., Geurts,P.,
We appreciate very much the help of Dr Antonio Carlos Aerts,J. et al. (2017) SCENIC: single-cell regulatory network
Fuentes-Fayos in the discussion of the potential explana- inference and clustering. Nat. Methods, 14, 1083–1086.
tions in drug effects. 18. Chan,T.E., Stumpf,M.P.H. and Babtie,A.C. (2017) Gene regulatory
network inference from single-cell data using multivariate
information measures. Cell Syst., 5, 251–267.
19. Matsumoto,H., Kiryu,H., Furusawa,C., Ko,M.S.H., Ko,S.B.H.,
FUNDING Gouda,N., Hayashi,T. and Nikaido,I. (2017) SCODE: an efficient
regulatory network inference algorithm from single-cell RNA-Seq
Spanish Ministry of Economy and Competitiveness during differentiation. Bioinformatics, 33, 2314–2321.
[SAF2017-88908-R]; ISCIII [PT17/0009/0006]; H2020 20. Papili Gao,N., Ud-Dean,S.M.M., Gandrillon,O. and Gunawan,R.
Programme of the European Union [GA 813533, GA (2017) SINCERITIES: inferring gene regulatory networks from
676559]. time-stamped single cell transcriptional expression profiles.
Downloaded from https://academic.oup.com/narcancer/article/2/2/zcaa011/5862620 by guest on 14 October 2020
Conflict of interest statement. None declared. Bioinformatics, 34, 258–266.
21. Fisher,J. and Henzinger,T.A. (2007) Executable cell biology. Nat.
Biotechnol., 25, 1239–1249.
22. Fryburg,D.A., Song,D.H., Laifenfeld,D. and de Graaf,D. (2014)
REFERENCES Systems diagnostics: anticipating the next generation of diagnostic
1. Hoheisel,J.D. (2006) Microarray technology: beyond transcript tests based on mechanistic insight into disease. Drug Discov. Today,
profiling and genotype analysis. Nat. Rev. Genet., 7, 200–210. 19, 108–112.
2. Wang,Z., Gerstein,M. and Snyder,M. (2009) RNA-Seq: a 23. Amadoz,A., Hidalgo,M.R., Çubuk,C., Carbonell-Caballero,J. and
revolutionary tool for transcriptomics. Nat. Rev. Genet., 10, 57–63. Dopazo,J. (2019) A comparison of mechanistic signaling pathway
3. Dopazo,J. (2014) Genomics and transcriptomics in drug discovery. activity analysis methods. Brief. Bioinform., 20, 1655–1668.
Drug Discov. Today, 19, 126–132. 24. Hidalgo,M.R., Cubuk,C., Amadoz,A., Salavert,F.,
4. Bendall,S.C., Davis,K.L., Amir,E.-A.D., Tadmor,M.D., Carbonell-Caballero,J. and Dopazo,J. (2017) High throughput
Simonds,E.F., Chen,T.J., Shenfeld,D.K., Nolan,G.P. and Pe’er,D. estimation of functional cell activities reveals disease mechanisms and
(2014) Single-cell trajectory detection uncovers progression and predicts relevant clinical outcomes. Oncotarget, 8, 5160–5178.
regulatory coordination in human B cell development. Cell, 157, 25. Cubuk,C., Hidalgo,M.R., Amadoz,A., Pujana,M.A., Mateo,F.,
714–725. Herranz,C., Carbonell-Caballero,J. and Dopazo,J. (2018) Gene
5. Haghverdi,L., Buettner,M., Wolf,F.A., Buettner,F. and Theis,F.J. expression integration into pathway modules reveals a pan-cancer
(2016) Diffusion pseudotime robustly reconstructs lineage branching. metabolic landscape. Cancer Res., 78, 6059–6072.
Nat. Methods, 13, 845–848. 26. Fey,D., Halasz,M., Dreidax,D., Kennedy,S.P., Hastings,J.F.,
6. Zeisel,A., Muñoz-Manchado,A.B., Codeluppi,S., Lönnerberg,P., La Rauch,N., Munoz,A.G., Pilkington,R., Fischer,M., Westermann,F.
Manno,G., Juréus,A., Marques,S., Munguba,H., He,L. and et al. (2015) Signaling pathway models as biomarkers: patient-specific
Betsholtz,C. (2015) Cell types in the mouse cortex and hippocampus simulations of JNK activity predict the survival of neuroblastoma
revealed by single-cell RNA-seq. Science, 347, 1138–1142. patients. Sci. Signal., 8, ra130.
7. Aizarani,N., Saviano,A., Mailly,L., Durand,S., Herman,J.S., 27. Hidalgo,M.R., Amadoz,A., Cubuk,C., Carbonell-Caballero,J. and
Pessaux,P., Baumert,T.F. and Grün,D. (2019) A human liver cell atlas Dopazo,J. (2018) Models of cell signaling uncover molecular
reveals heterogeneity and epithelial progenitors. Nature, 572, mechanisms of high-risk neuroblastoma and predict disease outcome.
199–204. Biol. Direct, 13, 16.
8. Grün,D., Lyubimova,A., Kester,L., Wiebrands,K., Basak,O., 28. Chacón-Solano,E., León,C., Dı́az,F., Garcı́a-Garcı́a,F., Garcı́a,M.,
Sasaki,N., Clevers,H. and van Oudenaarden,A. (2015) Single-cell Escámez,M., Guerrero-Aspizua,S., Conti,C., Mencı́a,Á. and
messenger RNA sequencing reveals rare intestinal cell types. Nature, Martı́nez-Santamarı́a,L. (2019) Fibroblasts activation and abnormal
525, 251–255. extracellular matrix remodelling as common hallmarks in three
9. Kim,J.K. and Marioni,J.C. (2013) Inferring the kinetics of stochastic cancer-prone genodermatoses. J. Br. J. Dermatol., 181, 512–522.
gene expression from single-cell RNA-sequencing data. Genome Biol., 29. Esteban-Medina,M., Peña-Chilet,M., Loucera,C. and Dopazo,J.
14, R7. (2019) Exploring the druggable space around the Fanconi anemia
10. Kar,G., Kim,J.K., Kolodziejczyk,A.A., Natarajan,K.N., Torlai pathway using machine learning and mechanistic models. BMC
Triglia,E., Mifsud,B., Elderkin,S., Marioni,J.C., Pombo,A. and Bioinformatics, 20, 370.
Teichmann,S.A. (2017) Flipping between Polycomb repressed and 30. Amadoz,A., Sebastian-Leon,P., Vidal,E., Salavert,F. and Dopazo,J.
active transcriptional states introduces noise in gene expression. Nat. (2015) Using activation status of signaling pathways as
Commun., 8, 36. mechanism-based biomarkers to predict drug sensitivity. Sci. Rep., 5,
11. Zappia,L., Phipson,B. and Oshlack,A. (2018) Exploring the 18494.
single-cell RNA-seq analysis landscape with the scRNA-tools 31. Razzoli,M., Frontini,A., Gurney,A., Mondini,E., Cubuk,C.,
database. PLoS Comput. Biol., 14, e1006245. Katz,L.S., Cero,C., Bolan,P.J., Dopazo,J. and Vidal-Puig,A. (2016)
12. Crow,M., Paul,A., Ballouz,S., Huang,Z.J. and Gillis,J. (2018) Stress-induced activation of brown adipose tissue prevents obesity in
Characterizing the replicability of cell types defined by single cell conditions of low adaptive thermogenesis. Mol. Metab., 5, 19–33.
RNA-sequencing data using MetaNeighbor. Nat. Commun., 9, 884. 32. Ferreira,P.G., Muñoz-Aguirre,M., Reverter,F., Godinho,C.P.S.,
13. Kharchenko,P.V., Silberstein,L. and Scadden,D.T. (2014) Bayesian Sousa,A., Amadoz,A., Sodaei,R., Hidalgo,M.R., Pervouchine,D. and
approach to single-cell differential expression analysis. Nat. Methods, Carbonell-Caballero,J. (2018) The effects of death and post-mortem
11, 740–742. cold ischemia on human tissue transcriptomes. Nat. Commun., 9, 490.
14. Fan,J., Salathia,N., Liu,R., Kaeser,G.E., Yung,Y.C., Herman,J.L., 33. Cubuk,C., Hidalgo,M.R., Amadoz,A., Rian,K., Salavert,F.,
Kaper,F., Fan,J.-B., Zhang,K. and Chun,J. (2016) Characterizing Pujana,M.A., Mateo,F., Herranz,C., Caballero,J.C. and Dopazo,J.
transcriptional heterogeneity through pathway and gene set (2019) Differential metabolic activity and discovery of therapeutic
overdispersion analysis. Nat. Methods, 13, 241–244. targets using summarized metabolic pathway models. npj Syst. Biol.
15. Al-Shahrour,F., Diaz-Uriarte,R. and Dopazo,J. (2004) FatiGO: a Appl., 5, 7.
web tool for finding significant associations of Gene Ontology terms 34. Hanahan,D. and Weinberg,R.A. (2011) Hallmarks of cancer: the next
with groups of genes. Bioinformatics, 20, 578–580. generation. Cell, 144, 646–674.
16. Subramanian,A., Tamayo,P., Mootha,V.K., Mukherjee,S., 35. Salavert,F., Hidalgo,M.R., Amadoz,A., Cubuk,C., Medina,I.,
Ebert,B.L., Gillette,M.A., Paulovich,A., Pomeroy,S.L., Golub,T.R., Crespo,D., Carbonell-Caballero,J. and Dopazo,J. (2016) Actionable
Lander,E.S. et al. (2005) Gene set enrichment analysis: a pathways: interactive discovery of therapeutic targets using signaling
knowledge-based approach for interpreting genome-wide expression pathway models. Nucleic Acids Res., 44, W212–W216.
profiles. Proc. Natl Acad. Sci. U.S.A., 102, 15545–15550.12 NAR Cancer, 2020, Vol. 2, No. 2
36. Consortium, T.G. (2018) Glioma through the looking GLASS: 60. Kaka,N., Hafazalla,K., Samawi,H., Simpkin,A., Perry,J., Sahgal,A.
molecular evolution of diffuse gliomas and the Glioma Longitudinal and Das,S. (2019) Progression-free but no overall survival benefit for
Analysis Consortium. Neuro-Oncology, 20, 873–884. adult patients with bevacizumab therapy for the treatment of newly
37. Khasraw,M. and Lassman,A.B. (2010) Advances in the treatment of diagnosed glioblastoma: a systematic review and meta-analysis.
malignant gliomas. Curr. Oncol. Rep., 12, 26–33. Cancers, 11, 1723.
38. Bahadur,S., Sahu,A.K., Baghel,P. and Saha,S. (2019) Current 61. Ohno,M., Miyakita,Y., Takahashi,M., Igaki,H., Matsushita,Y.,
promising treatment strategy for glioblastoma multiform: a review. Ichimura,K. and Narita,Y. (2019) Survival benefits of
Oncol. Rev., 13, 417. hypofractionated radiotherapy combined with temozolomide or
39. Ostrom,Q.T., Gittleman,H., Xu,J., Kromer,C., Wolinsky,Y., temozolomide plus bevacizumab in elderly patients with glioblastoma
Kruchko,C. and Barnholtz-Sloan,J.S. (2016) CBTRUS statistical aged ≥75 years. Radiat. Oncol., 14, 200.
report: primary brain and other central nervous system tumors 62. Soubéran,A., Brustlein,S., Gouarné,C., Chasson,L.,
diagnosed in the United States in 2009–2013. Neuro-Oncology, 18, Tchoghandjian,A., Malissen,M. and Rougon,G. (2019) Effects of
v1–v75. VEGF blockade on the dynamics of the inflammatory landscape in
40. Helseth,R., Helseth,E., Johannesen,T., Langberg,C., Lote,K., glioblastoma-bearing mice. J. Neuroinflammation, 16, 191.
Downloaded from https://academic.oup.com/narcancer/article/2/2/zcaa011/5862620 by guest on 14 October 2020
Rønning,P., Scheie,D., Vik,A. and Meling,T. (2010) Overall survival, 63. Chen,Y. and Xu,R. (2016) Drug repurposing for glioblastoma based
prognostic factors, and repeated surgery in a consecutive series of 516 on molecular subtypes. J. Biomed. Inform., 64, 131–138.
patients with glioblastoma multiforme. Acta Neurol. Scand., 122, 64. Fatai,A.A. and Gamieldien,J. (2018) A 35-gene signature
159–167. discriminates between rapidly- and slowly-progressing glioblastoma
41. Siegel,R.L., Miller,K.D. and Jemal,A. (2017) Cancer statistics, 2017. multiforme and predicts survival in known subtypes of the cancer.
CA Cancer J. Clin., 67, 7–30. BMC Cancer, 18, 377.
42. Omuro,A. and DeAngelis,L.M. (2013) Glioblastoma and other 65. Zhou,X., Li,G., An,S., Li,W.-X., Yang,H., Guo,Y., Dai,Z., Dai,S.,
malignant gliomas: a clinical review. JAMA, 310, 1842–1850. Zheng,J. and Huang,J. (2018) A new method of identifying
43. Bai,R.-Y., Staedtke,V. and Riggins,G.J. (2011) Molecular targeting of glioblastoma subtypes and creation of corresponding animal models.
glioblastoma: drug discovery and therapies. Trends Mol. Med., 17, Oncogene, 37, 4781–4791.
301–312. 66. Chen,Z. and Hambardzumyan,D. (2018) Immune microenvironment
44. Soeda,A., Hara,A., Kunisada,T., Yoshimura,S.-i., Iwama,T. and in glioblastoma subtypes. Front. Immunol., 9, 1004.
Park,D.M. (2015) The evidence of glioblastoma heterogeneity. Sci. 67. Gao,Y.-H., Li,C.-X., Shen,S.-M., Li,H., Chen,G.-Q., Wei,Q. and
Rep., 5, 7979. Wang,L.-S. (2013) Hypoxia-inducible factor 1␣ mediates the
45. Darmanis,S., Sloan,S.A., Croote,D., Mignardi,M., Chernikova,S., down-regulation of superoxide dismutase 2 in von Hippel-Lindau
Samghababi,P., Zhang,Y., Neff,N., Kowarsky,M., Caneda,C. et al. deficient renal clear cell carcinoma. Biochem. Biophys. Res. Commun.,
(2017) Single-cell RNA-seq analysis of infiltrating neoplastic cells at 435, 46–51.
the migrating front of human glioblastoma. Cell Rep., 21, 1399–1410. 68. Feitelson,M.A., Arzumanyan,A., Kulathinal,R.J., Blain,S.W.,
46. Moon,K.R., Stanley,J.S. III, Burkhardt,D., van Dijk,D., Wolf,G. and Holcombe,R.F., Mahajna,J., Marino,M., Martinez-Chantar,M.L.,
Krishnaswamy,S. (2018) Manifold learning-based methods for Nawroth,R. and Sanchez-Garcia,I. (2015) In: Seminars in Cancer
analyzing single-cell RNA-sequencing data. Curr. Opin. Syst. Biol., 7, Biology, Vol. 35, Elsevier, Amsterdam, pp. S25–S54.
36–46. 69. Mayer,A., Schneider,F., Vaupel,P., Sommer,C. and Schmidberger,H.
47. Li,W.V. and Li,J.J. (2018) An accurate and robust imputation method (2012) Differential expression of HIF-1 in glioblastoma multiforme
scImpute for single-cell RNA-seq data. Nat. Commun., 9, 997. and anaplastic astrocytoma. Int. J. Oncol., 41, 1260–1270.
48. Gong,W., Kwak,I.-Y., Pota,P., Koyano-Nakagawa,N. and Garry,D.J. 70. Milinkovic,V., Bankovic,J., Rakic,M., Milosevic,N., Stankovic,T.,
(2018) DrImpute: imputing dropout events in single cell RNA Jokovic,M., Milosevic,Z., Skender-Gazibara,M., Podolski-Renic,A.,
sequencing data. BMC Bioinformatics, 19, 220. Pesic,M. et al. (2012) Genomic instability and p53 alterations in
49. Rand,W.M. (1971) Objective criteria for the evaluation of clustering patients with malignant glioma. Exp. Mol. Pathol., 93, 200–206.
methods. J. Am. Stat. Assoc., 66, 846–850. 71. Moon,J.J., Lu,A. and Moon,C. (2019) Role of genomic instability in
50. Kanehisa,M., Goto,S., Sato,Y., Kawashima,M., Furumichi,M. and human carcinogenesis. Exp. Biol. Med., 244, 227–240.
Tanabe,M. (2014) Data, information, knowledge and principle: back 72. Maximchik,P.V., Kulikov,A.V., Zhivotovsky,B.D. and Gogvadze,V.G.
to metabolism in KEGG. Nucleic Acids Res., 42, D199–D205. (2016) Cellular energetics as a target for tumor cell elimination.
51. Fagerland,M.W. (2012) t-tests, non-parametric tests, and large Biochemistry (Moscow), 81, 65–79.
studies––a paradox of statistical practice? BMC Med. Res. Methodol., 73. Deryugina,E.I. and Quigley,J.P. (2006) Matrix metalloproteinases
12, 78. and tumor metastasis. Cancer Metastasis Rev., 25, 9–34.
52. Ritchie,M., Phipson,B., Wu,D., Hu,Y., Law,C., Shi,W. and GK,S. 74. Wang,Y., Shi,J., Chai,K., Ying,X. and Zhou,B.P. (2013) The role of
(2015) limma powers differential expression analyses for Snail in EMT and tumorigenesis. Curr. Cancer Drug Targets, 13,
RNA-sequencing and microarray studies. Nucleic Acids Res., 43, e47. 963–972.
53. UniProt Consortium. (2018) UniProt: a worldwide hub of protein 75. Roomi,M.W., Kalinovsky,T., Rath,M. and Niedzwiecki,A. (2017)
knowledge. Nucleic Acids Res., 47, D506–D515. Modulation of MMP-2 and MMP-9 secretion by cytokines, inducers
54. Gene Ontology Consortium. (2018) The gene ontology resource: 20 and inhibitors in human glioblastoma T-98G cells. Oncol. Rep., 37,
years and still GOing strong. Nucleic Acids Res., 47, D330–D338. 1907–1913.
55. Baker,S., Ali,I., Silins,I., Pyysalo,S., Guo,Y., Högberg,J., Stenius,U. 76. Nduom,E.K., Weller,M. and Heimberger,A.B. (2015)
and Korhonen,A. (2017) Cancer Hallmarks Analytics Tool (CHAT): Immunosuppressive mechanisms in glioblastoma. Neuro-Oncology,
a text mining approach to organize and evaluate scientific literature 17(Suppl. 7), vii9–vii14.
on cancer. Bioinformatics, 33, 3973–3981. 77. Alvarado,A.G., Thiagarajan,P.S., Mulkearns-Hubert,E.E.,
56. Bowman,R.L., Wang,Q., Carro,A., Verhaak,R.G. and Squatrito,M. Silver,D.J., Hale,J.S., Alban,T.J., Turaga,S.M., Jarrar,A., Reizes,O.,
(2016) GlioVis data portal for visualization and analysis of brain Longworth,M.S. et al. (2017) Glioblastoma cancer stem cells evade
tumor expression datasets. Neuro-Oncology, 19, 139–141. innate immune suppression of self-renewal through reduced TLR4
57. Wang,Q., Hu,B., Hu,X., Kim,H., Squatrito,M., Scarpace,L., expression. Cell Stem Cell, 20, 450–461.
deCarvalho,A.C., Lyu,S., Li,P., Li,Y. et al. (2017) Tumor evolution of 78. Verhaak,R.G.W., Hoadley,K.A., Purdom,E., Wang,V., Qi,Y.,
glioma-intrinsic gene expression subtypes associates with Wilkerson,M.D., Miller,C.R., Ding,L., Golub,T., Mesirov,J.P. et al.
immunological changes in the microenvironment. Cancer Cell, 32, (2010) Integrated genomic analysis identifies clinically relevant
42–56. subtypes of glioblastoma characterized by abnormalities in
58. Zhang,L. and Zhang,S. (2020) Comparison of computational PDGFRA, IDH1, EGFR, and NF1. Cancer Cell, 17, 98–110.
methods for imputing single-cell RNA-sequencing data. IEEE/ACM 79. Friedmann-Morvinski,D. (2014) Glioblastoma heterogeneity and
Trans. Comput. Biol. Bioinform., 17, 376–389. cancer cell plasticity. Crit. Rev. Oncog., 19, 327–336.
59. van der Maaten,L. and Hinton,G. (2008) Visualizing data using 80. Boumahdi,S. and de Sauvage,F.J. (2019) The great escape: tumour
t-SNE. J. Mach. Learn. Res., 9, 2579–2605. cell plasticity in resistance to targeted therapy. Nat. Rev. Drug
Discov., 19, 39–56.You can also read