In situ observations of CH2Cl2 and CHCl3 show efficient transport pathways for very short-lived species into
←
→
Page content transcription
If your browser does not render page correctly, please read the page content below
Research article
Atmos. Chem. Phys., 22, 2049–2077, 2022
https://doi.org/10.5194/acp-22-2049-2022
© Author(s) 2022. This work is distributed under
the Creative Commons Attribution 4.0 License.

        In situ observations of CH2 Cl2 and CHCl3 show efficient
        transport pathways for very short-lived species into the
             lower stratosphere via the Asian and the North
                      American summer monsoon
            Valentin Lauther1 , Bärbel Vogel2 , Johannes Wintel1,a , Andrea Rau1 , Peter Hoor3 , Vera Bense3 ,
                                         Rolf Müller2 , and C. Michael Volk1
           1 Institute    for Atmospheric and Environmental Research, University of Wuppertal, Wuppertal, Germany
       2 Institute    of Energy and Climate Research – Stratosphere (IEK-7), Forschungszentrum Jülich, Jülich, Germany
                     3 Institute for Atmospheric Physics, Johannes Gutenberg University Mainz, Mainz, Germany
                                          a now at: Elementar GmbH, Langenselbold, Germany

                                 Correspondence: Valentin Lauther (lauther@uni-wuppertal.de)

                                     Received: 7 October 2021 – Discussion started: 18 October 2021
                           Revised: 10 January 2022 – Accepted: 13 January 2022 – Published: 14 February 2022

      Abstract. Efficient transport pathways for ozone-depleting very short-lived substances (VSLSs) from their
      source regions into the stratosphere are a matter of current scientific debate; however they have yet to be
      fully identified on an observational basis. Understanding the increasing impact of chlorine-containing VSLSs
      (Cl-VSLSs) on stratospheric ozone depletion is important in order to validate and improve model simulations
      and future predictions. We report on a transport study using airborne in situ measurements of the Cl-VSLSs
      dichloromethane (CH2 Cl2 ) and trichloromethane (chloroform, CHCl3 ) to derive a detailed description of two
      transport pathways from (sub)tropical source regions into the extratropical upper troposphere and lower strato-
      sphere (Ex-UTLS) in the Northern Hemisphere (NH) late summer. The Cl-VSLS measurements were obtained
      in the upper troposphere and lower stratosphere (UTLS) above western Europe and the midlatitude Atlantic
      Ocean in the frame of the WISE (Wave-driven ISentropic Exchange) aircraft campaign in autumn 2017 and are
      combined with the results from a three-dimensional simulation of a Lagrangian transport model as well as back-
      trajectory calculations. Compared to background measurements of similar age we find up to 150 % enhanced
      CH2 Cl2 and up to 100 % enhanced CHCl3 mixing ratios in the extratropical lower stratosphere (Ex-LS). We link
      the measurements of enhanced CH2 Cl2 and CHCl3 mixing ratios to emissions in the region of southern and east-
      ern Asia. Transport from this area to the Ex-LS at potential temperatures in the range of 370–400 K takes about
      6–11 weeks via the Asian summer monsoon anticyclone (ASMA). Our measurements suggest anthropogenic
      sources to be the cause of these strongly elevated Cl-VSLS concentrations observed at the top of the lowermost
      stratosphere (LMS). A faster transport pathway into the Ex-LS is derived from particularly low CH2 Cl2 and
      CHCl3 mixing ratios in the UTLS. These low mixing ratios reflect weak emissions and a local seasonal mini-
      mum of both species in the boundary layer of Central America and the tropical Atlantic. We show that air masses
      uplifted by hurricanes, the North American monsoon, and general convection above Central America into the
      tropical tropopause layer to potential temperatures of about 360–370 K are transported isentropically within 5–
      9 weeks from the boundary layer into the Ex-LS. This transport pathway linked to the North American monsoon
      mainly impacts the middle and lower part of the LMS with particularly low CH2 Cl2 and CHCl3 mixing ratios.
      In a case study, we specifically analyze air samples directly linked to the uplift by the Category 5 Hurricane
      Maria that occurred during October 2017 above the Atlantic Ocean. CH2 Cl2 and CHCl3 have similar atmo-
      spheric sinks and lifetimes, but the fraction of biogenic emissions is clearly higher for CHCl3 than for the mainly

Published by Copernicus Publications on behalf of the European Geosciences Union.
2050                                                V. Lauther et al.: Transport pathways for Cl-VSLSs into the stratosphere

       anthropogenically emitted CH2 Cl2 ; consequently lower CHCl3 : CH2 Cl2 ratios are expected in air parcels show-
       ing a higher impact of anthropogenic emissions. The observed CHCl3 : CH2 Cl2 ratio suggests clearly stronger
       anthropogenic emissions in the region of southern and eastern Asia compared to those in the region of Central
       America and the tropical Atlantic. Overall, the transport of strongly enhanced CH2 Cl2 and CHCl3 mixing ratios
       from southern and eastern Asia via the ASMA is the main factor in increasing the chlorine loading from the
       analyzed VSLSs in the Ex-LS during the NH late summer. Thus, further increases in Asian CH2 Cl2 and CHCl3
       emissions, as frequently reported in recent years, will further increase the impact of Cl-VSLSs on stratospheric
       ozone depletion.

1   Introduction                                                 summer 2017 (Adcock et al., 2021). European and American
                                                                 CH2 Cl2 sources in 2017 were estimated to contribute less
Within the last 2 decades emissions of the chlorine-             than 10 % to global CH2 Cl2 emissions (Claxton et al., 2020).
containing very short-lived substances (Cl-VSLSs)                   Based on ground-based measurements from the AGAGE
dichloromethane (CH2 Cl2 ) and trichloromethane (chlo-           network, Engel et al. (2018) estimate the global CHCl3
roform, CHCl3 ) have increased significantly by about            emissions in 2017 to be about 0.29 Tg Cl yr−1 . Compared
8 % yr−1 (Hossaini et al., 2015) and 3.5 % yr−1 (Fang et al.,    to CH2 Cl2 the distribution of CHCl3 emission sources is
2018), respectively. With both Cl-VSLSs not being regulated      rather unclear. On average globally, Engel et al. (2018) es-
by the Montreal Protocol on Substances that Deplete the          timate CHCl3 emissions from anthropogenic sources to be
Ozone Layer and its amendments and adjustments, their            as high as from biogenic sources. However, emission esti-
influence on stratospheric ozone depletion is currently an       mates of anthropogenic CHCl3 sources range between 60 %
important topic of investigation. Owing to the sparseness of     (Trudinger et al., 2004), 30 % (Worton et al., 2006), and 10 %
Cl-VSLS measurements in the stratosphere (e.g., Schauffler       (McCulloch, 2003) of the total emissions. While CH2 Cl2
et al., 1993, 2003; Laube et al., 2008; Park et al., 2010;       is believed to have no significant oceanic sources and is
Adcock et al., 2021), the impact of changes in Cl-VSLS           only temporarily taken up by the oceans to be re-released
surface emissions on their distribution in the stratosphere      to the atmosphere later, a process that is not yet fully un-
has yet to be fully characterized on an observational basis.     derstood (Moore, 2004), CHCl3 is estimated to have about
Particularly important is the identification of rapid and        50 % of its biogenic emission sources located in offshore
efficient transport pathways for Cl-VSLSs from their source      seawater (Laturnus et al., 2002; McCulloch, 2003). The in-
regions into the stratosphere. In the present study we use       crease in global CHCl3 emissions during the last decade
airborne in situ measurements of CH2 Cl2 and CHCl3 in            was traced back entirely to an increase in eastern Chinese
the extratropical upper troposphere and lower stratosphere       CHCl3 emissions of most likely anthropogenic origin (Fang
(Ex-UTLS) to analyze the impact of different source re-          et al., 2018). In addition, Chinese CHCl3 emissions amount
gions on the stratospheric chemical composition and to           to almost 90 % of all East Asian CHCl3 emissions (Fang
identify transport pathways of CH2 Cl2 and CHCl3 into the        et al., 2018). Nevertheless, on a global scale CHCl3 has a
stratosphere.                                                    significant fraction of biogenic emission sources in contrast
   CH2 Cl2 is almost exclusively emitted by anthropogenic        to CH2 Cl2 , which is almost exclusively emitted by anthro-
sources with only about 10 % of its emission being of natural    pogenic sources.
origin (Engel et al., 2018). Thereby CH2 Cl2 mixing ratios in       For CH2 Cl2 Hossaini et al. (2019) suggest an average tro-
the troposphere at Northern Hemisphere (NH) midlatitudes         pospheric lifetime of 168 d (about 6 months), and a strato-
are a factor of 3 larger than those in the Southern Hemisphere   spheric lifetime of 1–2 years (outside the poles) was esti-
(Hossaini et al., 2017). Global CH2 Cl2 emissions in 2017 are    mated by Hossaini et al. (2017). The main atmospheric sink
estimated to be about 1 Tg Cl yr−1 , and almost 90 % of the      of both CH2 Cl2 and CHCl3 is the reaction with hydroxyl rad-
global CH2 Cl2 emission sources are located in Asia (Clax-       icals (OH) in the troposphere. Both species have similar re-
ton et al., 2020). Other more localized studies estimate that    action rates with OH, implying similar photochemical life-
about 10 % of global CH2 Cl2 emissions originate in India        times for both Cl-VSLSs (Hsu and DeMore, 1994). Time
(Say et al., 2019) and that 25 %–37 % (Feng et al., 2018)        series of background mixing ratios of both species are an-
or even 45 % (Oram et al., 2017) of global CH2 Cl2 emis-         ticorrelated to the seasonal cycle of OH (Cox et al., 2003).
sions originate in China. Collected air samples from IAGOS-      In the NH, seasonal anthropogenic use of products releas-
CARIBIC confirm particularly high emissions in the broad         ing CHCl3 to the atmosphere (e.g., landfill and chlorination
region of southern and eastern Asia (Leedham-Elvidge et al.,     of water) has been observed to have a small local impact
2015) as similarly shown for the north Indian subcontinent       on the seasonality of CHCl3 (Gentner et al., 2010). In ad-
from air sampled during the StratoClim aircraft campaign in      dition, the global distribution of OH shows significant re-

Atmos. Chem. Phys., 22, 2049–2077, 2022                                           https://doi.org/10.5194/acp-22-2049-2022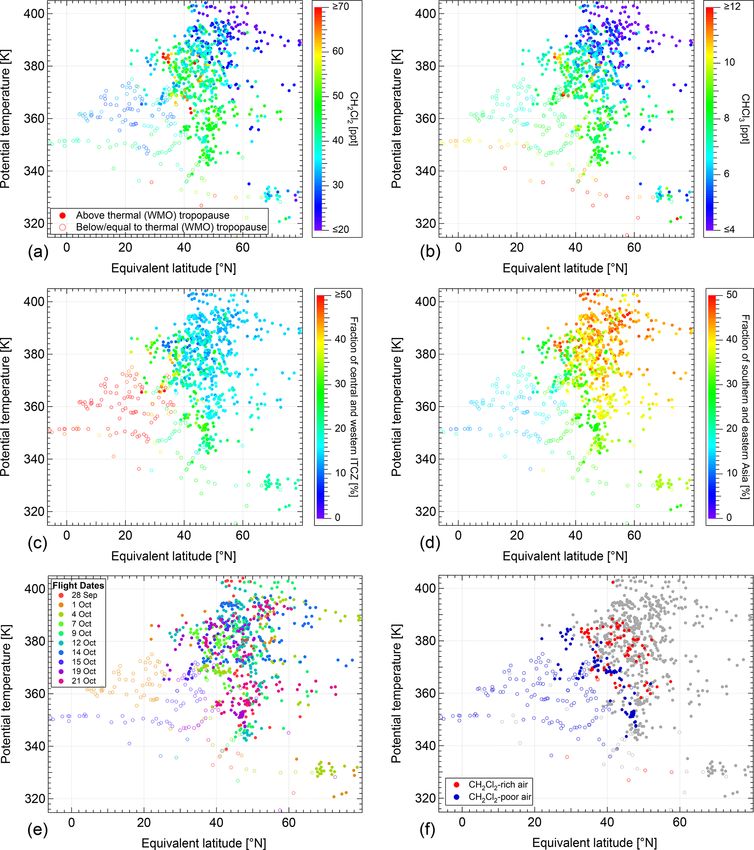
V. Lauther et al.: Transport pathways for Cl-VSLSs into the stratosphere                                                      2051

gional differences (Spivakovsky et al., 2000; Hanisco et al.,      expected decrease in long-lived chlorinated trace gases dur-
2001; Lelieveld et al., 2016). Therefore, the photochemical        ing the next decades due to the Montreal Protocol and its
lifetimes of CH2 Cl2 and CHCl3 are also regionally different.      amendments and adjustments the relative importance of Cl-
   In the tropical tropopause layer (TTL) the lifetime of both     VSLSs in stratospheric ozone depletion will further increase.
CH2 Cl2 and CHCl3 is estimated to be about 6–10 months,               Observational evidence for Cl-VSLSs being transported
being long enough for both Cl-VSLSs to enter the strato-           into the stratosphere is extremely rare (e.g., Schauffler et al.,
sphere under normal dynamic conditions (Park et al., 2010).        1993; Woodbridge et al., 1995; Schauffler et al., 2003; Laube
For the level of zero radiative heating, Hossaini et al. (2015)    et al., 2008; Park et al., 2010; Adcock et al., 2021). Transport
simulated an increase in average CH2 Cl2 mixing ratios of          pathways into the stratosphere for VSLSs have been derived
about 83 % between 2005 and 2013. Hossaini et al. (2019)           from observations of brominated VSLSs (Br-VSLSs; e.g.,
estimate an increase in total stratospheric chlorine from Cl-      Sturges et al., 2000; Ashfold et al., 2012; Wales et al., 2018;
VSLSs from about 69 ppt in 2000 to about 111 ppt in 2017,          Filus et al., 2020; Keber et al., 2020; Rotermund et al., 2021)
of which > 80 % enters the stratosphere as source gases and        or modeled specifically for Br-VSLS (e.g., Levine et al.,
the rest as product gases of Cl-VSLSs. Hossaini et al. (2019)      2007; Aschmann et al., 2009; Ashfold et al., 2012; Liang
further state that CH2 Cl2 and CHCl3 contribute to this in-        et al., 2014) which have mainly natural emission sources
crease with about 68 % and 19 %, respectively. However, due        (Engel et al., 2018). However, the only Br-VSLS with a
to high Asian emissions and efficient transport into the strato-   photochemical lifetime comparable to those of CH2 Cl2 and
sphere via the Asian summer monsoon (ASM), the estima-             CHCl3 is CH2 Br2 (150 d; WMO, 2018), which is mostly
tion of stratospheric chlorine from Cl-VSLSs could even be         emitted by the oceans and, consequently, is differently dis-
underestimated by 8 %–26 % (Adcock et al., 2021).                  tributed in the troposphere than the mainly anthropogenically
   Between June and September the ASM is a widespread              (land-based) emitted CH2 Cl2 and most Cl-VSLSs (e.g., En-
convective system located above the Indian subcontinent,           gel et al., 2018). Thus, transport studies of Br-VSLSs focus
East Asia, and Southeast Asia (e.g., Yihui and Chan, 2005).        on transport into the stratosphere from likely different source
The ASM provides fast vertical transport of surface air            regions than those of Cl-VSLS, and their results might not
into the large-scale ASM anticyclone (ASMA) above, which           necessarily be directly applicable to the transport into the
spans from the upper troposphere at about 360 K potential          stratosphere of CH2 Cl2 and CHCl3 . In addition, in order
temperature to the lower stratosphere at about 450 K po-           to specifically study transport into the stratosphere via the
tential temperature (e.g., Park et al., 2007, 2009; Bergman        ASM, it is beneficial to observe VSLSs with their strongest
et al., 2013; Vogel et al., 2019). Within the ASMA air masses      sources being located in the core region of the ASM. This is
are somewhat confined and separated from the surrounding           the case for CH2 Cl2 , while most Asian Br-VSLS sources are
upper troposphere and lower stratosphere (UTLS) air by a           located only in adjacent regions of the ASM.
strong gradient of potential vorticity (e.g., Ploeger et al.,         In the present paper we use in situ measurements of
2015). Several studies have shown that these air masses are        CH2 Cl2 and CHCl3 to identify two efficient transport path-
transported further vertically into the tropical pipe or break     ways from the boundary layer into the extratropical lower
out of the ASMA to enter the extratropical lowermost strato-       stratosphere (Ex-LS). In addition we provide observational
sphere (LMS) quasi-horizontally by Rossby wave breaking            evidence for different impacts on the stratospheric chemical
events (e.g., Popovic and Plumb, 2001; Garny and Randel,           composition depending on the transport pathway the two Cl-
2016; Vogel et al., 2014, 2016). Thus, the ASM has a strong        VSLSs take to enter the Ex-LS in the NH late summer. A
impact on the chemical composition of the stratosphere in          study by Rotermund et al. (2021) employed similar methods
boreal summer (e.g., Randel et al., 2010; Randel and Jensen,       to identify source regions and the impact on the Ex-LS of Br-
2013; Vogel et al., 2015; Santee et al., 2017).                    VSLS using measurements from the same aircraft campaign
   The most efficient transport pathway for Cl-VSLSs into          as the measurements used in the present paper are taken from
the stratosphere is suggested to be via the ASMA. This is          and is compared to our results in Sect. 4.
why Cl-VSLS emissions from the region of continental Asia
are suggested to have the highest ozone depletion poten-
                                                                   2     Airborne observations and model simulations
tial (ODP) compared to emissions from other source regions
(Claxton et al., 2019). Projecting different past CH2 Cl2 emis-    2.1    The WISE campaign 2017
sion rates, Hossaini et al. (2017) predict a possibly signifi-
cant delay to the recovery date of stratospheric ozone ranging     All measurements presented in this study were obtained in
from a few years up to no recovery at all compared to estima-      the frame of the WISE (Wave-driven ISentropic Exchange)
tions including only long-lived chlorinated species. However,      campaign (Riese et al., 2017), which took place in September
the estimated impact of Cl-VSLSs on stratospheric ozone            and October 2017. A total of 15 scientific flights were carried
trends is small compared to that of long-lived chlorinated         out with the German HALO (High Altitude and Long Range)
species or even the impact of meteorology or the 11-year so-       research aircraft, mainly from Shannon (Ireland) and from
lar cycle (Chipperfield et al., 2018). Nevertheless, with the      Oberpfaffenhofen (Germany), probing a wide area above the

https://doi.org/10.5194/acp-22-2049-2022                                           Atmos. Chem. Phys., 22, 2049–2077, 2022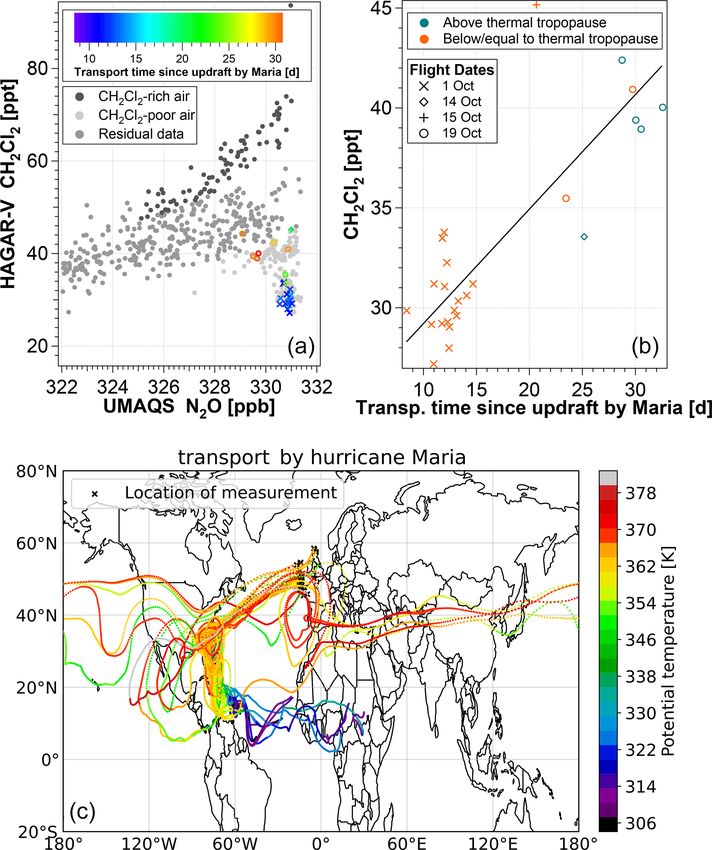
2052                                                  V. Lauther et al.: Transport pathways for Cl-VSLSs into the stratosphere

                                                                    2.2.1   High Altitude Gas AnalyzeR – five-channel version
                                                                            (HAGAR-V)

                                                                    HAGAR-V is a novel airborne in situ instrument. It is a mod-
                                                                    ernized and largely extended version of the airborne in situ
                                                                    instrument HAGAR (Werner et al., 2010) and is mounted
                                                                    in a HALO standard rack (R-G550SM). Similarly to HA-
                                                                    GAR, HAGAR-V comprises a two-channel gas chromato-
                                                                    graph (GC) with electron capture detection (ECD) as well as
                                                                    a non-dispersive infrared absorption module for the detection
                                                                    of CO2 (LI-COR LI-7000). In contrast to HAGAR, HAGAR-
                                                                    V additionally comprises a mass spectrometer (MS) coupled
                                                                    to two GC channels by a two-position valve which allows
Figure 1. Map of 10 flight tracks carried out with the German       switching between the two channels. This novel MS mod-
HALO (High Altitude and Long Range) research aircraft from and      ule can thus be used either for the detection of a wide range
to Shannon (Ireland) with one flight from Shannon to Oberpfaffen-   of atmospheric trace gases (different target species on each
hofen (Germany). The flights were conducted from 28 September to    channel) or to double the measurement frequency (same tar-
21 October in 2017 in the frame of the WISE campaign (for details   get species on both channels). However, during WISE only
see text).                                                          one of the two GC–MS channels was used, measuring nine
                                                                    different species (CH2 Cl2 , CHCl3 , CH3 Cl, CFC-11, CFC-
                                                                    113, HFC-125, HFC-134a, and iso- and n-pentane). In this
Atlantic Ocean and western Europe. Among other goals, the           study, the focus is on CH2 Cl2 and CHCl3 measurements by
WISE campaign aimed at investigating transport and mixing           HAGAR-V’s novel MS module; thus the instrumental de-
processes in the extratropical tropopause layer and the Ex-         scription is confined only to the GC–MS part of the instru-
LS, the impact of the Asian monsoon system on the chem-             ment. A more detailed description of HAGAR-V is given by
ical composition of the extratropical LMS, and the role of          Lauther (2020).
halogenated VSLSs in ozone depletion and radiative forcing             The general MS sampling process during WISE was as
in the UTLS region. In this study we present UTLS mea-              follows: ambient air is drawn from outside the aircraft to the
surements between a potential temperature of 315 and 404 K          instrument and is further compressed to 3 bar(a) by two di-
(i.e., 7.4–14.5 km altitude, 388–130 hPa pressure) of the last      aphragm pumps (KNF 813.5 and 814) connected in series.
10 WISE flights, i.e., from 28 September to 21 October 2017         The sample passes through a preconcentration tube packed
(Fig. 1). Due to technical issues of the instrument, CH2 Cl2        with about 70 mg of Carboxen 572 (Supelco) at 20 ◦ C to ad-
and CHCl3 measurements below the given range and dur-               sorb the target species. At a usual adsorption time of 40 s the
ing earlier flights of the WISE campaign were not performed         preconcentrated sample volume is about 130 mL. Afterwards
(see Sect. 2.2.1).                                                  the sample is desorbed by flash heating the trap to about
                                                                    270 ◦ C and injected onto the separation columns by apply-
2.2    In situ trace gas measurements                               ing a helium carrier gas flow. The sampled species are sep-
                                                                    arated within two 0.25 mm J&W Scientific Al2 O3 –Na2 SO4
Our analysis is mainly based on airborne in situ observations
                                                                    PLOT capillary columns of 4 and 5 m length (pre-column and
of the trace gas instruments HAGAR-V (CH2 Cl2 and CHCl3 )
                                                                    main column, respectively). Both columns are temperature
and UMAQS (N2 O) (as described below). The corresponding
                                                                    controlled, changing from an initial 35 ◦ C to a final 160 ◦ C
avionic data are provided by the Basic HALO Measurement
                                                                    in 20 s (pre-column) and 35 s (main column) and providing
and Sensor System (BAHAMAS) (Krautstrunk and Giez,
                                                                    two sample refocusing steps in the process. The sample is
2012; Giez et al., 2017). The different measurement frequen-
                                                                    detected by a quadrupole MS detector (5975C, Agilent Tech-
cies of the instruments were matched to that of HAGAR-V’s
                                                                    nologies) using the electron ionization (EI) mode.
mass spectrometer (MS) module of 1/180 Hz. Exceptions are
                                                                       Fast GC–MS measurements are essential when operating
the flights on 28 September and 1 October where the MS
                                                                    from aboard an aircraft. To achieve a sample frequency of
measurement frequency is 1/240 Hz. Each data point is the
                                                                    1/180 Hz per MS channel, particularly the heating and cool-
average of a time interval of 40 s, except for the flights on
                                                                    ing rates of the preconcentration traps and the columns were
28 September, 1 October, and 4 October, where it is 60 s, cor-
                                                                    optimized during the MS module development process. Both
responding to a spatial resolution at maximum cruising speed
                                                                    units are self-built, keeping the design and the application as
of 10 and 15 km along the flight path, respectively. The time
                                                                    adaptable as possible.
and location of a data point are given at the respective center
                                                                       The cooling of the preconcentration traps is realized by a
of the averaged time interval.
                                                                    Stirling cooler (Twinbird, SC-UD08), and each trap is heated
                                                                    by a self-regulating Ni heating wire (which is also used as a

Atmos. Chem. Phys., 22, 2049–2077, 2022                                              https://doi.org/10.5194/acp-22-2049-2022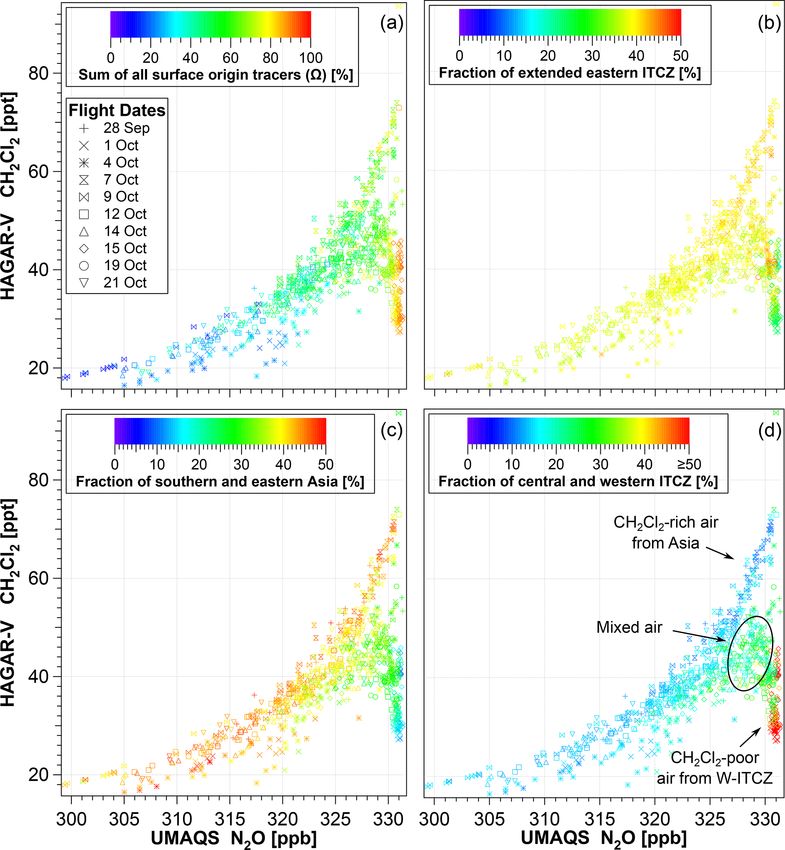
V. Lauther et al.: Transport pathways for Cl-VSLSs into the stratosphere                                                      2053

temperature sensor) convoluted around the trap tube. To our        ual time windows. Thereby peak tailing could be accurately
knowledge, HAGAR-V is the only state-of-the-art airborne           treated, and neighboring peaks were included in the back-
GC–MS instrument using indirect trap heating, and our ther-        ground fit. In addition, the MS data were corrected for small
modesorption design provides consistent heating and cooling        system contamination and an occasional systematic measure-
rates of 80 and −25 ◦ C s−1 (from 270 ◦ C down to 20 ◦ C) in-      ment bias of one calibration gas. The measurement precision
side the trap tube. In addition, our thermodesorption concept      was derived for each flight from the standard deviation of one
avoids large variable currents at relatively low voltages (peak    of the two in-flight calibration gases relative to its mixing ra-
current < 7 A at 48 V for < 2 s, then < 2 A) and is thus well      tio. The median precision values during WISE were 1.7 %
suited to being used aboard an aircraft with stringent con-        (1 ppt) and 2.7 % (0.4 ppt) for CH2 Cl2 and CHCl3 , respec-
straints regarding electromagnetic compatibility.                  tively.
   The self-built separation column ovens are conceptually
comparable to the principles of regular modern low-thermal-        2.2.2    University of Mainz Airborne Quantum Cascade
mass capillary column systems (e.g., Luong et al., 2006). In                Laser Spectrometer (UMAQS)
parallel to the column a heating wire and a temperature sen-
sor wire are coiled to a torus of 7 cm in diameter, acquiring      UMAQS simultaneously measures CO and N2 O from aboard
fast and homogenous heat application to the column (up to          HALO. The instrument uses the principle of direct absorption
20 ◦ C s−1 ) and temperature read-out. Deactivated capillary       spectroscopy of a continuous-wave quantum cascade laser
columns emerge from the torus functioning as connecting            operating at a sweep rate of 2 kHz (Müller et al., 2015). In
lines and particle traps to enhance the measurement stabil-        this study we use UMAQS measurements of N2 O with a total
ity. The cooling of the columns is realized by fans providing      drift-corrected uncertainty of 0.18 ppb (Kunkel et al., 2019).
a setback from final to initial temperatures within 60 s.          Note that for this study the N2 O measurements are averaged
   Following the compression by the inlet pumps, the air           over 40–60 s to fit the integration times of HAGAR-V’s MS
sample is usually dehydrated because water vapor can               module, thereby smoothing out instrumental noise and most
strongly affect the reproducibility of MS measurements.            likely further improving the N2 O precision. The instrument
However, during WISE the dehydration system of HAGAR-              is calibrated regularly in-flight using a secondary standard
V was malfunctioning. For the last 10 WISE flights, that sys-      which is calibrated against a NOAA standard before and after
tem was bypassed and the MS module measured only at low            the campaign. The accuracy of the N2 O mixing ratios used is
ambient water vapor levels (mainly at H2 O < 100 ppm; me-          0.39 ppb.
dian 5.6 ppm), i.e., in the UTLS region, thus yielding mea-
surements during about 90 % of a typical flight’s duration         2.3     CLaMS simulations
(i.e., about 7.6 h per flight). MS measurements of WISE
flights before 28 September could not be used for analysis         To support the interpretation of airborne measurements, we
due to the malfunctioning sample dehydration unit.                 use global three-dimensional simulations of the Chemical
   HAGAR-V uses two different working standards for in-            Lagrangian Model of the Stratosphere (CLaMS; McKenna
flight calibration to enhance the accuracy in the case of non-     et al., 2002a, b; Pommrich et al., 2014) as well as CLaMS
linear system responses. Both working standards consist of         back-trajectory calculations. CLaMS back-trajectory calcu-
compressed clean ambient air; one of them is additionally          lations consider only the advective (reversible) transport, ne-
diluted with about 25 % synthetic air. The main bottles of         glecting (irreversible) mixing processes entirely (e.g., Vo-
the working standards were calibrated by Goethe University         gel et al., 2019; Hanumanthu et al., 2020). However, in
Frankfurt against a calibration gas that was calibrated in sec-    this study back trajectories are useful to trace back the de-
ond generation against an AGAGE standard on the SIO-14             tailed transport pathway and transport time of an air par-
(CH2 Cl2 ) and SIO-98 (CHCl3 ) scale. Every second or third        cel in the UTLS to possible source regions in the boundary
flight the in-flight calibration gas bottles were refilled from    layer and therefore provide added value compared to three-
the main bottles after a calibration between the main bottles      dimensional CLaMS simulations including irreversible mix-
and flight bottles. Considering possible differences between       ing. Both three-dimensional CLaMS simulations and back-
the main bottles and flight bottles, uncertainties in the mixing   trajectory calculations are driven by ECMWF ERA-Interim
ratios within the main bottles, and potential influence from       reanalysis data with a horizontal resolution of 1◦ × 1◦ (Dee
HAGAR-V’s inlet pump system, the MS relative accuracy              et al., 2011).
was estimated to be 2.0 % and 4.4 % for CH2 Cl2 and CHCl3 ,           In CLaMS, the diabatic approach was applied using the di-
respectively.                                                      abatic heating rate as the vertical velocity with contributions
   Measurement precision was optimized during data pro-            from radiative heating including the effects of clouds, latent
cessing, using a strongly adapted version of the Igor Pro          heat release, mixing, and diffusion (for details, see Ploeger
analysis package called NOAHChrom, originally developed            et al., 2010). CLaMS employs a hybrid vertical coordinate
by NOAA, USA. Exponentially modified Gaussian (EMG)                (ζ ) which, in this study, transforms from a strictly isentropic
functions were fitted to the MS signal peaks within individ-       coordinate (2) to a pressure-based orography-following co-

https://doi.org/10.5194/acp-22-2049-2022                                           Atmos. Chem. Phys., 22, 2049–2077, 2022
2054                                                 V. Lauther et al.: Transport pathways for Cl-VSLSs into the stratosphere

ordinate system (σ coordinates) below a threshold of ap-          The back trajectories are initialized at the time and location
proximately 300 hPa (Pommrich et al., 2014). In both three-       of the center of the respective MS sample integration time
dimensional simulations and trajectory calculations, the up-      window and end at the first contact with the model boundary
ward transport in CLaMS is driven by ERA-Interim reanaly-         layer (below 2–3 km a.g.l.). In general, the maximum length
sis data in which changes are implemented to improve deep         of a trajectory is confined to 120 d; however most of the tra-
and mid-level convection compared to in previous reanaly-         jectories reach the model boundary layer much earlier.
sis data (Dee et al., 2011). However small-scale rapid up-           In general, trajectory calculations have limitations caused
lift in convective cores is not included; therefore small-scale   by trajectory dispersion increasing with the trajectory length;
convection is most likely underestimated in CLaMS simula-         therefore ensembles of trajectories (of about 100 to 200 tra-
tions driven by ERA-Interim. Nevertheless, upward transport       jectories) are used here. The maximum trajectory length of
in larger convective systems such as tropical cyclones is rep-    120 d was chosen to match a large part of the time frame
resented in CLaMS trajectory calculations driven by ERA-          of the three-dimensional CLaMS simulation, but the average
Interim (Li et al., 2017, 2020). More detailed information        length of the back trajectories used is 50 d. We will show (in
about CLaMS is given by Pommrich et al. (2014) and ref-           Sect. 3.1.2 and 3.1.3) that the results of the three-dimensional
erences therein. Equivalent latitudes and the location of the     CLaMS simulation in which mixing of air parcels is included
thermal tropopause (lapse rate, according to WMO) along           agree very well with the results of the back-trajectory analy-
the flight path were calculated from ERA-Interim reanalysis       sis.
data.
                                                                  3     Results
2.3.1   Artificial tracers of air mass origin
In this study CLaMS simulations of artificial tracers of air      3.1    CH2 Cl2 –N2 O relationship during WISE
mass origin (also referred to as surface origin tracers, i ;     The analysis presented in this paper is mainly based on the
Vogel et al., 2015, 2016, 2019) are used to identify the loca-    CH2 Cl2 –N2 O relationship observed during WISE (Fig. 3).
tion of the origin of air masses whose impact can be seen         With a photochemical lifetime of 123 years (Ko et al., 2013),
in the concentration data gathered during WISE. The sur-          N2 O is well mixed in the troposphere and has a much
face origin tracers are released within 24 defined regions in     longer lifetime than CH2 Cl2 , which exhibits strongly vary-
the boundary layer (ζ = 120 K ∼ 2–3 km above ground level         ing mixing ratios throughout the boundary layer (e.g., Sim-
(a.g.l.), including orography) as shown in Fig. 2a. The dif-      monds et al., 2006). As expected, the CH2 Cl2 –N2 O rela-
ferent surface origin tracers are continuously released (ev-      tionship is relatively compact for data points with low N2 O
ery 24 h) at the model boundary and are subsequently trans-       mixing ratios (i.e., N2 O < 325 ppb, relatively old, mixed,
ported (advected and mixed) to the free atmosphere during         and processed air). Towards younger air masses (N2 O >
the course of the simulation. Here, the irreversible part of      325 ppb) there is a distinct split of the compact relationship
transport was set to discrete mixing steps every 24 h. The        into two branches. In the stratosphere, the upper branch of
simulation was initialized with the meteorological data from      the CH2 Cl2 –N2 O relationship shows up to 150 % enhanced
1 May 2017, implying that all air parcels residing in the free    CH2 Cl2 mixing ratios compared to data of the lower branch
troposphere and the stratosphere at this date are not marked      at the same N2 O mixing ratios. For N2 O > 328.5 ppb, data
with the surface origin tracers. As a consequence,  the frac-   points with low CH2 Cl2 mixing ratios even decrease with in-
tion of all surface origin tracers  = n=24
                                         P
                                            i=1   i of an air    creasing N2 O (Fig. 3, inset). In general, the majority of mea-
parcel can be < 100 % during the course of the simulation be-     surements was obtained in the stratosphere above the ther-
cause air masses from before 1 May 2017 can also contribute       mal tropopause (TP) with an increasing number of observa-
to the composition of an air parcel. In this study we exam-       tions below the thermal TP for increasing N2 O mixing ra-
ine short-lived species measured in October 2017 with the         tios. Thereby mainly air parcels of the lower branch of the
focus on relatively fast transport; therefore a simulation pe-    CH2 Cl2 –N2 O relationship are from below the thermal TP.
riod of approximately 5–6 months is chosen here. The model           The most frequent convection up to potential tempera-
simulation used is spatially constrained from the surface to      ture levels of the order of 360 K is expected to originate
2 = 900 K (about 37 km altitude) with a horizontal resolu-        in the tropics. Therefore, tropical monthly averaged ground-
tion of 100 km and a maximum vertical resolution of about         based measurements of CH2 Cl2 from the AGAGE network at
400 m (at the tropopause).                                        Ragged Point, Barbados (Fig. 4; Prinn et al., 2018), were an-
                                                                  alyzed. These AGAGE observations suggest an explanation
                                                                  for the lower branch of the CH2 Cl2 –N2 O relationship ob-
2.3.2   Back-trajectory calculations
                                                                  served during WISE. The mainly OH-induced CH2 Cl2 sea-
In order to investigate the transport pathways correspond-        sonality results in minimum tropical CH2 Cl2 surface mixing
ing to the WISE measurements analyzed here, the trajectory        ratios in September 2017. This September minimum is com-
module of CLaMS was used to calculate back trajectories.          parable to WISE data of low CH2 Cl2 mixing ratios in the

Atmos. Chem. Phys., 22, 2049–2077, 2022                                            https://doi.org/10.5194/acp-22-2049-2022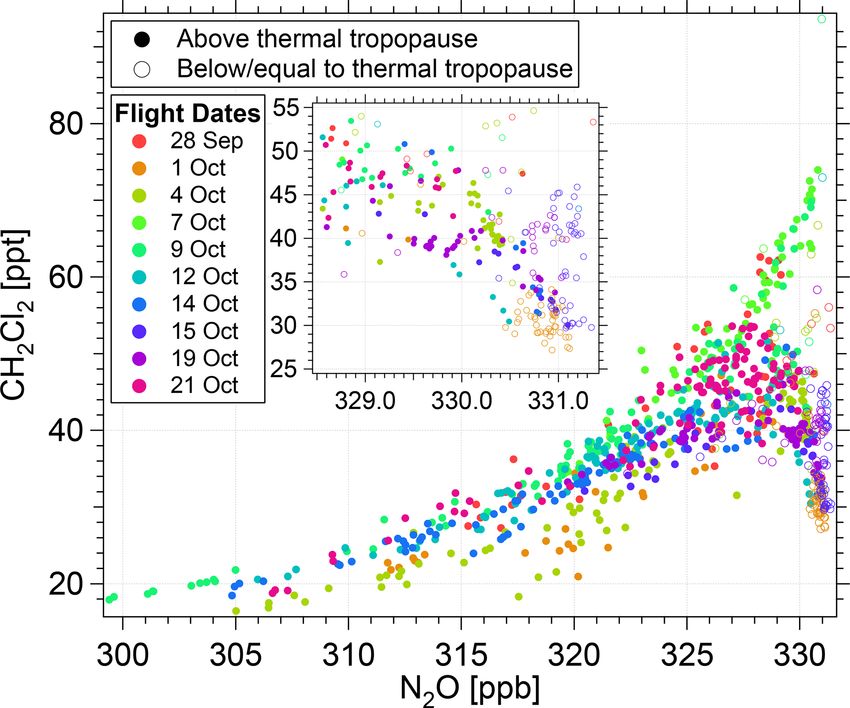
V. Lauther et al.: Transport pathways for Cl-VSLSs into the stratosphere 2055
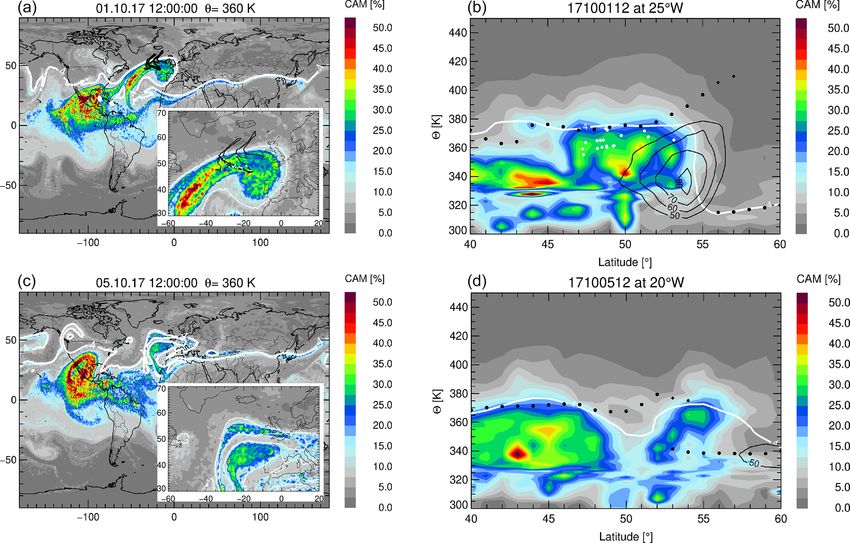
Figure 2. World map depicting the boundaries of CLaMS’s 24 surface origin tracers (a) and three surface origin tracers combining several
tracers from regions of significant (> 90 %) impact on the WISE measurements (b). The tracer names corresponding to their abbreviations
are listed next to the maps. Also included in the list are the tracers of combined regions (see Sect. 3.1.2).
UTLS region in October (Fig. 4, at N2 O ≈ 330.9 ppb) assum- ences particularly in the NH tropics. However, it is unclear if
ing a transport time from Earth’s surface to the UTLS region these differences are caused by calibration biases or are of a
of a few weeks. The observed decrease in low CH2 Cl2 mix- natural origin (Engel et al., 2018).
ing ratios for increasing N2 O mixing ratios (from older to
younger air) agrees well with the decreasing tropical monthly
averaged CH2 Cl2 mixing ratios from about July to Septem- 3.1.1 Data filter
ber 2017, as observed by AGAGE. Extratropical NH ground-
based observations from the AGAGE network yield signifi- In order to separately analyze the CH2 Cl2 –N2 O relation-
cantly higher CH2 Cl2 mixing ratios than those in the tropics. ship’s distinct features, the measurements are filtered rel-
It is thus very likely that the lower branch of the CH2 Cl2 – ative to a “mean correlation curve”. The mean correlation
N2 O relationship is caused by the tropical Atlantic CH2 Cl2 curve is derived from a quadratic fit applied to the CH2 Cl2 –
surface seasonality. However, the low CH2 Cl2 mixing ratios N2 O relationship for N2 O < 325 ppb, i.e., where the relation-
observed during WISE could also be impacted by air uplifted ship clearly correlates (Fig. 5a). In order to identify chemi-
from regions less influenced by CH2 Cl2 sources than the ob- cally contrasting air masses of potentially different origin,
servations from the AGAGE network at Barbados. Ground- we focus on the most extreme differences in the chemi-
based observations of CH2 Cl2 surface mixing ratios from the cal composition: measurements more than 5 ppt higher than
AGAGE and the NOAA network show strong regional differ- the mean correlation curve are considered CH2 Cl2 -rich air;
measurements more than 10 ppt lower than the mean cor-
https://doi.org/10.5194/acp-22-2049-2022 Atmos. Chem. Phys., 22, 2049–2077, 2022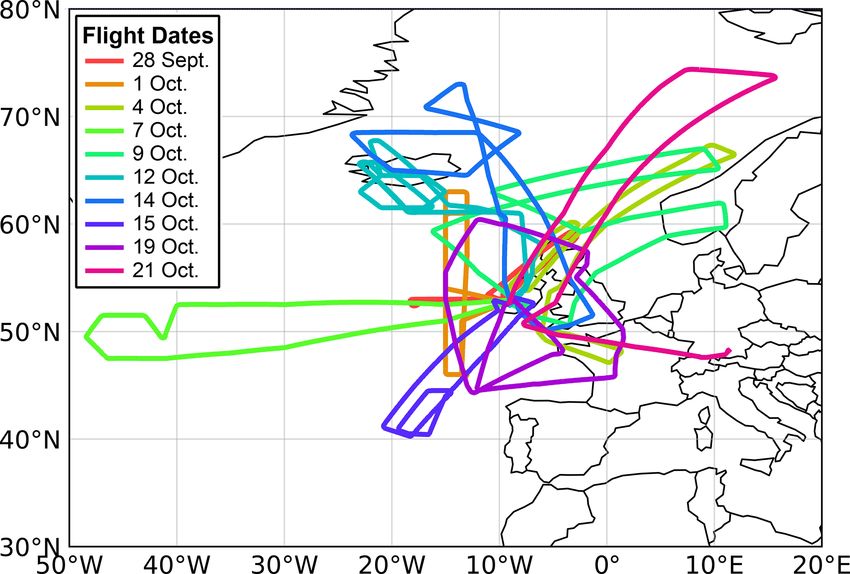
2056                                                 V. Lauther et al.: Transport pathways for Cl-VSLSs into the stratosphere

Figure 3. CH2 Cl2 –N2 O relationship color coded by flight date.   Figure 4. Monthly averaged ground-based measurements of
The inset shows a detailed magnification of decreasing CH2 Cl2     CH2 Cl2 from the AGAGE network at Ragged Point, Barbados
mixing ratios with increasing N2 O within the lower branch of      (13◦ N; Prinn et al., 2018), overlaid by a detailed plot of the
the CH2 Cl2 –N2 O relationship. Air parcels below the thermal      CH2 Cl2 –N2 O relationship observed during WISE. The AGAGE
tropopause are marked as open circles and air parcels above by     CH2 Cl2 time series (shown in red) shows CH2 Cl2 ’s seasonality
closed circles.                                                    and is overlaid by the CH2 Cl2 –N2 O relationship such that the
                                                                   CH2 Cl2 minimum at N2 O ≥ 325 ppb measured during WISE in Oc-
                                                                   tober 2017 matches the surface CH2 Cl2 minimum at Barbados in
relation curve are considered CH2 Cl2 -poor air. In addition,      September 2017. Further, the axis of the time series is adjusted so
only measurements with N2 O > 325 ppb (corresponding to            that 1 month corresponds to a change of ∼ 2 ppb N2 O, which is
2 < 390 K) are considered. The choice of these filter con-         the typical N2 O change per month of age in the UTLS (Andrews
ditions allows the CH2 Cl2 -rich and CH2 Cl2 -poor air masses      et al., 2001). The gradient of the CH2 Cl2 –N2 O relationship’s lower
to be clearly discriminated. It will further be shown below        branch (low CH2 Cl2 mixing ratios between dashed red lines) qual-
                                                                   itatively fits the temporal variation in the ground-based CH2 Cl2
that this filter definition yields a good correspondence with
                                                                   measurements. The graph illustrates the congruence of ground-
the impact of different air mass origins on the CH2 Cl2 –N2 O
                                                                   based tropical measurements of CH2 Cl2 from the AGAGE network
relationship.                                                      and airborne extratropical measurements of CH2 Cl2 from the WISE
   The thus defined measurements of CH2 Cl2 -rich air contain      campaign when assuming that the variation in stratospheric CH2 Cl2
a median of 64 % higher mixing ratios than those of CH2 Cl2 -      with age (here expressed in terms of the N2 O mixing ratio) arises
poor air (59 ppt vs. 36 ppt, respectively). In addition, the me-   from the temporal variation in CH2 Cl2 at the ground (“tape recorder
dian potential temperature of measurements of CH2 Cl2 -rich        effect”). Although this simplified view ignores the impact of mix-
air is 16.2 K higher than that of CH2 Cl2 -poor air (377.8 K vs.   ing processes and chemical reduction in CH2 Cl2 , it qualitatively
361.6 K, respectively). In the Ex-LS, 93 % of CH2 Cl2 -rich        explains the lower branch of the CH2 Cl2 –N2 O relationship for air
air was observed, which is the case only for 40 % of CH2 Cl2 -     parcels younger than a few months.
poor air. However, only slightly smaller differences between
the two types of air mass are visible in observations above
the thermal TP (58 ppt vs. 39 ppt and 378.7 K vs. 368.3 K, re-     3.1.2   Impact of different air mass origins on the
spectively). Not only do these findings indicate tropospheric              extratropical UTLS
intrusions of air from two different source regions into the
                                                                   In order to investigate the impact of different air mass ori-
stratosphere, but the different levels of potential tempera-
                                                                   gins on the WISE trace gas measurements, tracers of air
ture also suggest two different transport mechanisms. One
                                                                   mass origin simulated with CLaMS are analyzed. To fo-
is transporting CH2 Cl2 -rich air mainly to the top of the LMS
                                                                   cus on fast transport into the LMS in the range of approx-
(2 ≈ 380 K), and the other is transporting CH2 Cl2 -poor air
                                                                   imately 6 months, reflecting the mean tropospheric lifetime
mainly to the middle and lower part of the LMS (2 ≈ 360–
                                                                   of CH2 Cl2 and CHCl3 (see Sect. 1), only the fraction of air
370 K; Fig. 5b).
                                                                   parcels released from the boundary layer since 1 May is con-
                                                                   sidered. Therefore, in every air parcel each surface origin
                                                                   tracer fraction (i ) is normalized
                                                                                                      to the sum of all
                                                                                                                        fractions
                                                                                                   Pn=24
                                                                   of surface origin tracers  = i=1 i ≤ 100 % in the air
                                                                   parcel, thus neglecting the fraction of air that was in the free
                                                                   atmosphere at the initialization date of the CLaMS simula-

Atmos. Chem. Phys., 22, 2049–2077, 2022                                               https://doi.org/10.5194/acp-22-2049-2022
V. Lauther et al.: Transport pathways for Cl-VSLSs into the stratosphere                                                                2057

Figure 5. (a) CH2 Cl2 –N2 O relationship color coded with the definition of the data filter used. Red data points are measurements considered
CH2 Cl2 -rich air with mixing ratios more than 5 ppt higher than the mean correlation curve and N2 O ≥ 325 ppb. Blue data points are mea-
surements considered CH2 Cl2 -poor air with mixing ratios more than 10 ppt lower than the mean correlation curve and N2 O ≥ 325 ppb. The
mean correlation curve is derived from a quadratic fit to the CH2 Cl2 –N2 O relationship for N2 O < 325 ppb extrapolated to higher mixing
ratios relevant for the data filter (dashed line). (b) Scatterplot of CH2 Cl2 as a function of the potential temperature, color coded to high-
light CH2 Cl2 -rich (red) and CH2 Cl2 -poor (blue) air. On average the CH2 Cl2 -rich air is found at higher potential temperatures than the
CH2 Cl2 -poor air.

tion on 1 May 2017 (i.e., air older than 6 months). The start            ble 1 lists the median fractions in CH2 Cl2 -rich and CH2 Cl2 -
time of our simulations on 1 May 2017 is further chosen                  poor air of each surface origin tracer fulfilling criterion 1.
to be before the onset of the Asian summer monsoon (pre-                    The surface origin tracers also fulfilling criterion 2 for
monsoon) in order to include all transport processes into the            CH2 Cl2 -rich air are all located in the region of southern and
lower stratosphere (LS) impacted by the Asian monsoon cir-               eastern Asia (SaEA) including India, China, and Southeast
culation. In the following, all analyzed surface origin tracers          Asia (see Fig. 2). The source region of this SaEA tracer is
are normalized as described above if not stated otherwise.               mostly land based and located in the core region of the Asian
   Further, to work out differences in air mass origin between           summer monsoon (ASM) from where the highest CH2 Cl2
CH2 Cl2 -rich and CH2 Cl2 -poor air, the median fraction of a            emissions globally are expected (Claxton et al., 2020). The
surface origin tracer in CH2 Cl2 -rich air parcels is compared           median fraction of the SaEA surface origin tracer in CH2 Cl2 -
to that in CH2 Cl2 -poor air parcels. To combine regions of              rich air is about twice that in CH2 Cl2 -poor air (41.5 % vs.
air mass origin with a particularly high relative impact on              20.7 %, respectively).
either CH2 Cl2 -rich or CH2 Cl2 -poor air, the ratio of these               The surface origin tracers fulfilling criteria 1 and 2 for
median surface origin tracer fractions in CH2 Cl2 -rich and              CH2 Cl2 -poor air are all located in the tropics along the
CH2 Cl2 -poor air is analyzed. Surface origin tracers with par-          mostly western part of the Intertropical Convergence Zone
ticularly high relative median fractions in either CH2 Cl2 -rich         (ITCZ) from 120◦ W to about 45◦ E (W-ITCZ; see Fig. 2b).
or CH2 Cl2 -poor air are combined following these two crite-             The source region of this W-ITCZ tracer includes a large
ria:                                                                     maritime region and is not known for significant CH2 Cl2
                                                                         emissions. The median fraction of the W-ITCZ surface ori-
  1. Only surface origin tracers with median fractions ≥ 1 %             gin tracer in CH2 Cl2 -poor air is about 3 times higher than in
     in CH2 Cl2 -rich or CH2 Cl2 -poor air parcels are consid-           CH2 Cl2 -rich air (40.6 % vs. 13.5 %, respectively) with a par-
     ered.                                                               ticularly high contribution from the region of Central Amer-
                                                                         ica (CAM).
  2. The ratio of a median surface origin tracer frac-                      The surface origin tracers fulfilling criterion 1 but not cri-
     tion (CH2 Cl2 -rich / CH2 Cl2 -poor air or CH2 Cl2 -                terion 2 are all geographically connected. To focus on NH
     poor / CH2 Cl2 -rich air) must be > 1.8.                            regions of air mass origin and because its fraction in both
                                                                         CH2 Cl2 -rich and CH2 Cl2 -poor air is very low (< 2.5 %),
With this definition, regions of air mass origin – as defined            the surface origin tracer for the lower Southern Hemisphere
for the model simulation – of significantly enhanced influ-              (LSH; Fig. 2a) will not be considered in the following anal-
ence on measurements of CH2 Cl2 -rich (CH2 Cl2 -poor) air                ysis. Without LSH, the third major region of air mass origin
relative to CH2 Cl2 -poor (CH2 Cl2 -rich) air are combined. Ta-

https://doi.org/10.5194/acp-22-2049-2022                                                  Atmos. Chem. Phys., 22, 2049–2077, 2022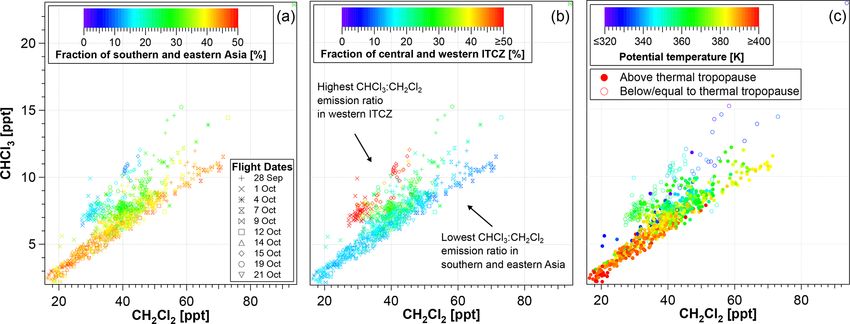
2058                                                        V. Lauther et al.: Transport pathways for Cl-VSLSs into the stratosphere

Table 1. Median fractions of different surface origin tracers from        tracer ranging from 8.5 % to 48 % and those of the W-ITCZ
CLaMS in measurements of CH2 Cl2 -rich and CH2 Cl2 -poor air              tracer ranging from 9.3 % to 70.8 %.
parcels and the respective ratios of the median fractions. The last          On the one hand, of all measured air masses entering the
row shows the median fraction of .  is the sum of all (non-             LS in the course of the NH summer, a large fraction orig-
normalized) surface origin tracers of the respective air parcels ( =     inated in southern and eastern Asia. In addition, these air
P  n=24
   i=1 i ; see Sect. 2.3.1), which is the fraction of an air par-        masses are preferably composed of CH2 Cl2 -rich air and thus
cel actually considered in the tracer analysis of CH2 Cl2 -rich and
CH2 Cl2 -poor air. The fraction (100 − ) % is the part of an air par-
                                                                          strongly contribute to steepening the slope of the CH2 Cl2 –
cel that was already in the free atmosphere on 1 May 2017. The            N2 O relationship (upper branch). On the other hand, young
geographical location of each surface origin tracer is given in Fig. 2.   air from the region of the central and western part of the
                                                                          ITCZ strongly influences the UTLS with CH2 Cl2 -poor air
  Surface origin         CH2 Cl2 -    CH2 Cl2 -    Rich /     Poor /      (lower branch). Further, measurements in between CH2 Cl2 -
  tracer                 rich (%)     poor (%)      poor        rich      rich and CH2 Cl2 -poor air in the CH2 Cl2 –N2 O relationship
                                                                          contain moderate fractions (in the range of 20 %–40 %) from
              CAM              7.3         24.9      0.29       3.40
                                                                          both regions of air mass origin.
  W-ITCZ      TAO              2.3          6.9      0.34       2.98
              NAF              3.8          6.9      0.54       1.90
                                                                             It has to be noted that the ground-based measurements of
                                                                          CH2 Cl2 from the AGAGE network (Sect. 3.1) were obtained
              LSH              1.9          2.3      0.83       1.20      in the CAM surface origin tracer region, which is included
              TEP              9.8         10.7      0.92       1.09      in the W-ITCZ tracer. The extraordinarily high impact of the
              Neast            4.3          4.1      1.04       0.96      CAM tracer (24.9 %) on the measurements of CH2 Cl2 -poor
              Wpool            7.7          5.7      1.35       0.74      air strongly supports the comparison made in Sect. 3.1 and
  E-ITCZ
              NWP              5.0          3.4      1.49       0.67      underlines our conclusion of CH2 Cl2 ’s tropical Atlantic sur-
              TWP              6.7          4.5      1.49       0.67      face seasonality being reflected in the measurements within
              INO              6.7          4.1      1.64       0.61      the UTLS region.
              SEA             10.8          5.8      1.87       0.54         The influence of the E-ITCZ surface origin tracer on the
              NIN              4.9          2.6      1.90       0.53      CH2 Cl2 –N2 O relationship is about equal in all air parcels
              BoB              7.1          3.7      1.92       0.52      with fractions of around 40 % (Fig. 6b). This region of air
  SaEA
              ECH              6.0          3.1      1.94       0.52      mass origin is thus generally important for the composition
              IND              5.2          2.6      1.97       0.51      of young air masses in the LMS without a specifically strong
              TIB              6.5          3.3      2.00       0.50      influence on either CH2 Cl2 -rich or CH2 Cl2 -poor air.
                             63.2         81.4      0.78       1.29
                                                                          3.1.3   Results of back-trajectory calculations
                                                                          The back trajectories calculated for CH2 Cl2 -rich and
                                                                          CH2 Cl2 -poor air are analyzed in two steps. First, the loca-
significantly influencing the WISE measurements by rela-                  tion of the maximum rate of change in potential temperature
tively fast transport mainly includes an extended region of the           (diabatic ascent rate) along each back trajectory is derived
summertime ITCZ mostly in the Eastern Hemisphere and the                  and the transport time from the measurement to this loca-
Pacific Ocean (E-ITCZ), excluding the regions of W-ITCZ                   tion is calculated. Second, the back trajectories are consid-
and SaEA. The region of this E-ITCZ tracer combines a vast                ered up to the point where they reach the model boundary
maritime region and areas adjacent to the core region of the              layer. General transport pathways are derived for measure-
ASM. The fractions of the E-ITCZ surface origin tracer in                 ments of CH2 Cl2 -rich and CH2 Cl2 -poor air. Within the max-
CH2 Cl2 -rich and CH2 Cl2 -poor air parcels do not strongly fa-           imum of 120 d the model boundary layer is reached by 59
vor either over the other.                                                out of 80 back trajectories of CH2 Cl2 -rich air (74 %) and 170
   With mainly fractions above 40 %, the SaEA tracer domi-                out of 189 back trajectories of CH2 Cl2 -poor air (90 %), and
nates the CH2 Cl2 –N2 O relationship both below 325 ppb N2 O              only these back trajectories are analyzed in the following.
and in the upper branch above 325 ppb N2 O including                      The median time for an air parcel at the boundary layer to
CH2 Cl2 -rich air (Fig. 6c). Towards CH2 Cl2 -poor air, the               reach the location of measurement is 48 d; CH2 Cl2 -poor air
SaEA tracer gradually decreases while the W-ITCZ tracer                   in general shows shorter transport times (43 d) than CH2 Cl2 -
increases up to fractions above 50 % (Fig. 6d). In fact,                  rich air (64 d). The locations of trajectory end points at the
both surface origin tracers, SaEA and W-ITCZ, show sig-                   model boundary layer color coded with transport time are
nificant correlations with all WISE CH2 Cl2 measurements                  given in Appendix B (Fig. B1).
at N2 O > 325 ppb. Thereby Spearman’s correlation coeffi-
cients rSaEA = 0.7 and rW-ITCZ = −0.72 indicate a signifi-
cant monotone but not necessarily linear positive and neg-
ative correlation, respectively, with fractions of the SaEA

Atmos. Chem. Phys., 22, 2049–2077, 2022                                                    https://doi.org/10.5194/acp-22-2049-2022
V. Lauther et al.: Transport pathways for Cl-VSLSs into the stratosphere 2059
Figure 6. CH2 Cl2 –N2 O relationship color coded with the sum of all (non-normalized) surface origin tracers (, a) and the E-ITCZ (b), the
SaEA (c), and the W-ITCZ (d) surface origin tracer. The SaEA, W-ITCZ, and E-ITCZ surface origin tracers are each normalized to the sum
of all surface origin tracers (i.e., of each air parcel only the fraction of the sum of all surface origin tracers is considered), thereby neglecting
the fraction of older air that was above the model boundary layer on the simulation’s initialization date (1 May 2017; see Sect. 2.3.1). The
CH2 Cl2 –N2 O relationship color coded with the absolute fraction of SaEA and W-ITCZ is shown in Fig. A1 in Appendix A.
Locations of maximum diabatic ascent rate and transport CH2 Cl2 -rich air were almost exclusively uplifted within the
times ASM. There is a clear overlap between the Asian region of
concentrated locations of max 1218 h and the region of the
The location of maximum change in potential temperature SaEA surface origin tracer with the highest relative contribu-
over a time interval of 18 h (max 1218 h ) along each trajec- tion to air parcels of CH2 Cl2 -rich air (see Sect. 3.1.2), sug-
tory is used to identify the locations of strong uplift along gesting a consistency between trajectory calculations and the
the trajectories of sampled CH2 Cl2 -rich and CH2 Cl2 -poor three-dimensional CLaMS simulation.
air. This uplift occurs in the troposphere. Details about the Of all trajectories related to CH2 Cl2 -poor air, more than
calculation and use of max 1218 h are given by Hanuman- 50 % exhibit the location of max 1218 h above the region of
thu et al. (2020). Central America with the rest being located above southern
Almost all trajectories of CH2 Cl2 -rich air show their and eastern Asia and along the ITZC (Fig. 7a). The transport
max 1218 h above the region of southern and eastern Asia, times to the UTLS since the ascent above Central America
in particular above the region of the Tibetan Plateau, north- mainly range between 2–5 weeks (see Table 2). The main
ern India, China, and Southeast Asia (Fig. 7b). This uplift uplift of CH2 Cl2 -poor air above Central America thus falls
mostly occurred about 5–10 weeks prior to the measurement into the time period of late August and throughout the en-
(see Table 2), i.e., in July and August, the peak season of tire September. With transport times from the boundary layer
the ASM. This strongly suggests that the measurements of
https://doi.org/10.5194/acp-22-2049-2022 Atmos. Chem. Phys., 22, 2049–2077, 20222060 V. Lauther et al.: Transport pathways for Cl-VSLSs into the stratosphere
Figure 7. Location of maximum change in potential temperature over a time interval of 18 h (max 1218 h ) along back trajectories, color
coded with the transport time from the location of measurement to the location of max 1218 h . (a) CH2 Cl2 -poor air; (b) CH2 Cl2 -rich air.
Shown are the locations of max 1218 h for CH2 Cl2 -rich and CH2 Cl2 -poor air from all WISE flights between 28 September and 21 October.
Table 2. Median transport times derived from back trajectories calculated for air parcels of CH2 Cl2 -poor air uplifted above Central America
(location of max 1218 h within 0–35◦ N and 50–120◦ W) labeled as NAM and for air parcels of CH2 Cl2 -rich air uplifted above southern
and eastern Asia (location of max 1218 h within 0–40◦ N and 60–160◦ E) labeled as ASM. The median transport times are calculated from
both the model boundary layer (BL) and the location of max 1218 h to the location of measurement in the UTLS, only for samples above the
thermal TP (lower stratosphere, LS) and only for samples below or equal to the thermal TP (upper troposphere, UT). The medians are given
with the range of the 25th and the 75th percentile in parentheses. N is the number of trajectories used to calculate the respective median.
Note that the number of CH2 Cl2 -rich air samples observed in the UT and uplifted above southern and eastern Asia is too small to provide
reliable transport times.
NAM ASM
Transp. time (d) N Transp. time (d) N
BL to meas. (UTLS) 25 (15–48) 61 (43–78)
92 51
Max 1218 h to meas. (UTLS) 20 (12–35) 48 (39–68)
BL to meas. (UT) 20 (14–34)
69 4
Max 1218 h to meas. (UT) 13 (11–25)
BL to meas. (LS) 47 (31–64) 64 (43–79)
23 47
Max 1218 h to meas. (LS) 38 (30–43) 48 (39–68)
(BL) being only about 1 week longer (Table 2), this result CH2 Cl2 -poor air is above Central America, which was also
supports the comparison of CH2 Cl2 -poor air with the sea- identified as the most significant region of air mass origin of
sonal minimum CH2 Cl2 mixing ratios observed by AGAGE CH2 Cl2 -poor air in the three-dimensional CLaMS simulation
at Barbados (see Fig. 4). During the time period of late Au- (see Sect. 3.1.2).
gust and September, the region around Central America is in-
fluenced by several convective systems: (1) the North Amer-
ican monsoon; (2) the ITCZ; and (3) tropical cyclones, i.e., Analysis of transport pathways
hurricanes. It is very likely that all of these convective sys- The back trajectories from the location of measurement to the
tems contributed to the fast uplift of CH2 Cl2 -poor air. The model boundary layer are analyzed to identify the main trans-
convection systems of the North American monsoon and the port pathways of CH2 Cl2 -rich and CH2 Cl2 -poor air into the
ITCZ share many characteristics and overlap geographically, UTLS. As representative examples, Fig. 8 shows the trajecto-
which makes it difficult to distinguish between the two sys- ries of the WISE flights on 1 October (Fig. 8a) and 7 October
tems (e.g., Siu and Bowman, 2019). The uplift of air parcels (Fig. 8b) for CH2 Cl2 -poor and CH2 Cl2 -rich air, respectively.
by hurricanes can be distinguished and localized more clearly Almost all trajectories of CH2 Cl2 -rich air show the follow-
and is analyzed below. The back-trajectory analysis sug- ing general pathway: the air parcels are convectively lifted
gests that the most important region for vertical transport of up above southern and eastern Asia to 2 ≈ 360 K. Further
Atmos. Chem. Phys., 22, 2049–2077, 2022 https://doi.org/10.5194/acp-22-2049-2022V. Lauther et al.: Transport pathways for Cl-VSLSs into the stratosphere 2061
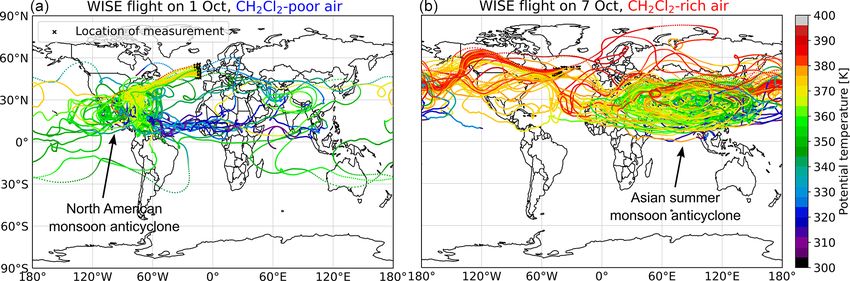
Figure 8. Back trajectories from the location of measurement to the model boundary layer for CH2 Cl2 -poor air sampled on 1 October (a) and
for CH2 Cl2 -rich air sampled on 7 October (b), color coded with the potential temperature of the trajectory. The trajectories of CH2 Cl2 -poor
air show an uplift above Central America to about 365 K, an isentropic northward drag towards an anticyclonic system above North America,
an eastward breakout, and a direct and isentropic pathway into the extratropics above the Atlantic Ocean. The trajectories of CH2 Cl2 -rich
air show an uplift above southern and eastern Asia up to about 360 K with further upward transport by the ASMA to about 385 K and a
breakout eastwards following the subtropical jet stream until they quasi-isentropically enter the extratropics above the eastern Pacific or
western Atlantic Ocean.
ascent of the air parcels occurs in a clockwise upward spi- significantly increases the transport time of an air parcel by
raling motion (Vogel et al., 2019), following the dynamics about 3 weeks and has the potential to cause it to descend by
of the Asian summer monsoon anticyclone (ASMA), mainly up to about −10 K as indicated by the back-trajectory calcu-
to potential temperatures in the range of 370–400 K. Prefer- lations. However, the median transport time from the BL to
ably within this potential temperature range, the air parcels the location of measurement in the Ex-LS of CH2 Cl2 -poor air
break out of the ASMA eastwards (e.g., Honomichl and Pan, parcels by convection above Central America (max 1218 h
2020), following the subtropical jet stream at about 40◦ N un- between 0–35◦ N and 50–120◦ W) is still 17 d shorter than
til, eventually, they quasi-isentropically enter the extratropics for CH2 Cl2 -rich air parcels lifted up above southern and east-
above the eastern Pacific or western Atlantic Ocean (e.g., Vo- ern Asia (max 1218 h between 0–40◦ N and 60–160◦ E; 47
gel et al., 2014, 2016). All trajectories suggest that the air vs. 64 d, respectively; Table 2), and their median potential
parcels arrived from the west at the location of measurement, temperature differs by 10.7 K (369.7 K vs. 380.4 K, respec-
and most trajectories suggest a slight diabatic descent of up tively). Below, the transport pathway from Central America
to −10 K in the extratropics a few days before the measure- to the Ex-LS is discussed in more detail.
ment. The transport time from the boundary layer to the lo- The analysis of the entire set of back trajectories shows
cation of measurement in the Ex-LS via this pathway ranges that for the majority of measurements there are two distinct
between 6–11 weeks (see Table 2). transport pathways into the Ex-UTLS. CH2 Cl2 -rich air is
The majority (> 50 %) of trajectories of CH2 Cl2 -poor air transported by the ASMA into the Ex-LS and CH2 Cl2 -poor
show a strong uplift above the region of Central America air mainly by convection above Central America, which in-
up to potential temperatures mainly in the range of 360– cludes the North American monsoon, the ITCZ, and hurri-
370 K. After convection, the trajectories experience a north- canes, into the Ex-UTLS. In general, air parcels are lifted up
ward drag towards an anticyclonic structure located above to similar potential temperature levels by the convection of
North America, and most of these trajectories further di- the ASM in Asia and the convection above Central Amer-
rectly enter the extratropics above the Atlantic Ocean or the ica. The key difference yielding the observed higher poten-
North American east coast, leading to short transport times to tial temperatures of CH2 Cl2 -rich air from Asia compared to
the location of measurement. Of all CH2 Cl2 -poor air parcels those of CH2 Cl2 -poor air from Central America is the addi-
transported via this pathway, only 25 % (N = 23) were ob- tional uplift by the ASMA following the convection within
served in the LS with transport times from the BL to the the ASM (e.g., Müller et al., 2016; Brunamonti et al., 2018;
location of measurement in the LS ranging between 5 and Vogel et al., 2019; von Hobe et al., 2021). The slow upward
9 weeks (Table 2). spiraling dynamics within the ASMA also contributes to the
Some trajectories lifted up above the region of Central longer transport time from the boundary layer to the loca-
America eventually follow the subtropical jet stream east- tion of the measurement of CH2 Cl2 -rich air compared to that
wards around the globe before entering the extratropics. This of CH2 Cl2 -poor air. Another aspect adding to the different
https://doi.org/10.5194/acp-22-2049-2022 Atmos. Chem. Phys., 22, 2049–2077, 2022You can also read