Exploring dimethyl sulfide (DMS) oxidation and implications for global aerosol radiative forcing
←
→
Page content transcription
If your browser does not render page correctly, please read the page content below

Research article
Atmos. Chem. Phys., 22, 1549–1573, 2022
https://doi.org/10.5194/acp-22-1549-2022
© Author(s) 2022. This work is distributed under
the Creative Commons Attribution 4.0 License.

                Exploring dimethyl sulfide (DMS) oxidation and
                implications for global aerosol radiative forcing
               Ka Ming Fung1 , Colette L. Heald1,2 , Jesse H. Kroll1 , Siyuan Wang3,4 , Duseong S. Jo5 ,
        Andrew Gettelman5 , Zheng Lu6 , Xiaohong Liu6 , Rahul A. Zaveri7 , Eric C. Apel5 , Donald R. Blake8 ,
      Jose-Luis Jimenez3,9 , Pedro Campuzano-Jost3,9 , Patrick R. Veres4 , Timothy S. Bates10 , John E. Shilling7 ,
                                            and Maria Zawadowicz11
               1 Department    of Civil and Environmental Engineering, Massachusetts Institute of Technology,
                                                     Cambridge, MA, USA
             2 Department of Earth, Atmospheric, and Planetary Sciences, Massachusetts Institute of Technology,

                                                     Cambridge, MA, USA
               3 Cooperative Institute for Research in Environmental Sciences, University of Colorado Boulder,

                                                       Boulder, CO, USA
          4 Chemical Sciences Laboratory, National Oceanic and Atmospheric Administration, Boulder, CO, USA
                               5 Atmospheric Chemistry Observations and Modeling Laboratory,

                                 National Center for Atmospheric Research, Boulder, CO, USA
                   6 Department of Atmospheric Sciences, Texas A&M University, College Station, TX, USA
                 7 Atmospheric Sciences and Global Change Division, Pacific Northwest National Laboratory,

                                                      Richland, WA, USA
                          8 Department of Chemistry, University of California Irvine, Irvine, CA, USA
                        9 Department of Chemistry, University of Colorado Boulder, Boulder, CO, USA
            10 The Cooperative Institute for Climate, Ocean, and Ecosystem Studies, College of the Environment,

                                          University of Washington, Seattle, WA, USA
          11 Environmental and Climate Sciences Department, Brookhaven National Laboratory, Upton, NY, USA

             Correspondence: Ka Ming Fung (kamingfung@mit.edu) and Colette L. Heald (heald@mit.edu)

                              Received: 11 September 2021 – Discussion started: 27 September 2021
                     Revised: 1 December 2021 – Accepted: 17 December 2021 – Published: 1 February 2022

      Abstract. Aerosol indirect radiative forcing (IRF), which characterizes how aerosols alter cloud formation and
      properties, is very sensitive to the preindustrial (PI) aerosol burden. Dimethyl sulfide (DMS), emitted from the
      ocean, is a dominant natural precursor of non-sea-salt sulfate in the PI and pristine present-day (PD) atmo-
      spheres. Here we revisit the atmospheric oxidation chemistry of DMS, particularly under pristine conditions,
      and its impact on aerosol IRF. Based on previous laboratory studies, we expand the simplified DMS oxidation
      scheme used in the Community Atmospheric Model version 6 with chemistry (CAM6-chem) to capture the
      OH-addition pathway and the H-abstraction pathway and the associated isomerization branch. These additional
      oxidation channels of DMS produce several stable intermediate compounds, e.g., methanesulfonic acid (MSA)
      and hydroperoxymethyl thioformate (HPMTF), delay the formation of sulfate, and, hence, alter the spatial distri-
      bution of sulfate aerosol and radiative impacts. The expanded scheme improves the agreement between modeled
      and observed concentrations of DMS, MSA, HPMTF, and sulfate over most marine regions, based on the NASA
      Atmospheric Tomography (ATom), the Aerosol and Cloud Experiments in the Eastern North Atlantic (ACE-
      ENA), and the Variability of the American Monsoon Systems (VAMOS) Ocean-Cloud-Atmosphere-Land Study
      Regional Experiment (VOCALS-REx) measurements. We find that the global HPMTF burden and the burden of
      sulfate produced from DMS oxidation are relatively insensitive to the assumed isomerization rate, but the burden
      of HPMTF is very sensitive to a potential additional cloud loss. We find that global sulfate burden under PI

Published by Copernicus Publications on behalf of the European Geosciences Union.
1550                         K. M. Fung et al.: Exploring DMS oxidation and implications for global aerosol radiative forcing

       and PD emissions increase to 412 Gg S (+29 %) and 582 Gg S (+8.8 %), respectively, compared to the standard
       simplified DMS oxidation scheme. The resulting annual mean global PD direct radiative effect of DMS-derived
       sulfate alone is −0.11 W m−2 . The enhanced PI sulfate produced via the gas-phase chemistry updates alone
       dampens the aerosol IRF as anticipated (−2.2 W m−2 in standard versus −1.7 W m−2 , with updated gas-phase
       chemistry). However, high clouds in the tropics and low clouds in the Southern Ocean appear particularly sensi-
       tive to the additional aqueous-phase pathways, counteracting this change (−2.3 W m−2 ). This study confirms the
       sensitivity of aerosol IRF to the PI aerosol loading and the need to better understand the processes controlling
       aerosol formation in the PI atmosphere and the cloud response to these changes.

1   Introduction                                                        Global/regional models often simplify the DMS oxida-
                                                                     tion processes for the sake of computational costs. For ex-
The IPCC AR5 (Fifth Assessment Report of the United                  ample, the Community Atmosphere Model with chemistry
Nations Intergovernmental Panel on Climate Change;                   (CAM-chem) includes only the oxidation of DMS by OH
Myhre et al., 2013) and the recent preliminary release of            and NO3 radicals, directly producing SO2 , which further ox-
AR6 (Sixth Assessment Report; https://www.ipcc.ch/report/            idizes to produce sulfate (Emmons et al., 2020; Lamarque et
sixth-assessment-report-cycle/, last access: 30 November             al., 2012). This simplification ignores some potentially im-
2021) indicate that atmospheric aerosol particles are a domi-        portant reaction intermediates and pathways. For instance,
nant source of uncertainty in global climate forcing. Aerosols       previous studies suggest that BrO contributes up to 30 % of
interact with incoming and outgoing radiation directly (via          the DMS sink in the remote MBL (Boucher et al., 2003; Brei-
scattering and absorption) and indirectly (via changing cloud        der et al., 2010; von Glasow and Crutzen, 2004; Khan et al.,
properties and lifetime). In particular, the aerosol indirect ra-    2016). MSA has been found to form efficiently via the mul-
diative forcing (IRF) via interactions with clouds is driven by      tiphase OH-addition DMS oxidation pathway followed by a
the fractional enhancement of aerosol burden from a prein-           reaction with OH(aq) to form sulfate aerosol in the MBL (von
dustrial (PI; 1850) atmosphere to a present-day (PD; 2000)           Glasow and Crutzen, 2004; Milne et al., 1989; Zhu et al.,
one, with a cleaner PI atmosphere producing a larger IRF             2006). Recently, both theoretical and laboratory studies have
(Menon et al., 2002). Carslaw et al. (2013) confirm that the         proposed that a pristine environment favors the H-abstraction
estimated uncertainty in aerosol IRF is dominated by uncer-          reaction when DMS is oxidized by OH, generating methylth-
tainty in natural aerosols. It is, therefore, critically important   iomethylperoxy radicals (MSP; CH3 SCH2 OO), which fur-
to accurately determine the formation of natural aerosols and        ther undergo a series of rapid intramolecular H-shift isomer-
their radiative impacts in both PD and PI atmosphere.                ization reactions, yielding a stable intermediate hydroperox-
   Marine dimethyl sulfide (DMS; CH3 SCH3 ) accounts for             ymethyl thioformate (HPMTF; HOOCH2 SCHO; Wu et al.,
> 50 % of natural gas-phase sulfur emissions (Chin et al.,           2015; Berndt et al., 2019). Recent in situ measurements re-
1996; Andreae, 1990; Kilgour et al., 2021). Once emitted             port HPMTF concentrations that are, on average, 50 % of
into the troposphere, oxidation of DMS takes place within            DMS concentrations in the MBL during the day, but can
1–2 d, forming other sulfur-containing products, such as             exceed DMS concentrations at times, confirming the impor-
sulfuric acid (H2 SO4 ) and methane sulfonic acid (MSA;              tance of the isomerization branch for capturing the fate of
CH3 SO3 H; Boucher et al., 2003; Breider et al., 2010). These        oxidized DMS (Veres et al., 2020; Vermeuel et al., 2020).
gaseous products can facilitate the formation of new particles          The lifetimes of stable intermediates from DMS oxidation
and cloud condensation nuclei (CCN), especially in the ma-           can be up to days. As a result, these intermediates can delay
rine boundary layer (MBL; Charlson et al., 1987; von Glasow          the formation of DMS-derived sulfate, affecting not only the
and Crutzen, 2004; Kulmala et al., 2000). Sulfate and MSA            spatial distribution of sulfate aerosols but also the effective
formed in the particle phase can directly impact the size dis-       sulfate yield from DMS as unreacted sulfate precursors may
tribution of aerosols and alter cloud microphysics (Kaufman          be subject to physical removal through wet or dry deposition.
and Tanré, 1994). DMS is estimated to be responsible for             Thus, neglecting these intermediates could lead to misrepre-
up to 11 %–18 % of global sulfate burden in PD (Yang et al.,         sentation of the spatial distribution of sulfate aerosol loading
2017; Gondwe et al., 2003) and > 48 % of atmospheric sulfur          and limit our ability to accurately determine aerosol radiative
burden in PI (Tilmes et al., 2019). Though the crucial role of       forcing.
DMS oxidation as a source of natural aerosols has been ac-              Here, we implement a more detailed multigenerational and
knowledged for decades, its oxidation mechanisms are still           multiphase chemical mechanism to describe DMS oxidation
not well understood (Barnes et al., 2006; Hoffmann et al.,           within the Community Atmosphere Model version 6 with
2016).                                                               chemistry (CAM6-chem; Emmons et al., 2020) – the atmo-
                                                                     sphere component of the Community Earth System Model

Atmos. Chem. Phys., 22, 1549–1573, 2022                                               https://doi.org/10.5194/acp-22-1549-2022
K. M. Fung et al.: Exploring DMS oxidation and implications for global aerosol radiative forcing                              1551

version 2.1 (CESM2.1; Danabasoglu et al., 2020). The ex-           metric standard deviations and a varying mode dry or wet
panded chemistry captures the formation of stable intermedi-       radius, depending on the particle number and changes in
ates such as MSA and HPMTF alongside SO2 . We perform              total dry or wet volume (Liu et al., 2012). MAM4 defines
multiple sensitivity tests to investigate how the uncertainty in   the cut-off size ranges of 0.015–0.053 µm for aerosol in the
modeling the newly confirmed HPMTF could influence the             Aitken mode, 0.058–0.27 µm for the accumulation mode, and
DMS chemistry and the resulting atmospheric sulfate burden.        0.80–3.65 µm for the coarse mode. Dynamic partitioning of
The model results are compared against an array of in situ         H2 SO4 , HNO3 , HCl, and NH3 to each mode, related particle-
observations. Finally, we examine how the natural aerosol          phase thermodynamics, and water content and pH of intersti-
background from DMS oxidation simulated with the modi-             tial aerosols are computed using the MOSAIC module (Za-
fied model impacts estimates of aerosol radiative forcing.         veri et al., 2008, 2021; Lu et al., 2021). Further details de-
                                                                   scribing the dry and wet deposition, aerosol optical proper-
2     Model description                                            ties, radiative transfer, and aerosol–cloud microphysics are
                                                                   described in the Supplement; these processes are all based
CESM2.1 consists of model components that quantitatively           on the standard CAM6-chem.
describe the atmosphere, land, sea ice, land ice, rivers, and         We perform four sets of simulations for the PD and PI
ocean (Danabasoglu et al., 2020). Fluxes and state variables       atmospheric conditions with the standard and our modified
are exchanged through a coupler to describe the co-evolution       chemical schemes. Details of the runs are tabulated in Ta-
of these Earth system components. Here, we run with a cou-         ble 1. Each run is performed for 10 years, with the first year
pled atmosphere (CAM6-chem) and land (Community Land               as spin-up, and the averages over the latter 9 years are pre-
Model – CLM5) model and use prescribed data for the re-            sented in our results.
maining Earth system components. In particular, sea sur-
face temperature (SST) and sea ice conditions (Hurrell et          2.2   Emissions
al., 2008), as well as the mixing ratios of greenhouse gases
                                                                   DMS emissions from the ocean (EDMS ) are simulated via
(Meinshausen et al., 2017), are all fixed to present-day condi-
                                                                   the Online Air–Sea Interface for Soluble Species (OASISS)
tions. Following similar practices in previous studies (Gettel-
                                                                   model developed for CAM6-chem, which has been vali-
man, 2015; Gettelman et al., 2019), this configuration aims
                                                                   dated against observations for acetaldehyde (S. Wang et al.,
to constrain the potential environmental feedbacks, such that
                                                                   2019a), acetone (Wang et al., 2020), and organohalogens
the aerosol effects (on atmospheric composition, cloud, and
                                                                   (e.g., CHBr3 and CH2 Br2 ; S. Wang et al., 2019b). OASISS
radiation) are due to the change in emissions and chemistry
                                                                   employs a two-layer framework that considers transfer ve-
only.
                                                                   locities both through air and through water (kair and kwater )
                                                                   as follows (Johnson, 2010):
2.1    Model configuration

                                                                                              [DMS]air
In this work, CAM6-chem is run in an online configura-             EDMS = k [DMS]water −                 (1 − fcice )       (1)
tion with free dynamics at 1.9◦ × 2.5◦ (latitude by longi-                                     HDMS
                                                                                    1 −1

tude) horizontal resolution and 32 vertical layers (surface to              1
3 hPa or ∼ 45 km), with a model time step of 30 min. The de-       k=            +        ,                                 (2)
                                                                          kwater kair
fault chemistry scheme is the Model for Ozone and Related
Chemical Tracers with representations of both tropospheric         where k (meters per second; hereafter m s−1 ) is the over-
and stratospheric chemistry (MOZART-TS1; Emmons et al.,            all transfer velocity. The surface seawater concentration,
2020), with a volatility basis set (VBS) scheme specifically       [DMS]water (nanomolar; hereafter nM) is prescribed to fol-
for the gas-phase intermediate semi-volatile organic precur-       low the Lana et al. (2011) sea surface DMS climatology in
sors of secondary organic aerosols (SOAs; Tilmes et al.,           both our PI and PD simulations. DMS mixing ratio in the
2019). The DMS chemistry is described in further detail in         air, [DMS]air , and its Henry’s law constant are from CAM6-
Sect. 2.3. Aerosols are simulated using the Modal Aerosol          chem. kair is based on the NOAA COARE algorithm (Jef-
Model with four modes (MAM4; Liu et al., 2016) cou-                fery et al., 2010), which is a function of surface wind speed,
pled with the Model for Simulating Aerosol Interactions and        with an additional adjustment for the diffusivity of still air
Chemistry (MOSAIC; Zaveri et al., 2008, 2021; Lu et al.,           (Mackay and Yeun, 1983). kwater is based on Nightingale
2021), for sulfate (SO2−                   +
                      4 ), ammonium (NH4 ), nitrate (NO3 ),
                                                           −
                                                                   et al. (2000), which considers sea surface temperature and
primary organic matter (POM), SOA, sea salt, and mineral           salinity. Last, fcice is the fraction of sea ice coverage in each
dust. MAM4 classifies aerosols into three size-dependent           grid cell, such that DMS emission is suppressed from sea-
modes (Aitken, accumulation, and coarse), with an addi-            ice-covered surfaces.
tional primary carbon mode for handling the aging of fine             On average, the global annual total marine EDMS is
POM and black carbon (BC). Size distributions of aerosols          21.5 Tg S yr−1 in [STD_2000]. Meteorological variability
in each mode are assumed to be lognormal, with fixed geo-          has little impact on the interannual variability of emissions

https://doi.org/10.5194/acp-22-1549-2022                                           Atmos. Chem. Phys., 22, 1549–1573, 2022
1552                          K. M. Fung et al.: Exploring DMS oxidation and implications for global aerosol radiative forcing

Table 1. Configuration of key simulation cases in this study.

         Case alias          Anthropogenic      Chemistry
                             emissions
         STD_2000            2000 level         TS1 with the model default DMS oxidation reactions in Table 3.
         STD_1850            1850 level
         MOD_2000            2000 level         TS1 with the new gas-phase and aqueous-phase reactions in Tables 4, 5, 6, and 7.
         MOD_1850            1850 level
         MOD_RE_2000         2000 level         TS1 with the new gas-phase and aqueous-phase reactions in Tables 4, 5, 6, and 7,
         MOD_RE_1850         1850 level         together with artificial rapid conversion of MSA to sulfate for assessing the
                                                radiative effect of MSA.
         GAS_RE_2000         2000 level         TS1 with the new gas-phase reactions in Tables 4, 5, and 6, together with artificial
         GAS_RE_1850         1850 level         rapid conversion of MSA to sulfate for assessing the radiative effect of MSA.

(< ±4 %). Our EDMS is higher than the 18 Tg S yr−1 from                  as those in the standard CMIP6 simulations (Emmons et al.,
the model default inventory (Kettle and Andreae, 2000) but               2020).
lower than the 28 Tg S yr−1 reported in the original model
study by Lana et al. (2011) and within the range of 11–                  2.3     Expanded DMS oxidation scheme
28 Tg S yr−1 simulated by Goddard Earth Observing System
(GEOS)-Chem, TOMCAT-GLOMAP software, and other                           The standard CAM6-chem contains three gas-phase DMS
models (Lennartz et al., 2015; Spracklen et al., 2005; Hezel et          oxidation reactions (Table 3; Barth et al., 2000; Emmons
al., 2011). The estimation of EDMS is sensitive to the choice            et al., 2010). These reactions simplify the DMS oxidation
of sea surface DMS climatology; Chen et al. (2018) show                  chemistry by treating only gas-phase reactions and produc-
that emissions vary from 18 Tg S yr−1 , with the Kettle et               ing SO2 directly, neglecting the role of multiphase chemistry
al. (1999) DMS climatology, to 22 Tg S yr−1 , with the Lana              and other key chemical products and intermediates found in
et al. (2011) DMS climatology.                                           chamber and field studies (e.g., Hoffmann et al., 2016; Wu et
   In all simulations, anthropogenic emissions are from the              al., 2015). We note that the second reaction does not conserve
Community Emissions Data System (CEDS; Hoesly et al.,                    sulfur.
2018), and biomass burning emissions are from the CMIP6                     To improve the representation of DMS oxidation in
inventory (van Marle et al., 2017). Biogenic emissions are               CAM6-chem, we add a suite of new reactions that describe
estimated online from CLM5, using the Model of Emissions                 the chemical evolution from DMS to SO2 and, ultimately,
of Gases and Aerosols from Nature (MEGAN) version 2.1                    sulfate via the H-abstraction and OH-addition pathways.
(Guenther et al., 2012). CAM6-chem assumes that 2.5 % by                 Fig. 1 illustrates the expanded chemistry schematically. Our
molar of sulfur emitted from the energy and industry sector              additions are based on recent laboratory studies and field ob-
is already in the form of primary sulfate aerosols (in accu-             servations and are discussed in detail in what follows.
mulation mode). Volcanic emissions are fixed at the same
level in both PI and PD simulations. Emissions from contin-              2.3.1    The H-abstraction pathway
uously outgassing volcanoes are constant (97.5 % as SO2 and
2.5 % emitted as primary sulfate aerosols) based on the GEIA             The H-abstraction reactions of DMS with OH or Cl gener-
(Global Emissions InitiAtive) inventory (Andres and Kasg-                ate MSP, which then either reacts with NO or RO2 , forming
noc, 1998). We use time-averaged (1995–2005) eruptive vol-               MSA and H2 SO4 , or undergoes consecutive intramolecular
canic emissions of SO2 to impose an average forcing from                 H-shift reactions (isomerization), yielding HPMTF and SO2 .
volcanic eruptions reaching the stratosphere, derived from               Hence, we group these two serial reactions into two branches,
the database of Volcanic Emissions for Earth System Mod-                 namely the MSA-producing branch and the isomerization
els (VolcanEESM), version 3.10 (Neely and Schmidt, 2016).                branch. The reactions of the MSA-producing branch are tab-
SO2 emissions from aircraft (up to ∼ 15 km) and SO2 and                  ulated in Table 4. These reactions are largely based on Hoff-
primary sulfate emissions from volcanoes (up to ∼ 30 km)                 mann et al. (2016), who combined the chemical mechanism
are considered as elevated emissions, while other sources of             from the Master Chemical Mechanism version 3 (MCM v3;
SO2 emissions and oceanic DMS emissions are at the sur-                  Saunders et al., 2003) and other laboratory and computa-
face. A breakdown of SO2 emissions in this study is summa-               tional studies. The reactions in the isomerization branch are
rized in Table 2. We use the same emissions for other species            detailed in Table 5. Here, we use the only currently available
                                                                         temperature-dependent isomerization rate of MSP (kiso ) of
                                                                         0.04 s−1 at 293 K, as estimated by Veres et al. (2020). This

Atmos. Chem. Phys., 22, 1549–1573, 2022                                                     https://doi.org/10.5194/acp-22-1549-2022
K. M. Fung et al.: Exploring DMS oxidation and implications for global aerosol radiative forcing                                                     1553

Table 2. SO2 emissions in this study.

                     Sources                                                Annual total (Tg S)          References
                                                                                 PI             PD
                     Total anthropogenic emission                              1.14            54.2
                     Agriculture, solvents, and human waste                 < 0.01              0.2      Hoesly et al. (2018)
                     Residential and transportation                            0.4              5.2      Hoesly et al. (2018)
                     Shipping                                                 0.04              4.3      Hoesly et al. (2018)
                     Energy and industry                                       0.7             44.4      Hoesly et al. (2018)
                     Aircraft                                                    –              0.1      Hoesly et al. (2018)
                     Total natural emission                                    22.9            22.9
                     Biomass burning                                            1.0             1.0      Van Marle et al. (2017)
                     Volcanoes                                                 21.9            21.9      Andres and Kasgnoc (1998); Carn
                                                                                                         et al. (2017); Mills et al. (2016)

Table 3. The three DMS oxidation reactions in the standard CAM6-chem.

                Gas-phase reactions                                               k298                          −Ea /R        References
                                                                                  (cm3 molec.−1 s−1 )              (K)
                DMS + OH → SO2 (H abstraction)                                    9.60 × 10⁻¹²                    −234        Emmons et al. (2010)
                DMS + OH → 0.5SO2 + 0.5HO2 (OH addition)                          See note∗                                   Emmons et al. (2010)
                DMS + NO3 → SO2 + HNO3                                            1.90 × 10⁻¹³                       520      Emmons et al. (2010)
              ∗ k(T , [O ], [M]) = 1.7 × 10−42 e(7810/T ) × 0.21[M]/(1 + 5.5 × 10⁻³¹ e(7460/T ) × 0.21[M]) (cm3 molec.−1 s−1 ).
                        2

new kiso is slower than the previously determined values of                             2.3.2      Gas-phase reactions of the OH-addition pathway
0.23 s−1 at 295 K (Berndt et al., 2019) to 2.1 s−1 at 293 K
(Wu et al., 2015), delaying the formation of HPMTF. A re-                               Table 6 summarizes the new gas-phase reactions in the OH-
cent chamber experiment estimates an intermediate kiso value                            addition pathway of DMS oxidation. We update the gas-
of 0.12 s−1 at 293 K (Ye et al., 2021). We investigate the im-                          phase reactions in the model to consider the oxidation of
pact of the uncertainty in kiso in Sect. 3. The only chemi-                             DMS by not only OH and NO3 but also BrO, O3 , and Cl, as
cal loss process of HPMTF in our model is oxidation by                                  recommended or reported in previous studies (e.g., Barnes
OH at a rate of 1.11 × 10⁻¹¹ cm3 molec.−1 s−1 , as recom-                               et al., 2006; Hoffmann et al., 2016; Chen et al., 2018).
mended by Vermeuel et al. (2020), which is an experimen-                                The new reactions producing dimethyl sulfoxide (DMSO;
tally determined OH-oxidation rate of methyl thioformate                                CH3 SCH3 O), methanesulfinic acid (MSIA; CH3 SOOH), and
(MTF; CH3 SCHO; a structurally similar proxy to HPMTF)                                  MSA intermediates are added to the model as new advected
by Patroescu et al. (1996). Oxidizing HPMTF at this rate                                chemical tracers which undergo not only chemical produc-
was shown to match better with recent measurements (Ver-                                tion and loss but also transport and deposition. MSA and SO2
meuel et al., 2020) than the 1.4 × 10⁻¹² cm3 molec.−1 s−1                               are terminating products of these new gas-phase OH-addition
suggested by a computational study (Wu et al., 2015). Re-                               pathway reactions, which is consistent with various model-
cent studies (Veres et al., 2020; Vermeuel et al., 2020) sug-                           ing studies (e.g., Pham et al., 1995; Spracklen et al., 2005;
gest that cloud uptake is another important sink of HPMTF;                              Chen et al., 2018). All oxidants (OH, O3 , H2 O2 , BrO, and
we include a series of sensitivity tests based on [MOD_2000]                            HOBr) are simulated online by the standard gas-phase chem-
to address the uncertainty in the HPMTF budget arising from                             istry scheme of CAM6-chem.
this potential loss process. Vermeuel et al. (2020) report that
using a cloud uptake rate (kHPMTF+cloud ) at 5 × 10⁻³ s−1 re-
                                                                                        2.3.3      Aqueous-phase reactions of the OH-addition
sults in a better match of the diurnal variability in HPMTF
                                                                                                   pathway
with their local measurements. Due to the lack of detailed
measurement, we use this kHPMTF+cloud and a substantially                               We also introduce new aqueous-phase reactions of the OH-
slower hypothetical value at 5 × 10⁻⁵ s−1 for our sensitivity                           addition pathway, as shown in Table 7.
tests.                                                                                     Following a similar treatment employed by the Commu-
                                                                                        nity Multiscale Air Quality (CMAQ) model version 5.1 (Fa-

https://doi.org/10.5194/acp-22-1549-2022                                                                      Atmos. Chem. Phys., 22, 1549–1573, 2022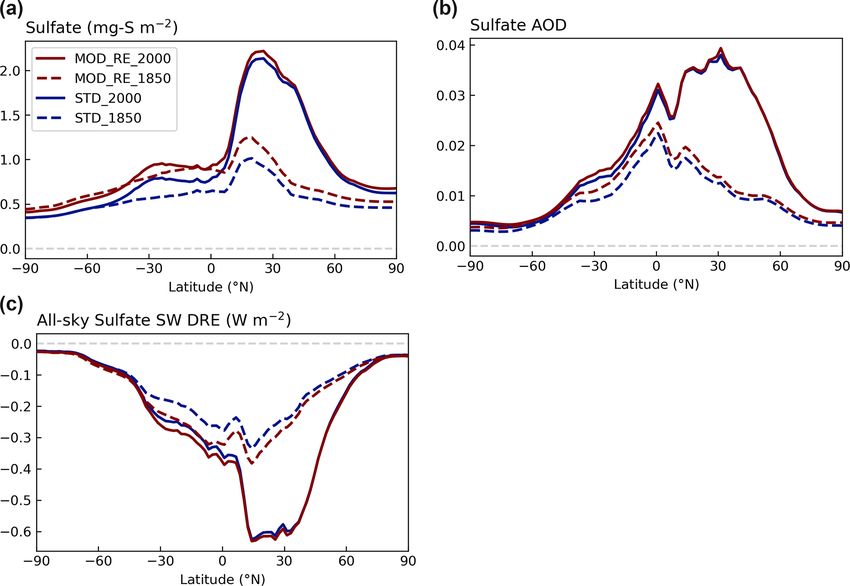
1554                          K. M. Fung et al.: Exploring DMS oxidation and implications for global aerosol radiative forcing

Figure 1. A schematic summary of our expanded atmospheric chemistry of DMS oxidation in CAM6-chem (Tables 4, 5, 6, and 7). Key
relatively long-lived species (DMS, MSA, HPMTF, SO2 , and sulfate), with lifetimes of > 0.5 d, are highlighted in bold. The blue shadings
denote species and reactions in the aqueous phase in interstitial aerosols and cloud droplets. DMS (highlighted in green) can undergo O-atom
addition (rightward path) or H abstraction (upper paths). The H-abstraction channel further diverts into the isomerization branch (top path)
and the MSA-producing branch. SO2 is the dominant product of most gas-phase pathways, while MSA is formed mainly via the aqueous-
phase oxidation of DMS. Oxidation of SO2 to sulfate or sulfuric acid is handled by the CAM6-chem standard chemistry. The resultant
particulate MSA and sulfate (highlighted in red) are key species with important radiative impacts.

Table 4. Summary of the MSA-producing branch of the H-abstraction pathway in the DMS chemistry implemented into CAM6-chem.

            Gas-phase reactions                                                     k298       −Ea /R    References
                                                                      (cm3 molec.−1 s−1 )         (K)
            DMS + OH → MSP (CH3 SCH2 OO)                                     1.12 × 10⁻¹¹        −250    Saunders et al. (2003)
            DMS + Cl → 0.45MSP + 0.55(CH3 )2 S(Cl) + 0.45HCl                 3.40 × 10⁻¹⁰                IUPAC
            (CH3 )2 S(Cl) → DMS + Cl                                            9.00 × 101               Enami et al. (2004)
            MSP + NO → CH3 SCH2 (O) + NO2                                    4.90 × 10⁻¹²          260   Saunders et al. (2003)
            MSP + RO2 → CH3 SCH2 (O) + O2                                    3.74 × 10⁻¹²                Saunders et al. (2003)
            CH3 SCH2 (O) → CH3 S + CH2 O                                        1.00 × 10⁶               Saunders et al. (2003)
            CH3 S + O3 → CH3 S(O) + O2                                       1.15 × 10⁻¹²          430   Saunders et al. (2003)
            CH3 S + O2 → CH3 S(OO)                                           1.20 × 10⁻¹⁶         1580   Saunders et al. (2003)
            CH3 S(O) + O3 → CH3 (O2 ) + SO2                                  4.00 × 10⁻¹³                Saunders et al. (2003)
            CH3 S(OO) → CH3 (O2 ) + SO2                                        5.60 × 10¹⁶     −10 870   Saunders et al. (2003)
            CH3 S(OO) → CH3 SO2                                                       1.00               Saunders et al. (2003)
            CH3 SO2 + O3 → CH3 SO3 + O2                                      3.00 × 10⁻¹³                Saunders et al. (2003)
            CH3 SO2 → CH3 (O2 ) + SO2                                          5.00 × 10¹³      −9673    Saunders et al. (2003)
            CH3 SO3 + HO2 → MSA + O2                                         5.00 × 10⁻¹¹                Saunders et al. (2003)
            CH3 SO3 → CH3 (O2 ) + H2 SO4                                       5.00 × 10¹³      −9946    Saunders et al. (2003)

Atmos. Chem. Phys., 22, 1549–1573, 2022                                                      https://doi.org/10.5194/acp-22-1549-2022
K. M. Fung et al.: Exploring DMS oxidation and implications for global aerosol radiative forcing                                                                   1555

Table 5. Summary of the isomerization branch of the H-abstraction pathway in the DMS chemistry implemented into CAM6-chem.

         Gas-phase reactions                                                              k298                            −Ea /R        References
                                                                                          (cm3 molec.−1 s−1 )                (K)
         MSP → OOCH2 SCH2 OOH                                                             See notea                                     Veres et al. (2020)
         OOCH2 SCH2 OOH → HPMTF (HOOCH2 SCHO) + OH                                        See noteb                                     Veres et al. (2020)
         OOCH2 SCH2 OOH + NO → HOOCH2 SCH2 O + NO2                                        4.90 × 10⁻¹²                         260      Saunders et al. (2003)
         HOOCH2 SCH2 O → HOOCH2 S + CH2 O                                                 1.00 × 10⁶                                    Saunders et al. (2003)
         OOCH2 SCH2 OOH + HO2 → HOOCH2 SCH2 OOH + O2                                      1.13 × 10⁻¹³                       1300       Saunders et al. (2003)
         HPMTF + OH → HOOCH2 SCO + H2 O                                                   1.11 × 10⁻¹¹                                  Patroescu et al. (1996),
                                                                                                                                        Vermeuel et al. (2020)
         HOOCH2 SCO → HOOCH2 S + CO                                                       9.20 × 10⁹                     −505.4         Wu et al. (2015)
         HOOCH2 SCO → OH + CH2 O + OCS                                                    1.60 × 10⁷                    −1468.6         Wu et al. (2015)
         HOOCH2 S + O3 → HOOCH2 SO + O2                                                   1.15 × 10⁻¹²                      430         Saunders et al. (2003)
         HOOCH2 S + NO2 → HOOCH2 SO + NO                                                  6.00 × 10⁻¹¹                      240         Saunders et al. (2003)
         HOOCH2 SO + O3 → SO2 + CH2 O + OH + O2                                           4.00 × 10⁻¹³                                  Saunders et al. (2003)
         HOOCH2 SO + NO2 → SO2 + CH2 O + OH + NO                                          1.20 × 10⁻¹¹                                  Saunders et al. (2003)
       a 2.24 ×10¹¹ exp(−9.8 × 10³ /T ) exp(1.03 × 10⁸ /T 3 ), b 6.09 ×10¹¹ exp(−9.5 × 10³ /T ) exp(1.1 × 10⁸ /T 3 ), where T is air temperature.

Table 6. Gas-phase DMS oxidation (OH-addition pathway) implemented into CAM6-chem in this study.

          Gas-phase reactions                                                          k298                           −Ea /R         References
                                                                                       (cm3 molec.−1 s−1 )               (K)
          DMS + OH → 0.6SO2 + 0.4DMSO + CH3 O2                                         See footnote∗                          –      Burkholder et al. (2015),
                                                                                                                                     Pham et al. (1995)
          DMS + NO3 → SO2 + HNO3 + CH3 O2 + CH2 O                                      1.13 × 10⁻¹²                        530       Burkholder et al. (2015)
          DMS + BrO → DMSO + Br                                                        3.39 × 10⁻¹³                        950       Burkholder et al. (2015)
          DMS + O3 → SO2                                                               1.00 × 10⁻¹⁹                          0       Burkholder et al. (2015)
          DMS + Cl → 0.5SO2 + 0.5DMSO + 0.5HCl + 0.5ClO                                3.40 × 10⁻¹⁰                          0       Burkholder et al. (2015)
          DMSO + OH → 0.95MSIA + 0.05SO2                                               8.94 × 10⁻¹¹                        800       Burkholder et al. (2015)
          MSIA + OH → 0.9SO2 + 0.1MSA                                                  9.00 × 10⁻¹¹                          0       Burkholder et al. (2015)
          MSIA + O3 → MSA                                                              2.00 × 10⁻¹⁸                          0       Lucas (2002)
        ∗ k(T , [O ], [M]) = 8.2 × 10−39 [O ]e(5376/T ) /(1 + 1.05 × 10⁻⁵ ([O ]/[M])e(3644/T ) ) (cm3 molec.−1 s−1 ).
                  2                        2                                 2

hey et al., 2017), we calculate, for each species involved in                              aqueous-to-gas phase transfer coefficients. kt (per second)
the new aqueous-phase reactions, the phase transfer equa-                                  is its base phase transfer coefficient. H (molar per stan-
tions for gas-aqueous partitioning, as follows:                                            dard atmosphere; hereafter M atm−1 ) is its effective Henry’s
                                                                                           law constant. r (centimeters) is its mean particle radius,
dCg
     = −k(g)→(a) Cg + k(a)→(g) Ca                                                          and Dg is the gas-phase diffusion coefficient (assumed at
 dt                                                                                        0.1 cm2 s−1 ; here following Dentener and Crutzen, 1993).

                             kt                                                            c (centimeters per second) is its thermal speed, and α is
     = − (kt LWC) Cg +             Ca                                           (3)
                           HRT                                                             its mass accommodation coefficient. Values of H and α
dCa                                                                                        for DMS, DMSO, MSIA, and MSA are given in Table 8.
     = k(g)→(a) Cg − k(a)→(g) Ca                                                           LWC (cubic centimeter of water per cubic centimeter of air;
 dt

                          kt
                                                                                          hereafter cm3 -water (cm3 -air)−1 ) is liquid water content of
     = (kt LWC) Cg −             Ca                                             (4)        interstitial aerosol determined by MOSAIC (Zaveri et al.,
                         HRT
      2           −1                                                                     2021) or cloud liquid water content calculated by CAM6;
       r        4r                                                                         R = 0.082 (liter standard atmosphere per Kelvin per mole;
kt =        +          ,                                                        (5)
      3Dg 3cα                                                                              hereafter L atm K−1 mol−1 ) is the universal gas constant, and
                                                                                           T (Kelvin) is air temperature.
where Cg and Ca are the gas-phase and aqueous-phase con-
centration of a species involving in reactions in Table 7.
k(g)→(a) and k(a)→(g) (per second) are its gas-to-aqueous and

https://doi.org/10.5194/acp-22-1549-2022                                                                         Atmos. Chem. Phys., 22, 1549–1573, 2022
1556                             K. M. Fung et al.: Exploring DMS oxidation and implications for global aerosol radiative forcing

Table 7. Aqueous-phase DMS oxidation (OH-addition pathway) implemented into CAM6-chem in this study.

                  Aqueous-phase reactions                                           k298    −Ea /R     References
                                                                               (M−1 s−1 )      (K)
                  DMS(aq) + O3(aq) → DMSO(aq) + O2(aq)                         8.61 × 10⁸   −2600      Gershenzon et al. (2001)
                  DMSO(aq) + OH(aq) → MSIA(aq)                                 6.63 × 10⁹   −1270      Zhu et al. (2003)
                  MSIA(aq) + OH(aq) → MSA(aq)                                  6.00 × 10⁹       0      Sehested and Holcman (1996)
                  MSI−
                     (aq) + OH(aq) → MSA(aq)                                  1.20 × 10¹⁰       0      Bardouki et al. (2003)
                  MSIA(aq) + O3(aq) → MSA(aq)                                  3.50 × 10⁷       0      Hoffmann et al. (2016)
                  MSI−
                     (aq) + O3(aq) → MSA(aq)                                   2.00 × 10⁶       0      Flyunt et al. (2001)
                  MSA(aq) + OH(aq) → SO2−
                                       4(aq)                                   1.50 × 10⁷         0    Hoffmann et al. (2016)
                                      2−
                  MS−
                    (aq) + OH(aq) → SO4(aq)                                    1.29 × 10⁷   −2630      Zhu et al. (2003)

Table 8. Summary of parameters of DMS and its oxidation intermediates used in this study.

                                 H298 (Henry’s law              −E/R (Heat of               K1 (acid          α (mass        molar mass
                               coefficients at 298 K)            dissolution for        dissociation   accommodation         (g mol−1 )a
                                       (M atm−1 )a,b           H298 ) / R (K)a,b      constant) (M)b      coefficient)c
                 DMS                                 0.54                      3460               –                 0.001       62.1324
                 DMSO                                 107                      2580               –                    0.1        78.13
                 MSIA                                 108                      1760           −2.28                    0.1        80.11
                 MSA                                  109                      1760            1.86                    0.1          96.1
               a Lamarque et al. (2012); b Chen et al. (2018); c Zhu et al. (2006).

3     Implications of the extended DMS oxidation                                      concentrations of all oxidants which react with DMS in our
      mechanism                                                                       updated scheme are summarized in Fig. S1 in the Supple-
                                                                                      ment. NO3 oxidation of DMS accounts for 23 % of global
3.1    Global sulfur budget and distribution in the present                           DMS chemical loss and is dominant in Northern Hemi-
       day                                                                            sphere mid-latitudes, where the outflow of nitrogen oxides
                                                                                      (NOx ) – precursors of atmospheric NO3 – from the land
The global burden of DMS in [MOD_2000] is 50 Gg S. It                                 are substantial (Miyazaki et al., 2012). DMS oxidation by
is 38 % lower than the standard run, [STD_2000], but re-                              NO3 contributes < 10 % over most marine environments in
mains within the range of 9.6–140 Gg S from other stud-                               the Southern Hemisphere. Previous studies estimate that the
ies (Faloona, 2009; Kloster et al., 2006). Figure 2 shows                             global contribution of OH and NO3 to the DMS oxida-
that the reduction is mainly over the Southern Ocean and                              tion ranges from ∼ 50 %–70 % to 15 %–30 %, respectively
is attributable to faster chemical losses via DMS + BrO and                           (Berglen, 2004; Boucher et al., 2003; Khan et al., 2016; Chen
DMS(aq) + O3(aq) (Fig. 3). The global lifetime of DMS de-                             et al., 2018).
creases from 1.5 d in [STD_2000] to 0.8 d in [MOD_2000].                                 Oxidation by BrO is responsible for 11 % of the global
These values are comparable to the range of 1.2–2.1 d re-                             DMS removal, which falls midway within the previously es-
ported in Chen et al. (2018).                                                         timated range of 8 %–29 % (Boucher et al., 2003; Khan et
   Globally, chemical loss is the largest sink of DMS                                 al., 2016; Chen et al., 2018). Regionally, its importance can
(∼ 24 Tg S yr−1 ) in both PD simulations. The model default                           be up to 50 %–60 % over the high latitudes in the Southern
chemistry in [STD_2000] predicts that OH oxidation makes                              Hemisphere, which is close to a previous box model experi-
up 40 % (H abstraction) and 39 % (OH addition) of DMS                                 ment (Hoffmann et al., 2016).
chemical removal globally, while the remaining portion is                                DMS + O3 is the only multiphase DMS oxidation reac-
attributed to NO3 oxidation. These three reactions are only                           tion in this study, accounting for 8 % (aqueous phase) and
responsible for 80 % of global DMS loss in [MOD_2000].                                0.4 % (gas phase) of global DMS depletion. The oxidation
Figure 3 shows that, in [MOD_2000], DMS is mainly oxi-                                rates via these reactions, estimated by Boucher et al. (2003),
dized by OH in the gas phase (34 % via the H-abstraction                              were 6 % and 3 % of the total DMS sink calculated, respec-
channel and 23 % via the OH-addition pathway), which con-                             tively. Our lower gas-phase DMS + O3 reaction rate could
tributes up to 80 % of local loss over the tropical oceans                            be due to the inclusion of the BrO oxidation, which is miss-
where surface OH is the highest. The annual mean surface

Atmos. Chem. Phys., 22, 1549–1573, 2022                                                                https://doi.org/10.5194/acp-22-1549-2022
K. M. Fung et al.: Exploring DMS oxidation and implications for global aerosol radiative forcing                                   1557

Figure 2. Spatial distribution of the annual mean column concentration (micrograms of sulfur per meter squared; hereafter µg S m−2 ) for
DMS simulated by [MOD_2000] (a) and its difference from the baseline run, i.e., [MOD_2000]–[STD_ 2000] (b). Dotted regions (nearly
worldwide) indicate where statistically significant differences are identified by grid-by-grid two-sample t tests with p values < 0.05.

Figure 3. Spatial distribution of the fractional DMS oxidation (percent) from [MOD_2000] through DMS + OH (abstraction), DMS + OH
(addition), DMS + NO3 , DMS + BrO, DMS(aq) + O3(aq) , DMS + O3 , DMS + Cl (abstraction), and DMS + Cl (addition). Percentages in
parentheses denote contribution to global chemical loss. Subplots are arranged in descending order of their annual total oxidation rates.

ing in their study. Regionally, the fractional contribution of         study (Chen et al., 2018) and the 8 %–18 % from box model
aqueous-phase DMS + O3 to DMS oxidation can be up to                   studies (von Glasow and Crutzen, 2004; Hoffmann et al.,
20 %–30 % over high-latitude oceans, which is on the upper             2016).
end of the range of 5 %–30 % high-latitude DMS losses pre-                We note that recent studies (e.g., X. Wang et al., 2021)
viously reported (von Glasow and Crutzen, 2004; Chen et al.,           have shown that large discrepancies in Cl and BrO are found
2018).                                                                 within the same models and/or sets of measurements. Further
   Lastly, the Cl oxidation reactions via either the addition          investigation of how uncertainties in the representation of the
or abstraction channels contribute equally (0.3 % each, glob-          halogen cycle feed back onto DMS chemistry is, hence, war-
ally) to the chemical removal of DMS, which is consistent              ranted.
with the proposal of Atkinson et al. (2004). Our estimated                The global atmospheric sulfur burden is increased by
values are much lower than the 4 % found in a global model             41 Gg S (or 4.1 %) from [STD_2000] to [MOD_2000] (Fig. 4

https://doi.org/10.5194/acp-22-1549-2022                                               Atmos. Chem. Phys., 22, 1549–1573, 2022

1558                          K. M. Fung et al.: Exploring DMS oxidation and implications for global aerosol radiative forcing

Figure 4. (a) Global burdens of various atmospheric sulfur species in our simulations. The category of “Others” includes all other sulfur-
containing intermediates in the new chemistry (DMSO, MSIA, etc.). SO2 (blue) and sulfate (orange) refer to the burden of these species that
originate from DMS oxidation only; non-DMS contributions are shown in gray. (b) Total lifetimes of the atmospheric sulfur species to both
physical and chemical losses.

and Table S1). Approximately half (23 Gg S) of this incre-              (72 %) comes from the expansion of the gas-phase chem-
ment is associated with the recovery of the missing sul-                istry with a minor additional contribution from the aqueous-
fur associated with the OH-addition reaction in the standard            phase chemistry. In a sensitivity test where the isomerization
chemistry (the second reaction in Table 3), which does not              branch reaction (Table 5) is removed from [MOD_2000], the
conserve sulfur. The remaining total sulfur burden increase             global DMS-derived sulfate burden is reduced by 2.0 % (rel-
is attributable to the extended chemistry scheme. As dis-               ative to [MOD_2000]).
cussed above, the DMS burden in [MOD_2000] is lower than                   The spatial distribution of the product branching ratios of
[STD_2000] by 38 % due to faster oxidation. This oxida-                 DMS oxidation is shown in Fig. 6. In addition to depositional
tion produces intermediates with a wide range of lifetimes.             removal, HPMTF converts into SO2 , while SO2 and MSA
The addition of intermediates with relatively long physi-               are then oxidized to form sulfate. We estimate that 33 %
cal lifetimes (to dry and wet deposition only) of HPMTF                 of the annual total DMS oxidation will yield HPMTF. This
(1300 d) and MSA (8.5 d) delays the formation of SO2 (2.6 d)            is comparable to the observationally constrained estimates
and sulfate (4.4 d) compared to the standard reactions in               from NASA Atmospheric Tomography (ATom)-3 and ATom-
[STD_2000], which increases the export of sulfur-containing             4 flight campaigns, where ∼ 30 %–40 % DMS was oxidized
intermediates.                                                          to HPMTF along their flight tracks (Veres et al., 2020). High
   The PD global annual mean burden for sulfate aerosol is              HPMTF production is typically seen in the summer MBL,
582 Gg S in [MOD_2000], with an interannual variability of              coinciding with the HPMTF hotspots over tropical oceans,
46 Gg S (standard deviation of annual means). It is compara-            as shown in Fig. S2. To address the uncertainty in the pro-
ble to the 580 Gg S in a previous CAM6-chem study (Tilmes               duction and loss of HPMTF as discussed in Sect. 2.3, we run
et al., 2019) and is within the estimates (420–660 Gg S) from           several sensitivity tests using five combinations of kiso and
studies using other models (e.g., Heald et al., 2014; Chen et           kHPMTF+cloud values based on [MOD_2000]. Table S2 and
al., 2018). The new DMS chemistry has increased the global              Fig. S5 summarize the key results of these sensitivity tests.
sulfate burden by 47 Gg S (or 8.8 %) from the baseline value            Compared to [MOD_2000], we find that using a faster kiso
of 535 Gg S in [STD_2000]. The statistically significant in-            of 0.12 s−1 at 293 K (Ye et al., 2021) increases the global
creases in sulfate resulting from the expanded chemistry are            annual total isomerization rate of MSP by 5.6 %, while the
mostly found over the tropical and subtropical oceans in the            global burden of HPMTF increases by 4.1 %. Increasing the
Southern Hemisphere (Fig. 5). There is no strong seasonality            isomerization rate has little impact on the burden of sulfate
in the additional sulfate produced from our expanded chem-              from DMS (increase of only 4.0 %). We also evaluate the
istry. We estimate that the sulfate burden attributable to DMS          importance of the cloud uptake of HPMTF with two hypo-
increases by 41 % from 126 Gg S in [STD_2000] to 178 Gg S               thetical values of kHPMTF+cloud at 5 × 10⁻³ s−1 (Vermeuel et
in [MOD_2000]. Most of this increase in sulfate burden                  al., 2020) and 5 × 10⁻⁵ s−1 . At these rates, the cloud uptake

Atmos. Chem. Phys., 22, 1549–1573, 2022                                                   https://doi.org/10.5194/acp-22-1549-2022
K. M. Fung et al.: Exploring DMS oxidation and implications for global aerosol radiative forcing                                         1559

Figure 5. Spatial distribution of annual mean column concentrations (µg S m−2 ) for sulfate aerosol simulated by [MOD] (a, c) and their dif-
ference from the baseline run (b, d). Only values over the ocean are shown. Dotted regions indicate where statistically significant differences
are identified by grid-by-grid two-sample t tests with p values < 0.05.

becomes an important sink of HPMTF, which is responsi-
ble for 68 %–69 % and 28 % of the total HPMTF losses re-
spectively. The corresponding global burdens of HPMTF are
substantially lowered by 85 %–86 % and 52 %. For simula-
tion with cloud uptake loss, the burdens of HPMTF and sul-
fate are much less sensitive to our choice of kiso due to the
rapid loss of HPMTF to cloud uptake. In these sensitivity
simulations, the sulfur contained in HPMTF is assumed to
be removed from the system once taken up by cloud, thus re-
ducing the sequential formation of SO2 and sulfate (by up to
8 %).
   MSA is a key intermediate generated from the OH-
addition channel of the multiphase DMS oxidation, espe-
cially over the remote marine atmosphere. Our result shows
that aqueous-phase MSA formation accounts for most of the                 Figure 6. Branching ratio (percent) of the multiphase DMS oxi-
MSA production as commonly reported (von Glasow and                       dation pathways in [MOD_2000], considering HPMTF, SO2 , and
Crutzen, 2004; Barnes et al., 2006; Zhu et al., 2006; Hoff-               MSA as terminating products estimated from their annual total pro-
mann et al., 2016; Chen et al., 2018). In [MOD_2000], the                 duction rates.
global MSA burden is 7.5 Gg S, which is smaller than the
range of 13–40 Gg S from previous model studies (Pham et
al., 1995; Chin et al., 1996, 2000; Cosme et al., 2002; Hezel             loss process for MSA. This oxidation accounts for ∼ 76 % of
et al., 2011; Chen et al., 2018). In [MOD_2000], most MSA                 removal in [MOD_2000], followed by cloud uptake (18 %).
is formed over the Southern Ocean (Fig. S3). The lifetime of
MSA is 0.6 d globally, shorter than the 5–7 d previously pro-             3.2   Comparison with observations
posed (Chin et al., 1996, 2000; Cosme et al., 2002; Hezel et
al., 2011; Pham et al., 1995), likely because we include the              Table 9 summarizes the key observational datasets used here
aqueous-phase OH oxidation to sulfate, which is a significant             to compare with our PD model simulations for their wide
                                                                          coverage of the remote marine atmosphere. The Variability

https://doi.org/10.5194/acp-22-1549-2022                                                   Atmos. Chem. Phys., 22, 1549–1573, 2022
1560 K. M. Fung et al.: Exploring DMS oxidation and implications for global aerosol radiative forcing
Figure 8 summarizes the spatial difference between the
observed DMS from the VOCALS-REx and ATom mis-
sions and the simulated DMS. The model captures the peaks
over the tropical Pacific and the Southern oceans off the
coast of South America, but aircraft measurements detect
hotspots that are not simulated by the model (Fig. 8a). Dur-
ing VOCALS-REx the ship-based measurements (BROWN)
recorded a range of near-surface DMS from 18 to 111 ppt,
while the airborne measurements (C130) reveal a verti-
cally decreasing trend of DMS mixing ratios, from 33 ppt
at ∼ 500 m to 2.0 ppt at ∼ 2 km (Fig. 8b). Modeled surface
DMS falls in the range of the ship measurements. Compared
to the aircraft observations, simulated DMS is biased high
Figure 7. Horizontal distribution of annual mean surface mixing at the surface and declines more abruptly, which may in-
ratio and zonal mean vertical distribution of DMS (both in parts per
dicate biases in vertical mixing or cloud processing. DMS
trillion – ppt) modeled by [MOD_2000].
concentrations are slightly lower in the simulation with up-
dated chemistry [MOD_2000] but follow the same vertical
of the American Monsoon Systems (VAMOS) Ocean-Cloud- profile. We disaggregate the ATom observations into three re-
Atmosphere-Land Study Regional Experiment (VOCALS- gional groups, namely Pacific, Atlantic, and Southern oceans
REx) is an international field project that took place during as in Fig. 8a. DMS concentrations were measured by two
October and November in 2008 over the southeastern Pacific instruments during ATom (WAS and TOGA; the former gen-
off northern Chile and southern Peru (Wood et al., 2011). erally reported higher values), and both are compared with
VOCAL-REx consists of both ship-based and airborne mea- model values in Fig. 8c. Observed DMS concentrations dur-
surements for lower-atmospheric DMS (MSA(aq) ) and non- ing ATom are substantially lower than measured during VO-
CALS, and lower than any region simulated by the model.
sea-salt sulfate aerosol (nss-SO2−
4(aq) ). The ATom mission of Modeled DMS is biased high in all three regions, especially
NASA is a flight campaign spanning from the Arctic to the
over the Southern Ocean region where the discrepancy ex-
Antarctic over the remote Pacific and Atlantic oceans be-
tends up to 5 km. The new chemistry increases DMS losses
tween 2016 and 2018 (Wofsy et al., 2018). During ATom, an
and shortens the DMS lifetime, reducing the model bias in
array of instruments was used to collect and analyze daytime
[MOD_2000]. The decrease in simulated DMS is largest over
air samples from the remote marine environments, providing
the Southern Ocean (−49 % at the surface), where oxida-
measurements of DMS, HPMTF, MSA(aq) , and nss-SO2− 4(aq) . tion by BrO and O3 in the aqueous phase are important and
The Aerosol and Cloud Experiments in the Eastern North
the model–observation bias is substantially reduced. The re-
Atlantic (ACE-ENA) probed the atmosphere surrounding the
maining model biases during ATom exceed the uncertainty
ENA observatory on Graciosa Island during summer in 2017
of the kinetics for the current DMS oxidation scheme and are
and winter in 2018 (J. Wang et al., 2019, 2021). ACE-ENA
likely attributable, at least in part, to the uncertainty in DMS
provides high time resolution in situ measurements of MSA
emission. A sensitivity test, where we reduce the sea sur-
and sulfate aerosol in the lower troposphere (Zawadowicz
face DMS concentration by 50 % in regions south of 30◦ S in
et al., 2021). We note that the model–measurement compar-
[MOD_2000] produces, as expected, a comparable decrease
isons are not exact, given that our simulations are performed
in DMS mixing ratios in the lower atmosphere (< 5 km), and
using free-running dynamics and, thus, are not paired to the
the model–observation deviations are further narrowed (see
meteorological year of measurements. We, therefore, sample
Fig. S4 and the Supplement for details). Constraining DMS
monthly mean values from the model at the location of the
emissions is beyond the scope of this work but is clearly a
observations to provide qualitative comparisons.
major source of uncertainty that may impact the sulfur bud-
Most DMS resides in the lower troposphere (Fig. 7). An-
get discussed in Sect. 3.1 and the climate response discussed
nual mean surface DMS from [MOD_2000] ranges from
below.
40–300 ppt (parts per trillion) over much of the ocean but
Figure 9 compares the mean vertical profile of HPMTF
can exceed 320 ppt over the Southern Ocean and north-
mixing ratios observed during ATom against the model
eastern Pacific, which are regions with high DMS emis-
[MOD_2000]. Over the Pacific and Atlantic regions, HPMTF
sions. DMS concentrations of ∼ 25–125 ppt were observed
mixing ratios are largest at lower altitudes and decrease to
at Cape Grim, Tasmania, Australia, in 1990–1993 (Ayers et
< 1 ppt in the middle and upper troposphere. The model gen-
al., 1995). Sciare et al. (2000) report an annual mean DMS
erally reproduces the observed magnitude and vertical pro-
of 181 ppt at Amsterdam Island in the Indian Ocean during
file. The model [MOD_2000] is biased high over the South-
the 1990s. Both values are in line with the surface DMS at
ern Ocean region, particularly in the lower troposphere. Such
the corresponding locations modeled by [MOD_2000].
high biases are consistent with the aforementioned over-
Atmos. Chem. Phys., 22, 1549–1573, 2022 https://doi.org/10.5194/acp-22-1549-2022K. M. Fung et al.: Exploring DMS oxidation and implications for global aerosol radiative forcing 1561
Table 9. Key observational datasets used in this study.
Mission Aliases Instruments Species Reference
measured
VOCALS- OBS_BROWN Quadrupole mass spectrometry on research vessel DMS Huebert et al. (2004)
REx (R/V) Ronald H. Brown
OBS_C130 Quadrupole mass spectrometry on NSF/NCAR DMS Booth and Powell (2006)
Lockheed C-130 aircraft
OBS_PILS Particle into liquid sampler (PILS) on Department MSA(aq) ; Allen et al. (2011)
of Energy (DOE) Gulfstream I (G I) aircraft nss-SO2−
4(aq)
OBS_AMS Aerosol mass spectroscopy (AMS) and two-stage MSA(aq) ; Huebert et al. (2004)
impactor (TSI) on R/V Ronald H. Brown nss-SO2−
4(aq)
ATom OBS_WAS Whole air sampling (WAS) DMS Simpson et al. (2001)
OBS_TOGA Trace organic gas analyzer (TOGA) DMS Apel et al. (2015)
OBS_CIMS Iodide ion chemical ionization time-of-flight mass HPMTF Veres et al. (2020)
spectrometer (CIMS)
OBS_AMS High-resolution time-of-flight mass spectrometer MSA(aq) ; Canagaratna et al. (2007)
(HR-ToF-AMS) nss-SO2−
4(aq)
ACE-ENA OBS_AMS HR-ToF-AMS MSA(aq) ; Zawadowicz et al. (2021)
nss-SO2−
4(aq)
estimation of DMS over this region. In the lower atmo- 2021). Figure 10 shows the concentration of submicron par-
sphere over tropical and mid-latitude oceans, the modeled ticulate MSA measured during ATom and the co-located con-
DMS : HPMTF ratios range from 5 : 1 to 2 : 1, which is gener- centration of MSA aerosol in Aitken and accumulated modes
ally larger than the average 2 : 1 ratio observed during ATom modeled by [MOD_2000]. The model overestimates the mid-
(Veres et al., 2020), suggesting that the model may underes- tropospheric MSA concentrations in the Southern Ocean dur-
timate the DMS-to-HPMTF conversion rate or overestimate ing ATom. Conversely, over the Pacific and Atlantic, the
the HPMTF loss. Our model predicts that OH oxidation to model underestimates MSA at mid- and low altitudes. Over
SO2 is dominant in the removal of HPMTF while dry and the southeastern Pacific, the measured submicron MSA from
wet deposition are negligible. The addition of cloud uptake VOCALS-REx ranged from 50–80 ng m−3 at lower altitudes
(discussed in Sect. 2.3.2) can dramatically decrease HPMTF (< 1 km; Wood et al., 2011), while the location-matched sim-
concentration (by up to > 73 % when assuming moderate ulated MSA was considerably lower (6–15 ng m−3 ). Above
cloud uptake rate of 5 × 10⁻⁵ s−1 ), resulting in a better Graciosa Island in the North Atlantic, ACE-ENA-observed
model–observation agreement in the lower troposphere over MSA ranged from 10 to 20 ng m−3 at the lower troposphere
the Southern Ocean but low biases over the Pacific and At- (< 1 km) and gradually reduced to ∼ 5 ng m−3 in the mid-
lantic (Fig. 9). In light of the DMS biases in Fig. 8, this irre- troposphere (2–5 km; Zawadowicz et al., 2021), whereas the
versible cloud uptake may overcorrect the HPMTF concen- model estimates a negligible amount of MSA (< 0.5 ng m−3 )
trations. near the Azores as a result of limited DMS emissions in that
Our simulation shows that the gas-phase MSA formation region (as reflected by low DMS concentrations in Fig. 2).
is small compared to aqueous-phase formation, in line with Outside of the Southern Ocean, the mean simulated con-
previous work (Barnes et al., 2006; von Glasow and Crutzen, centration of MSA is underestimated compared to all obser-
2004; Zhu et al., 2006; Hoffmann et al., 2016; Chen et al., vations, which suggests that the MSA-forming branches of
2018; Hoffmann et al., 2021). Near the sea surface, simu- DMS oxidation (H abstraction, where MSP reacts with NO
lated gas-phase MSA is < 0.03 ppt, even in Southern Hemi- or multiphase OH-addition reactions of DMS) may be under-
sphere summer, while recent ship-based measurements re- represented in our simulations or that the loss of MSA (by
ported concentrations ranging from 1.4 to 25 ppt (Yan et reaction with OH, the reaction rate for which is still highly
al., 2019). The model also substantially underestimates gas- uncertain; Milne et al., 1989; Zhu et al., 2006; Chen et al.,
phase MSA (< 0.001 ppt) when compared to a wintertime 2018) may be overestimated.
site measurements in Germany (0.5–10 ppt; Stieger et al.,
https://doi.org/10.5194/acp-22-1549-2022 Atmos. Chem. Phys., 22, 1549–1573, 20221562 K. M. Fung et al.: Exploring DMS oxidation and implications for global aerosol radiative forcing
Figure 8. (a) Measurements of DMS during VOCALS-REx (diamonds in the southeastern Pacific near the coastline of Peru) and ATom
(dots) missions. Measured values are showing local 90th percentiles above oceans. ATom data are grouped into three regions, as shown in
the purple dashed polygons. Marine-only annual mean near-surface (> 500 hPa) DMS mixing ratios from [MOD_2000] are shown in the
background as a reference. Vertically binned modeled and observed medians of DMS, during (b) VOCALS-REx and (c) ATom, are shown.
Error bars and gray shadings indicate that the data ranged between corresponding upper and lower quantiles.
Concentrations of the sulfate aerosol simulated with both slower oxidation which prolongs the atmospheric lifetime.
[STD_2000] and [MOD_2000] generally agree well with Oxidation by OH via the H abstraction (38 % of total DMS
measurements from ATom (Fig. S6). Our model also per- oxidation in [MOD_1850]) and the OH-addition channels
forms well at the surface when compared against VOCAL- (27 %) are still the primary loss pathways of DMS (Fig. S7).
REx and ACE-ENA but is biased high above 1 km, likely DMS + NO3 becomes less important (23 % in PD vs. 6.0 %
reflecting biases in anthropogenic sulfate exported from con- in PI), given the reduced sources of NOx , resulting in a low-
tinental regions. ered DMS-to-SO2 conversion rate at 27 %, compared to 47 %
in [MOD_2000] (Fig. S8). Reduced NOx also limits the re-
action rates of MSP + NO, thereby favoring the isomeriza-
3.3 Global sulfur budget and distribution in the tion pathway (92 % of total loss of MSP in PD vs. 96 %
preindustrial era in PI). Hence, the conversion of DMS to HPMTF becomes
more important (39 % of total DMS oxidation in PI), lead-
As seen under PD conditions, the formation of intermedi-
ing to a doubling of the HPMTF burden in the PI compared
ates expands the overall lifetime of sulfur-containing species
to PD. The addition pathway producing MSA becomes more
in the PI atmosphere, thereby increasing the natural sulfate
dominant over the tropical ocean via oxidation by OH and
aerosol background. A summary of the burdens and life-
the high latitudes by DMS + BrO, raising the MSA burden
times of the sulfur-containing species from the PI simula-
by 59 % compared to PD. Lastly, the expanded DMS oxi-
tions is given in Table S1. The DMS burden in the PI from
dation chemistry increases the PI global annual mean sul-
[MOD_1850] is 84 % larger than its PD counterpart, due to
Atmos. Chem. Phys., 22, 1549–1573, 2022 https://doi.org/10.5194/acp-22-1549-2022K. M. Fung et al.: Exploring DMS oxidation and implications for global aerosol radiative forcing 1563
Figure 9. Measured (ATom) and modeled values of HPMTF are vertically binned. The thick lines show the medians. Error bars and gray
shadings indicate that the data ranged between corresponding upper and lower quantiles. The thin red line indicates the results from a
sensitivity test with kiso at 0.04 s−1 and kHPMTF+cloud at 5 × 10⁻⁵ s−1 .
Figure 10. Medians of observed (ATom) and modeled concentration of MSA aerosol are vertically binned. The thick lines show the medians.
Error bars and gray shadings indicate that the data ranged between the corresponding upper and lower quantiles.
fate burden by 29 % from 319 Gg S [STD_1850] to 412 Gg S 4 Global radiative impacts of updated DMS
([MOD_1850]; Fig. 5), of which 57 % is derived from DMS, chemistry
significantly larger than the 31 % in PD, confirming that
DMS is a relatively more important source of sulfate in PI. Changes to particle-phase sulfate and MSA due to the ex-
Similar to PD, the majority (66 %) of this additional sulfate panded DMS chemistry, as described above, may alter both
in the PI is produced via the expanded gas-phase oxidation aerosol–radiation and aerosol–cloud interactions. Given that
pathways, and this addition is largely aseasonal. The absolute particulate MSA is not included in the current CAM6-
burden of sulfate produced from DMS oxidation is higher in chem aerosol scheme, to account for its radiative impacts,
the PI (236 Gg S) compared to the PD (178 Gg S). we assume MSA interacts with radiation like sulfate op-
tically by implementing an artificial rapid conversion of
MSA to sulfate. These two adjusted cases are aliased as
[MOD_RE_1850] and [MOD_RE_2000], respectively. De-
tails of this implementation are described in the Supplement.
https://doi.org/10.5194/acp-22-1549-2022 Atmos. Chem. Phys., 22, 1549–1573, 2022You can also read