Investigation of proteins important for microcirculation using in vivo microdialysis after glucose provocation: a proteomic study - Nature
←
→
Page content transcription
If your browser does not render page correctly, please read the page content below
www.nature.com/scientificreports
OPEN Investigation of proteins important
for microcirculation using in vivo
microdialysis after glucose
provocation: a proteomic study
Alexandra Högstedt1*, Simon Farnebo2, Erik Tesselaar3 & Bijar Ghafouri4
Insulin has metabolic and vascular effects in the human body. What mechanisms that orchestrate the
effects in the microcirculation, and how the responds differ in different tissues, is however not fully
understood. It is therefore of interest to search for markers in microdialysate that may be related
to the microcirculation. This study aims to identify proteins related to microvascular changes in
different tissue compartments after glucose provocation using in vivo microdialysis. Microdialysis was
conducted in three different tissue compartments (intracutaneous, subcutaneous and intravenous)
from healthy subjects. Microdialysate was collected during three time periods; recovery after
catheter insertion, baseline and glucose provocation, and analyzed using proteomics. Altogether, 126
proteins were detected. Multivariate data analysis showed that the differences in protein expression
levels during the three time periods, including comparison before and after glucose provocation,
were most pronounced in the intracutaneous and subcutaneous compartments. Four proteins
with vascular effects were identified (angiotensinogen, kininogen-1, alpha-2-HS-glycoprotein and
hemoglobin subunit beta), all upregulated after glucose provocation compared to baseline in all three
compartments. Glucose provocation is known to cause insulin-induced vasodilation through the nitric
oxide pathway, and this study indicates that this is facilitated through the interactions of the RAS
(angiotensinogen) and kallikrein-kinin (kininogen-1) systems.
Abbreviations
ELISA Enzyme-linked immunosorbent assay
LFQ Label-free quantification
LC–MS/MS Liquid chromatography tandem mass spectrometry
OGTT Oral glucose tolerance test
PCA Principal component analysis
OPLS-DA Orthogonal partial least squares discriminant analysis
SD Standard deviation
SEM Standard error of the mean
STRING Search tool for retrieval of interacting genes/proteins
VIP Variable importance in projection
The interest in studying the vascular effects of the hormone insulin has increased over the last decades. It has been
shown that the vascular actions of insulin, to a large extent, are mediated through regulation of endothelium-
derived factors1, primarily through nitric oxide (NO)-dependent vasodilation and endothelin 1 (ET-1)-dependent
vasoconstriction2–6. The skin has become a popular model for studying the microvascular function, because it
is easily accessible and considered to be a representative vascular bed for the m icrocirculation7. Assessment of
1
Department of Surgery in Linköping, and Department of Biomedical and Clinical Sciences, Faculty of
Health Sciences, Linköping University, 58185 Linköping, Sweden. 2Department of Hand Surgery, Plastic
Surgery and Burns, and Department of Biomedical and Clinical Sciences, Linköping University, Linköping,
Sweden. 3Department of Medical Radiation Physics, and Department of Health, Medicine and Caring Sciences,
Linköping University, Linköping, Sweden. 4Pain and Rehabilitation Centre, and Department of Health, Medicine
and Caring Sciences, Linköping University, Linköping, Sweden. *email: alexandra.hogstedt@liu.se
Scientific Reports | (2021) 11:19093 | https://doi.org/10.1038/s41598-021-98672-8 1
Vol.:(0123456789)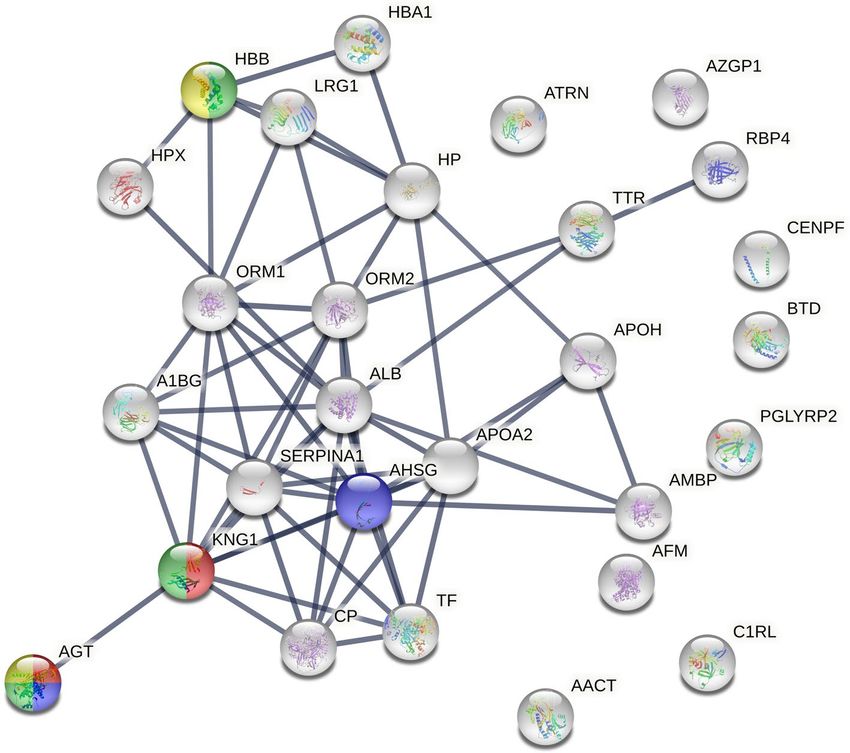
www.nature.com/scientificreports/
the skin microvascular function can be performed by both invasive, for instance microdialysis t echnique8,9, and
noninvasive techniques, such as laser speckle contrast imaging (LSCI) or laser Doppler fl owmetry10–12.
Microdialysis is a well-established technique for measuring local metabolic changes in a target tissue. The
basic principle of this technique is to mimic the function of a capillary blood vessel by perfusing a thin dialysis
catheter implanted into the tissue with a physiological saline solution. Substances can pass, by simple diffusion,
across the dialysis membrane along a concentration g radient13. The metabolic and vascular effects of insulin in
the human skin have previously been investigated using microdialysis t echnique8,9. It is known that oral glucose
provocation, and thereby endogenously increased insulin, increases local tissue blood flow in the human skin.
This is partially to increase access to glucose, through a process primarily believed to be mediated by endothelial
insulin dependent vasodilation. Measuring the concentration of insulin in the human skin using microdialysis
has however appeared to be challenging, because the concentration of insulin in peripheral tissues (intracutane-
ous and subcutaneous) is low, probably related to decreasing tissue vascularity and blood fl ow14. Altogether, it is
known that glucose provocation has microcirculatory effects, partly dependent on the vascular effects of insulin,
but the effects on changes in local protein expression are lacking. In order to understand what mechanisms that
orchestrate the effects in the microcirculation, investigation of the microdialysate in the search for other markers
important for the microcirculation during a glucose provocation is of interest.
The combination of microdialysis and proteomics using mass spectrometry has previously been described,
but the number of human studies is limited. The human cutaneous proteome has previously been investigated
using large pore microdialysis in two studies15,16. Sampling during the trauma phase (caused by the catheter inser-
tion) and during induction of vasodilation and plasma extravasation (by local histamin provocation) resulted in
identification of over a hundred proteins, mostly immunoglobulins and different plasma proteins such as apoli-
poproteins, albumins, complement factors and acute phase proteins15,16. This demonstrates that microdialysis
combined with shotgun proteomics is a feasible method for studying the complex molecular interactions in the
skin. In the search for a therapeutic target for diabetes, the proteome of the subcutaneous interstitial fluid has
been investigated using microdialysis and proteomics, identifying elevated galectin-1 in the subcutaneous adipose
tissue of type 2 diabetes patients compared to healthy controls17. To our knowledge, proteomic on microdialysate
from the intravenous compartments has not been investigated before.
By examining the protein expression in microdialysis samples, this study aims to identify protein biomarkers
that are related to microvascular changes in different tissue compartments during an oral glucose provocation.
Material and methods
Subjects. Eight subjects (4 female), with a mean age of 25 ± 2 years, participated in the study. Subjects were
consecutively recruited through advertising on social media. All subjects were healthy, non-smokers and did not
use any regular medication, except for oral contraceptives. Detailed numeric data can be found in the supple-
mentary files. The subjects arrived in the morning after an overnight fast and gave their written consent before
participation. During the whole experiment, the subjects were reclined in a comfortable position and were only
allowed to drink water.
The study was carried out according to the Helsinki declaration and was approved by the regional ethical
review board of Linköping (application ID: DNR 2011/362-31 and DNR 2016/122-32).
Microdialysis. Microdialysis catheters (100 kDa CMA 71 and 20 kDa CMA 67, 10 mm membrane, M dialy-
sis AB, Stockholm, Sweden) were inserted intracutaneous in the volar skin of the non-dominant forearm, subcu-
taneous in the periumbilical adipose tissue and intravenous in a peripheral vein in each of the eight subjects. The
procedure for insertion of microdialysis catheters has previously been described in d etail8,9,14. Before insertion,
all catheters were connected to microinjection pumps (CMA 107, CMA AB, Uppsala, Sweden) and perfused
for 90 min to ensure adequate function and reduce the risk of obstructing bubbles in the microdialysis tubing.
The perfusate was a control solution consisting of Ringer’s acetate solution with addition of 2.5% albumin and
30 mmol/L urea (APL AB, Umeå Sweden). In the intravenous catheter, 25 IE/mL heparin (Heparin LEO, Malmö,
Sweden) was added to the control solution to inhibit clotting, according to the manufacturer´s recommendation.
The flow rate was set to 1.0 µL/min.
A timeline and an overview of the protocol is shown in Fig. 1. After insertion of microdialysis catheter
a resting period of 90 min called the recovery period was followed. A recovery period is commonly used in
microdialysis studies to account for the local tissue trauma caused by the catheter insertion, and also to let the
microdialysis system stabilize in the tissue. Microdialysis samples were collected with regular intervals of 15 min
and ended at 300 min. The first 60 min after recovery period referred to baseline measurement. After the base-
line period, subjects then performed an oral glucose tolerance test (OGTT) to increase the endogenous insulin
production and samples collection was continued every 15 min. According to the WHO standard, the subjects
ingested 75 g glucose (APL AB, Stockholm, Sweden) diluted in 2 dL water within 5 min. Lag time, the time it
takes for the microdialysate to flow from the membrane to the microvial, was 5.1 min. To compensate for this,
the oral glucose load was therefore ingested 5 min before the exchange of the last vial during baseline. Hence,
no compensation for lag time was needed during data analysis.
Microdialysis sampling then followed for four hours after the oral glucose load. All microdialysis vials (M
dialysis AB, Stockholm, Sweden) were weighed (CPA225D, Sartorius Weighing Technology GmbH, Goettingen,
Germany) before and after sampling, to determine the volume of the recovered dialysate in each vial. Vials were
changed every 15 min, (except for during the recovery period) and placed on ice to avoid protein degradation.
To increase the sample volume and the total protein concentration, the microdialysate was pooled to reflect
three different time periods: 1) recovery period after catheter insertion, 2) baseline, and 3) glucose provocation.
For this proteomic study was 90 µl from time period 1, 10 µl from time period 2 and 30 µl from time period 3
Scientific Reports | (2021) 11:19093 | https://doi.org/10.1038/s41598-021-98672-8 2
Vol:.(1234567890)
www.nature.com/scientificreports/

                                                                                                            ad
                                                                                                          Lo
                                                                                                     se
                                                                                                  co
                                                                                                lu
                                                                                             lG
                                                                                           ra
                                                                                       O

                                                    Recovery              Baseline     Post Glucose Load
                                           -90                        0               60                         120                  180             240   300 Time (min)

                                                 Intracutaneous n=8

                                                   Intravenous n=7

                                                 Subcutaneous n=8

                                                  Time period 1       Time period 2                                                   Time period 3

                                                                                                     Proteomic analysis
                                                                                                  Microdialysis samples pooled into
                                                                                                   three time periods for LC MS/MS
                                                                                                         (Time periods 1, 2, 3)

                                  Figure 1.  Experimental protocol and setup for in vivo microdialysis experiment in healthy subjects (N = 8).
                                  Microdialysate samples were pooled to reflect three time periods: (1) recovery period after catheter insertion,
                                  (2) baseline and (3) glucose provocation. The figure was designed in Adobe Illustrator by the authors.

                                  available for proteomic analysis. Time period 3, “glucose provocation”, included dialysate from one to four hours
                                  after the oral glucose load was ingested. The dialysate from the first hour after the oral glucose load was excluded
                                  in order to create a distinct difference between the baseline period and the glucose provocation. The dialysate
                                  samples were then frozen at − 86 °C awaiting further analysis.

                                  Proteomics. Sample preparation. The dialysate samples contained a high amount of albumin since albu-
                                  min was added to the perfusate as a colloid. High concentrations of albumin would interfere with the protein
                                  quantification and mask the identification of other proteins in LC–MS/MS. Each sample was therefore depleted
                                  of albumin using an albumin and IgG depletion column (Thermo Fisher Scientific, Pierce Biotechnology, Rock-
                                  ford, USA) according to the manufacturer´s recommendation. Briefly, each dialysate sample was added to the
                                  resin slurry in each column and then incubated in room temperature on a shaker for 30 min. The depleted mi-
                                  crodialysate sample was collected by centrifuging the spin column for 2 min at 1000×g.
                                      The samples were then desalted and concentrated using 3 kDa Amicon spin-filter (Merck Millipore, Darm-
                                  stadt, Germany) according to the manufacturer’s recommendation. The concentrated samples were dried by
                                  speed vacuum concentrator (Savant, Farmingdale, NY, USA) and re-dissolved in 40 μL of urea buffer solution
                                  (8 M urea in 25 mM ammonium bicarbonate) to denature the proteins and incubated in room temperature for
                                  2 h. The proteins were reduced with dithiothreitol (DTT) (25 mM) and incubated for 15 min, and then alkylated
                                  with iodoacetamide (75 mM) for an additional 15 min. Finally, the samples were diluted with 25 mM ammo-
                                  nium bicarbonate up to 250 μL and desalted. Protein concentration was then measured using 2D quant kit (GE
                                  Healthcare, Uppsala, Sweden) according to the manufacturer´s recommendation before trypsinization. A total
                                  amount of 10 µg protein was removed to a new tube and incubated with trypsin (0.2 µg/µl) in a ratio of 1:25 w/w
                                  trypsin/protein at 37 °C overnight. The tryptic peptides were dried in speed vacuum concentrator and stored
                                  at -20 °C until analysis. On the day of the analysis the samples were first dissolved in 100 µl formic acid (0.1%).
                                  Then, 10 µl was applied to liquid chromatography tandem mass spectrometry. During the sample preparation
                                  all the samples were stored on ice to prevent protease activation.

                                  LC–MS/MS. The samples were analyzed using a liquid chromatography tandem mass spectrometry (EASY-
                                  nLC-MS/MS, Thermo Scientific, Waltham, MA, USA). Peptides were separated by reverse phase chromatogra-
                                  phy on a C18 pre column (20 mm × 100 μm) followed by a C18 column (100 mm × 75 μm) with particle size 5 μm
                                  (NanoSeparatoons, Nieuwkoop, Netherlands) at a flow rate of 300 nL/min. The gradient buffers contained 0.1%
                                  formic acid in water (buffer A) and 0.1% formic acid in acetonitrile (buffer B), and a linear gradient from 0 to
                                  100% of buffer B was used for 90 min to separate the peptides. Automated online analyzes were performed with
                                  a LTQ Orbitrap Velos Pro hybrid mass spectrometer (Thermo Scientific, Waltham, MA, USA).
                                     Raw files were searched using MaxQuant v. 1.5.8.3 (Max Planck Institute of Biochemistry, Martinsried, Ger-
                                  many) against Uniprot Human database (downloaded 2019). The following searching parameters were used:
                                  trypsin as digestion enzyme; maximum number of missed cleavages 2; fragment ion mass tolerance 0.50 Da;

Scientific Reports |   (2021) 11:19093 |                    https://doi.org/10.1038/s41598-021-98672-8                                                                  3

                                                                                                                                                                   Vol.:(0123456789)
www.nature.com/scientificreports/
parent ion mass tolerance 6.0 ppm; fixed modification was carbamidomethylation of cysteine. Data were filtered
at 1% false discovery rate. The label-free quantitative (LFQ) values were normalized in the software as described
earlier18.
Statistical analysis. Data in text is presented as means and SD, while data in Supplementary Figures
(Fig. S7) are presented as means and SEM. Figures and statistics were performed using GraphPad Prism version
6.0 (GraphPad Software, San Diego, California, USA). The proteomic data set was analyzed using multivariate
data analysis (MVDA) using SIMCA-P + (version 15.0; Sartorius Stedim Biotech, Umeå, Sweden) as previously
described19 and according to Wheelock & W heelock20. Briefly, Principal Component Analysis (PCA) was first
applied for the check of multivariate outliers using score plots in combination with Hotelling’s T2 and distance
to model in X-space, and then Orthogonal Partial Least Square discriminant analysis (OPLS-DA) was applied
for the investigations of proteome differences between the compartments and the changes over time. In the
OPLS-DA, variables (regressors) were considered important if the variable influence on projection (VIP) value
was greater than one. VIP indicates the relevance of each X-variable pooled over all dimensions and Y-variables
(the group of variables that best explain Y). R 2 describes the goodness of fit—the fraction of sum of squares of all
the variables explained by a principal component, and Q2 describes the goodness of prediction—the fraction of
the total variation of the variables that can be predicted using principal component cross validation m ethods21.
2 2
A difference between R and Q greater than 0.3 implies overfitting, meaning that the robustness of the model is
poor. The more components the model consists of the higher the risk for “noise” contamination. More compo-
2 but only at the expense of a lower prediction score of the Q
nents would result in a higher R 2. The validity of the
model was estimated using cross validated analysis of variance (CV-ANOVA). A p value < 0.05 for CV-ANOVA
indicate that the multivariate regressions were significant.
Bioinformatics. The bioinformatic tool STRING (Search Tool for Retrieval of Interacting Genes/Proteins)
was used to analyze the protein–protein association n etwork22. Protein accession numbers (as described in Uni-
Prot) were entered in the search engine (multiple proteins) for (i) all detected significant proteins (VIP > 1) in
each compartment (intracutaneous, subcutaneous and intravenous), (ii) the significant proteins (VIP > 1) identi-
fied as important for the separation between the different time periods in all compartments (Table 1), and (iii) the
significant proteins (VIP > 1) identified as important for the separation between the compartments before and
after glucose provocation (Table 2). Immunoglobulin kappa light chain and Immunoglobulin kappa constant
can not be identified by the search engine and were therefore excluded in the STRING analysis. The following
settings were applied: Organism Homo sapiens; the maximum number of interactions was query proteins only;
interaction score was set to highest confidence (0.900); and an FDR (false discovery rate) ≤ 0.05 was used when
classifying the Biological Process (GO) of each protein. For each obtained network, PPI enrichment p value was
reported. In the network figures, each protein is represented by a colored node while protein–protein interaction
and association are represented by a line. Higher combined confidence scores are represented by thicker lines.
Results
Overview. Due to technical issues during catheter insertion, one of the intravenous microdialysis catheters
was never inserted. The other 23 catheters were successfully inserted, and adequate volume recovery was obtained
in all microvials (intracutaneous: 95 ± 5%; subcutaneous 96 ± 4%; intravenous 99 ± 5%). This resulted in a total
of 69 dialysate samples, but one sample was unfortunately spoiled during albumin depletion. In the remaining
68 samples, mean protein concentration in the intracutaneous samples was 4.6 ± 4.0 µg/µL, 4.4 ± 4.5 µg/µL in the
subcutaneous samples and 1.4 ± 1.7 µg/µL in the intravenous samples. Due technical issues during LC–MS/MS,
two samples from the subcutaneous compartment and three from the intravenous compartment were excluded.
Detailed numeric data can be found in the supplementary files.
Proteomic analysis. A total of 126 proteins were detected in the microdialysate samples using LC–MS/
MS, where 31% of the proteins could be found in all three tissue compartments. The distribution of the detected
proteins in each compartment is depicted in the Venn diagram (Fig. 2). Seven proteins (apolipoprotein D, car-
bonic anhydrase 1, hemoglobin subunit delta, hornerin, keratin type II cytoskeletal 1, keratin type II cytoskeletal
2 epidermal, rho guanine nucleotide exchange factor 9) were found only in the intracutaneous and subcutaneous
compartments. In the intracutaneous and intravenous compartments another seven proteins overlapped (actin,
clusterin, complement C3, fibrinogen beta chain, homeobox protein Hox-B3, thymosin beta-4, vasorin), while
only two proteins were found to be unique for the intravenous and subcutaneous compartments (alpha-2-mac-
roglobulin, inter-alpha-trypsin inhibitor heavy chain H4). A detailed list with names of all detected proteins in
each tissue compartment is presented in Supplementary Table S1.
Protein changes over time in each compartment. Multivariate statistical analysis was performed to investigate
the differences in protein expression between the different time periods; (1) recovery period after catheter inser-
tion, (2) baseline, and (3) glucose provocation, in all three respective compartments; intracutaneous, subcutane-
ous and intravenous.
Intracutaneous. The unsupervised PCA model did not identify any strong outliers. The OPLS-DA model con-
sisted of one predictive and one orthogonal component (R2 = 0.49, Q2 = 0.42 and CV-ANOVA p value: 0.9E−3). A
clear separation between the different time periods based on the proteome profile were found (see Supplemen-
tary Fig. S1), where 28 proteins with VIP > 1 contributed most to the separation.
Scientific Reports | (2021) 11:19093 | https://doi.org/10.1038/s41598-021-98672-8 4
Vol:.(1234567890)www.nature.com/scientificreports/
Protein ID Gene name Protein name Compartment VIP
P02766 TTR Transthyretin Intracutaneous 1.37
P04217 A1BG Alpha-1B-glycoprotein Subcutaneous 1.37
P00450 CP Ceruloplasmin Subcutaneous 1.35
P02768 ALB Albumin Intracutaneous 1.35
P00738;P00739 HP Haptoglobin/haptoglobin-related protein Subcutaneous 1.32
P02652 APOA2 Apolipoprotein A-II Intracutaneous 1.31
P02768 ALB Albumin Subcutaneous 1.30
P02763 ORM1 Alpha-1-acid glycoprotein 1 Subcutaneous 1.28
P01042 KNG1 Kininogen-1 Subcutaneous 1.28
P43652 AFM Afamin Intracutaneous 1.27
P02652 APOA2 Apolipoprotein A-II Subcutaneous 1.24
P01011 AACT Alpha-1-antichymotrypsin Intravenous 1.24
P02763 ORM1 Alpha-1-acid glycoprotein 1 Intracutaneous 1.23
P02765 AHSG Alpha-2-HS-glycoprotein Intravenous 1.23
P02750 LRG1 Leucine-rich alpha-2-glycoprotein Subcutaneous 1.23
P04217 A1BG Alpha-1B-glycoprotein Intracutaneous 1.22
P02766 TTR Transthyretin Subcutaneous 1.21
Q96PD5 PGLYRP2 N-acetylmuramoyl-L-alanine amidase Subcutaneous 1.21
P01011 AACT Alpha-1-antichymotrypsin Subcutaneous 1.20
P68871 HBB Hemoglobin subunit beta Intracutaneous 1.20
P69905 HBA1 Hemoglobin subunit alpha Intracutaneous 1.20
P02750 LRG1 Leucine-rich alpha-2-glycoprotein Intracutaneous 1.20
P02768 ALB Albumin Intravenous 1.19
O75882 ATRN Attractin Intracutaneous 1.19
P01011 AACT Alpha-1-antichymotrypsin Intracutaneous 1.18
P00738;P00739 HP Haptoglobin/haptoglobin-related protein Intravenous 1.18
P02766 TTR Transthyretin Intravenous 1.15
P25311 AZGP1 Zinc-alpha-2-glycoprotein Subcutaneous 1.15
P02765 AHSG Alpha-2-HS-glycoprotein Subcutaneous 1.15
P02753 RBP4 Retinol-binding protein 4 Intravenous 1.14
P00738;P00739 HP Haptoglobin/haptoglobin-related protein Intracutaneous 1.14
P19652 ORM2 Alpha-1-acid glycoprotein 2 Intracutaneous 1.14
P43251 BTD Biotinidase Intracutaneous 1.13
P68871 HBB Hemoglobin subunit beta Intravenous 1.13
P02765 AHSG Alpha-2-HS-glycoprotein Intracutaneous 1.12
P02760 AMBP Protein AMBP Intracutaneous 1.11
Q9NZP8 C1RL Complement C1r subcomponent-like protein Intracutaneous 1.11
P01019 AGT Angiotensinogen Intracutaneous 1.11
P25311 AZGP1 Zinc-alpha-2-glycoprotein Intracutaneous 1.09
P02763 ORM1 Alpha-1-acid glycoprotein 1 Intravenous 1.09
P00450 CP Ceruloplasmin Intracutaneous 1.08
P01009 SERPINA1 Alpha-1-antitrypsin Intravenous 1.08
P02749 APOH Beta-2-glycoprotein 1 Intracutaneous 1.08
P01042 KNG1 Kininogen-1 Intracutaneous 1.07
P25311 AZGP1 Zinc-alpha-2-glycoprotein Intravenous 1.06
P04217 A1BG Alpha-1B-glycoprotein Intravenous 1.06
P49454 CENPF Centromere protein F Subcutaneous 1.06
O75882 ATRN Attractin Intravenous 1.05
P01019 AGT Angiotensinogen Intravenous 1.05
Q96PD5 PGLYRP2 N-acetylmuramoyl-L-alanine amidase Intracutaneous 1.05
Q9NZP8 C1RL Complement C1r subcomponent-like protein Subcutaneous 1.04
P02787 TF Serotransferrin Intracutaneous 1.04
P02787 TF Serotransferrin Subcutaneous 1.01
P02790 HPX Hemopexin Intravenous 1.00
Scientific Reports | (2021) 11:19093 | https://doi.org/10.1038/s41598-021-98672-8 5
Vol.:(0123456789)www.nature.com/scientificreports/
Table 1. Significant proteins (VIP > 1) in the orthogonal partial least square discriminant analysis (OPLS-DA)
model of all three compartments (intracutaneous, subcutaneous and intravenous) that contributed most to the
separation between the different time periods. Proteins were considered significant if VIP (variable influence
of projection) value was > 1. Protein ID (accession number) and gene name are referred to according to the
protein database Uniprot (http://uniprot.org).
Subcutaneous. No strong outliers were identified in the PCA model. The OPLS-DA model showed a good fit
(R2 = 0.65), predictivity (Q2 = 0.55) and a highly significant CV-ANOVA (p value = 1.1E−5). The subcutaneous
OPLS-DA model, consisting of one predictive and one orthogonal component, also showed a clear separation
between the different time periods based on the proteome profile (see Supplementary Fig. S2).
Intravenous. No strong outliers were identified in the intravenous PCA model. The OPLS-DA model, consist-
ing of one predictive and one orthogonal component, showed a clear separation between the different time
periods based on the proteome profile (see Supplementary Fig. S3). The intravenous OPLS-DA model showed a
good fit (R2 = 0.42) and predictivity (Q2 = 0.35), however not statistically significant (CV-ANOVA p value = 0.10).
Protein changes between all compartments (in all time periods). To investigate the dynamic changes of the pro-
tein patterns (in time period 1–3) in all compartments (intracutaneous, subcutaneous and intravenous) multi-
variate statistical analysis was performed. No strong outliers were identified in the unsupervised PCA models
and, as shown in Fig. 3, a distinct separation between the different time periods was already detected in this
unsupervised model.
The OPLS-DA model consisted of two predictive components and showed a clear separation between the time
periods based on the proteome profile (R2 = 0.83, Q2 = 0.79, p-value = 1.1E−10). Table 1 presents the 54 proteins
from all three compartments with VIP > 1 that contributed most to the separation between the different time
periods, where 24 originated from the intracutaneous compartment, 16 from the subcutaneous compartment
and 14 from the intravenous compartment. The highest VIP values, i.e. the proteins contributing most to the
separation between the different time periods, were found in the intracutaneous and the subcutaneous compart-
ments. A detailed list with LFQ intensity for each protein in Table 1 is presented in Supplementary Table S2.
Protein changes between all compartments before and after glucose provocation (time period 2 and 3). To inves-
tigate protein biomarkers that might affect the microcirculation following a glucose provocation, multivariate
statistical analysis was performed in all compartments (intracutaneous, subcutaneous and intravenous), but only
during time period 2 and 3 (i.e. before and after glucose provocation. The OPLS-DA model (Fig. 4) consisted of
one predictive and one orthogonal component, and showed a clear separation of the proteome profile before and
after glucose provocation ( R2 = 0.99, Q2 = 0.91, p-value = 1.6E−5), where the 53 proteins contributing most to the
separation (VIP > 1) is presented in Table 2. Two subgroups, marked with circles (Fig. 4), were identified in the
proteome after glucose provocation. A detailed list with LFQ intensity for each protein in Table 2 is presented in
Supplementary Table S3.
Bioinformatics. Protein changes over time in each compartment. The significant proteins (VIP > 1) from
the OPLS-DA model from the respective compartments (intracutaneous, subcutaneous and intravenous; i.e.
from Supplementary Figs. S1, S2, S3) were analyzed to investigate the protein–protein association network using
STRING analysis. These STRING analyzes is presented in Supplementary Figs. S4, S5, S6. The proteins interest-
ing for the aim of this study were involved in the biological process of vascular actions (vasodilation, regulation
of blood vessel size, positive regulation of nitric oxide biosynthetic processes and regulation of cellular response
to insulin stimulus), where interactions were found between four proteins intracutaneously and subcutaneously
(angiotensinogen, kininogen-1, alpha-2-HS-glycoprotein and hemoglobin subunit beta) and five intravenously
(angiotensinogen, alpha-2-HS-glycoprotein and hemoglobin subunit beta, fibrinogen alpha chain, fibrinogen
gamma chain). PPI enrichment for all networks in STRING were < 1.0E−16.
Protein changes between all compartments (in all time periods). The proteins contributing most to the sepa-
ration between the compartments during the whole experiment (Table 1) were also analyzed using STRING.
Figure 5 shows the interactions between proteins with vascular effects, where four proteins (angiotensinogen,
kininogen-1, alpha-2-HS-glycoprotein and hemoglobin subunit beta) were found. LFQ intensity for these pro-
teins are shown in Supplementary Fig. S7. PPI enrichment was < 1.0E−16.
Protein changes between all compartments before and after glucose provocation (time period 2 and 3). Supple-
mentary Fig. S8 presents the protein–protein interactions between the proteins in Table 2, i.e. the proteins most
important for the separation before and after glucose provocation. When adding associated proteins to see larger
connections of proteins involved in larger biological systems, further interactions was found, comprising renin,
angiotensin converting enzyme and B2 bradykinin receptor (Fig. 6).
Scientific Reports | (2021) 11:19093 | https://doi.org/10.1038/s41598-021-98672-8 6
Vol:.(1234567890)www.nature.com/scientificreports/
Alteration after glucose
Protein ID Gene name Protein name Compartment VIP provocation vs baseline
P02652 APOA2 Apolipoprotein A-II Intracutaneous 1.54 ↑
Complement C1r subcomponent-like
Q9NZP8 C1RL Intracutaneous 1.47 ↑
protein
Q96PD5 PGLYRP2 N-acetylmuramoyl-L-alanine amidase Intracutaneous 1.47 ↑
P43652 AFM Afamin Intracutaneous 1.46 ↑
P04217 A1BG Alpha-1B-glycoprotein Intracutaneous 1.44 ↑
P02750 LRG1 Leucine-rich alpha-2-glycoprotein Intracutaneous 1.41 ↑
P02765 AHSG Alpha-2-HS-glycoprotein Intracutaneous 1.39 ↑
P02768 ALB Albumin Subcutaneous 1.38 ↑
Q96PD5 PGLYRP2 N-acetylmuramoyl-L-alanine amidase Subcutaneous 1.37 ↑
P02768 ALB Albumin Intracutaneous 1.36 ↑
Haptoglobin/haptoglobin-related
P00738;P00739 HP Intravenous 1.35 ↑
protein
P01019 AGT Angiotensinogen Intracutaneous 1.34 ↑
P68871 HBB Hemoglobin subunit beta Intravenous 1.34 ↑
P04217 A1BG Alpha-1B-glycoprotein Intravenous 1.34 ↑
P04217 A1BG Alpha-1B-glycoprotein Subcutaneous 1.33 ↑
P02766 TTR Transthyretin Intracutaneous 1.33 ↓
P43251 BTD Biotinidase Intracutaneous 1.32 ↑
P02652 APOA2 Apolipoprotein A-II Subcutaneous 1.30 ↑
P02765 AHSG Alpha-2-HS-glycoprotein Intravenous 1.30 ↑
P01019 AGT Angiotensinogen Subcutaneous 1.29 ↑
P01019 AGT Angiotensinogen Intravenous 1.29 ↑
P43652 AFM Afamin Intravenous 1.27 ↑
Haptoglobin/haptoglobin-related
P00738;P00739 HP Intracutaneous 1.27 ↑
protein
P02763 ORM1 Alpha-1-acid glycoprotein 1 Intracutaneous 1.27 ↓
P02750 LRG1 Leucine-rich alpha-2-glycoprotein Subcutaneous 1.26 ↑
P00450 CP Ceruloplasmin Subcutaneous 1.25 ↑
P01011 AACT Alpha-1-antichymotrypsin Subcutaneous 1.23 ↓
P02765 AHSG Alpha-2-HS-glycoprotein Subcutaneous 1.22 ↑
P02750 LRG1 Leucine-rich alpha-2-glycoprotein Intravenous 1.22 ↑
P02760 AMBP Protein AMBP Intracutaneous 1.22 ↑
P02749 APOH Beta-2-glycoprotein 1 Intracutaneous 1.21 ↑
P01011 AACT Alpha-1-antichymotrypsin Intracutaneous 1.21 ↓
P68871 HBB Hemoglobin subunit beta Intracutaneous 1.20 ↑
Haptoglobin/haptoglobin-related
P00738;P00739 HP Subcutaneous 1.19 ↑
protein
P01008 SERPINC1 Antithrombin-III Intravenous 1.19 ↓
P02763 ORM1 Alpha-1-acid glycoprotein 1 Subcutaneous 1.17 ↓
P01042 KNG1 Kininogen-1 Subcutaneous 1.15 ↑
P01042 KNG1 Kininogen-1 Intracutaneous 1.15 ↑
P19652 ORM2 Alpha-1-acid glycoprotein 2 Intracutaneous 1.15 ↓
P00450 CP Ceruloplasmin Intracutaneous 1.14 ↑
P69905 HBA1 Hemoglobin subunit alpha Intravenous 1.14 ↑
P02753 RBP4 Retinol-binding protein 4 Intracutaneous 1.13 ↑
P02768 ALB Albumin Intravenous 1.13 ↑
P05155 SERPING1 Plasma protease C1 inhibitor Intravenous 1.08 ↑
Complement C1r subcomponent-like
Q9NZP8 C1RL Subcutaneous 1.06 ↑
protein
P01011 AACT Alpha-1-antichymotrypsin Intravenous 1.05 ↓
Q96PD5 PGLYRP2 N-acetylmuramoyl-L-alanine amidase Intravenous 1.04 ↑
P68871 HBB Hemoglobin subunit beta Subcutaneous 1.04 ↑
O75882 ATRN Attractin Intravenous 1.03 ↑
P25311 AZGP1 Zinc-alpha-2-glycoprotein Intracutaneous 1.02 ↓
P01042 KNG1 Kininogen-1 Intravenous 1.02 ↑
P02753 RBP4 Retinol-binding protein 4 Intravenous 1.02 ↓
P43251 BTD Biotinidase Subcutaneous 1.01 ↑
Scientific Reports | (2021) 11:19093 | https://doi.org/10.1038/s41598-021-98672-8 7
Vol.:(0123456789)www.nature.com/scientificreports/
Table 2. Significant proteins (VIP > 1) in the orthogonal partial least square discriminant analysis (OPLS-DA)
model of all three compartments (intracutaneous, subcutaneous and intravenous) that contributed most to
the separation in protein expression before (baseline) and after glucose provocation (Fig. 4). ↑ = Upregulated;
↓ = Downregulated after glucose provocation compared to before (baseline). Proteins were considered
significant if VIP (variable influence of projection) value was > 1. Protein ID (accession number) and gene
name are referred to according to the protein database Uniprot (http://uniprot.org).
Figure 2. Three-way Venn diagram visualizing the distribution of proteins between the different tissue
compartments; intracutaneous, subcutaneous and intravenous.
Figure 3. Principal component analysis (PCA) of the proteome over time. The score plot shows the dynamic
changes of protein expression in all compartments; intracutaneous (green), subcutaneous (blue) and intravenous
(red). The x-axis represents intergroup differences while the y-axis represents intragroup differences.
Scientific Reports | (2021) 11:19093 | https://doi.org/10.1038/s41598-021-98672-8 8
Vol:.(1234567890)www.nature.com/scientificreports/
Figure 4. Orthogonal partial least square discriminant analysis (OPLS-DA) of the proteome before and after
glucose provocation. The score plot shows the separation in protein expression between baseline (blue) and after
glucose provocation (red). R2 = 0.99, Q2 = 0.91, CV-ANOVA p value = 1.6E−10. The x-axis represents intergroup
differences while the Y-axis represents intragroup differences.
Figure 5. Pathway analysis of proteins associated with vascular actions of the proteins most important for
the separation between the time periods in all compartments (intracutaneous, subcutaneous and intravenous)
using the STRING database. Vascular pathways highlighted: red = vasodilation, blue = regulation of cellular
response to insulin stimulus, green = regulation of blood vessel diameter, yellow = positive regulation of
nitric oxide biosynthetic process. PPI enrichment was < 1.0E−16. Proteins involved in vascular pathways:
AGT = Angiotensinogen, KNG = Kininogen-1, AHSG = Alpha-2-HS-glycoprotein, HBB = Hemoglobin subunit
beta.
Scientific Reports | (2021) 11:19093 | https://doi.org/10.1038/s41598-021-98672-8 9
Vol.:(0123456789)www.nature.com/scientificreports/
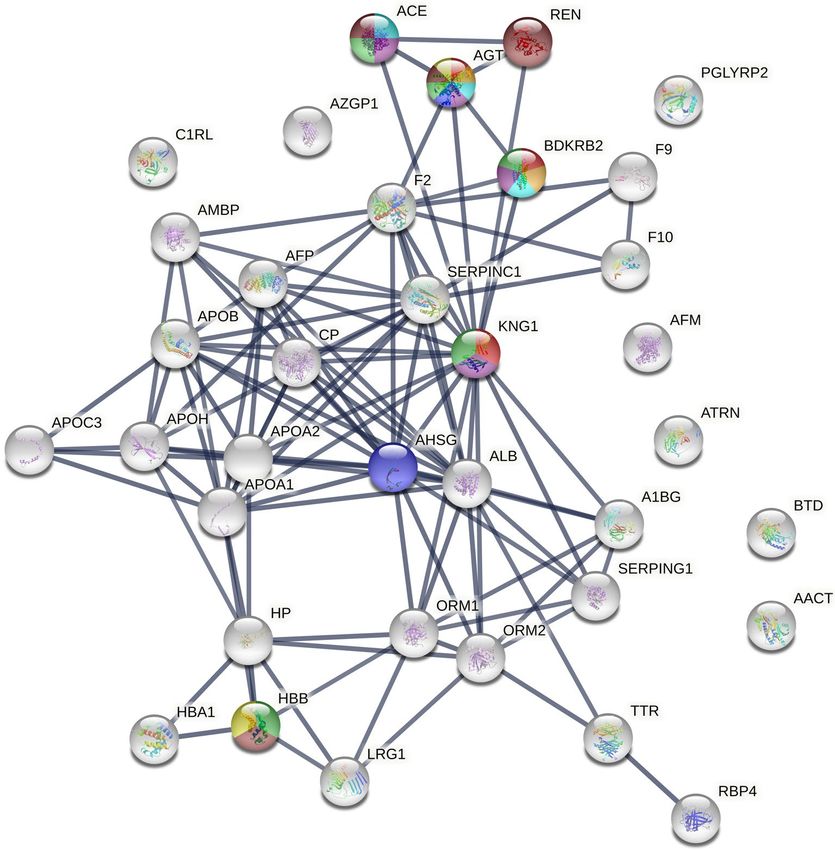
Figure 6. Extended pathway analysis of proteins associated with vascular actions of the proteins most
important for the separation before (baseline) and after glucose provocation using the STRING database.
Vascular pathways highlighted: red = vasodilation, blue = regulation of cellular response to insulin stimulus,
green = regulation of blood vessel diameter, yellow = positive regulation of nitric oxide biosynthetic process,
turquoise = regulation of vasoconstriction, orange = vasoconstriction, purple = regulation of tube diameter,
brown = regulation of blood pressure. PPI enrichment was < 1.0E−16. Proteins involved in vascular pathways:
AGT = Angiotensinogen, KNG = Kininogen-1, AHSG = Alpha-2-HS-glycoprotein, HBB = Hemoglobin subunit
beta, ACE = Angiotensin converting enzyme, REN = Renin, BDKRB2 = B2 bradykinin receptor.
Discussion
The hormone insulin is secreted in the healthy body as a reaction to glucose ingestion. Its metabolic effects in
peripheral tissue are well investigated, however it is less known what pathways orchestrate its effects on local
tissue microcirculation. This study therefore used an innovative approach of combining microdialysis and tan-
dem mass spectrometry to investigate changes in the human proteome in the skin and surrounding tissues after
an oral glucose provocation. Microdialysate samples from the intracutaneous, subcutaneous and intravenous
compartments revealed a total of 126 proteins, whereof 34% were found in both compartments. There was a
relatively distinct variation in protein expression over time (Table 1), and after glucose provocation (Table 2),
which was most pronounced in the intracutaneous and subcutaneous compartments, compared to the intrave-
nous compartment. Most relevant from the perspective of local microcirculatory physiological functions was the
strong association of the four proteins; Angiotensinogen (AGT), kininogen-1 (KNG1), alpha-2-HS-glycoprotein
(AHSG) and hemoglobin subunit beta (HBB). They were all upregulated after glucose provocation compared
to baseline (Supplementary Fig. S7). Previous research on how the expression of these proteins is affected by a
glucose provocation is limited, although the connection between especially angiotensinogen and kininogen-1 is
well known in relation to microcirculatory processes and effects on blood flow related to activation of the nitric
oxide pathway. An improved understanding of what biological processes occur in skin and subcutaneous tissue,
secondary to increased systemic insulin levels, is likely to be of importance for targeted treatments where glucose
delivery to the target tissue is hampered as a result of serious illness and deranged glucose-insulin f unctions23.
Scientific Reports | (2021) 11:19093 | https://doi.org/10.1038/s41598-021-98672-8 10
Vol:.(1234567890)www.nature.com/scientificreports/
Kininogen-1 is a precursor for kinins and plays an important role in the kallikrein-kinin system in the blood
coagulation cascade24,25. Kininogen-1 is proteolytically cleaved into the active peptide bradykinin, a potent but
short-lived vasoactive mediator. Bradykinin is proinflammatory (inducing increased vascular permeability and
stimulates nociceptors), exert vasodilatory effects and is involved in glucose homeostasis (decreases blood glu-
cose concentration)24–27. Bradykinin then acts on endothelial cell bradykinin B2 receptors to form nitric oxide28.
Angiotensinogen is the only known precursor to the renin-angiotensin system (RAS), which is an essen-
tial regulatory system for arterial blood pressure, vasoconstriction, body fluid and electrolyte homeostasis and
proinflammatory processes29–31. Angiotensinogen itself mainly inhabits vasoconstrictive properties29,31 and is
known to affect the development of vascular diseases such as hypertension and a therosclerosis32,33. Angiotensin
II is formed after enzymatic cleavage of angiotensinogen, via angiotensin I. When acting through angiotensin 1
receptors (AT1-R), angiotensin II is a strong vasoconstrictor involved in development of hypertension, athero-
sclerosis, diabetes, and cardiac and kidney f ailure34. In contrast does angiotensin II also produce a vasodilator
effect through the angiotensin 2 receptors (AT2-R) via the bradykinin dependent activation of endothelial nitric
oxide (NO) synthase, which is believed to be a compensatory mechanism in order to protect the vessels from
mechanical overload (too much vasoconstriction)28,34.
This interaction between the RAS system and the kallikrein-kinin system is visually shown in Fig. 6. Both
these systems induce nitric oxide dependent vasodilation. Insulin is also known to induce vasodilation and
increase glucose metabolism the nitric oxide p athway8–10. Angiotensinogen, amongst hundreds of other adi-
pokines, are known to modulate insulin sensitivity and influence glucose/fat metabolism and obesity35–37. Schorr
et al. showed that the insulin response to an oral glucose load was significantly related to increased plasma levels
of angiotensinogen, which positively correlated with increased blood p ressure33. Insulin treatment induces the
expression of angiotensinogen in adipose tissue37. Elevated expressions of kininogen-1 respectively prekallikrein
(cleaves kininogen to vasoactive peptide bradykinin) have also previously been described in type 1 diabetic
patients and r ats38–40, which in rats further could be reversed with insulin t reatment40.
In 2004, Schremmer-Danninger et al. showed that kinin-B1 receptors (receptors for bradykinin) were upregu-
lated in skin biopsies obtained following surgery, suggesting an important role of kinin-B1 receptors during the
first phase of inflammation following i njury41. Kininogen-1 was also upregulated in epidermis in skin biopsies
following surgery. One could speculate that the microdialysis catheter insertion would trigger an upregulation
of kininogen-1 in this current study. As shown in the LFQ-intensity of kininogen-1 in Supplementary Fig. S7B
this was however not the case, whereas kininogen-1 was upregulated after glucose provocation.
In this study, angiotensinogen, but no other part of the RAS system, was found in all three tissue compart-
ments. It has however previously been shown that the complete renin– angiotensin system (receptors for angio-
tensin I and angiotensin II, renin, angiotensinogen and angiotensin-converting enzyme) is present in human
skin42. Presumably, the whole RAS system plays a role in the normal cutaneous homeostasis, as well as wound
healing. Likewise has the whole kallikrein-kinin system previously been found i ntracutaneously41.
In addition to angiotensinogen and kininogen-1, hemoglobin subunit beta and alpha-2-HS-glycoprotein
were also detected and are both known to have vascular effects. Hemoglobin subunit alpha and beta in the
intracutaneous and subcutaneous compartments were upregulated only during time period 1, i.e. recovery after
the catheter insertion. We interpret this as a minor local bleed, due to the catheter insertion, that however was
not detected visually in the microdialysate. This was however not seen in the intravenous compartment, which
could be explained by the higher laminar blood flow in the blood vessel. Alpha-2-HS-glycoprotein, also known
as fetuin-A, has no direct effect on the microcirculation or the blood flow, but has indirect effects via regulation
of insulin43. It is highly associated with insulin resistance, obesity type 2 diabetes and non-alcoholic fatty liver
disease44–47. Alpha-2-HS-glycoprotein is an inhibitor of insulin receptor tyrosine kinase in the liver and skeletal
muscle, thereby inhibiting the autophosphorylation of tyrosine kinase in insulin receptor and insulin receptor
substrate 1 (IRS-1) resulting in insulin resistance in h umans48.
Figure 4 shows a clear separation of proteome profile before and after glucose provocation. It is evident that
the proteome is more homogenous at baseline compared to after glucose provocation, indicating that there is a
biological variation in how the subjects respond to the provocation. Two subgroups were identified after glucose
provocation, marked with circles. Same tendency to subgroup (including the same subjects who deviated in
Fig. 4) was also seen in Fig. 3 and Supplementary Fig. S3. No apparent explanation can however be found in the
demographic data of these subjects. Thus, this indicates a biological difference in the response, which should be
further investigating before performing studies on insulin resistant patients.
Endothelial dysfunction affects the microcirculation and it would therefore be of great interest to study the
differences in protein expression after glucose provocation from this study of healthy subjects to a group of insu-
lin resistant patients in the future. This comparison could hopefully shed light on how the skin tissue response
differs between healthy subjects and patients with insulin-dependent diabetes mellitus.
All analyzes in this study are performed with a microvascular perspective. A proteomic study like this gener-
ates an enormous amount of data. In a future study it would be interesting to reuse the material from this study
to investigate other proteins involved in for example metabolic processes.
Limitations. A great advantage with the combination of microdialysis and mass spectrometry is the pos-
sibility to study different target tissues dynamically, which cannot be achieved with sequential biopsies or other
discontinuous sampling methods. There are however some limitations. The low concentration of proteins in the
microdialysate samples makes identification of less abundant components difficult. It is also possible that some
proteins were removed during albumin depletion. Since albumin needs to be added as a colloid to the microdi-
alysate perfusate this step was however crucial, otherwise the albumin would have blocked the identification of
Scientific Reports | (2021) 11:19093 | https://doi.org/10.1038/s41598-021-98672-8 11
Vol.:(0123456789)www.nature.com/scientificreports/
other less abundant proteins. Another limitation of this pilot study is that we have not used additional methods
to verify the findings. Therefore, further studies with a larger sample size are warranted to verify the results.
Furthermore, the proteins adsorbed to the microdialysis membrane have not been taken into consideration in
the present study. It is highly likely that the membranes could provide further information of the microcircula-
tory biomarkers from these compartments following a glucose provocation.
Conclusion
In summary, glucose provocation is known to cause insulin induced vasodilation through the nitric oxide path-
way, and this study indicates that this is facilitated through the interactions of the RAS (angiotensinogen) and
kallikrein-kinin (kininogen-1) systems.
Supplementary Information 1.Supplementary Information 2.Supplementary Information 3.
Received: 28 May 2021; Accepted: 13 September 2021
References
1. Baron, A. D. The coupling of glucose metabolism and perfusion in human skeletal muscle. The potential role of endothelium-
derived nitric oxide. Diabetes 45(Suppl 1), S105-109. https://doi.org/10.2337/diab.45.1.s105 (1996).
2. Cardillo, C. et al. Insulin stimulates both endothelin and nitric oxide activity in the human forearm. Circulation 100, 820–825
(1999).
3. Verma, S., Arikawa, E., Yao, L., Laher, I. & McNeill, J. H. Insulin-induced vasodilation is dependent on tetrahydrobiopterin syn-
thesis. Metabolism 47, 1037–1039. https://doi.org/10.1016/s0026-0495(98)90273-6 (1998).
4. Verma, S. et al. Endothelin antagonism uncovers insulin-mediated vasorelaxation in vitro and in vivo. Hypertension 37, 328–333.
https://doi.org/10.1161/01.hyp.37.2.328 (2001).
5. Eringa, E. C., Stehouwer, C. D., Merlijn, T., Westerhof, N. & Sipkema, P. Physiological concentrations of insulin induce endothelin-
mediated vasoconstriction during inhibition of NOS or PI3-kinase in skeletal muscle arterioles. Cardiovasc. Res. 56, 464–471.
https://doi.org/10.1016/s0008-6363(02)00593-x (2002).
6. Eringa, E. C. et al. Vasoconstrictor effects of insulin in skeletal muscle arterioles are mediated by ERK1/2 activation in endothelium.
Am. J. Physiol. Heart Circ. Physiol. 287, H2043-2048. https://doi.org/10.1152/ajpheart.00067.2004 (2004).
7. Holowatz, L. A., Thompson-Torgerson, C. S. & Kenney, W. L. The human cutaneous circulation as a model of generalized micro-
vascular function. J. Appl. Physiol. 1985(105), 370–372. https://doi.org/10.1152/japplphysiol.00858.2007 (2008).
8. Iredahl, F. et al. Skin glucose metabolism and microvascular blood flow during local insulin delivery and after an oral glucose load.
Microcirculation 23, 597–605. https://doi.org/10.1111/micc.12325 (2016).
9. Hogstedt, A., Iredahl, F., Tesselaar, E. & Farnebo, S. Effect of N(G) -monomethyl l-arginine on microvascular blood flow and
glucose metabolism after an oral glucose load. Microcirculation 27, e12597. https://doi.org/10.1111/micc.12597 (2020).
10. Iredahl, F., Tesselaar, E., Sarker, S., Farnebo, S. & Sjoberg, F. The microvascular response to transdermal iontophoresis of insulin
is mediated by nitric oxide. Microcirculation 20, 717–723. https://doi.org/10.1111/micc.12071 (2013).
11. Iredahl, F., Lofberg, A., Sjoberg, F., Farnebo, S. & Tesselaar, E. Non-invasive measurement of skin microvascular response during
pharmacological and physiological provocations. PLoS ONE 10, e0133760. https://doi.org/10.1371/journal.pone.0133760 (2015).
12. Cracowski, J. L., Minson, C. T., Salvat-Melis, M. & Halliwill, J. R. Methodological issues in the assessment of skin microvascular
endothelial function in humans. Trends Pharmacol. Sci. 27, 503–508. https://doi.org/10.1016/j.tips.2006.07.008 (2006).
13. Ungerstedt, U. Microdialysis–principles and applications for studies in animals and man. J. Intern. Med. 230, 365–373 (1991).
14. Hogstedt, A., Ghafouri, B., Tesselaar, E. & Farnebo, S. Sampling insulin in different tissue compartments using microdialysis:
Methodological aspects. Sci. Rep. 10, 21948. https://doi.org/10.1038/s41598-020-78728-x (2020).
15. Gill, C. et al. A qualitative and quantitative proteomic study of human microdialysate and the cutaneous response to injury. AAPS
J. 13, 309–317. https://doi.org/10.1208/s12248-011-9269-6 (2011).
16. Petersen, L. J., Sorensen, M. A., Codrea, M. C., Zacho, H. D. & Bendixen, E. Large pore dermal microdialysis and liquid chroma-
tography-tandem mass spectroscopy shotgun proteomic analysis: A feasibility study. Skin Res. Technol. 19, 424–431. https://doi.
org/10.1111/srt.12063 (2013).
17. Fryk, E. et al. Microdialysis and proteomics of subcutaneous interstitial fluid reveals increased galectin-1 in type 2 diabetes patients.
Metabolism 65, 998–1006. https://doi.org/10.1016/j.metabol.2016.04.003 (2016).
18. Cox, J. et al. Accurate proteome-wide label-free quantification by delayed normalization and maximal peptide ratio extraction,
termed MaxLFQ. Mol. Cell Proteom. 13, 2513–2526. https://doi.org/10.1074/mcp.M113.031591 (2014).
19. Olausson, P. et al. Protein alterations in women with chronic widespread pain: An explorative proteomic study of the trapezius
muscle. Sci. Rep. 5, 11894. https://doi.org/10.1038/srep11894 (2015).
20. Wheelock, A. M. & Wheelock, C. E. Trials and tribulations of ’omics data analysis: Assessing quality of SIMCA-based multivariate
models using examples from pulmonary medicine. Mol. Biosyst. 9, 2589–2596. https://doi.org/10.1039/c3mb70194h (2013).
21. Eriksson, L. et al. Multi- and Megavariate Data Analysis: Basic Principles and Applications (MKS Umetrics AB, 2013).
22. Szklarczyk, D. et al. STRING v11: Protein-protein association networks with increased coverage, supporting functional discovery
in genome-wide experimental datasets. Nucl. Acids Res. 47, D607–D613. https://doi.org/10.1093/nar/gky1131 (2019).
23. Samuelsson, A., Steinvall, I. & Sjoberg, F. Microdialysis shows metabolic effects in skin during fluid resuscitation in burn-injured
patients. Crit. Care 10, R172. https://doi.org/10.1186/cc5124 (2006).
24. UniProt Knowledgebase. Kininogen-1 P01042 (KNG1_HUMAN) https://www.uniprot.org/uniprot/P01042. (2021).
25. Sainz, I. M., Pixley, R. A. & Colman, R. W. Fifty years of research on the plasma kallikrein-kinin system: From protein structure
and function to cell biology and in-vivo pathophysiology. Thromb. Haemost. 98, 77–83 (2007).
26. Cassim, B., Mody, G. & Bhoola, K. Kallikrein cascade and cytokines in inflamed joints. Pharmacol. Ther. 94, 1–34. https://doi.org/
10.1016/s0163-7258(02)00166-3 (2002).
27. Wu, Y. Contact pathway of coagulation and inflammation. Thromb. J. 13, 17. https://doi.org/10.1186/s12959-015-0048-y (2015).
28. Zhao, Y. et al. Assembly and activation of HK-PK complex on endothelial cells results in bradykinin liberation and NO formation.
Am. J. Physiol. Heart Circ. Physiol. 280, H1821-1829. https://doi.org/10.1152/ajpheart.2001.280.4.H1821 (2001).
29. UniProt Knowledgebase. Angiotensinogen P01019 (ANGT_HUMAN) https://www.uniprot.org/uniprot/P01019. (2021).
30. Miranda, A. S. & Simoes, E. S. A. C. Serum levels of angiotensin converting enzyme as a biomarker of liver fibrosis. World J. Gas-
troenterol. 23, 8439–8442. https://doi.org/10.3748/wjg.v23.i48.8439 (2017).
31. Wu, C., Lu, H., Cassis, L. A. & Daugherty, A. Molecular and pathophysiological features of angiotensinogen: A mini review. N.
Am. J. Med. Sci. (Boston) 4, 183–190. https://doi.org/10.7156/v4i4p183 (2011).
32. Xu, Y., Rong, J. & Zhang, Z. The emerging role of angiotensinogen in cardiovascular diseases. J. Cell Physiol. 236, 68–78. https://
doi.org/10.1002/jcp.29889 (2021).
Scientific Reports | (2021) 11:19093 | https://doi.org/10.1038/s41598-021-98672-8 12
Vol:.(1234567890)www.nature.com/scientificreports/
33. Schorr, U., Blaschke, K., Turan, S., Distler, A. & Sharma, A. M. Relationship between angiotensinogen, leptin and blood pressure
levels in young normotensive men. J. Hypertens 16, 1475–1480. https://doi.org/10.1097/00004872-199816100-00011 (1998).
34. Yayama, K. & Okamoto, H. Angiotensin II-induced vasodilation via type 2 receptor: Role of bradykinin and nitric oxide. Int.
Immunopharmacol. 8, 312–318. https://doi.org/10.1016/j.intimp.2007.06.012 (2008).
35. Ntaios, G., Gatselis, N. K., Makaritsis, K. & Dalekos, G. N. Adipokines as mediators of endothelial function and atherosclerosis.
Atherosclerosis 227, 216–221. https://doi.org/10.1016/j.atherosclerosis.2012.12.029 (2013).
36. Egan, B. M., Greene, E. L. & Goodfriend, T. L. Insulin resistance and cardiovascular disease. Am. J. Hypertens 14, 116S-125S.
https://doi.org/10.1016/s0895-7061(01)02078-7 (2001).
37. Jones, B. H., Standridge, M. K., Taylor, J. W. & Moustaid, N. Angiotensinogen gene expression in adipose tissue: Analysis of obese
models and hormonal and nutritional control. Am. J. Physiol. 273, R236-242. https://doi.org/10.1152/ajpregu.1997.273.1.R236
(1997).
38. Jaffa, A. A. et al. Plasma prekallikrein: A risk marker for hypertension and nephropathy in type 1 diabetes. Diabetes 52, 1215–1221.
https://doi.org/10.2337/diabetes.52.5.1215 (2003).
39. Jaffa, M. A. et al. Plasma prekallikrein is associated with carotid intima-media thickness in type 1 diabetes. Diabetes 65, 498–502.
https://doi.org/10.2337/db15-0930 (2016).
40. Al Hariri, M. et al. Proteome profiling in the aorta and kidney of type 1 diabetic rats. PLoS ONE 12, e0187752. https://doi.org/10.
1371/journal.pone.0187752 (2017).
41. Schremmer-Danninger, E. et al. Visualisation of tissue kallikrein, kininogen and kinin receptors in human skin following trauma
and in dermal diseases. Biol. Chem. 385, 1069–1076. https://doi.org/10.1515/BC.2004.138 (2004).
42. Steckelings, U. M. et al. Human skin: Source of and target organ for angiotensin II. Exp. Dermatol. 13, 148–154. https://doi.org/
10.1111/j.0906-6705.2004.0139.x (2004).
43. UniProt Knowledgebase. Alpha-2-HS-glycoprotein P02765 (FETUA_HUMAN). https://w ww.u
nipro
t.o
rg/u
nipro
t/P
02765. (2021).
44. Ou, H. Y. et al. Serum fetuin-A concentrations are elevated in subjects with impaired glucose tolerance and newly diagnosed type
2 diabetes. Clin. Endocrinol. (Oxf). 75, 450–455. https://doi.org/10.1111/j.1365-2265.2011.04070.x (2011).
45. Stefan, N. et al. Alpha2-Heremans-Schmid glycoprotein/fetuin-A is associated with insulin resistance and fat accumulation in the
liver in humans. Diabetes Care 29, 853–857. https://doi.org/10.2337/diacare.29.04.06.dc05-1938 (2006).
46. Stefan, N. et al. Plasma fetuin-A levels and the risk of type 2 diabetes. Diabetes 57, 2762–2767. https://doi.org/10.2337/db08-0538
(2008).
47. Haukeland, J. W. et al. Fetuin A in nonalcoholic fatty liver disease: In vivo and in vitro studies. Eur. J. Endocrinol. 166, 503–510.
https://doi.org/10.1530/EJE-11-0864 (2012).
48. Mori, K., Emoto, M. & Inaba, M. Fetuin-A: A multifunctional protein. Recent Pat. Endocr. Metab. Immune Drug Discov. 5, 124–146.
https://doi.org/10.2174/187221411799015372 (2011).
Author contributions
Conceived and designed the experiments: A.H., B.G., E.T., S.F. Performed the experiments: A.H. Analyzed/
interpreted the data: A.H., B.G., E.T., S.F. Wrote the paper: A.H., B.G., E.T., S.F.
Funding
Open access funding provided by Linköping University. The study has been financially supported by ALF grants,
Region Östergötland, Linköping.
Competing interests
The authors declare no competing interests.
Additional information
Supplementary Information The online version contains supplementary material available at https://doi.org/
10.1038/s41598-021-98672-8.
Correspondence and requests for materials should be addressed to A.H.
Reprints and permissions information is available at www.nature.com/reprints.
Publisher’s note Springer Nature remains neutral with regard to jurisdictional claims in published maps and
institutional affiliations.
Open Access This article is licensed under a Creative Commons Attribution 4.0 International
License, which permits use, sharing, adaptation, distribution and reproduction in any medium or
format, as long as you give appropriate credit to the original author(s) and the source, provide a link to the
Creative Commons licence, and indicate if changes were made. The images or other third party material in this
article are included in the article’s Creative Commons licence, unless indicated otherwise in a credit line to the
material. If material is not included in the article’s Creative Commons licence and your intended use is not
permitted by statutory regulation or exceeds the permitted use, you will need to obtain permission directly from
the copyright holder. To view a copy of this licence, visit http://creativecommons.org/licenses/by/4.0/.
© The Author(s) 2021
Scientific Reports | (2021) 11:19093 | https://doi.org/10.1038/s41598-021-98672-8 13
Vol.:(0123456789)You can also read


