Investigation of the condominium building collapse in Surfside, Florida: A video feature tracking approach
←
→
Page content transcription
If your browser does not render page correctly, please read the page content below
Investigation of the condominium building collapse in Surfside, Florida: A
                        video feature tracking approach
                                       Xiangxiong Kong
           Department of Physics and Engineering Science, Coastal Carolina University
                       P.O. Box 261954, Conway, SC, USA 29528-6054

                                          Danny Smyl
             Department of Civil and Structural Engineering, University of Sheffield
              Sir Frederick Mappin Building, Mappin Street, Sheffield, UK, S1 3JD
  Department of Civil, Coastal, and Environmental Engineering, University of South Alabama
             150 Student Services Drive, Shelby Hall 3142, Mobile, AL, USA 36688

Abstract
On June 24, 2021, a 12-story condominium building (Champlain Towers South) in Surfside,
Florida partially collapsed, resulting in one of the deadliest building collapses in United States
history with 98 people confirmed deceased. In this work, we analyze the collapse event using a
video clip that is publicly available from social media. In our analysis, we apply computer vision
algorithms to corroborate new information from the video clip that may not be readily interpreted
by human eyes. By comparing the differential features against different video frames, our proposed
method is used to quantify the falling structural components by mapping the directions and
magnitudes of their movements. We demonstrate the potential of this video processing
methodology in investigations of catastrophic structural failures and hope our approach may serve
as a basis for further investigations into structure collapse events.

                                                1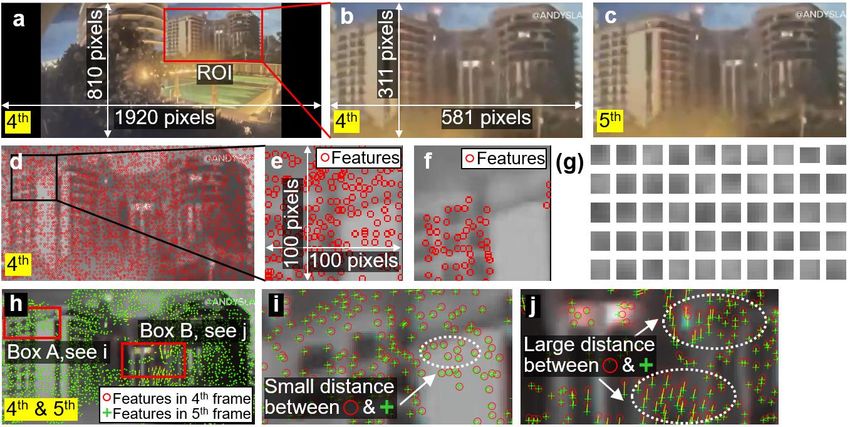
1. Introduction
Structural engineering is critical to our society for enabling safe, efficient, and economical designs
to resist the gravity load and loads caused by natural or man-made disasters. Despite significant
efforts made in improving the structural design, catastrophic structural failures remain an
unfortunate reality [1, 2, 3, 4, 5, 6]. The most recent such event in the United States is the partial
collapse of the 12-story condominium building (Champlain Towers South) in Surfside, Florida on
June 24, 2021 [7]. This is one of the deadliest building collapses in American history with 98
people are confirmed deceased as of July 22, 2021.
To date, extensive efforts have been made into studying the failure mechanisms of civil structures.
One engineering approach is to numerically simulate the structure collapse behavior against
extreme structural loads (e.g., strong ground motions, extreme blast loads) through finite element
methods [8, 9, 10]. As a result, outputs such as stresses, strains, force, and deformations of the
structural members as well as floor accelerations and story drifts can be generated from the
numerical model. For instance, Xu et al. [8] investigated the internal force redistribution by
simulating the progressive collapse of a dome structure. The changes in strains of truss members
and displacements of joints were illustrated after critical structural members were removed from
the numerical model. Nevertheless, numerical simulation methods are prone to error [11] due to
the uncertainties in determining multiple model constraints such as nonlinear properties of the
engineering materials [12], lack of considerations of geometric imperfections [8, 9], and
convergence issues in computational algorithms [10].
Alternatively, performing experimental tests [12, 13, 14, 15] in the structural laboratories can
obtain a more comprehensive understanding of the structure collapse by directly taking
measurements of the critical locations from structures. Depending on the types of the structures
and/or purpose of the studies, such measurements include the quantification of concrete strains,
crack geometries, and spalling [12, 14]; masonry cracks [16]; steel buckling and fracture [8];
connection failures [14]; loads and displacements of structural members [13, 14]; and floor
accelerations [15]. One limitation of experimental tests, however, lies in the realization that
structural models are built via reduced-scale structural components (e.g., beams, columns, slabs,
braces, connections, etc.), or substructures (i.e., a small portion of the full structure) for budget
considerations. As a result, the experimental findings are bound to limited scopes due to size
effects [16]. Conversely, full-scale structural tests can address this concern. However, few studies
have been carried out as they are extremely costly and experimentally difficult to perform [17].
In-situ post-disaster inspections, on the other hand, can be used in attaining first-hand knowledge
of the structural failure(s), hence have been considered as effective engineering approaches for
structural failure investigations. For instance, Lin et al. [18] surveyed geosynthetic-reinforced soil
structures after the 1999 Ji-Ji earthquake in Taiwan and identified the cause of structural failure.
Ghasemi et al. [19] visited multiple sites of bridges and tunnels after Kocaeli earthquake in Turkey
and find structural damages during their investigation. Miller [20] summarized the cause of welded
connection failures through steel building inspections after the Northridge earthquake. Thereafter,

                                                  2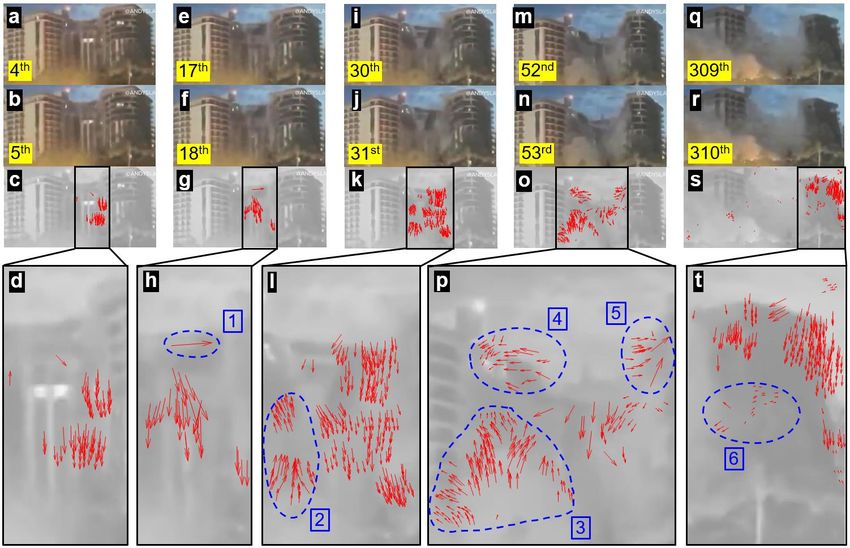
improvements on structural design have been adopted in revisions of building design codes [21].
A concern of post-disaster inspection, however, is that in-situ structure collapse scenes could be
disturbed by structural debris. This makes the forensic investigation extremely challenging and
time-consuming (consider a progressive building collapse scenario where a primary structural
element fails and further results in the failure of adjoining structural elements).
Recently, with the rapid commercialization and technological development of consumer-grade
digital cameras and the boom of social network platforms, the events of in-situ structural failures
can be filmed by cameras and further accessed by the public. The in-situ video clips, if available,
become a new data source containing valuable spatial-temporal information critical in
understanding progressive structural failures. Indeed, the extraction of visual information from in-
situ video clips can provide direct knowledge of the structural failure behaviors, quantify
characteristics of the structural failures, assist in identifying the failure causes, and help first
responders to prioritize their efforts in rescue searches.
In this paper, we propose a novel computer vision-based methodology to evaluate the structural
collapse of the condominium building in Surfside, Florida. We utilize a video clip of the building
collapse that is publicly available from social media, and further apply computer vision algorithms
to identify and quantify the falling structural components. The remainder of the paper is structured
as follows: Section 2 reviews related work in the literature and overviews the technical
contributions of this study; Section 3 demonstrates the research methodology for video processing
through a series of vision-based computational algorithms; Section 4 illustrates and discusses the
analysis results; Section 5 concludes the study and elaborates the future work.
2. Related Work
2.1 Vision-Based SHM
Structural health monitoring (SHM) is a proven and effective diagnostic tool in risk assessments
and disaster mitigation in civil, mechanical, and aerospace structures. Traditionally, SHM methods
rely on sensors to collect measurements of the structure (e.g., vibration signals [22, 23], surface
strains [24, 25]). More recently, a paradigm shift points towards the next generation SHM of civil
structures, consisting of non-contact, computer vision-based technologies [26]. Compared with
contact-based methods, vision-based SHM technologies incorporate the coupled use of digital
images and vision algorithms for image processing and pattern recognition, leading to robust, rapid,
low-cost methodologies for damage detection and risk mitigation.
To this end, Cha et al. [27] integrated computer vision with deep learning in the context of concrete
crack detection in civil structures. In later work, the proposed method was extended in detecting
multiple structural deteriorations [28] (i.e., concrete cracks, delamination and corrosions of steel
surfaces, and bolt corrections). Narazaki et al. [29 ] leveraged machine learning and pattern
recognition to separate different structural components in bridges using a limited amount of
training data, serving as the foundation for an automating visual inspection methodology for a
rapid post-disaster response. Yang et al. [ 30] proposed a novel method using video motion
magnification to measure the vibration modes of a three-story reduced-scale structure in the
                                                 3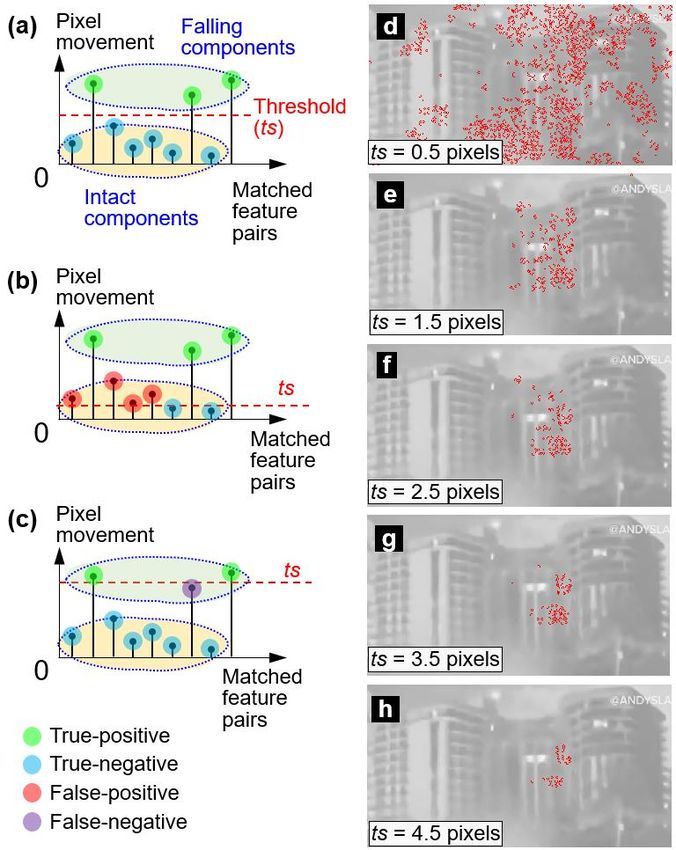
laboratory. The proposed method can identify weakly-excited mode using digital videos. Yeum
and Dyke [31] established a vision-based methodology for detecting steel cracks in bridge girders.
For a comprehensive overview on this subject, the reader is referred to [32, 33, 34] regarding the
recent advances in vision-based SHM.
2.2 Video Feature Tracking
Among many vision-based techniques, video feature tracking is one of the fundamental problems
in computer vision and has been well studied for a few decades [35]. Nevertheless, video feature
tracking had not yet attracted significant attention within the field of vision-based SHM until the
last decade. Fukuda et al. [36, 37] were one of the earliest researchers to apply a feature tracking
technique for bridge displacement measurements under service loads through video collected by a
digital camera. In [36], the proposed method was validated by measuring the vibration of a
reduced-scale building frame in the laboratory and a steel girder bridge in the field. Displacements
obtained through the vision-based method were found to corroborate well with the results from
laser vibrometers and displacement transducers. Similar work that leveraged feature tracking in
displacement monitoring has been reported in [38, 39, 40, 41].
Authors previously extended the knowledge of feature tracking from vibration measurement into
the area of damage detection of civil structures. In [42], a video feature tracking methodology was
established to differentiate the surface motion patterns of cracked and non-cracking regions. As a
result, steel fatigue cracks can be consistently identified from video scenes via the utilization of
different lighting conditions, surface textures, and camera orientations. Later, this method was
improved by the authors through integrating feature tracking with image registration methods for
crack detection [43]. Instead of using a video clip, the improved method only relied on two images
for finding the breathing behavior of the crack, leading to more robust and accurate crack detection
results. Lastly, a similar feature tracking-based method was established in detecting the loosened
steel bolts through scanning the entire image scene and identifying the differential visual features
provoked by bolt head rotations [44].
To compare feature tracking-based structural vibrations methods against authors’ previous work,
one major difference is that vision-based SHM methods for vibration monitoring [36, 37, 38, 39,
40, 41] are based on tracking the visual feature movements of structural members in one or
multiple predefined small regions in the image scene. The focus of these studies is to obtain the
time-domain vibration measurements of the structural members. In contrast, the authors’ methods
in [42, 43, 44] leverage feature tracking as a tool to scan the entire image scene, uncovering tiny
pixel movements of visual features against two or multiple images that are provoked by subtle
differential changes that may not be distinguished by human eyes. As a result, structural damage
can be intuitively shown by highlighting the damage locations (e.g., cracks and loosened bolts).
Despite the efforts made in the authors’ previous work, the potential of feature tracking techniques
in solving other engineering problems of vision-based SHM (particularly in structure collapse
investigations) has not been studied in the literature hence remains unknown.

                                                 4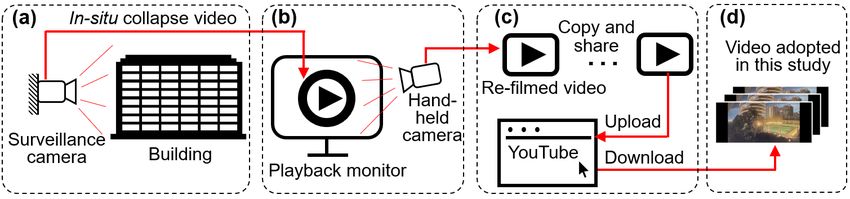
2.3 Remote Sensing in Disaster Mitigation
Recently, remote sensing technologies have shown increasing attention in disaster mitigation of
civil structures. For instance, Miura et al. [45] trained a convolutional neural network for detecting
collapsed buildings from aerial images collected after two earthquakes in Japan. The proposed
method has been validated by quantifying the collapsed buildings at a community level. Similar
methods were reported by Valentijn et al. [46], Kalantar et al. [47], and Huang et al. [48]. Instead
of using aerial images, Yeum et al. [49] and Pan et al. [50] investigated building interior and façade
images and developed deep learning algorithms to detect post-disaster structural damages.
The methods discussed above are based on algorithms developed upon post-disaster images. The
potential of these methods in applying in-situ images or videos that are collected during disaster
events has not been explored in these studies. To address this concern, Rigby et al. [51], Diaz [52],
and Aouad et al. [53] estimated the yield of the 2020 Beirut explosion based on in-situ videos and
images downloaded from social media. Results from these studies showed encouraging findings
by extracting new information from in-situ disaster images and videos, which offered factual
evidence to assist the public and stakeholders for border discussions. Muhammad et al. [54, 55]
trained deep learning algorithms to detect building fires from in-situ surveillance video footage,
based on which first responders can control the fire disasters promptly, thus avoiding economic
losses. Park et al. [56] proposed a vision-based method to estimate flood depth using images that
contain flooded vehicles. Despite the successes reported in these investigations, there remains a
dearth of literature regarding the integration of vision-based algorithms in investigating building
collapse events.
2.4 Citizen Participation and Citizen Sensors
One unique feature of the studies discussed above [51, 52, 53, 54, 55, 56] is that the data are often
collected and distributed by the general public. Citizen participation in data collection and
distribution can significantly broaden the quantity of data sources, through which useful
information can be uncovered thus becomes particularly critical for disaster mitigations. For
example, the “Did You Feel It?” (DYFI) system [57, 58] developed by the US Geological
Survey (USGS) have collected more than five million individual DYFI intensity reports from the
general public after seismic events in the past two decades, based on which high-quality
macroseismic intensity (MI) maps can be created immediately after earthquake disasters. Similar
efforts have been reported in the literature such as iShake [59] and the Quake-Catcher Network
(QCN) [60]. Feng et al. [ 61] investigated smartphone accelerometers as citizen sensors for
measuring the vibrations of civil structures in both laboratory and field. The results showed the
benefits of these citizen sensors over traditional SHM sensors (considering installation and data
acquisition dependencies). Thus, implementing this methodology to a target structure on a routine
monitoring basis can be easily achieved.
Despite encouraging research findings through citizen participation, one challenge is how to
establish effective computational algorithms for processing citizen-collected SHM data with
undesirable data qualities. The general public usually has little or no knowledge about data

                                                  5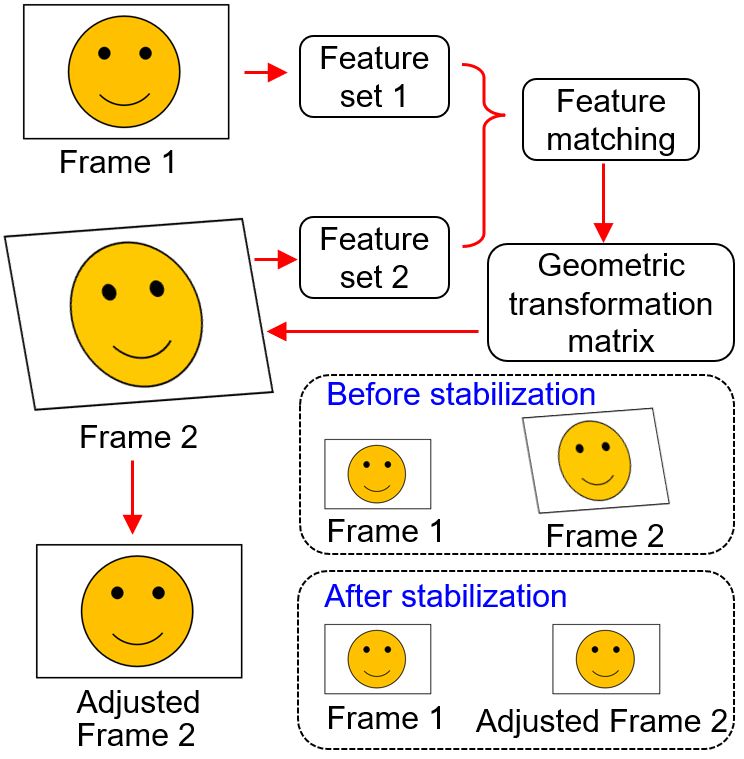
collection compared with experienced researchers or engineers. This becomes a particular concern
in vision-based SHM as the collection of digital images and videos must (generally) follow a
predefined data collection protocol. For instance, in studies of vision-based SHM for measuring
structural vibrations [36, 37, 38, 39, 40, 41], the video clips were collected by high-fidelity digital
cameras under delicate test configurations through enabling reasonable image resolutions, setting
up suitable camera shot angles, stabilizing cameras using tripods, adding artificial targets for
feature tracking, and/or manipulating suitable lighting conditions. Furthermore, researchers can
always recollect videos and images (as many times as they wish) if the data quality is not ideal or
the test configuration needs to be improved.
In contrast, the building collapse video adopted in this study (will be discussed in Section 3) was
originally extracted from a low-quality surveillance camera and then re-filmed by a hand-held
camera. Since neither the owner of the surveillance camera nor the recorder operating the hand-
held camera has been trained in professional data collection, the video clip adopted in this study
has undesirable qualities in many aspects as itemized below:
   •   This surveillance camera was intended to capture human activities in the foreground rather
       than the collapsed building located far from the camera. The Champlain Towers South was
       not the major consideration factor when the camera view was set up during the camera
       installation.
   •   The video quality and image resolution have been negatively affected during the re-filming
       and redistribution over the internet. As demonstrated in Section 3, the cropped image of
       the Champlain Towers South is only 581 pixels by 311 pixels, which is much less than the
       data used in many existing vision-based feature tracking studies in the field.
   •   The video was collected at night under a dark lighting condition. This environment is
       substantially different than well-designed experiments, whereby there were no artificial
       targets installed on the building façade to assist feature tracking.
   •   The video clip was subjected to a camera movement caused by the operator during re-
       filming. These further induced uncertainties in feature tracking as the feature movements
       could be caused by falling structural components and camera movements. An additional
       strategy is therefore needed to eliminate camera movements.
Based on the former realizations, there exists a clear research gap in the literature to leverage
computer vision algorithms to process low-quality SHM data. Although some researchers [62]
have investigated the performance of vision sensors when images or videos are highly compressed,
these images or videos are collected in the laboratory under controlled environments. The potential
of vision-based SHM in extracting information from low-quality videos taken from uncontrolled
test setups has not been fully discussed or explored.
2.5 Contribution
This study aims to fill the research gaps identified in the preceding subsections. The main technical
contributions of this paper are three-fold and are further illustrated below.

                                                  6
First, we extend the knowledge of vision-based feature tracking from applications in structural
vibration monitoring into disaster mitigation of civil structures by investigating a building collapse
event. Unlike vibration monitoring methods, that focus on tracking time history measurements
from small regions in a video scene, the proposed method leverages feature tracking to scan across
the entire scene of interest and directly visualize falling structural components by showing their
movement directions and magnitudes.
Second, we integrate a series of computer vision algorithms to corroborate new information from
an in-situ structural collapse video. In-situ disaster images or videos contain unique information
and may therefore offer new information about the disaster compared with existing investigation
methods of building collapse in the literature (i.e., numerical simulations, experimental tests,
remote sensing using post-disaster images). Although a growing trend has been reported in the use
of in-situ videos and images for disaster investigations, to the best knowledge of the authors, there
is no literature developing a vision-based methodology for building collapse investigations.
Lastly, we integrate the concept of citizen participation into vision-based SHM to explore the
potential of a vision-based methodology through the usage of low-quality data collected under an
uncontrolled environment. Many existing vision-based SHM methods rely on delicate test
configurations for data collection. Few vision-based SHM studies leverage in-situ disaster images
or videos collected by untrained citizens. To this end, we investigate surveillance video footage of
the building collapse that is distributed from social media corrupted by undesirable qualities. We
argue that our investigation may be used to advance the practice of vision-based SHM through the
usage of citizen-collected data.
3. Research Methodology
Figure 1 illustrates a flow chart of the research methodology for this study with section numbers
shown in blue. To begin, Section 3.1 illustrates the detailed protocol for video acquisition by
explaining how the video clip adopted for this study is obtained from social media. Section 3.2
elaborates the technical details of video feature tracking which include three steps: 1) extracting
still images (i.e., video frames) from the video clip and subsequentially resizing the video scene
by cropping the video frame; 2) detecting 2D image features from the video frame; 3) tracking and
pairing detected features against different video frames. Thereafter, Section 3.3 establishes a video
stabilization technique that can eliminate the camera movement from the pixel movements of
matched feature pairs. In Section 3.4, a novel algorithm is proposed to detect the motion provoked
by the falling structural components from the video scene. Lastly, Section 3.5 describes a
visualization method to intuitively show the moving directions and magnitudes of falling structural
components.
7Figure 1. Research methodology for this study. Numbers shown in blue correspond to article subsections.
3.1 Video Acquisition
Figure 2 illustrates the video acquisition procedure. Per ABC Chicago [ 63 ], the video was
originally captured by a surveillance camera installed in an adjacent condominium building. Then
the surveillance video appeared to be displayed on a playback monitor and re-filmed by a hand-
held camera. This can be confirmed by observing the small movements (in both translation and
scaling) in the video scene caused by the camera movement [64]. Next, the re-filmed video clip
was distributed through the internet. Ultimately a copy of this re-filmed video clip was uploaded
to YouTube [64] and a digital copy of this video clip was downloaded by the authors through a
third-party website YouTube Downloader (YT1s.com). Thereafter, this video clip was adopted as
the data source for our study. As of writing this paper, the original surveillance video footage
without camera movement has not yet been made publicly available. After saving the video in the
MP4 format to a local drive, the video clip was found to have an image resolution of 1920 pixels
by 810 pixels with a frame rate of 29.97 frames/sec.
Figure 2. Video acquisition procedure. (a) In-situ video collection; (b) video re-filming; (c) video
distribution; and (d) video adopted in this study.
3.2 Video Feature Tracking
Figure 3 illustrates, for a representative set of frames, the procedure for video feature including
three components: 1) video frame preparation (Figure 3a to c), 2) feature detection (Figure 3d to
g), and 3) feature tracking (Figure 3h to j). Below are detailed explanations of each component.
8Figure 3. Video feature tracking: (a) the original 4th video frame; (b) the cropped 4th video frame under ROI;
(c) the 5th video frame under ROI; (d) Shi-Tomasi features of the 4th video frame under ROI; (e) the blow-
up view with all Shi-Tomasi features; (f) the blow-up view of the 50 strongest Shi-Tomasi features; (g)
image patches of the 50 most distinguishable Shi-Tomasi features; (h) matched feature pairs between 4th
and 5th video frames under ROI; (i) matched feature pairs in the blow-up view of red box A; and (j) matched
feature pairs in the blow-up view of red box B. The label at the lower-left corner with yellow background
indicates the video frame number.
Video frame preparation starts with extracting a total of 723 video frames (i.e., still images) from
the video clip. To uncover the differential changes of visual features against different video frames,
two adjacent video frames are selected. For illustration, here we adopt the 4th and 5th frames at the
beginning of the video clip in this section while video frames from other time instants of the video
clip will be illustrated in Section 4. The 4th video frame is first shown in Figure 3a and is then
cropped using a region of interest (ROI) (see the red box in the figure). The boundary of the ROI
is manually defined to quantify the video scene of the Champlain Towers South. The ROI has a
dimensionality of 581 pixels by 311 pixels and the 4th frame after applying the ROI is shown in
Figure 3. The same ROI is applied to the 5th video frame and the cropped image is shown in Figure
3c. Applying ROIs for cropping video frames can remove unnecessary objects (i.e., the adjacent
building, the playground, plants, light posts) from the video scene such that feature detection and
tracking (explained later in this section) can be applied to the scene of the Champlain Towers
South only.
In terms of feature detection, the ROI of the 4th video frame (Figure 3b) is first converted from
RGB channels into a grayscale image. Then, Shi-Tomasi features [65] (red circles in Figure 3d)
are extracted in the ROI. The feature point describes a location where its adjacent area has unique
intensity changes that are invariant against image translation, rotation, and scaling; hence the same
feature point can be consistently found and paired in different video frames. In addition to Shi-
Tomasi features, other common 2D image features include features from accelerated segment test
9(FAST) [66], Harris-Stephens [67], binary robust invariant scalable keypoints (BRISK) [68] and
speeded up robust features (SURF) [69]. The comparison of these features in image matching in
vision-based SHM problems is investigated in [44]. To better demonstrate the concept of feature
detection, Figure 3e shows all the detected Shi-Tomasi features within an area of 100 pixels by
100 pixels under a blow-up view. Figure 3f further lists the 50 most distinguishable Shi-Tomasi
features, and their adjacent areas are plotted as small image patches (5 pixels by 5 pixels) in Figure
3g.
For feature tracking, we apply the Kanade-Lucas-Tomasi (KLT) tracker [70, 71] to the ROIs of
the 4th and 5th video frames. The KLT tracker obtains the information of feature points in the 4th
video frame (Figure 3d) and actively scans the same ROI of the 5th video frame (in grayscale) to
match feature points with similar intensity changes. Figure 3h shows all matched feature pairs as
a result of KLT tracking, where red circles are matched features in the 4th video frame; and green
crosses are the matched features in the 5th frame. To better illustrate the feature tracking details,
two areas are selected in Figure 3h including 1) the top-left area (red box A) of the building
complex where no structural movement occurs in between these two frames (Figure 3i), and 2) the
mid-height of the middle section of the building complex (red box B) where movements of
matched feature pairs can be found due to motions of falling structural components (Figure 3j).
3.3 Video Stabilization
The large movements observed in Figure 3j may contain movements of both falling structural
components and the hand-held camera. To deal with this, we herein apply a video stabilization
method to eliminate the camera movement and its protocol is illustrated in Figure 4. To explain,
suppose two video frames (Frames 1 and 2) are extracted from a video clip taken by a hand-held
camera about a still scene. Due to the camera movement provoked by hands, Frame 2 is under a
different image coordinate system than Frame 1, being subjected to an image (out-of-plane)
rotation, translation, and scale (caused by camera zoom-in). The video stabilization protocol starts
by detecting features from both video frames. Then, these features are paired together using the
video feature tracking methodology explained in Section 3.2. Thereafter, a geometric
transformation matrix is established [72] using matched feature pairs. The matrix describes the
geometric relationship of image coordinate systems of two video frames. Next, we treat Frame 1
as the reference image and apply the geometric transformation matrix to Frame 2. As a result,
Frame 2 can be recovered to the same coordinate system as Frame 1, and the camera movement
induced between two frames hence is eliminated.
10Figure 4. Video stabilization flowchart
The results after applying the video stabilization method to the building collapse video clip are
shown in Figure 5. To this end, the geometric transformation matrix is first established through
the matched feature pairs between the 4th and 5th video frames in Figure 3h. Then, the matrix is
applied to the 5th video frame to recover it to the same image coordinate system as the 4th video
frame. Figure 5a shows the matched feature pairs between the 4th video frame and the recovered
5th video frame after video stabilization, where all feature locations of the 5th video frame have
been slightly adjusted. To distinguish the location changes of features, we use red circles, green
crosses, and yellow crosses to represent features in the 4th video frame, features in the 5th video
frame before video stabilization, and features in the recovered 5th video frame after video
stabilization.
To further evaluate the outcome of video stabilization, two small areas are quantified from the
video scene in Figure 5 using red boxes C and D. Matched feature pairs of these areas before and
after video stabilization are illustrated in Figure 5b to e. As can be seen from Figure 5b, small pixel
movements can be found among all matched feature pairs. Such movements are solely provoked
by camera movement during re-filming as the structural components under this area are intact
during the collapse event. After video stabilization is applied, the pixel movements can be
successfully eliminated as shown in Figure 5c.
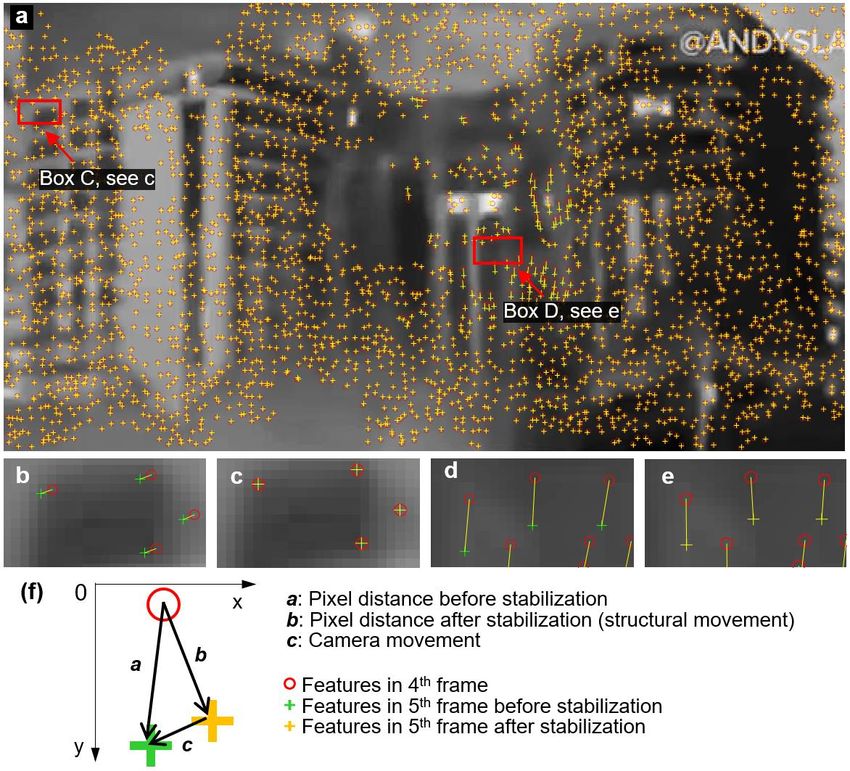
11Figure 5. The matched feature pairs between the 4th and the recovered 5th video frames after video
stabilization are shown in (a). Two areas are quantified using red boxes C and D and their blow-up views
are shown in (c) and (e), respectively. To compare the performance of video stabilization, the blow-up
views of the same areas (i.e., red box C and D) before video stabilization are extracted from results in Figure
3h and they are shown as (b) and (d), respectively. The decomposition of pixel movements of matched
feature pairs in red box D is illustrated in (f).
On the other hand, large pixel movements can be found in red box D where structural components
are falling. To investigate the feature movements in this area, we denoted a as the feature
movement of the 4th and 5th video frames before video stabilization (see Figure 5f). Then a can be
decomposed into the summation of two vectors: movement caused by falling structural
components b and camera movement c. After video stabilization is applied to the 5th video frame,
the camera movement c is eliminated. The movement that remained between the feature in the 4th
video frame (red circle) and the feature in the recovered 5th video frame (yellow cross) is the
structural movement b, hence shall be considered as the movement provoked by the falling
12structural components. This phenomenon can be also verified through the blow-up views in Figure
5d and e.
3.4 Identification of the Falling Components
Figure 6a provides a schematic diagram to illustrate a methodology for finding the falling
structural components during the building collapse. To explain, we treat the pixel movements of
matched feature pairs after video stabilization (Figure 5a) as robust indicators for identifying
structural motion. The feature points located in the falling components usually have large
movements (see Figure 5e after video stabilization). In contrast, the feature points around intact
areas of the building complex are subjected to extremely small movements (see Figure 5c). By
applying a cutoff threshold ts and hiding these features that are below ts, the remainder of features
can be highlighted in the video scene to identify the falling components.
Figure 6. Methodology for identifying the falling structural components with different cutoff thresholds ts
are shown in (a), (b), and (c). Results after applying different ts are shown in (d) to (h), respectively. The
background images from (d) to (h) are taken from the 4th video frame with image brightness adjusted for
the illustration purpose.
13The cutoff threshold ts is highly related to the moving magnitudes of the falling components. For
instance, a building section that just starts to collapse would yield much smaller pixel movements
than the movements caused by these components that fall for a while with large velocities.
Sometimes, the combination of these two situations may appear in one scene simultaneously. Since
the moving magnitudes of structural components are not usually known as a priori, challenges
exist in predetermining a suitable value of ts. As shown in Figure 6b, a low ts could produce false-
positive results by incorrectly identifying features with extremely small pixel movements in the
intact areas. On the other hand, a large ts could accidentally cut off features with small pixel
movements caused by the falling components, leading to false-negative detection results as shown
in Figure 6c.
To address this concern, here we adopt an iteration procedure by applying different values of ts
and then select a suitable ts based on observations. Figure 6d to h show the matched feature pairs
after applying different ts. For illustration purpose, only features from the 4th video frame are
shown. As can be found in the figures, a low ts yield false-positive identification results (see Figure
6d); while a high ts can produce filter out true positive results with small pixel movements (see
Figure 6h) hence less falling components are detected. To balance the trade-off, ts is selected as
3.5 pixels for the rest of the video processing in Section 3.
3.5 Quantification of the Falling Components
Figure 7a to c demonstrate the method for quantifying the falling components. To visualize the
falling structural components, matched feature pairs between the 4th and 5th video frames are
replaced by arrows. The arrows start from the matched feature point in the 4th frame and point to
the matched feature point in the 5th frame. The magnitudes of the arrows are the distances of image
coordinates between matched feature pairs (Figure 7b). Because feature movements are usually
very small (e.g., only a few pixels), here we amplify the arrow lengths by multiplying a unified
scaling factor as shown in Figure 7c, enabling a more intuitive way of viewing the result
graphically. Next, we apply this method to all matched feature pairs in Figure 6e after the cutoff
threshold (ts = 3.5 pixels) is applied. The results are shown in Figure 7d and e. The benefit of using
arrows is two-fold: 1) they indicate the directions structural components moved; and 2) the
magnitudes of arrows qualitatively represent the distances of matched feature pairs moved within
a one video frame interval (i.e., the arrow magnitude indicates the velocities of the falling
component).
14Figure 7. (a) Two matched feature pairs between the 4th and 5th video frames; (b) the matched feature pairs
are replaced by two arrows; (c) two arrows after applying a scaling factor; (d) arrows created in 4th video
frame; (e) the blow-up view of the arrows. The background images in d and e are taken from the 4th video
frame with its image brightness adjusted for the illustration purpose.
4. Preliminary Results and Discussions
We identify five building collapse instants across the video clip that depict critical moments of
building collapse. For each instant, two adjacent video frames are selected for video processing
using MATLAB [73]. As shown in Table 1, the corresponding timelines of selected video frames
are calculated using a frame rate of 29.97 frames/sec. The selected video frames and analysis
results are summarized in Figure 8.
Table 1: Matrix for video processing
Video frame Timeline Result
Instant 1 4th and 5th 0.13 and 0.17 seconds Figure 8c
Instant 2 17th and 18th 0.57 and 0.6 seconds Figure 8g
Instant 3 30th and 31st 1 and 1.03 seconds Figure 8k
nd rd
Instant 4 52 and 53 1.73 and 1.77 seconds Figure 8o
Instant 5 309th and 310th 10.3 and 10.33 seconds Figure 8s
As can be found in Figure 8, the middle section of the building complex starts falling at the
beginning of this video clip (see the first, second, and third columns in Figure 8). Consistently, the
red arrows signify the falling structural components and further quantify their moving directions
and magnitudes. Next, additional components in the middle section fall (see the fourth column). It
is worth noting that the camera view is partially obstructed by particulate matter made by the prior
collapsing building debris. Thereafter, the right section of the building complex falls as can be
seen in the last column of the figure.
15Figure 8. Video processing results where Columns 1 to 5 are results for Instants 1 to 5 from the video clip.
The first and second rows are the selected video frames for the analysis; the third row shows the video
analysis results with arrows indicting the moving directions and magnitudes of the falling structural
components; the last row shows blow-up views. The labels at the lower-left corners of the images at the
first and second rows are the video frame numbers. The brightness of images in the third and last rows are
adjusted for the purpose of illustration.
Several areas of the images in the last row in Figure 8 are highlighted by blue dotted circles. In
dotted circle 1, the horizontal arrow may be caused by an incorrect KLT matching and hence may
be considered as the outlier. In dotted circles 2, 3, and 6, arrows are plotted in the upward directions
due to movements of particulate matter (dust and/or smoke). This can be further confirmed by
inspecting the particulates in video frames (e.g., Figure 8i and q). In dotted circle 4, arrows depict
the horizontal movements of the structural components. This is herein considered the correct
detection as the local structural components may be initially attached to the left building section
through reinforcing steel bars in the slabs, which prevent the components from moving downward.
In dotted circle 5, horizontal and upward arrows are plotted. This may be caused by both the
horizontal movements of the structural components and the upward movements of the particulates.
Our approach has serval limitations which require further discussion and elaboration. The key
limitation is that the matched feature pairs cannot be evenly distributed across the entire falling
structural components, leading to a scattered pattern of arrow distributions. This is due to the
difficulty of the KLT tracker in matching the feature points from different video frames. Factors
that can negatively affect the KLT matching capability include the low quality of the surveillance
camera, potential video quality losses during the procedures of video re-filming, distributing, and
16downloading, and the dark lighting condition at night. The second limitation is that our method
fails if the camera view is obstructed by other objects (e.g., particulates). Additionally, the use of
advanced regularization methods, especially sparse (L1 or Total Variation) approaches may
improve video information via the elimination of image artifacts and will be investigated in the
future.
In closing this section, we remark that the video clip adopted in this study provides limited spatial
information in comparison to, for example, high fidelity laboratory data [36, 37, 38, 39, 40, 41].
Namely, because true timestamps are not available, the video playback speed (i.e., timeline) in the
video clip adopted in this study may vary in comparison than the actual event time. Secondly, the
pixel resolution and frame rate of original in-situ surveillance video footage remain unknown.
Lastly, the video clip likely does not capture the initiation of the collapse event (i.e., the
surveillance camera may be triggered by the motion of building collapse, leading to a delay of
camera filming). Notice that our approach solely relies on extracting information from existing
video frames. Resultingly, potential losses of initial video frames would not affect the results of
this study.
5. Conclusions and Future Work
The investigation of a structural collapse requires joint efforts from structural engineers,
government agencies, law enforcement, and other stakeholders. The investigation team needs to
examine every piece of evidence related to the event, among which the in-situ collapse video clip,
if available, is one of the most essential pieces of evidence. Traditionally, structural collapse video
clip/clips is/are usually visually inspected [74]. In this paper, we present a novel video processing
methodology to extract new information from the collapse video clip by showing the directions
and magnitudes of the movements of the falling components. Our method aims to help
investigators in obtaining direct knowledge on the behaviors and mechanisms of the building
collapse.
The proposed method can be implemented in different numerical platforms and the computational
time for generating results from two adjacent frames in this study is about seven seconds using a
workstation with a 2.9 GHz CPU and a 32 GB RAM. These flexibilities allow the proposed method
to be implemented in rescue searching shortly after the building collapse. As shown in the last row
of Figure 8, the proposed method can provide a factual interpretation of the sequence of the
collapsing components (e.g., which portion of the building collapses first hence shall be at the
bottom of the debris). This information could help first responders to prioritize their efforts in the
rescue mission after the disaster.
Recently, with the rapid commercialization and technological development of consumer-grade
digital cameras, structure collapses could be filmed by a variety of means. In addition to
surveillance cameras, other video collection tools may include smartphone cameras, dash cameras
on passing vehicles, body cameras from onsite construction workers, and drones operated by
rescue teams. Further work will focus on investigating the viability of this video processing
methodology in broader applications.
17Acknowledgment
The authors convey condolences to the families affected by the building collapse and want to thank
those who collected the surveillance video footage of the building collapse, and those who shared
and distributed the video clip over social media. The authors also want to thank William Ambrose
for his fruitful discussions; Ariana Baker and Eric Resnis for their help; and anonymous reviewers
for improving the quality of this paper.
Funding
The first author is partially supported by the new faculty start-up research fund from the Gupta
College of Science at Coastal Carolina University. The second author would like to acknowledge
the support via Engineering and Physical Sciences Research Council Project EP/V007025/1.
However, any opinions, findings, and conclusions, or recommendations expressed in this study are
those of the authors and do not necessarily reflect the views of the funders.
Conflicts of Interest
The authors declare no conflict of interest.
Data Availability Statement
The data that support the findings of this study are openly available in the internet sources referred
to in the paper.
References
[1] Hao, S. (2010). I-35W bridge collapse. Journal of Bridge Engineering, 15(5), 608-614.
[2] Malomo, D., Scattarreggia, N., Orgnoni, A., Pinho, R., Moratti, M., & Calvi, G. M. (2020). Numerical
study on the collapse of the Morandi Bridge. Journal of performance of constructed facilities, 34(4),
04020044.
[3] Bažant, Z. P., & Zhou, Y. (2002). Why did the world trade center collapse?—Simple analysis. Journal
of Engineering Mechanics, 128(1), 2-6.
[4] Omenihu, F. C., Onundi, L. O., & Alkali, M. A. (2016). An Analysis of Building collapse in Nigeria
(1971-2016): Challenges for stakeholders. Annals of Borno, 26(1), 113-140.
[5] Marta-Almeida, M., Mendes, R., Amorim, F. N., Cirano, M., & Dias, J. M. (2016). Fundão Dam
collapse: Oceanic dispersion of River Doce after the greatest Brazilian environmental
accident. Marine Pollution Bulletin, 112(1-2), 359-364.
[6] Cohen, J. S. (2013). 51st Street Crane Collapse: Issues in the Investigation during Criminal
Proceedings. In Forensic Engineering 2012: Gateway to a Safer Tomorrow (pp. 342-350).
[7] BBC News, Miami building collapse: What happened, and how quickly?
https://www.bbc.com/news/world-us-canada-57609620
[8] Xu, Y., Han, Q. H., Parke, G. A. R., & Liu, Y. M. (2017). Experimental study and numerical
simulation of the progressive collapse resistance of single-layer latticed domes. Journal of Structural
Engineering, 143(9), 04017121.
18[9] Kong, D. Y., Yang, B., Elchalakani, M., Chen, K., & Ren, L. M. (2020). Progressive collapse
resistance of 3D composite floor system subjected to internal column removal: Experiment and
numerical simulation. Journal of Constructional Steel Research, 172, 106208.
[10] Feng, D. C., Wang, Z., & Wu, G. (2019). Progressive collapse performance analysis of precast
reinforced concrete structures. The Structural Design of Tall and Special Buildings, 28(5), e1588.
[11] Li, S., Zuo, Z., Zhai, C., & Xie, L. (2017). Comparison of static pushover and dynamic analyses
using RC building shaking table experiment. Engineering Structures, 136, 430-440.
[12] Gu, X. L., Zhang, B., Wang, Y., & Wang, X. L. (2021). Experimental investigation and numerical
simulation on progressive collapse resistance of RC frame structures considering beam flange
effects. Journal of Building Engineering, 102797.
[13] Li, H., Cai, X., Zhang, L., Zhang, B., & Wang, W. (2017). Progressive collapse of steel moment-
resisting frame subjected to loss of interior column: Experimental tests. Engineering Structures, 150,
203-220.
[14] Lyu, C. H., Gilbert, B. P., Guan, H., Underhill, I. D., Gunalan, S., & Karampour, H. (2021).
Experimental study on the quasi-static progressive collapse response of post-and-beam mass timber
buildings under an edge column removal scenario. Engineering Structures, 228, 111425.
[15] Tomassetti, U., Correia, A. A., Candeias, P. X., Graziotti, F., & Costa, A. C. (2019). Two-way
bending out-of-plane collapse of a full-scale URM building tested on a shake table. Bulletin of
Earthquake Engineering, 17(4), 2165-2198.
[16] Singhal, V., & Rai, D. C. (2014). Suitability of half-scale burnt clay bricks for shake table tests on
masonry walls. Journal of Materials in Civil Engineering, 26(4), 644-657.
[17] Blakeborough, A., Williams, M. S., Darby, A. P., & Williams, D. M. (2001). The development of
real–time substructure testing. Philosophical Transactions of the Royal Society of London. Series A:
Mathematical, Physical and Engineering Sciences, 359(1786), 1869-1891.
[18] Ling, H. I., Leshchinsky, D., & Chou, N. N. (2001). Post-earthquake investigation on several
geosynthetic-reinforced soil retaining walls and slopes during the Ji-Ji earthquake of Taiwan. Soil
Dynamics and Earthquake Engineering, 21(4), 297-313.
[19] Ghasemi, H., Cooper, J. D., Imbsen, R. A., Piskin, H., Inal, F., & Tiras, A. (2000). The November
1999 Duzce earthquake: post-earthquake investigation of the structures on the Tem (No. FHWA-RD-
00-146). United States. Federal Highway Administration.
[20] Miller, D. K. (1998). Lessons learned from the Northridge earthquake. Engineering structures, 20(4-
6), 249-260.
[21] Gross, J. L. (2001). AISC Design Guide No. 12 Modification of Existing Welded Steel Moment
Frame Connections for Seismic Resistance.
[22] Zonzini, F., Malatesta, M. M., Bogomolov, D., Testoni, N., Marzani, A., & De Marchi, L. (2020).
Vibration-based shm with upscalable and low-cost sensor networks. IEEE Transactions on
Instrumentation and Measurement, 69(10), 7990-7998.
[23] Fu, Y., Mechitov, K., Hoang, T., Kim, J. R., Memon, S. A., & Spencer Jr, B. F. (2021). Efficient and
high‐precision time synchronization for wireless monitoring of civil infrastructure subjected to
sudden events. Structural Control and Health Monitoring, 28(1), e2643.
19[24] Aygun, L. E., Kumar, V., Weaver, C., Gerber, M., Wagner, S., Verma, N., ... & Sturm, J. C. (2020).
Large-area resistive strain sensing sheet for structural health monitoring. Sensors, 20(5), 1386.
[25] Kong, X., Li, J., Collins, W., Bennett, C., Laflamme, S., & Jo, H. (2017). A large-area strain sensing
technology for monitoring fatigue cracks in steel bridges. Smart Materials and Structures, 26(8),
085024.
[26] Sony, S., Laventure, S., & Sadhu, A. (2019). A literature review of next‐generation smart sensing
technology in structural health monitoring. Structural Control and Health Monitoring, 26(3), e2321.
[27] Cha, Y. J., Choi, W., & Büyüköztürk, O. (2017). Deep learning‐based crack damage detection using
convolutional neural networks. Computer‐Aided Civil and Infrastructure Engineering, 32(5), 361-
378.
[28] Cha, Y. J., Choi, W., Suh, G., Mahmoudkhani, S., & Büyüköztürk, O. (2018). Autonomous structural
visual inspection using region‐based deep learning for detecting multiple damage types. Computer‐
Aided Civil and Infrastructure Engineering, 33(9), 731-747.
[29] Narazaki, Y., Hoskere, V., Hoang, T. A., Fujino, Y., Sakurai, A., & Spencer Jr, B. F. (2020). Vision‐
based automated bridge component recognition with high‐level scene consistency. Computer‐Aided
Civil and Infrastructure Engineering, 35(5), 465-482.
[30] Yang, Y., Dorn, C., Mancini, T., Talken, Z., Kenyon, G., Farrar, C., & Mascareñas, D. (2017). Blind
identification of full-field vibration modes from video measurements with phase-based video motion
magnification. Mechanical Systems and Signal Processing, 85, 567-590.
[31] Yeum, C. M., & Dyke, S. J. (2015). Vision‐based automated crack detection for bridge
inspection. Computer‐Aided Civil and Infrastructure Engineering, 30(10), 759-770.
[32] Feng, D., & Feng, M. Q. (2018). Computer vision for SHM of civil infrastructure: From dynamic
response measurement to damage detection–A review. Engineering Structures, 156, 105-117.
[33] Dong, C. Z., & Catbas, F. N. (2021). A review of computer vision–based structural health
monitoring at local and global levels. Structural Health Monitoring, 20(2), 692-743.
[34] Spencer Jr, B. F., Hoskere, V., & Narazaki, Y. (2019). Advances in computer vision-based civil
infrastructure inspection and monitoring. Engineering, 5(2), 199-222.
[35] Li, Y., Wang, S., Tian, Q., & Ding, X. (2015). A survey of recent advances in visual feature
detection. Neurocomputing, 149, 736-751.
[36] Fukuda, Y., Feng, M. Q., & Shinozuka, M. (2010). Cost‐effective vision‐based system for
monitoring dynamic response of civil engineering structures. Structural Control and Health
Monitoring, 17(8), 918-936.
[37] Fukuda, Y., Feng, M. Q., Narita, Y., Kaneko, S. I., & Tanaka, T. (2013). Vision-based displacement
sensor for monitoring dynamic response using robust object search algorithm. IEEE Sensors
Journal, 13(12), 4725-4732.
[38] Khuc, T., & Catbas, F. N. (2017). Computer vision-based displacement and vibration monitoring
without using physical target on structures. Structure and Infrastructure Engineering, 13(4), 505-516.
[39] Xu, Y., Brownjohn, J., & Kong, D. (2018). A non‐contact vision‐based system for multipoint
displacement monitoring in a cable‐stayed footbridge. Structural Control and Health
Monitoring, 25(5), e2155.
20[40] Yoon, H., Shin, J., & Spencer Jr, B. F. (2018). Structural displacement measurement using an
unmanned aerial system. Computer‐Aided Civil and Infrastructure Engineering, 33(3), 183-192.
[41] Lee, J., Lee, K. C., Jeong, S., Lee, Y. J., & Sim, S. H. (2020). Long-term displacement measurement
of full-scale bridges using camera ego-motion compensation. Mechanical Systems and Signal
Processing, 140, 106651.
[42] Kong, X., & Li, J. (2018). Vision‐based fatigue crack detection of steel structures using video feature
tracking. Computer‐Aided Civil and Infrastructure Engineering, 33(9), 783-799.
[43] Kong, X., & Li, J. (2019). Non-contact fatigue crack detection in civil infrastructure through image
overlapping and crack breathing sensing. Automation in Construction, 99, 125-139.
[44] Kong, X., & Li, J. (2018). Image registration-based bolt loosening detection of steel
joints. Sensors, 18(4), 1000.
[45] Miura, H., Aridome, T., & Matsuoka, M. (2020). Deep learning-based identification of collapsed,
non-collapsed and blue tarp-covered buildings from post-disaster aerial images. Remote
Sensing, 12(12), 1924.
[46] Valentijn, T., Margutti, J., van den Homberg, M., & Laaksonen, J. (2020). Multi-hazard and spatial
transferability of a cnn for automated building damage assessment. Remote Sensing, 12(17), 2839.
[47] Kalantar, B., Ueda, N., Al-Najjar, H. A., & Halin, A. A. (2020). Assessment of convolutional neural
network architectures for earthquake-induced building damage detection based on pre-and post-event
orthophoto images. Remote Sensing, 12(21), 3529.
[48] Huang, F., Yu, Y., & Feng, T. (2019). Automatic building change image quality assessment in high
resolution remote sensing based on deep learning. Journal of Visual Communication and Image
Representation, 63, 102585.
[49] Yeum, C. M., Dyke, S. J., & Ramirez, J. (2018). Visual data classification in post-event building
reconnaissance. Engineering Structures, 155, 16-24.
[50] Pan, X., & Yang, T. Y. (2020). Postdisaster image‐based damage detection and repair cost estimation
of reinforced concrete buildings using dual convolutional neural networks. Computer‐Aided Civil and
Infrastructure Engineering, 35(5), 495-510.
[51] Rigby, S. E., Lodge, T. J., Alotaibi, S., Barr, A. D., Clarke, S. D., Langdon, G. S., & Tyas, A. (2020).
Preliminary yield estimation of the 2020 Beirut explosion using video footage from social
media. Shock Waves, 30(6), 671-675.
[52] Diaz, J. S. (2021). Explosion analysis from images: Trinity and Beirut. European Journal of
Physics, 42(3), 035803.
[53] Aouad, C., Chemissany, W., Mazzali, P., Temsah, Y., & Jahami, A. (2020). Beirut explosion:
Energy yield from the fireball time evolution in the first 230 milliseconds. arXiv preprint
arXiv:2010.13537.
[54] Muhammad, K., Ahmad, J., Lv, Z., Bellavista, P., Yang, P., & Baik, S. W. (2018). Efficient deep
CNN-based fire detection and localization in video surveillance applications. IEEE Transactions on
Systems, Man, and Cybernetics: Systems, 49(7), 1419-1434.
[55] Muhammad, K., Ahmad, J., Mehmood, I., Rho, S., & Baik, S. W. (2018). Convolutional neural
networks based fire detection in surveillance videos. IEEE Access, 6, 18174-18183.
21[56] Park, S., Baek, F., Sohn, J., & Kim, H. (2021). Computer Vision–Based Estimation of Flood Depth
in Flooded-Vehicle Images. Journal of Computing in Civil Engineering, 35(2), 04020072.
[57] Wald, D. J., Quitoriano, V., Worden, C. B., Hopper, M., & Dewey, J. W. (2011). USGS “Did You
Feel It?” internet-based macroseismic intensity maps. Annals of geophysics, 54(6).
[58] Quitoriano, V., & Wald, D. J. (2020). USGS “Did You Feel It?”—Science and Lessons From 20
Years of Citizen Science-Based Macroseismology. Frontiers in Earth Science, 8, 120.
[59] Reilly, J., Dashti, S., Ervasti, M., Bray, J. D., Glaser, S. D., & Bayen, A. M. (2013). Mobile phones
as seismologic sensors: Automating data extraction for the iShake system. IEEE Transactions on
Automation Science and Engineering, 10(2), 242-251.
[60] Cochran, E. S., Lawrence, J. F., Christensen, C., & Jakka, R. S. (2009). The quake-catcher network:
Citizen science expanding seismic horizons. Seismological Research Letters, 80(1), 26-30.
[61] Feng, M., Fukuda, Y., Mizuta, M., & Ozer, E. (2015). Citizen sensors for SHM: use of accelerometer
data from smartphones. Sensors, 15(2), 2980-2998.
[62] Ngeljaratan, L., & Moustafa, M. A. (2020). Implementation and evaluation of vision-based sensor
image compression for close-range photogrammetry and structural health
monitoring. Sensors, 20(23), 6844.
[63] ABC Chicago, Security camera video shows moment of condo building collapse in Surfside, Florida,
https://abc7chicago.com/building-collapse-video-surfside-miami-of/10827847/
[64] Video shows moment condo tower collapsed in Surfside, Florida, north of Miami Beach,
https://www.youtube.com/watch?v=jtQMH8S57fw
[65] Shi, J. (1994, June). Good features to track. In 1994 Proceedings of IEEE conference on computer
vision and pattern recognition (pp. 593-600). IEEE.
[66] Rosten, E., & Drummond, T. Fusing points and lines for high performance tracking. In Tenth IEEE
International Conference on Computer Vision (ICCV'05) Volume 1 (Vol. 2, pp. 1508-1515). IEEE.
2005, October
[67] Harris, C., & Stephens, M. A combined corner and edge detector. In Alvey vision conference (Vol.
15, p. 50). 1988, August
[68] Leutenegger, S., Chli, M., & Siegwart, R. Y. BRISK: Binary robust invariant scalable keypoints.
In Computer Vision (ICCV), 2011 IEEE International Conference on (pp. 2548-2555). IEEE. 2011,
November
[69] Bay, H., Tuytelaars, T., & Van Gool, L. Surf: Speeded up robust features. In European conference on
computer vision (pp. 404-417). Springer Berlin Heidelberg. 2006, May
[70] Kalal, Z., Mikolajczyk, K., & Matas, J. (2010, August). Forward-backward error: Automatic
detection of tracking failures. In 2010 20th international conference on pattern recognition (pp. 2756-
2759). IEEE.
[71] Tomasi, C., & Kanade, T. (1991). Detection and tracking of point. Int J Comput Vis, 9, 137-154.
[72] Torr, P. H., & Zisserman, A. (2000). MLESAC: A new robust estimator with application to
estimating image geometry. Computer vision and image understanding, 78(1), 138-156.
[73] Higham, D. J., & Higham, N. J. (2016). MATLAB guide. Society for Industrial and Applied
Mathematics.
[74] Zhou, X., Di, J., & Tu, X. (2019). Investigation of collapse of Florida International University (FIU)
pedestrian bridge. Engineering Structures, 200, 109733.
22You can also read


