KIDS COUNT IN MICHIGAN - 2021 A BETTER FUTURE IS POSSIBLE
←
→
Page content transcription
If your browser does not render page correctly, please read the page content below
2021
KIDS COUNT IN MICHIGAN
                 Data Book

                 A
                 BETTER
                 FUTURE
                 IS POSSIBLE
2021 Kids Count in Michigan
Advisory Committee
 CHAIR: Patrick Brown, Outreach Coordinator, Michigan’s Children
 CO-CHAIR: Amy Zaagman, Executive Director, Michigan Council for Maternal and Child Health

 Jan Amsterburg, Ph.D, Superintendent, Gratiot-Isabella Intermediate School District
 Casey Anbender, JD, Manager, Michigan Supreme Court, State Court Administrative Office, Child Welfare Services
 Stacie Bladen, LMSW, Deputy Director, Children’s Services Administration, Michigan Department of Health & Human
    Services
 Hillary Turner Brandon, Michigan Adolescent Pregnancy & Parenting Program Coordinator, Michigan Department of
    Health & Human Services
 Jared Burkhart, Executive Director, Michigan Chapter, American Academy of Pediatrics
 Kyle Caldwell, President and CEO, Council of Michigan Foundations
 Taryn Gal, Executive Director, Michigan Organization for Adolescent Sexual Health
 Suzanne Greenberg, President, Michigan Children’s Trust Fund
 Eric Guthrie, State Demographer, Department of Technology, Management & Budget, Bureau of Labor Market
    Information and Strategic Initiatives
 Paula Herbart, President, Michigan Education Association
 Wendy Lewis Jackson, Managing Director, Detroit Program, The Kresge Foundation
 Gilda Z. Jacobs, President and CEO, Michigan League for Public Policy
 Ja’Nel Jamerson, Executive Director, Educare Flint, Community Foundation of Greater Flint
 Jerry D. Johnson, Assistant Superintendent, Calhoun Intermediate School District
 Mike Larson, President and CEO, Michigan Association of United Ways
 Jodi Latuszek, Senior Director of Administration, Michigan Supreme Court
 Daniel Layman, President and CEO, Ele’s Place
 Ruben Martinez, Ph.D, Director, Julian Samora Research Institute, Michigan State University
 Lisa McCormick, Judge, 30th District Court
 David R. McGhee, Vice President of Organizational Excellence & Impact, The Skillman Foundation
 Jonathan Nigrine, State of Flint Kids Health Dashboard Manager, Greater Flint Health Coalition
 Stephanie Quesnelle, Senior Research Analyst & Project Lead, Data Driven Detroit
 Alex Rossman, External Affairs Director, Michigan League for Public Policy
 Jacqlyn E. Smith, Chief Strategy Officer, Children’s Hospital of Michigan
 Jason Smith, Executive Director, Michigan Center for Youth Justice
 Ann Michele Stacks, Director, Infant Mental Health Program, Merrill Palmer Skillman Institute
 Michele Strasz, Executive Director, Capital Area College Access Network
 Stacey Tadgerson, MPA, Department Specialist/Tribal Liaison, Michigan Department of Health and Human Services
 Cassie Jo Thierfelder, Director of Advocacy and Government Relations, United Way for Southeastern Michigan
 Maxine Thome, Ph.D, LMSW, ACSW, MPH, Executive Director, Michigan Chapter, National Association of Social Workers
 Erica Tobe, Ph.D, Institute Director, Children and Youth, Michigan State University Extension
 Jennifer VanValkenburg, Program Officer, Battle Creek Community Foundation
 Jeremiah White, Implementation Success Manager, Hope Starts Here Detroit
 Holly Wingard, Training and Technical Assistance Systems Manager, Early Childhood Investment Corporation

 Ex-Officio: Kelsey Perdue, Kids Count Project Director, Michigan League for Public Policy
About Kids Count                                      Acknowledgements
Kids Count in Michigan is part of a broad              The creation of the 2021 Kids Count in Michigan Data Book was led by
national effort to measure the well-being of           Kelsey Perdue, Kids Count in Michigan Project Director at the Michigan
children at the state and local levels and             League for Public Policy, with the invaluable contributions and assistance
use that information to shape efforts to               of League and project staff.
improve the lives of children.
                                                       The following people contributed directly to this book through the planning,
The project is housed at the Michigan                  editing, fact-checking and dissemination processes: Jazmin Anderson,
League for Public Policy, a research and               Amber Bellazaire, Julie Cassidy, Yona Isaacs, Parker James, Emily Jor-
advocacy organization whose mission                    gensen, Phyllis Killips, Tillie Kucharek, Laura Ross, Alex Rossman, Simon
is to advance economic security, racial                Marshall-Shah, Pat Sorenson and Renell Weathers. Parker James, Kids
equity, health and well-being for all people           Count Policy Analyst, also led the creation of the 2021 state, region, county
in every part of Michigan through policy               and city data profiles that accompany the Data Book.
change.
                                                       The Kids Count Advisory Committee provides year-round expertise, guid-
Data Sources                                           ance and support to the project.

Kids Count collects data from multiple
                                                       Jessa Challa provided thoughtful, inclusive and beautiful illustrations that
primary sources, considering their
reliability, collection schedule, availability at      represent Michigan’s diverse children and families.
the local level and validity. Data in the 2021
Data Book and data profiles are mostly                 Dozens of youth and young adults lended their expertise to the creation of
from the U.S. Census Bureau, American                  this year’s book. Kids Count conducted focus groups with youth and young
Community Survey, Michigan’s Center for                adults in 2020, and in 2021 gathered input via survey from 80 more young
Education Performance and Information,                 people on their vision and ideas for the future. Their input is incorporated
Michigan Department of Health and                      throughout.
Human Services, Michigan Department
of Education, Early Childhood Investment               Generous Supporters of the 2021 Kids Count in
Corporation, Feeding America and United
for ALICE.
                                                       Michigan Data Book
                                 A number of generous supporters make the 2021 Kids Count in Michigan
                                 Data Book possible: the Annie E. Casey Foundation, The Max M. and Mar-
                                 jorie S. Fisher Foundation, The Skillman Foundation, The Steelcase Foun-
Even though we are youth, we can dation, Michigan Education Association, American Federation of Teachers
 support and help our community. Michigan, Blue Cross Blue Shield of Michigan Foundation, United Way for
                                 Southeastern Michigan and the Ruth Mott Foundation. The findings and
      J’kyla, 14, Ingham County conclusions presented herein do not necessarily reflect the opinions of
	                               these funders.

                                                      In Memoriam
We wanted to make this book as bright                  Michele Corey, Vice President of Michigan’s Children and Immediate Past
and vibrant as Michigan’s kids, so we                  Chair of the Kids Count in Michigan Advisory Committee, passed away in
asked youth from around the state to                   2021. We recognize Michele for her years of service to the Kids Count in
share their thoughts about what a better               Michigan project, her fierce support of kids, youth and families across the
future for Michigan could look like. Their             state and her decades of contributions to the field of public policy.
responses are featured in this year’s book.

            Copyright: Michigan League for Public Policy 2021
            Any part of this book may be duplicated and distributed for nonprofit educational purposes provided the source is credited.

            Suggested citation:
            Perdue, Kelsey. 2021 Kids Count in Michigan Data Book: A Better Future is Possible. Lansing, MI: Michigan League for Public Policy.
Table of Contents

                    Introduction.............................................. 1
                    About Kids Count..................................... 2
                    Using the Data Book and profiles............ 2
                    How stakeholders use the Data Book..... 3
                    A note to lawmakers................................ 5
                    Tips to influence state priorities.............. 6
                    Michigan budget cycle............................. 7
                    Data in action: Key findings and
                        recommendations................................ 8
                    Overall well-being in Michigan................. 12
                    Population and demographic overview.... 14
                    Family and community............................... 16
                    Economic security...................................... 20
                    Education.................................................. 25
                    Health and safety....................................... 32
                    Data definitions and notes........................ 36
                    Endnotes.................................................. 46
Introduction
 A Better Future Is Possible.
 We collectively experienced a convergence of emergencies this past year: a global pandemic and its
 effects on our economy and health, a brutal election cycle and continuous displays of racial injustice.
 These hard times brought increased attention to the health, financial and educational challenges
 families have faced for far too long. In response, we saw renewed public will and resources made
 available to support families and businesses. The need for continued investments that benefit the core
 of who we are—our families—remains. Even as we see signs of the end of COVID-19, we will not see
 the end of these challenges without deliberate action and investment.

 In these Data Book pages you’ll find that, in some ways, we are doing better by kids, teens and young
 adults than we were a decade ago: Michigan has one of the highest rates of health coverage for
 children, high school graduation rates are up and more kids have their basic needs met. However, in
 other ways, life is harder today for families with children: economic inequality has grown, education
 achievement levels have remained flat and declined in some areas, and young people told us there’s
 more we should be doing.

 But a better future is possible. By analyzing data that’s
                                                                      We must dedicate the
 available and honoring folks’ stories as a critical source
 of information, we can craft smart investments and policy            resources and muster
 solutions that work to level the playing field and improve           the bold leadership
 well-being in meaningful ways. It’s in our power to create a         needed to ensure every
 society and state where families and businesses thrive—              person has the proper
 where everyone’s needs are met, high-quality learning is             opportunities and
 available and affordable at any age, people experience
 physical and mental wellness, and families and communities
                                                                      resources to live a full life
 are together and stronger than ever.                                 in Michigan

 There is an opportunity cost with every school year, legislative cycle and season that passes without
 bold action. Just think: if our K-12 schools didn’t miss out on $4.5 billion in resources over the last
 decade, if over 40% of Michigan households didn’t have to worry about struggling to make ends meet,
 and if infants and teens didn’t die from preventable causes—imagine the talent, possibilities and world
 that could have been made real for all of us.

 It’s not too late to create this world. As we begin to emerge from the pandemic, engage in another
 state budget cycle, spend relief dollars and act out the bold promises for racial equity made last
 year, we must keep families and children front of mind. It’s simply not enough for some children to
 have the basic things they need to stay alive. We must dedicate the resources and muster the bold
 leadership needed to ensure every person has the proper opportunities and resources to live a full life
 in Michigan.

 My hope is that the 2021 Kids Count in Michigan Data Book serves as a source of information as well
 as an action guide. The tips to influence state priorities, the budget cycle overview, data trends, input
 from young people and policy recommendations are all tools that can help us build and walk this path
 toward a better future. A better future is certainly possible, wholly dependent on decisions we make (or
 don’t make) today. Let’s make it happen.

 With thanks,

 Kelsey Perdue
 Kids Count in Michigan Project Director
                                                                    2021 Kids Count in Michigan Data Book    |   1
About Kids Count
                                                Kids Count in Michigan is part of a broad national effort to measure
                                                the well-being of children at the state and local levels, and use that
                                                information to shape efforts to improve the lives of children.

                                                Kids Count in Michigan is housed at the Michigan League for Public
                                                Policy, a nonprofit policy institute focused on opportunity for all. Its
                                                mission is to advance economic security, racial equity, health and well-
                                                being for all people in Michigan through policy change. It is the only
                                                state-level organization that addresses poverty in a comprehensive
                                                way.

                                                Every year the project releases data products to facilitate data-driven
                                                decision-making for diverse stakeholders. Using a two-generational
                                                approach, the project recognizes that we cannot improve life for
                                                children without also addressing parental needs. To that end, our data
                                                products include household indicators to help understand and analyze
                                                family characteristics. We also recognize that racism has made
                                                disparities by race inevitable. Our products disaggregate data by race
                                                and ethnicity when possible to better understand outcomes for various
                                                subgroups.

Using the Data Book and profiles
Kids Count in Michigan and the Michigan League for Public Policy have produced the annual Kids Count in
Michigan Data Book since 1992. The Data Book reviews the most recently available and trend data to evaluate the
well-being of children while identifying policy that, if implemented, could improve life and outcomes for families.

In addition to the Data Book, Kids Count publishes a state data profile and regional, county and select city data
profiles. These profiles—along with nearly 100 indicators that are regularly updated on the Annie E. Casey KIDS
COUNT Data Center—provide local and disaggregated data across variables such as race/ethnicity, age and
nativity. The Data Center has other useful functions: one can compare data between counties and states, locate
rankings, view trends over multiple years, and create and download charts and graphs. Visit the Kids Count in
Michigan web page for more information on how to use the Data Center.

A change from previous years, the 2021 Data Book and accompanying data profiles do not provide county
rankings. Rankings are still available on the Data Center.

All data sources, definitions, notes and limitations are available for every indicator at the back of the Data Book
and/or on the online Data Center. Definitions for data that are featured on the Michigan state profile in the Data
Book are included in the book. Definitions for other indicators that Kids Count collects and publishes are on the
Data Center. All other citations are listed in the endnotes section.

To provide more robust information by race and ethnicity, the Data Book uses an additional data source from the
data profiles. Thus, depending on the indicator, racial categories may vary within the Data Book and profiles. In
each case, racial categories are presented in a way that matches the data source.

Small population numbers in some areas of the state often result in data being suppressed, and small numbers
may cause rate changes to appear more significant. Caution should be taken when reviewing rates, percentages
and numbers, especially when wanting to make comparisons.

Data may be available on different time frames, for example, by school year, fiscal year, and three- and five-year
averages. Suppression rules and time frames are noted on the definitions page.

2   |   2021 Kids Count in Michigan Data Book
How
Usingstakeholders use the Data Book
      the Data Book
Kids Count data products help facilitate data-driven decision-making for diverse stakeholders
ranging from residents and business leaders to lawmakers. The Data Book serves as a resource,
call to action and path forward to a better future.

       “The COVID-19 pandemic has highlighted many
       inequities across our state, from disparities in public
       health to lack of broadband access for children
       participating in virtual learning.

       As we combat COVID-19, Gov. Whitmer and I
       continue to take action to tackle these injustices now
       and in the future. The Kids Count in Michigan Data
       Book is a critical component in identifying these
       inequities. As a proud father of three, I believe that it’s
       more important than ever that children and families
       are valued in Michigan.

       Gov. Whitmer and I recognize the need to make
       historic investments in Michiganders of all ages and
       empower them to continue learning and reaching new
       opportunities.”

       Michigan Lt. Gov. Garlin Gilchrist II

   Philanthropy
       “Kids Count is more than a report card of our efforts, it is a call to action, shedding light on where our
       public and private dollars are creating impact, and perhaps more importantly, where we are falling
       short. The findings are a reflection of today’s priorities with consequences that reach well into our
       state’s, and our nation’s, future.”
       Cynthia K. Rowell, The Max M. & Marjorie S. Fisher Foundation

       “Because of Kids Count and other important reference materials, we were able to make data-driven
       decisions about the outcomes we are focused on to improve the lives of north Flint children and families.”
       Raquel Thueme, Ruth Mott Foundation

   Business
       “Childhood well-being is foundational for educational attainment and a strong predictor of economic
       and community success. For Michigan businesses to attract and retain the best talent and thrive in
       a competitive global marketplace, leaders from around the state must continue to prioritize public
       policies that promote successful outcomes for children.”
       Sandy Baruah, Detroit Regional Chamber of Commerce

                                                                            2019 Kids Count in Michigan Data Book   |   3
Community Organizations
          “The Kids Count book is a superbly helpful tool for our organization as we conduct local needs
          assessments to ensure we are meeting the needs of Michigan residents. In addition, the facts and
          figures support the basis for establishing need with appropriate funding agencies so that we can plan
          and implement programming across the state in all 83 counties in Michigan.”
          Erica Tobe, Michigan State University Extension Children and Youth Institute

          “We use the data book to amplify our community dashboard to tell a more holistic story about the
          well-being of our students.”
          Michele Strasz, Capital Area College Access Network

          “The Data Book and Data are helpful when writing grants—they help demonstrate what children in
          Michigan need. As the university/research partner for the Wayne County Baby Court project, I use the
          data in trainings to demonstrate a need for a specialty court for infants and toddlers.”
          Ann Michele Stacks, Infant Mental Health Program, Merrill Palmer Skillman Institute, Wayne
             State University

          “Our advocacy on expanding Medicaid coverage to 12 months postpartum relied on data from
          Kids Count. Being able to show a map of Medicaid births by county and demonstrate the impact
          of the proposed change has been one of the strongest advocacy points in individual meetings with
          legislators and contributed immensely to our collective successful efforts here in Michigan.”
          Amy Zaagman, Michigan Council for Maternal and Child Health

          “Kids Count data is essential to the Greater Flint Health Coalition’s children’s health dashboard
          StateOfFlintKids.com, our Community Data Scorecard, and our Community Health Needs
          Assessment. This data is a critical tool that helps us to monitor factors that impact the health of
          children and our community.”
          Nichole Smith-Anderson, Greater Flint Health Coalition

4   |   2021 Kids Count in Michigan Data Book
Lawmakers
         “As a teacher-turned-lawmaker, I’m dedicated to enacting education policies that are well-informed and
         set kids up for success in the real world. Thanks to the Kids Count in Michigan Data Book, we don’t
         have to write those policies in the dark. Every year, legislators and staff rely on this resource to tell
         us where kids are and what they need in order to thrive.”
         Senate Democratic Leader Jim Ananich

         “The Kids Count in Michigan Data Book seeks to tell the whole story of the whole child, looking at every
         area of kids and their families’ lives and what policy changes can be made to improve them. I continue
         to work on policies to better address families at the ALICE threshold in Kent County and around the
         state, and Kids Count offers the data and policy insights to help inform these efforts, and I hope my
         colleagues will join me in heeding this information and stepping up to do more for our kids.”
         Sen. Winnie Brinks

         “Michigan children and families should be at the forefront of every policy decision, and all children should
         be given the same opportunities to thrive. No child’s well-being should be based on their race, ethnicity,
         family income or zip code. The Kids Count data helps ensure lawmakers know how kids are doing in our
         districts and what policies can help improve the lives of our young people. As a state senator and as a
         mom, securing the well-being of Michigan’s kids is the most important part of my work.”
         Sen. Stephanie Chang

A note to lawmakers
Kids Count in Michigan has been an independent source of data and research for children and families
for nearly 30 years. We publish a variety of data products and work with policymakers and community
members across the state to understand and act on the challenges families face. Below are four ways
Kids Count can support you while in office.

     1
                View outcomes specific to your district.
                Easily view, rank, compare and contrast outcomes for nearly 100 indicators of well-being in your
                county and district with data for the state and other areas on the Annie E. Casey KIDS COUNT
                Data Center (datacenter.kidscount.org). Much data are available by variables such as race and
                ethnicity, age and nativity.

     2
                Quickly access the most current data.
                This biannual Data Book and annual data profiles use the best data available. Even more, the
                Kids Count team regularly updates Michigan data on the online Data Center
                (datacenter.kidscount.org) to ensure you always have access to the most current data.

     3
                Consider policy recommendations backed by the public.
                The League and Kids Count offer budget and policy recommendations based on data as well
                as community and collaborative input. For example, in 2018 the League held eight focus groups
                around the state with over 80 people to identify top priorities for Michigan families, and our teams
                are connected with dozens of community partners.

     4
                 Enjoy technical assistance.
                 The Kids Count team provides technical assistance, including answering questions and provid-
                 ing guidance on data and data sources to help inform your positions and generate new ideas.

                                                                           2021 Kids Count in Michigan Data Book   |   5
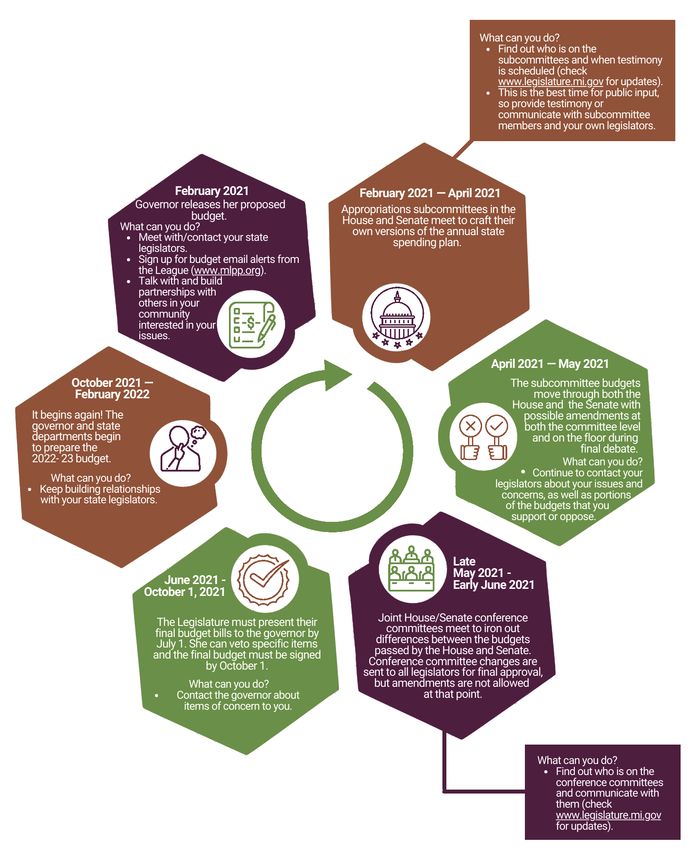
Tips to influence state priorities
    The Michigan state budget is the way we set our priorities. It’s also a plan
    to use our resources in ways we believe make a better future possible.

                                                          Your input is needed in this process because there
                                                          is much at stake: equitable school funding to support
                                                          student achievement, affordable housing in opportunity-
                                                          rich communities, expanded health insurance coverage,
                                                          access to behavioral health services, a stronger safety
                                                          net that reaches families and children in need, reduced
                                                          hardship and increased well-being.

                                                          Here are five tips for using the Data Book and your own
                                                          expertise to influence the state budget. These tips also
                                                          apply to policy change and general advocacy efforts.

         1
                     Build a relationship with your elected representatives.
                     Building an ongoing relationship makes your advocacy most impactful; a last-minute letter or
                     phone call can be too little, too late. Let your representatives know what matters most to you as
                     a constituent. You can educate them on the issues or ask them to vote a certain way on the final
                     state budget or other policy.

         2
                     Have good sources and timely information about the issues you care about.
                     Some decisions—like debates and votes on the state budget—can move quickly. The League
                     provides timely information at www.mlpp.org. You can also use data from this Data Book, Kids
                     Count and other sources to stay informed and make the case for why a particular issue is impor-
                     tant.

         3
                     Use your expertise.
                     You are an expert in describing what your community, family and children need. Pair the num-
                     bers and issue-specific information with stories to personalize the issue and help the Legislature
                     and others understand why it’s important to act. Working with local organizations and coalitions
                     can help show a more unified position on your top issues.

         4
                      Take advantage of opportunities for public testimony.
                      Legislative committees generally take public testimony before voting on the state budget or other
                      policy, and they want to hear from you. This is a great place to voice what’s important to you,
                      including any specific parts of the budget you support or oppose.

         5
                      Don’t forget the governor.
                      Michigan’s governor has the power to veto portions of the budget passed by the Legislature and
                      negotiates with legislative leaders throughout the process. Letting the governor know what you
                      value is another way to advocate for the issues you care about.

6   |   2021 Kids Count in Michigan Data Book
Michigan’s State Budget Cycle
Know when to weigh in year-round
2021 Kids Count in Michigan Data Book | 7Data in Action
Strategies for improving overall child well-being
One of the best ways to help children reach their potential is to invest in their families and the
communities that they are growing up in. These policy recommendations are informed by data and
identified as winning strategies for improving well-being in the areas of family and community, economic
security, education, and health and safety.
Family and Community
Provide comprehensive health education
The number of births to teens aged 15-19 are less than half of what they were a decade ago. While Mich-
igan does not have a standard sexual education curriculum or require it to be taught in schools, the teens
in our focus groups emphasized the importance of a curriculum that is inclusive of all gender identities and
sexual orientations.
RECOMMENDATION: A comprehensive health education can have positive impacts on long-
term health outcomes. All youth should have access to a comprehensive and inclusive sexual health
education.
Address the digital divide
Both rural and urban communities alike have low rates of access to high-speed internet, and at least 10%
of all Michigan households didn’t have home internet access in 2019. Lower-income earners are even less
likely to have high-speed internet and are more reliant on using smartphones to access the internet for
tasks that are designed for larger screens, like homework.
WIN & RECOMMENDATION: Gov. Gretchen Whitmer announced an initiative to increase
high-speed internet in fall 2020, and federal COVID recovery plans include new investments for state
broadband infrastructure. All efforts to expand connectivity should include a focus on affordability, en-
courage community-owned options and include investments in existing resources like public libraries.
Invest in child neglect and abuse prevention
In 2020, 205,631 minors were in families where allegations of child neglect or abuse occurred. After an
investigation, 14% of those claims (27,894) were found to be substantiated. In 2020, 10,023 youth were in
out-of-home care.
WIN: The federal Family First Prevention Services Act, passed in 2018, increased resources avail-
able for foster care prevention services and to keep more kids with their family while reducing funding
for group placements that are clinically unnecessary.
Support youth transitioning out of foster care
Over 10,000 youth were in foster care in 2020, and several thousand exit the system every year. In Mich-
igan, only 5% of youth transitioning out of foster care receive employment assistance, and 1% receive
education support.
RECOMMENDATION: Ensure adequate support for programs that assist foster youth exiting
the systemwith education, housing and work.
8 | 2021 Kids Count in Michigan Data BookReduce financial hardship for justice-involved youth
Michigan’s juvenile justice system is decentralized, so experiences for justice-involved youth—like access
to support services and assessment of fines and fees—can vary greatly by geographic location. This im-
pacts recidivism, financial security and hardship for youth and young adults.
WIN & RECOMMENDATION: There were a number of criminal justice reforms in 2020,
including making it easier to keep juvenile records confidential and to get a juvenile record expunged.
To combat the criminalization of poverty, the nonpayment of fines and fees can no longer lead to driv-
er’s license suspensions. For similar reasons, juvenile and family court systems should work toward
eliminating fines and fees levied on justice-involved youth.
Economic Security
Address income and tax inequality
Michigan is 15th in the nation for income inequality: its top 1% of earners make more than 21 times as
much as the bottom 99% of workers. Even still, the bottom 20% of income earners pay nearly double the
rate in total state and local taxes than its top 1% of earners (10.4% and 6.2% of income, respectively).
Across the state, nearly 40% of Michigan households are struggling to make
ends meet.
RECOMMENDATION: Improve job opportunities, working
conditions and tax implications by restoring Michigan’s Earned
Income Tax Credit to 20% of the federal credit, expanding the
Homestead Property Tax Credit and implementing a graduated
income tax to help Michigan workers keep more of their hard-earned
wages.
Meet affordable housing needs
Nearly a quarter (24%) of Michigan’s children are in families that pay a dispro-
portionately high amount of their income on housing expenses (30% or more).
Even more, the number of kids living in high-poverty areas has increased by
78,000 since 2000. Areas of concentrated poverty impact families’ access to
healthy food, quality medical care, education, jobs and physical environments
free from environmental hazards.
RECOMMENDATION: Michigan’s existing Housing and Community Development Fund hasn’t
received state funding since 2012, and doesn’t have resources to meet the state’s affordable housing
needs. The state should identify a dedicated revenue stream to ensure enough stable funding is
available to increase access to safe, affordable housing in opportunity-rich communities for families
with low incomes.
Support families in deep poverty
In 2019, 162,000 (8%) of Michigan children lived in deep poverty (50% of the federal poverty level). The
Family Independence Program (FIP), or cash assistance, was designed for these families, though eligibility
levels are even below this threshold. In 2011, Michigan created a lifetime cap on how long it will provide FIP
benefits by eliminating hardship exemptions and “clockstoppers’’ for those limits. The number of children
receiving FIP declined by 83% (over 127,500 cases) from 2010 to 2020.
RECOMMENDATION: Reinstate “clockstoppers” so that months in which a family is meeting
program work requirements do not count towards the 48-month lifetime limit, and make use of the fed-
eral hardship exemption for families that cannot meet them. In this way, Michigan can reduce extreme
poverty for children, especially those in communities with limited job opportunities.
2021 Kids Count in Michigan Data Book | 9Education
Expand access to early learning
The average annual cost for one infant in a child care center
in Michigan is 19% of a median family’s income and 54% of a
minimum wage worker’s income. Because of low initial eligibility
thresholds, low provider payments and supply, the number of
children ages 0-12 receiving child care subsidies fell from 56,375
(3.4% of kids ages 0-12) in 2010 to 25,246 (1.7% of kids aged
0-12) in 2020.
WIN & RECOMMENDATION: The 2021
state budget increased the initial income eligibility
threshold for child care subsidies from 130% to 150%
of poverty. Still, pre-COVID, the national median
for initial eligibility was 188% of poverty. Michigan’s
eligibility threshold should be raised to a minimum of
185%, with incremental increases to 250% of poverty.
Payments to providers should be increased to reflect
the actual cost of care, increasing quality, availability
and access for families.
Fund schools based on what students need
Michigan is one of just 16 states that provides less funding to its highest-poverty districts than to its lowest-poverty
districts. When schools are not equitably funded, learning environments and student outcomes suffer. The majority
of third-graders and eighth-graders are partially or not proficient in reading and math, respectively. The majority of
high schoolers graduate on time. However, there are disparities in educational achievement based on race, disabili-
ty, language and socioeconomic status.
RECOMMENDATION: Schools need adequate resources to create successful learning condi-
tions for students, particularly those with disabilities or language barriers and those who are impacted
by poverty. Michigan should adopt a weighted school funding formula to fund schools based on com-
munity and student need.
Fund K-12 schools as intended
Though Michigan has steadily increased per-pupil funding, when adjusted for inflation, per-pupil funding
actually fell by 9% between 2008-2019. Even more, from 2010-2019, Michigan shifted a total of $4.5 billion
intended for K-12 public schools to universities and community colleges to help balance the state budget.
RECOMMENDATION: Use the money in the state’s School Aid Fund solely for K-12 educa-
tion, as had been done prior to 2009.
Keep students in school
Michigan had the third-highest rate of fourth-grade chronic absenteeism in the country in 2019, an increase of near-
ly 47% since 2015. Students who are economically disadvantaged and/or homeless are most likely to be chronical-
ly absent. Michigan is also one of five states with the highest out-of-school suspension rates.
RECOMMENDATION: Address absenteeism by tackling economic and housing insecurity.
In the meantime, ensure attendance programs meet the needs of all students, adopt real-time atten-
dance tracking tools to identify students at risk of chronic absenteeism early on, and put the appro-
priate support services in place. Address Michigan’s high suspension rates and racial disparities in
discipline policies and practices.
10 | 2021 Kids Count in Michigan Data BookHealth and Safety
Ensure no kid goes hungry
Child food insecurity rates range, by county, from a low of 6.7% to a high of 26.8%; in other words, a child may be
four times more likely to be food insecure depending on where they live. The state average is 15%, and Michigan’s
rural and northern counties have the highest rates of food insecurity.
WIN & RECOMMENDATION: The 10 Cents a Meal program helps schools purchase healthy
foods (and support local farmers). Additional funding was secured in 2020 to expand program availabil-
ity from 43 counties to every county in Michigan. The state should continue to increase funding so kids
in every school district and child care center can fully benefit from the program.
WIN & RECOMMENDATION: The lifetime ban on food assistance for residents with certain
drug convictions was eliminated in 2020. However, state policy still requires families to cooperate with
child support collection if the other parent is not living in the home (or show good cause for not doing
so). Michigan should join the vast majority of states and eliminate this requirement for food assis-
tance.
Expand healthcare to reach more kids
Access to health insurance supports better outcomes for children and adults. Health insurance coverage for young
people ages 0-18 was at 97% in 2019, one of the highest rates in the nation. Still, 78,000 young people are without
health insurance, including children who are lawful permanent residents (“green card” holders).
RECOMMENDATION: Children and pregnant women who are lawful permanent residents
(“green card” holders) cannot access public health insurance during a five-year waiting period after
arriving in the United States. The state should waive this optional Medicaid/Children’s Health Insur-
ance Program (CHIP) waiting period to expand children’s healthcare coverage and support healthy
birth outcomes.
Invest in public health insurance options
Children’s health insurance coverage is often related to parental coverage. Before COVID-19, 38% of kids were
insured by a public health plan. By the end of 2020, 66% of households with children reported lost employment
income since the start of the pandemic. As expected, Medicaid and the Healthy Michigan Plan saw an increase in
enrollees.
WIN & RECOMMENDATION: To accommodate the growing number of people covered by
public insurance, Michigan must continue to invest the necessary state dollars to qualify for federal
support and prevent Michigan from scaling back insurance eligibility or benefits.
Support maternal and infant health
The health of newborn babies and mothers is a sign of population health. While Michigan counties experience a
range of birth outcomes, the state lags behind the U.S. in many areas.
WIN: In 2020, the Michigan Legislature voted to fund the Healthy Moms Healthy Babies initiative to
improve healthcare and health outcomes.
Expand health services in school settings
Michigan statute does not have specific language that allows minors to consent to many basic medical services. This
poses unique barriers for unaccompanied youth, foster care youth, homeless youth and the effectiveness of school-
and community-based health centers. Access to health services is important, made clear by a year that threatened the
physical and mental health of people of all ages.
RECOMMENDATION: Address barriers young people may face in accessing school-based
health services, including clear guidelines and the ability to consent to basic health services. To pro-
mote and ensure access to mental health supports, the student-to-school-counselor ratio in school
settings should be at levels recommended by mental health professionals.
2021 Kids Count in Michigan Data Book | 11KIDS COUNT IN MICHIGAN 2021
STATEWIDE DATA PROFILE
POPULATION 2010 2019 % change POPULATION BY RACE (2019)
Total population 9,883,640 9,986,857 1.0% Child population by race Young adult population by race
Child population 2,344,068 2,143,933 -8.5% Hispanic 0-17 182,284 Hispanic 18-24 69,220
• Ages 0- 5 720,314 683,798 -5.1% Non-Hispanic 0-17 Non-Hispanic 18-24
• Ages 6-12 915,888 831,314 -9.2% • African American/Black 386,454 • African American/Black 156,345
• Ages 13-17 707,866 628,821 -11.2% • American Indian 17,394 • American Indian 8,022
Young adult population • Asian/Pacific Islander 81,168 • Asian/Pacific Islander 45,612
• Ages 18-24 976,358 945,523 -3.2% • White 1,476,633 • White 666,324
KEY TRENDS OVER TIME BASE YEAR (2010) MOST RECENT YEAR (2019)
NUMBER RATE NUMBER RATE RATE CHANGE TREND
Children in poverty, ages 0-17 537,003 23.4% 367,411 17.5% -25.2%
Young adults in poverty, ages 18-24 235,962 26.7% 217,457 24.5% -8.3%
Households in Poverty & ALICE 1,569,992 41.2% 1,508,284 38.1% -7.6%
ECONOMIC SECURITY
ADDITIONAL DATA (2020 UNLESS NOTED)
Children receiving... NUMBER RATE
• Free and reduced price lunch, K-12 710,473 50.5% KIDS COUNT provides child
• Subsidized child care, ages 0-12 25,246 1.7% advocates, agencies, public
• Cash assistance (FIP), ages 0-18 26,657 1.2% officials and legislators with the
• Food assistance (FAP), ages 0-18 491,075 21.6% best available data, nonpartisan
policy recommendations and
• Women, Infants and Children (WIC), ages 0-4 (2019) 253,535 44.3%
tools to advance policies that
• Supplemental Security Income, ages 0-18 ^ 37,102 16.3 benefit children.
• Any amount of child support owed 397,443 83.6%
Median household income (2019) $59,522 N/A Our data-based profiles help
Average cost of full-time child care/month $632 N/A
decision-makers understand the
• Percent of full-time minimum wage
educational, social, economic
N/A 37.9%
and physical well-being of
Families receiving the Earned Income Tax
children across the state.
Credit (EITC) (2019) 738,380 15.1%
Families with high-cost housing (2019) 1,052,604 26.7%
KEY TRENDS OVER TIME BASE YEAR (2010) MOST RECENT YEAR (2019)
NUMBER RATE NUMBER RATE RATE CHANGE TREND
3- and 4-year-olds in preschool 118,875 47.1% 111,486 47.5% 0.8%
3rd graders proficient in English Language 53,643 50.1% 45,457 45.1% -9.9%
Arts, M-STEP (Base: 2015)
8th graders proficient in Math, M-STEP 35,959 32.2% 36,118 32.7% 1.7%
EDUCATION
(Base: 2015; Recent: 2018)
Students graduating on time (2020) 104,818 76.0% 97,070 82.1% 8.0%
ADDITIONAL DATA (2020 UNLESS NOTED) NUMBER RATE
Children receiving Early On services by ISD, ages 0–2 9,646 2.9%
Students in Special Education 210,467 14.5%
Students who are homeless by ISD, K–12 31,710 2.1%
8th graders proficient in Math, PSAT (2019) 44,565 41.4%
Students who drop out 9,186 7.8%
Teens not in school or working, ages 16–19 (2019) 36,087 6.8%
12 | 2021 Kids Count in Michigan Data BookKEY TRENDS OVER TIME BASE YEAR (2010) MOST RECENT YEAR (2019)
NUMBER RATE NUMBER RATE RATE CHANGE TREND
Less than adequate prenatal care 34,838 29.6% 35,408 32.2% 9.0%
Infant mortality^ 864 7.3 726 6.6 -9.9%
HEALTH & SAFETY
Child deaths, ages 1-14 ♦
306 17.0 308 18.5 8.8%
Teen deaths, ages 15-19 ♦
398 54.0 301 46.1 -14.6%
Young adult deaths, ages 18-24♦ 824 84.7 788 82.1 -3.0%
ADDITIONAL DATA (2020 UNLESS NOTED)
NUMBER RATE
Children with health insurance, ages 0-18 (2018) 2,162,351 96.7%
Insured by Medicaid, ages 0-18 1,054,641 46.3%
Low-birthweight babies (2019) 9,551 8.7%
Fully immunized toddlers, ages 19-35 months 119,786 70.7%
Children tested for lead, ages 1-2 (2019) 91,906 40.9%
Children hospitalized for asthma, ages 0-14t (2018) 2,205 10.3
Children with food insecurity, ages 0-17 (2018) 318,206 14.7%
Mental health providers (ratio of population to provider) (2019) 26,794 373:1
KEY TRENDS OVER TIME BASE YEAR (2010) MOST RECENT YEAR
NUMBER RATE NUMBER RATE RATE CHANGE TREND
Births to teens, ages 15–19^ (2019) 11,523 32.0 5,036 15.7 -50.8%
Child abuse/neglect, ages 0–17 (2020)
• Children in investigated families^ 164,648 70.1 205,631 95.9 36.8%
FAMILY & COMMUNITY
• Confirmed victims ^
32,504 13.8 27,894 13.0 -6.0%
• Children in out-of-home care ^ 12,004 5.1 10,023 4.7 -8.5%
ADDITIONAL DATA (2019) NUMBER RATE
Living in high-poverty areas, ages 0–17 289,904 13.6%
Household structure, ages 0–17
• Family with married parents 1,412,972 66.5%
• Family with single parent 712,938 33.5%
Poverty by household structure, ages 0–17
• Family with married parents 125,569 8.9%
289,760 40.6%
• Family with single parent
English not spoken at home, ages 5–17 170,556 10.6%
Children in homes with internet at home, ages 0–17 1,952,456 89.9%
An equitable, two-generation approach will help create a better future for Michigan's kids.
A child’s well-being should not be determined by their race, place or income, but data shows that this is the reality.
That’s why our racial equity lens considers how policy decisions help or hinder outcomes. We also consider access
to opportunity for the adults in kids’ lives when working to improve well-being.
^Rate per 1,000 tRate per 10,000 ♦Rate per 100,000
For all data definitions and sources, see the Data Definitions and Notes page.
More data (including nearly 100 indicators, trends, graphs, rates and more) are on the Kids Count Data Center.
KEY = IMPROVING = LITTLE CHANGE = WORSENING
2021 Kids Count in Michigan Data Book | 13Population and demographic overview
Michigan is growing older:
Seniors only age group
30%
that grew from 2010-2019 29.2%
25%
While Michigan’s total population increased by 20%
just 1% in the last decade, patterns of growth
15%
and decline vary by age group. The number of
children ages 0-17 steadily declined by nearly 10%
9% (200,135) from 2010-2019.
5%
The number of working-age adults (ages 25- 0%
-3.2%
64) declined by about 68,600, but remained -5%
-1.3%
the largest share (65%) of Michigan adults. -8.5%
Comparatively, seniors (age 65 and up) were -10%
0-17 18-24 25-64 65+
the only age group that grew in size during that
Age group
same period.
Source: National KIDS COUNT and National Center for Health Statistics
Small changes in children's racial diversity
69% 67%
2010 2019
in last decade
Michigan’s children are nearly equally
male (51%) and female (49%).1 There
have been small changes in the racial
16% 16%
and ethnic makeup of the state’s youth
over the last decade. Currently, the ma- 7% 9%
3% 3% 4% 5%
1% 1%
jority of minors are White (67%), BlackIt’s in our power to create a Michigan where families and
businesses thrive—where everyone’s needs are met, high-
quality learning is available and affordable at any age, people
experience physical and mental wellness, and families and
communities are together and stronger than ever.
2021 Kids Count in Michigan Data Book | 15Family and
Community
Feeling connected and supported by a
community is essential to children and young
adults’ well-being and success in all aspects of
life, including health, academic achievement and
future economic security.
When communities have caring adults and
strong institutions like good schools and quality
support services, families and children are more
likely to thrive.
Concentrated poverty pushes quality resources farther from reach
High-poverty areas—U.S. Census blocks where 30% or more of households are at or below the federal poverty
line—experience a lack of revenue and investment that creates lower-resourced institutions. This impacts families’
access to healthy food, quality medical care, education, jobs, and physical environments free from environmental
hazards.
A history of racial and economic geographic segregation, including the legacy of “white flight” in the 1950s and 60s,
impacts the racial and economic makeup of Michigan neighborhoods today. During white flight, white families left
cities that were becoming more racially diverse for suburban areas. This large-scale movement shrank the tax base
and decreased revenue for city services in the midst of legal discrimination on the basis of race in all sectors, includ-
ing—and especially in—housing and employment. Institutional racism and de facto segregation continue today.
In Michigan, 14% of children live in high-poverty areas, and county averages range from 0%-40%. The number of
kids living in concentrated poverty has increased by 78,000 since 2000, a rate increase of 36%. Not all families who
live in areas of concentrated poverty are poor.1
Children living in high-poverty areas are impacted by history of
racial and economic geographic segregation
American Indian 11%
Asian and Pacific Islander 10%
Black or African American 47%
Hispanic or Latino 23%
Non-Hispanic White 5%
Two or more races 18%
Total 14%
0% 10% 20% 30% 40% 50%
Percentage of children living in high-poverty areas
Source: National KIDS COUNT, 2014-18
16 | 2021 Kids Count in Michigan Data BookNearly half (47%) of the state’s African American children live in neighborhoods with concentrated poverty. Even
more, of the country’s 50 largest cities, Detroit has the highest rate of children living in areas of concentrated poverty
at 72%. The 2019 federal poverty level was $25,750 per year for a family of four.2
Kids not similarly positioned to learn at home
As the COVID-19 pandemic led most school districts to include or completely pivot to remote learning, many family
and community factors impacted children’s ability to learn from home.
Even before the pandemic, access to high-speed internet posed a chal-
of Michigan lenge for students to fully participate in school (and for adults to fully partic-
10%
households ipate in the job market). At least 10% of Michigan households didn’t have
lacked home home internet access in 2019. Earners with lower incomes were even less
internet access in likely to have high-speed internet and were more reliant on using smart-
2019. phones to access the internet for tasks that are designed for larger screens,
like homework.3
Even with internet access, families’ ability to support learning at home varied. For example, for the last decade,
10%-11% of children did not live with an adult who speaks English at home.
Neglect and abuse threaten healthy connections
Michigan’s children are more likely to be victims of
neglect than abuse, and younger children (ages An overview of abuse and neglect investigations
0-5) are more likely to be victims. A threat
to healthy development, the root causes
of neglect and abuse are complex, but
challenges like substance use, mental
health problems and chronic or toxic
stress are risk factors.4
In 2020, 205,631 minors were in families
where an investigation of alleged child
neglect or abuse occurred. This is the first
decrease in investigation numbers since
2013. Of those investigations, 14% (27,894)
were confirmed as neglect or abuse—a third
consecutive year of decreased substantia-
tions.
When neglect or abuse is substantiated,
children may be placed in care outside of
their home: in a foster home, with relatives,
in group homes or in residential care. How
long youth stay in care depends on their Each person represents
family situation and what options are availa- approximately 2,000 youth
ble in their communities.
Source: "Michigan Department of Health and Human Services, Children's Protective Services, 2020
Because stability and building bonds with
adults is so important, staying in the home is preferred when appropriate, followed by out-of-home care with rela-
tives. Group and residential care, especially over an extended period of time, can pose serious threats to healthy
development.4 In 2020, about10,000 minors were in out-of-home care due to neglect or abuse.
Though foster care is meant to be temporary, nearly 35% of kids in foster care in 2020 had been there for two or
more years.5 Many youth remain in care for more than three years.6 The majority of youth who exit foster care in
Michigan are reunited with a parent or caregiver, followed by adoption and emancipation.
2021 Kids Count in Michigan Data Book | 17What can adults do to make you feel supported
and cared about?
Get involved in our discussions
and give us suggestions that
we can accept. Check on me. Play football with me.
Talk with me and so on.
Tyler, 14, Ingham County
Amelia, 15, Wayne County Christopher, 12, Genesee County
Something I think adults can do to make kids
feel more supported is just simply check in
Adults could give us more time to
every day with them.
do things since a lot of kids have a
lot on their plate, and try to be more
Ask if they’re ok, or if they need anything.
understanding towards our feelings.
And let them know their hard work isn’t being
overlooked.
MiracleRay, 16, Wayne County
Ariel, 15, Wayne County
Foster care youth and young adults in our focus groups talked about the importance of programs like the Michigan
Youth Opportunities Initiative to help them transition into adulthood. They shared that foster homes should double
as resource centers and that schools could be more understanding of their unique and challenging experiences like
having court appointments during the school day, experiencing frequent moves, and dealing with the mental and
emotional weight of their experiences.
Adverse experiences and environments harm well-being
Adverse childhood experiences (ACEs)—which include abuse, neglect and household challenges like substance
abuse and mental illness—are potentially traumatic experiences that can impact a child’s ability to thrive. ACEs can
have negative impacts on mental and physical health well into adulthood. Adverse community environments (also
known as ACEs)—which include poverty, a lack of economic mobility and opportunity, discrimination, and community
violence—are also a threat to well-being.
Together, adverse childhood experiences and adverse community environments are known as the “pair of ACEs.”
Chronic stress at the individual and community level can have real, long-term impacts on behavior, health and
well-being.7
ACE scores can provide insight into the extent of potentially traumatic experiences Michiganders are grappling with
and the long-term risks they may face. ACE scores do not, however, provide insight into the adverse experience
itself nor account for positive experiences that may protect them from the effects of trauma and toxic stress. Nearly
a quarter (22%) of Michigan children have experienced two or more adverse childhood experiences, higher than the
U.S. average of 19%.
18 | 2021 Kids Count in Michigan Data BookMichigan leads states in holding minors for non-criminal offenses
In 2017, 1,260 youth and young adults under age 21 were detained, incarcerated or placed in residential facilities. The
use of detention can be a threat to important family and community connections. While many states are moving away
from incarcerating young people for non-criminal offenses, Michigan is fourth in the nation for the rate of minors held
for technical violations and it holds more young people for status offenses than 46 other states.8
Michigan’s juvenile justice system is decentralized, and each county has its own policies and data practices. The lack
of statewide coordination and oversight makes it so the state is unable to easily know, for example, how many juve-
niles are in custody at any given time. For these same reasons, experiences for
justice-involved youth, like access to support services and assessment of fines
and fees,9 can vary greatly by geographic location and impact recidivism, financial of Michigan kids
security and hardship for youth and young adults. live in
75% two-adult
Most children live in households headed by two adults households.
Despite a slow, steady decline in the last decade, 66% of children under 18 still live with two adults who are married.
Another 9% of minors live with cohabitating domestic partners. Households headed by two adults are significantly less
likely to live in poverty and are better positioned to dedicate significant financial and other resources to their children.
Teen pregnancy remains down
Efforts to reduce teen pregnancy rates over the years appear to have been effective. The number of births to teens
aged 15-19 are less than half of what they were a decade ago. The number of repeat births to teens is also down
significantly.
Comprehensive sex education, reproductive health and family planning all have implications for long-term health
outcomes. Teens in our 2020 focus groups emphasized the importance of a sexual education curriculum that is inclu-
sive of all gender identities and sexual orientations. Michigan does not have a standard sexual education curriculum,
require it to be taught in schools nor allow access to contraceptives on school grounds.
Births to teens age 15-19 continue to trend downward
Teen Births Repeat Teen Births
14,000
12,076
12,000 10,732
10,000 8,806 The number of births to
Number of Births
8,000 7,063 teens age 15-19 is
6,000
5,817
5,036 less than half
4,000 what it was a decade ago.
2,227 1,874 1,477 1,203 990
2,000 817
0
2009 2011 2013 2015 2017 2019
*Data are three year averages.
Source: Michigan Department of Health and Human Services, Division for Vital Records and Health Statistics
Building resilience through strong families and communities
Supportive adults, healthy households, and safe schools and communities create positive experiences that combat
the effects of adverse experiences young people face. Unfortunately, data on these experiences is very limited.
However, Michigan middle and high schools participate in a volunteer survey that includes data on protective factors
at the county level. These data, while limited, can be used along with personal stories from young people to create a
picture of how youth feel about their family, schools and communities as safe and supportive places.
2021 Kids Count in Michigan Data Book | 19Economic Security
Children’s brains and bodies experience ongoing
development from before birth through adulthood.
Economic security is an essential component of
development as it ensures necessary resources like
nutritious food, safety, nurturing relationships and
enrichment are readily available.
Think ahead to life in 10 years. What does it look like for
you to be thriving and living the life of your dreams?
A place to live in a good neigh- I wish I could save enough money
borhood, a job that pays well, to travel around the world and
and holidays to travel. become a writer.
It’s just bliss.
Anabelle, 18, Kent County
Chase, 18, Ingham County
A million and a half Michigan households can’t afford the basics
Federal poverty thresholds have been the standard used to determine who is in poverty since 1965. However,
this measurement has its shortcomings. For example, it is not based on the cost of household necessities and
is not adjusted to reflect cost-of-living differences throughout the U.S. or state. Poverty guidelines are a simpli-
fied version of the poverty thresholds. They are for administrative purposes such as determining eligibility for
government assistance programs.
The Asset Limited, Income Constrained, Employed (ALICE) measure provides a more accurate view of eco-
nomic security. ALICE represents working households that are above the federal poverty level, but whose earn-
ings are not enough to afford a “survival budget” based on the bare-minimum cost of household necessities. A
family of four needs an annual salary of over $64,100 to afford the basics—an income significantly higher than
the federal poverty level of $25,750 for a family of four.1
When considering families living under the poverty line and those who are ALICE, nearly 40% of Michigan
households are struggling to make ends meet. The percentage varies by county: it can be as high as 57% (Lake
County) and as low as 24% (Livingston County). The overall number of families considered in poverty and AL-
ICE is moving in a positive direction: 164,322 fewer families are in this category in 2019 compared to 2017. Still,
over 1.5 million households throughout the state are in poverty or considered ALICE.
20 | 2021 Kids Count in Michigan Data BookYou can also read