LAKE WANAKA - FOR BETTER OR WORSE? - PLANNING FOR THE FUTURE - SEMINAR HOSTED BY THE GUARDIANS OF LAKE WANAKA - Department ...
←
→
Page content transcription
If your browser does not render page correctly, please read the page content below
LAKE WANAKA – FOR BETTER OR WORSE?

          PLANNING FOR THE FUTURE

SEMINAR HOSTED BY THE GUARDIANS OF LAKE WANAKA

     LAKE WANAKA CENTRE    12 MARCH 2013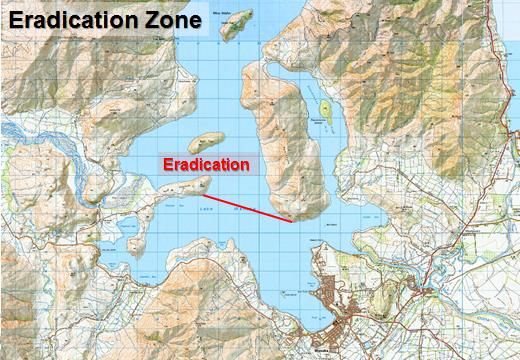
LAKE WANAKA – FOR BETTER OR WORSE? PLANNING FOR THE FUTURE
SEMINAR HOSTED BY THE GUARDIANS OF LAKE WANAKA.
Introduction
The Guardians of Lake Wanaka are appointed by the Minister of Conservation under the Lake
Wanaka Preservation Act. Their role is to advise on “preserving, as far as possible, the water
levels of the lake and its shoreline in their natural state, and maintaining and, as far as
possible, improving the quality of water in the lake”.
Following a successful workshop session in 2010, at which representatives of agencies with an
interest in the lake were invited to exchange information on current activities and programs,
the Guardians felt that a further seminar, featuring presentations from scientists and others
with specialist knowledge and experience in maintaining lake quality, would be valuable in
answering the basic questions essential to the fulfilment of the Guardians’ role
What is the present quality of the lake?
Is it appropriate? Is it stable? Is it declining?
How can we judge?
Is action required to maintain or improve the quality?
A one day seminar was held on 12 March 2013, with presentations from scientists from Waikato
and Otago universities and NIWA, as well as specialists from the District and Regional Councils,
and representatives of the local resident and farming communities.
The Guardians are very grateful for the outstanding contribution made by the scientists who
shared their knowledge of Lake Wanaka and of investigation and management of other lakes.
They not only contributed their time and expertise, but generously provided for their own
attendance at the seminar.
Intended Outcomes
The expectation of the seminar was to provide for:
Sharing information on programs, research, monitoring and control efforts currently in place
in New Zealand and beyond and reviewing relevance to Lake Wanaka
Identifying areas where further research, improved monitoring or specific control programs
could benefit Lake Wanaka, and other deep water lakes.
Establishing priorities, identifying appropriate allocation of responsibilities and possible
sources of funding where new or expanded initiatives or programs are seen as desirable.
Identifying mechanisms to further co-operation and optimum follow-up
Themes of the Seminar
All the presentations reinforced strong themes:
That the quality of Lake Wanaka (and other deep water Southern Lakes) is greatly valued
locally, nationally and internationally
That Lake Wanaka is currently in a good condition, but this condition has been changing over
recent years
That in order to know how significant changes are, it is essential to have good data.
Good data is essential to good science. Good science is essential to good outcomes
That it is critical to address any concerns regarding lake deterioration before major problems
occur, rather than trying to mount a recovery operation.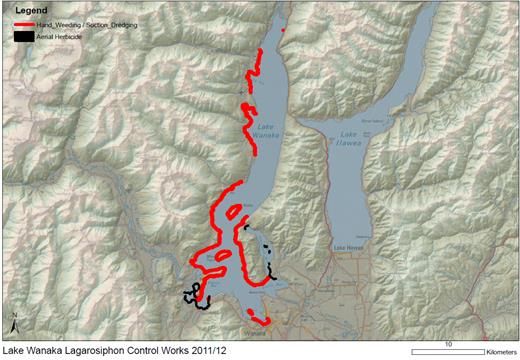
Case studies of Lake Taupo and the Rotorua Lakes were very valuable in providing examples of the cost and difficulty of recovery operations, as well as examples of co-operative planning and management, with strong community input. Where to from here? Protecting the quality of Lake Wanaka for future generations will depend on: the establishment of community endorsed goals extensive and continuous monitoring co-operative oversight, involving all relevant agencies There was a high level of support from all agencies and community groups participating at the seminar. The Guardians have collated these proceedings for publication as a basis for advancing future efforts. Helen Tait Chair, Guardians of Lake Wanaka
Seminar Programme – Contents Page
Lake Wanaka – Past, Present and Future
Dr Marc Schallenberg, Research Fellow, Zoology Dept., University of Otago 4
With input from Tina Bayer, PhD Student
Historical and international context of studies of Lake Wanaka
Identified influences and measures to date
Land-water Interactions in the Lake Wanaka Catchment 10
Amy Weaver, PhD Candidate, Zoology Dept., University of Otago
Changes in vegetation and land use
Variations in stream nutrient measures
Relationship between nutrient levels and “lake snow”
Influences on the Lake: Current practices and observation of effects 15
1. Nichola Evans, QLDC 3 Waters Service Engineer
QLDC controls on storm-water and waste-water and water intake provisions
2. Jonathon Wallis, High Country Farmer
Farming issues and practice in the Wanaka catchment
3. Graham Dickson, President Wanaka Residents’ Assn.
Residents’ concerns regarding observed changes and the need for future protection
Case Study 1. Decision Framework for the Management of Lake Taupo 19
Dr Clive Howard-Williams, Chief Scientist, Fresh Water and Estuaries, NIWA
Recognition of catchment changes and their effects on the lake
Framework for planning and decision-making on controls and levels to be maintained
Funding and methodology to achieve the defined outcomes
Case Study 2. Rotorua Lakes and the Value of Monitoring 24
Prof. David Hamilton, Prof. of Lakes Restoration, University of Waikato
Impacts of extensive catchment modification
Range of efforts required to recover from serious degradation
Critical importance of sound information as a basis for decision-making
Central and regional government co-operation and funding
Monitoring and Control
1. QLDC District Plan Process – Leigh Overton, Wanaka Ward Councillor, 30
and Chair QLDC Strategy Committee
QLDC District Plan controls and plan review process
2. ORC Water Plan. Rachel Ozanne, Water Quality Scientist, Otago Regional Council 30
Outcomes defined for ORC water plan controls
Intentions and process for plan change 6A
The Condition of Lake Wanaka as Indicated by Aquatic Plants 34
Dr John Clayton, Principal Scientist, Freshwater and Estuaries, NIWA
The value of studying plant types and status as an indicator of lake quality
SPI methodology and other measures
Observations applied to Lake Wanaka
The Lake Wanaka Lagarosiphon Control Programme 39
Marcus Girvan, Biosecurity Consultant, Boffa Miskell
The history and achievements of the Lake Wanaka 10 year lagarosiphon control programme
Future Directions – Discussion and Guardians’ Post Seminar Follow-up 41
The need for long term data as a basis for direction setting and monitoring progress
The need for a co-operative decision-making and management framework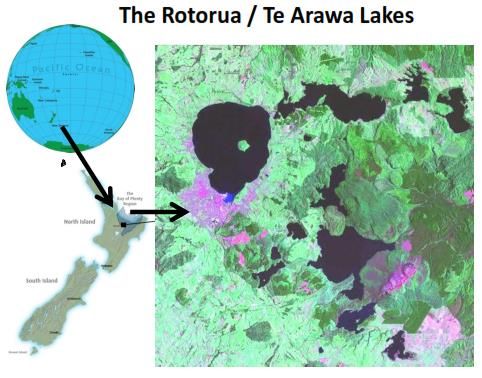
Lake Wanaka – Past, Present and Future
Dr Marc Schallenberg, Research Fellow, Zoology Dept., University of
Otago
With input from Tina Bayer, PhD Student
Otago University work with Lake Wanaka started with some recordings taken in 1994 and 2002
by students undertaking comparative studies. It was not until 2008, with ORC funding for a
PhD study of land use impacts on the lake, that the lake was studied in a more intensive way.
Marc Schallenberg’s background was growing up in Toronto, on Lake Ontario, and spending
time on the surrounding freshwater lakes and streams, which led to his interest in freshwater
ecology. After his PhD he came to a position at NIWA, and then to Otago University, where he
has undertaken research, including work with colleagues at the Cawthron Inst. and NIWA. His
scope has included over 70 lakes from Northland to the Campbell Islands, allowing him to place
the study of any individual lake into a broader context – ecological (his prime focus) as well as
economic, recreational and cultural.
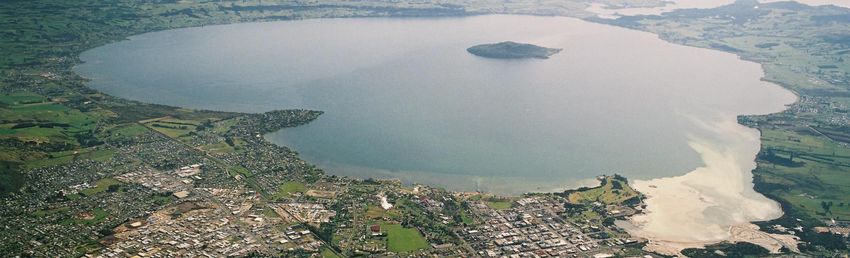
The origin of Lake Wanaka is in the clashing of the Australaisian and Pacific tectonic plates,
which pushed up the mountain spine of the South Island. The “roaring forties” location means
that there is heavy precipitation from winds bringing moisture from the Tasman sea. Millennia
of glaciation retreating and advancing have created an archipelago of lakes, all similar in
draining to the south-east of the Southern Alps, fed by both rainwater and melting snow. They
can be characterised as the “Southern Great Lakes” of New Zealand. There are advantages in
studying the lakes as a group.
Lake Wanaka is in the middle of the
archipelago, which has the following features at
play: a vegetation gradient in the catchment
from native forest in the headwaters through
to open landscape with Tussock in Otago. In
the Waitaki catchment there is an impact of
glacial flour from the highest glaciers in the
country. In terms of influences on Wanaka
precipitation is in the low to moderate range,
there is a little glacial flour, but nothing like the
Waitaki lakes, land use intensity is low to
moderate, but increasing. The lake can be
seen as pristine, but is on the cusp of change.
Background specifics: Wanaka is a deep lake, at 311 m. one of the deepest in New Zealand; it
is a large lake (180sq. kms), with a large catchment area (2590 sq. kms), and a large volume of
water (33 cub. kms). The residence time (the time taken for the total volume of water to
replace itself) is long at 5 – 6 years, meaning that the water stays for long periods, giving rise to
some of the lake’s characteristics – its clear water, and low nutrients, relative to other lakes.
Values of Lake Wanaka include:
Natural values:
Scenic beauty – the lake defines the region
Relatively clean, clear water through self purification due to the long residence time
Biodiversity 4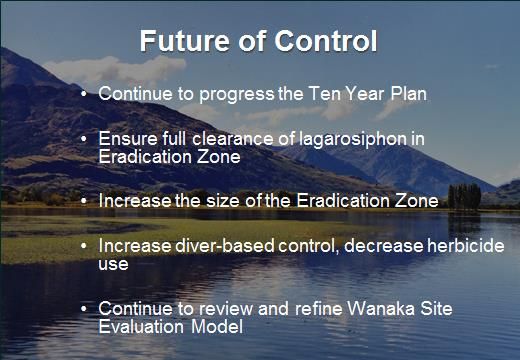
Economic values:
Drinking water
Recreation
Salmonid fishery and commercial fishing activities
Tourism
Provides clean water to downstream communities
Pressures facing lake Wanaka include land use change, increased presence of non-native species,
and climate change. This diagram shows the interaction between pressures and responses.
Land use intensification will be dealt with in
Amy Weaver’s presentation.
Climate change projections show that the
lake can be expected to become warmer
and subject to higher precipitation. There
are already signals that there is more water
flowing through the lake.
Responses:
There has been a shift in the composition of the dominant algae in the lake. In 1994 and 2002
student research found the dominance of Picocyanobacteria – the smallest organisms on the planet.
Picocyanobacteria dominate low nutrient systems, and are the dominant plankton in the oceans.
By 2008 they had been largely replaced by diatomaceous species like Cyclotella, commonly found in
5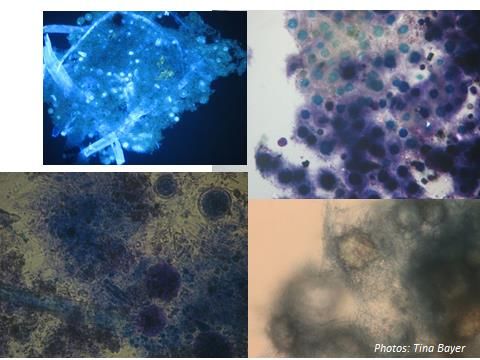
“lake snow”, so the microbial biomass has moved from an extremely small organism to a somewhat
larger organism. These larger and more plentiful organisms have an effect on the food web in the
lake, and a key question is whether they are a biological indicator of the effects of changes in
climate and land use.

Tina Bayer’s work shows the total volume and dominance of algae, including Cyclotella, and the
move from dominance of Picocaynobacteria to dominance of Cylclotella, particularly during
summer periods. There does seem to be evidence of a link between Cyclotella and lake snow.

There is a short video on lake snow posted on UTube by the University of Otago,
http://www.youtube.com/watch?v=94xs81d6w9Q which led to contact by staff from the Seattle
Water Utility, who had a problem with lake snow in their drinking water supply – identified as being
associated with cyclotella. They had taken photographs of the cyclotella, showing the long strings
of polysaccharides, which were acting like a glue in the lake. This seemed very similar to the effect
observed in Lake Wanaka.

It is not a common effect. Of the 70 lakes observed in New Zealand, it has only been found in Lake
Wanaka, but has been observed elsewhere, such as Lake Constance in Europe and Mono and
Youngs Lakes in the USA. It has been a cause of considerable concern to Wanaka residents and lake
users. Microscopy photographs of Lake Wanaka samples show a high degree of similarity to the
Seattle samples

                                                                                                    6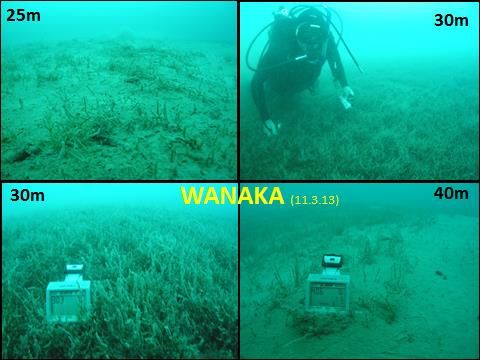
Lake Snow – Possible Causes

                                                                                 In 2011 a study
                                                                                 was conducted in
                                                                                 association with
                                                                                 QLDC looking at
                                                                                 factors in the
                                                                                 existence of lake
                                                                                 snow in the
                                                                                 water supply.
                                                                                 This chart
                                                                                 examines
                                                                                 possible causes
                                                                                 and contributing
                                                                                 factors, with
                                                                                 cyclotella at the
                                                                                 head of the list as
                                                                                 the most likely
                                                                                 contributing
                                                                                 cause.

Pressures Continued - Invasive Species in the Lake
Dr Carolyn Burns of Otago University has conducted a study of daphnia pulex and daphnia carinata,
and the different environmental conditions which they prefer. The findings are that daphnia pulex
definitely seems to prefer warmer temperatures, it does reach greater densities, and it therefore
has a greater grazing pressure on the algae in the lakes and could additionally be                7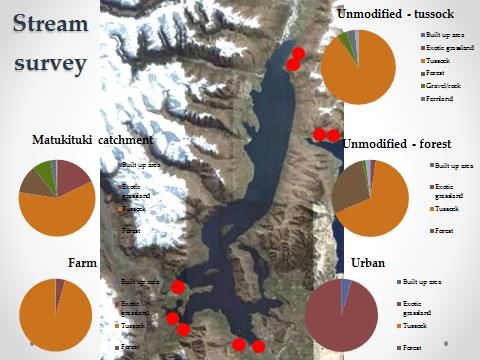
selecting different algae. These studies are at an early stage, but could be an important element of
the pressures and responses in Lake Wanaka.

Lagarosiphon has been a big issue for the lake and there have been efforts to control the invasion.
(See later paper). This is another factor which shouldn’t be forgotten.

Pressures Continued – Climate Change

    These changes will have a direct influence on the lake itself, as well as on the catchment. There
    will be more rainfall and run-off, bringing more materials into the lake, as well as a likely
    increase in wind-blown dust down the braided river valleys, which could potentially also add
    nutrients to the lake.

    The question is raised as to whether these climate change effects could already be having an
    effect on the type of algae in the lake and the growing dominance of Cyclotella. Data collected
    by the Otago Regional Council, and provided by Rachel Ozanne, covers the period from 1994 to
    almost the present day. The temperature has been taken when water samples have been
    collected 5 or 6 times a year. Although discreet rather than continuous readings, the records
    do show an increase in winter temperatures over that time, in line with the prediction by
    climate scientists that it is winter and night-time temperatures which will respond most to
    climate change. Evidence from other lakes is that Cyclotella is linked to warming.

    Climate Change and Lake Composition

    In the winter the lake temperature tends
    to be constant at all depths, but as the
    lake warms in the summer the warmer
    water is more buoyant and sits on the
    surface of the colder water, requiring
    more and more energy to mix the warm
    water down. This increases both the
    temperature and the level of light in the
    algal environment driving the increase of
    the algae.

                                                                                                      8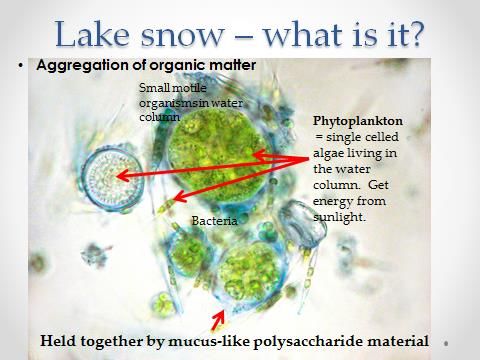
This was the focus of Tina Bayer’s PhD research.
                                                   She took a complex model, developed by
                                                   Professor David Hamilton of Waikato
                                                   University, to take the NIWA climate change
                                                   predictions and draw some conclusions
                                                   about lake mixing. The study examines two
                                                   scenarios: a change in temperature, with
                                                   wind levels remaining the same, or with a
                                                   10% increase in wind. Both scenarios
                                                   provide a longer growing season for the
                                                   algae, with more available light. This,
                                                   coupled with a likely increase in nutrients
                                                   also leading to increased development of
                                                   algae raises the question as to what is the
                                                   next stage after Cyclotella, continuing the
                                                   growth trend.

Conclusion
Overall the factors examined in studying pressures and responses indicate a need for more data
and further study. Some issues requiring further exploration will be raised in later papers.
Land-water Interactions in the Lake Wanaka Catchment
Amy Weaver, PhD Candidate, Zoology Dept., University of Otago
Supervisors: Dr Marc Schallenberg, & Prof. Carolyn Burns
The purpose of Amy’s study is
to discover whether changing
land use patterns are causing an
increase in nutrients entering
the lake, and, if so, whether this
increase is having an adverse
effect on the lake.
The study monitored 9 streams,
representing a gradient of land
use. In particular the Matukituki
streams were monitored to
assess the material being carried
into the lake and the distance
into the lake.
The second part of the study
examines the cycling in the lake
and the extent to which
nutrients entering the lake are taken up by micro-organisms.
The third part of the study examines the relationship between nutrient build-up and the formation
of “lake snow”, the slimy substance which has caused concern to fishermen by clogging their lines,
and has caused problems with clogging water supply systems.
Considerable data has been collected and is still being analysed to provide information on:
Changes in vegetation
Visible changes in the landscape over 20 years (via remote sensing)
A stream study – focusing on nutrients and organic material
The relationship between nutrient input and “lake snow”
The following presentation focuses on the latter two elements: the stream study and the formation
of “lake snow”
Known Historic and Prehistoric Changes to the Catchment
By the end of the last glacial period
the area around the lake was
predominantly grass and shrubland,
which was taken over around 7,500
years ago by evergreen forest –
lasting until around 600 years ago,
when repeated fires destroyed the
forest communities, and they were
replaced by grassland.
With the arrival of European settlers
grasslands were favoured for
livestock grazing, and remaining
forests removed by milling.
10The land use continues to change, as shown through remote sensing imagery. The images show the
Matukituki catchment with the red areas showing an increase in the greenness of the catchment,
representing a change from tussock to exotic grassland, or the application of fertiliser.
This is important to study as human modification of the catchment can result in increased volumes
of nutrients leaching through the soils into the streams and through sub-surface flow. The
application of fertiliser can also increase the nutrient level and potential for leaching.
In urban areas there can also be increased nutrient run-off through storm-water with increased hard
surface areas, and potentially an effect from the disposal of waste-water – all with the potential to
affect rivers and streams. When these rivers and streams run off into a deep lake the effects of
increased nutrients may be buffered, perhaps showing initially only in shallow bays, but experience
with other large lakes, such as Lake Tahoe, or even Lake Taupo in New Zealand, shows that the
increase can cause degradation over time.
What is Being Carried Into Lake Wanaka? And is There a Difference in What is Being Carried from
Modified or Unmodified Catchments?
In 2009/10 and 2011/12
a survey of 9 streams
was carried out,
attempting to sample a
gradient of land use
types. It was difficult to
identify a full range of
land use types around
Lake Wanaka, most
being characterised by
tussock grasslands. The
least modified were
streams flowing into
Lake Hawea. The
largest body of water
sampled was the
Matukituki, which is
glacially fed, and was
reviewed separately.
Diagram shows the gradient of land use of the study streams
The study measured temperature, dissolved oxygen levels, pH, and flow rate, as well as water
samples to assess nutrient concentrate, including dissolved phosphorus, total nitrogen, total
phosphorus, and dissolved organic carbon. At each sampling time NIWA climate data was noted.
Percentage catchment cover in each case has been assessed from 2002 GIS data, but this is currently
being updated to a later set of data.
The State of Lake Wanaka During the Sampling Period
Lake classification shows the range from a Microtrophic lake – typified by good water quality, and
clarity to a Hypertrophic lake, with high levels of nutrients and organisms in the water – “sick” lakes.
Wanaka during the study was characterised by Microtrophic to Oligotrophic levels, in terms of
levels of nitrogen and phosphorus. Water clarity was good, with visibility down to 7 to 10 metres.
11However, when the lake measures were compared with the stream samples, higher concentrations
of nitrogen could be seen, depending on the level of modification.
Overall study results can be compared with a
study conducted in 1975/76 by the Guardians
of Lake Wanaka. Four of the streams were
common to both studies. Three of the
streams show minor increase in nitrate levels
from 1975 to the present day, but the Alpha
Burn shows a difference too significant to be a
difference in sampling techniques.
Phosphorus concentrations were more
variable – generally low, but with occasional
spikes, in both modified and unmodified
catchments.
Dissolved Organic Material
In addition to nitrate levels, levels of
dissolved organic matter can be an
important indicator of lake health –
important because it is a source of
energy for bacteria, and in being broken
down by bacteria can release nitrogen
and phosphorus.
Levels can be changed through changes
in drainage in the catchment.
Results were similar to the nitrogen
measures – higher in modified than
unmodified catchments. It was
interesting to note that forested
catchments were not significantly
higher than other unmodified catchments.
Overall a 30% variance was recorded in dissolved organic material, controlling for soil moisture
12Impacts on the Lake
Impacts are difficult to assess because of the buffering effect of the lake size, but the study’s interest
was in examining the possible impacts on the formation of “lake snow” - which is the clumping
together of microscopic bacteria and algae, together with a mucus-like polysaccharide material. It is
often noticed during algal blooms, and is possibly caused by cells trying to get rid of excess energy.
The clumps can get big enough to be seen with the naked eye.
In order to assess effects, stream water, from 3 different tributaries around the lake, was mixed with
lake water: Alpha Burn – which drains a farmed catchment, Bullock Creek – to represent an urban
catchment and Boundary Creek – to represent a tussock dominated catchment. Lake water was
used as a control.
To assess whether decaying aquatic plants could be a source of the mucus-like material, fronds of
lagarosiphon were left to leach out in a water and mixed with lake water.
Results overall showed an increase in TEP
levels , which were 2.5 times higher when
the experiment was repeated with water
“spiked” with higher concentrations of
nutrients.
Assessment has not yet been undertaken
as to the dominant form of algae, or
whether the dominance changes during
the build-up of nutrient levels.
The lake is of course a much more
complicated environment with a wider
range of variables than in the laboratory
experiments, and further study is needed.
One area of interest is in the relationship between the polysaccharide build-up and the decaying of
aquatic plants, particularly, for example after the spraying of the lagarosiphon beds. This could be
analysed in the field before and after a spraying event, with a parallel controlled experiment
controlling for light etc. There is the possibility of a nutrient pulse into the lake, which could create
a bloom.
13Further Study is Needed Both in the Field and in the Laboratory
There are numerous additional factors to be included in the studies over time:
14Influences on the Lake: Current practices and observation of effects 1. Nichola Evans, QLDC 3 Waters Service Engineer Nichola Evans has responsibility for 3 waters operational & maintenance services in Wanaka, including the control of stormwater – the release of water into the lake, and water supply – the taking of water from the lake. QLDC responsibility is not for maintaining or monitoring the quality of water in the lake, but for controlling what goes in, by way of stormwater, and making use of the water extracted for water supply. Stormwater 3 Waters efforts deal primarily with the stormwater as it comes off the roads, by way of catch pits and mud tanks, where a syphon system and regular cleaning out deals with grit, which has been applied to roads in winter and oil residue. The work is conducted within the ORC water plan rules for discharge of stormwater. The proposed Plan Change 60 will have an impact on how stormwater is discharged. Additional development in Wanaka increases the impervious area, which in turn increases run-off, but infrastructure is set up in advance of development, so additional discharge is handled by the existing reticulation system. Wastewater The QLDC system discharges through Project Pure – which is tertiary treated and discharged sub- surface about 10 Kms downstream from Wanaka. The project has been set up within ORC consent requirements. QLDC also owns the Glendhu Bay campground where wastewater treatment has also recently been upgraded to tertiary treatment. Water Supply QLDC has consents for two water intakes – western, near Rippon, and another near the outlet. The daily take for the water supply is approximately 0.2% of the lake outlet flow. Concern has been expressed regarding the algae which blocks filters in Wanaka during summer months. Complaints have been recorded and monitored since 2008, and seem to relate to problems throughout the system, rather than being confined to any particular area. The algae causes no public health concerns, and QLDC works within drinking water standards. In May 2011 a report by MWH was published, examining algae issues – possible causes and proposed responses. Samples were monitored from 4 optional intake points around the lake. A micro filtration plant option was considered and trialled, but the cost of $6.3m was considered excessive for full implementation, based on community feedback to the Council Long Term Plan. There was 26% support for the project which would require a 6.8% increase on rates. Intakes are regularly monitored and cleaned. A backwash is being installed on the western intake to reduce algae at that point. Continued monitoring of complaints and issues is in place. 2. Jonathon Wallis, High Country Farmer Jonathon Wallis expressed appreciation of the seminar as a means of being proactive in safeguarding the values of the lake. He lives at and manages Minaret Station, on the western shores of the lake. The station accounts for some 26% of the lake shoreline. His brief for the seminar is to discuss present and predicted farming practices influencing the catchment area. He emphasised that he is not an elected representative of the local farming community, and therefore is presenting his own views, but believes that these views are generally held by others in the farming community. 15
It is important in examining farming in the area to maintain it in its context. Pastoral farming in the
area is relatively unique. Farming is going through a significant time, with animals and people being
required to work harder for less. The adage that farmers buy retail and sell wholesale has never
been more true. Farming is increasingly being driven by factors beyond the farm gate. The public
have heightened awareness and views regarding animal welfare and the environment.

Farming in the catchment is predominantly pastoral, with a small amount of cropping, mostly in the
form of winter forage. Of approximately 150kms of shoreline of Lake Wanaka, two thirds is
adjacent to pastoral land, but only a small proportion of this has direct access to the lake, as the
majority of the marginal strip is fenced. While pastoral land makes up a significant proportion of
the shoreline, it is a small proportion of the total catchment, the vast amount of which is land with
perpetual conservation mechanisms in place, and unlikely to see any form of development, except
perhaps increased recreational use.

Another point to note is that the majority of the pastoral land in the catchment is outside the area of
the orographic rainfall. The higher the rainfall, the less the pastoral use, moving towards the
mountains and the increased areas of conservation control.

The history of farming in the area dates back some 150 years, and has been through the typical
exploitation, degradation then restoration and now conservation phases seen throughout rural New
Zealand. This is typical of human nature in many areas – to exploit resources until awareness builds
that they will not last forever, and a realisation of the importance of sustainability is developed, and
practices of restoration and conservation are adopted. Farmers are very aware of the importance
of resources and the effects on them, including the lake.

While there have been changes in land use, the changes in farming practices have not constituted
intensification of land use as such, but can be classified as extensive to semi-intensive. It is
important to note that this is unlikely to change, given the physical and climatic constraints,
economic realities, and the tenure of the catchment.

Marc Schallenberg mentioned tenure review. The illustration shown was Mt Nicholas Station on
Lake Wakitipu, which has not been through tenure review. The snow fence line, which shows a
marked influence on the landscape, was put in place in the early 1900s, and the majority of the
development on that property occurred through the land development scheme, which occurred in
the late 1960s – emphasising that development in the high country has been going on for a long
time. Tenure review in itself is not an intensification of land use, but an opportunity for the public
and farmers to reassess whether the current tenure is the most suitable. Tenure by pastoral lease is
not an encumbrance on development in itself, the constraints on development are present
regardless of the form of tenure. Tenure review has seen about a 65/35 split, as properties are
assessed, but has in fact shown a decrease in the number of animals farmed per farm. There have
been changes in land use, but not necessarily intensification.

It is worth discussing fertiliser use – which in the catchment is minimal relative to industry standards.
Use of less soluble, more natural fertilisers is a common theme, and the use of nitrogen fertilisers is
relatively limited. The bulk of pastoral farming relies on set stock grazing, as opposed to rotational
grazing, meaning that nutrient run-off by overland flow is unlikely to occur. The emphasis must
therefore be placed on streams and rivers, and is likely to occur during high rainfall events,
irrespective of the mitigation measures put in place. The vast majority of nutrients which enter the
lake have nothing to do with human input, resulting from natural weathering and sedimentation of
the parent material. This is not to suggest that focus on what cannot be controlled should be any
excuse for not dealing with the aspects which can be controlled. Farmers are very aware of
impacts, and of reviewing practices to deal with them – eg not placing silage pits close to the lake,
installation of protective fencing etc. This has been undertaken alongside central and regional
government initiatives.                                                                            16
In planning for any future responses it is important to build on facts and good science, and not on
  emotional responses. It is very disappointing that funding to date has not been available for the
  proposed monitoring buoy, as information is fundamental to appropriate action, and can provide a
  clear context. While we can learn from experience elsewhere, it is essential to understand the
  specific situation of Lake Wanaka, as that is our concern.

  Summing up on farming aspects, it is important to emphasise that farmers are acutely aware of their
  role in the environment, and the level of public interest in that role, that they are malleable to
  change, and that they are quick to take up new technology. All these influences mean that there
  will be continuing change from past and present practices, which need to be informed by sound
  knowledge of impacts and effects. The local farming community will be keen to remain in touch
  with the Guardians and with future efforts to provide fuller information.

3. Graham Dickson, President, Wanaka Residents’ Association
  The issue of lake water quality has been of concern to the Residents’ Association for quite some
  time. The Association was party to the proposal for a monitoring buoy and was disappointed that it
  did not proceed.

  Wanaka is a resort town, and Lake Wanaka is the reason for its existence. It is important visually, as
  the centrepiece in the landscape, and is used for a variety of recreational purposes. The primary
  reasons for living in Wanaka are tourism, recreation, or as a retirement location, augmented by the
  requirement for a range of support services. The lake is also central to the existence of holiday
  homes and visitor accommodation. It is critical as the only logical source of drinking water for the
  town, and any problems such as toxic algal blooms would have a devastating effect.

  The concern of local people is that they have seen changes in the lake over recent years. This has
  included lagarosiphon, lake snow and the fouling of fishing lines, didymo, and infestations of algae
  clogging the town’s water supply. At public meetings, the evidence is that at least 50% of residents
  experience this problem. The fact that there is not a higher level of complaints is because people
  feel that nothing will be done.

  Changes are of concern. Residents are aware of changes in North Island lakes, severe in the case of
  shallower lakes like Rotorua, but even Lake Taupo, which is a cold deep water lake more similar to
  Lake Wanaka has had problems which have led to major efforts to change and control land use. It is
  important to avoid reaching a major problem situation. Big lakes take a long time to go bad, but
  they also take a very long time to recover.

  The Association is aware of changes in land use round the lake which may have effects which will
  take a long time to reverse. These include new subdivisions, establishment of golf courses and
  recreational resorts, intensification of farming (the installation of the first centre pivot irrigator in
  Dublin Bay was noted), and increased lake use. There are concerns about the effects on the lake
  ecosystem, and also concerns about the needs of communities further down the river, and
  protecting the quality of their water.

  The Association believes that there should be a sensible precautionary approach aimed at identifying
  problems before they become serious. They believe that the following questions need to be
  answered:
      1. Is the lake water currently satisfactory?
      2. Are there trends and issues which could cause problems in the future?
      3. Are there issues which require action now?
      4. Do we have enough information to answer the first three questions?

                                                                                                              17
The general response to these questions seems to be that current water quality appears satisfactory,
that there probably are trends and issues which can cause problems in the future, and which require
action now, but that we need sound information on which to determine these actions. It is
important to have data about what is occurring in the lake, both at the surface and at depth, as a
basis for good decisions which can be fully justified.
Discussion
Explanation of the earlier proposal for a monitoring buoy:
These have been developed in the North Island. A surface buoy has a string of sensors down to a
considerable depth, giving continuous recording on a range of variables. At the moment all that is
being done is infrequent spot monitoring, mostly at surface level. New technology developments
allow for an increasing range of variables to be measured, and now provides for continuous reading
throughout the column, rather than requiring duplication of individual sensors. There was a
comment that lakes tend to “go bad” from the bottom up – and therefore data from deep levels is
essential, rather than just surface monitoring.
The point was made that after the initial capital cost, there is a very low on-going cost of
maintenance of the buoys, and that it is therefore a very valuable source of data over time on such
areas as effects of climate change.
Importance of monitoring vegetation and other changes in the catchment area:
It is also important to gather and assess the significance of information on changes in vegetation and
other aspects of the catchment over time. Data is available, but is not collected and reviewed in a
systematic way.
Capacity for more intensive farming in the future:
(Reference to the earlier mention of a pivot irrigator). Pivot irrigation may simply provide, as in the
area cited, for more efficient irrigation of an area which is already irrigated. The earlier reference to
the unique nature of farming in the area is recognition of the climatic and physical factors which
cannot be controlled, as well as the economic limitations of being at a great distance from
commercial centres eg Ag lime can be bought in Canterbury for $20 per tonne and applied for $10
per tonne. In the Wanaka catchment the delivery cost is $90 per tonne, plus another $90 to have it
picked up and applied by air. Technology may make changes, but the relativity will remain. Using
Minaret Station as an example, in 1990 it was carrying around 2000 stock units, and is now carrying
around 30,000, but in a context of set rather than rotational grazing, and with the majority of
waterways fenced off. Water standards will be controlled by the new provisions currently under
consultation, which are the highest in the country.
In comparison with the North Island lakes, which have potential for intensified farming in the
catchment areas, the Wanaka catchment already has the majority of viable land for farming already
in production.
To understand what future effects might be, it is important to have a clearer understanding of, for
example fertiliser application. It has been assessed as minimal by industry standards, but what does
minimal mean, what changes are occurring over time, and what types of fertiliser are being used?
The trend is to use less soluble products less often, to make use of the natural rainfall and
weathering process.
18Case Study 1. Decision Framework for the Management of Lake Taupo
Dr Clive Howard-Williams, Chief Scientist, Fresh Water and Estuaries, NIWA
Lake Taupo is four times larger in area than
Lake Wanaka, though less in depth. The
residence time (time to replace the water in
the lake) is over twice that of Lake Wanaka –
giving some indication of the time expected
to see, or achieve, changes. It is
oligotrophic, and the limiting nutrient is
nitrogen, with the surrounding volcanic soils
giving rise to significant levels of
phosphorus. The total of 60 cubic kms
(compared to 30 in Lake Wanaka) is a very
large body of water to maintain in a clear
state, and over time.
In Lake Taupo there is a winter phytoplankton
bloom, with a much higher level of algae.
Because there is less activity on the lake in the winter, there is less awareness of the algal bloom
compared to Wanaka where the highest algal levels are experienced in the summer when there are
more people on the lake.
Because of its iconic status, Lake Taupo started to
become a focus of concern from the mid 1980s. It
was difficult to gather information about long term
trends. The importance of clear information over
time cannot be over-emphasised. There were some
early warning signals of deterioration in Lake Taupo,
with an increase in urban development adjacent to
the lake giving rise to some areas of algae in
swimming areas for example, but out in the middle of
the lake it was much more difficult to discern the
trends. The chart shows the variability between
winter and summer, and the importance of long term
data to highlight trends.
19In 2003 there were the first significant causes
of concern, with warnings on swimming
areas due to algal bloom. Water clarity
measurements show an alarming reduction
in measured clarity in 2003, at the time of
the algal bloom, with subsequent
improvements shown through to the level
indicated at the right of the chart, showing
the latest measurement back to about the
best the lake has been.
The other scientific early warning trend
which was noted was the greater depletion rate of oxygen. As previously noted, it is not always evident
from the surface of changing status, and measurement at depth is essential. Lake Wanaka at this stage
has a very low oxygen depletion rate, indicating a healthy state at the moment, but it is the trands
overall which add up. Because of the long residence time, it is too late for action once effects are clear
at surface level.
In 1999 there were some proposals for a
substantial increase in allocation of land in
the Taupo catchment to dairy use (red on
the map) which would have almost
doubled the increase of nitrogen going into
the lake above natural levels. In general
pine forest or undeveloped land leeches
about 2kg of nitrogen per year, sheep and
beef farming about 7kg, and dairy farming
25kg +
There are some 56 inflows into Lake Taupo
which are monitored by the regional
council. Porous volcanic land structure
means that many of the aquifers are deep and have a long holding time for the water, adding to the
difficulty in discerning trends.
The Processes Undertaken in Reviewing Lake Quality and Control
In the late 1990s the substantial threat from
intensification of land use in a sensitive catchment was
recognised. This led to the establishment of the Taupo
2020 project by the Ministry for the Environment. This
was a two year community consultation process,
consulting with the widest possible range of community
groups, businesses and iwi. It generated a substantial
amount of published material – pamphlets on lake
weed, lake clarity, algae etc. leading to increased public
awareness. It also resulted in a range of scientific and
monitoring agendas to be put in place.
20The key thing which came out of the
Taupo 2020 consultation was an agreed
set of values, which could also be relevant
to the Lake Wanaka situation. A desire
for clear water was the over-riding value,
which in turn would achieve a number of
the other values. The focus of effort was
therefore concentrated on the regulation
and controls required to maintain clear
water, and a key element of that was
recognised as a need to minimise nitrogen
levels.
To progress understanding of actions which could
achieve the desired values, the Ministry for the
Environment, the Waikato Regional Council and Dairy NZ
(then called Dairy Insight) funded the development of
lake models – catchment models, water quality models,
physical models etc. The catchment model was key in
showing what the effect would be if the planned changes
in land use were put in place, with a large increase in
dairy use in the catchment resulting in a substantial
increase in nitrogen load per year into the lake – to
double the pre-development levels.
Overall the models showed that there would be long response times – 20 to 30 years for conservative
variables, and up to 5 years for biological and oxygen processes. Projections, based on the model of the
high dairy option indicated that by 2020 the following effects could be expected:
21% increase in nitrogen
47% increase in algae
The transparency of the lake would be reduced by 2.5m
There would be a change in lake colour from blue-green to green
All effects which were counter to the values derived through the consultation process.
As a result of all the information from modelling, and early warning signs of changes occurring,
Environment Waikato put out an issues and options paper which examined four optionsThe recommendation was to adopt option 2 – to maintain the current water quality by reducing the
nutrient load by 20%. This would require the authority to promulgate regulations aimed at reducing the
level of nitrogen from the catchment by 80 tonnes from the 2000 level.
Consultation & Regulation
By 2002 public consultation on the options was
commenced, with the required regulations drafted
for discussion. The regulations went to a regional
council hearing in 2006. The decisions were
appealed and went to the Environment Court, as
variation 5 to the Waikato regional plan, and were
confirmed in 2011
Funding
At the same time the government stepped in, with
the establishment of a Lake Taupo Protection
Trust and a contribution to the fund to be
administered by that trust. (45% of the $81m over
15 years). The fund is applied to incentives to
change land use and to purchase land.
Outcomes
The present process is a combination of the
framework provided by the regulations in Regional
Plan Variation 5 plus the ability of the Lake Taupo
Protection Trust to provide incentives to achieve the
initiatives required.
Nitrogen loads for each farm were identified, using
the OVERSEER model, which has been controversial,
in that it set allowances at the current levels, and
makes no recognition of subsequent activity, such as
the introduction of wetlands or other mitigation
measures.
22Nitrogen levels were capped, but nitrogen trading is allowed to encourage changes in land use.
Farmers have taken up the challenge of meeting the reduction requirements, and there has been
substantial change in management practices.
Farmers were very wary of nitrogen capping regulation, preferring a best practice approach. They are
concerned about a precedent approach being applied to other catchments.
Load levels were grandfathered, not averaged – which meant that foresters and others did not have the
potential of their land recognised.
There was concern about the wider application of the principals of the variation
On 10 March 2013 the Minstry for the Environment released a paper – Freshwater Reform 2013 and
beyond. This contains an article “Managing Under Limits” – which deals with the good management
practices being pushed by the farming industry.
Overall what has been achieved was based initially on good sound information, as a basis for
comprehensive data modelling, which fed into changed regulations and extensive community
consultation.
Discussion
1. (Jonathon Wallis) The ORC proposed water plan incorporates elements of the Waikato plan
variation, in the area of nitrogen capping. OVERSEER is a model which was designed in
conjunction with AgResearch. Weaknesses are acknowledged, because it was not originally
designed for this purpose, but it is one of the better tools available.
One of the problems in the Upper Clutha is that moving upstream towards the less used land, the
rainfall increases. Rainfall has a huge effect on outputs as measured by OVERSEER. This is the
topic of further discussion in the review process which the ORC plan is going through.
2. The effect on land values of the Taupo regime was questioned. Dr Howard-Williams was not
aware of data on this. Jonathon Wallis advised that this was the subject of a submission by
farming interests, as land values dropped substantially – even before the new regime became
operative, particular in areas assigned a low cap level, such as forestry.
In comparison, land values in the Wanaka catchment tend to be influenced by factors other than
pastoral production eg aesthetic values.
3. (Marc Schallenberg) Although the research showed that for Lake Taupo it was clear that nitrogen
was the main nutrient involved, it is important not to simply make that assumption for Wanaka.
Independent data will be required. The geology means that the Wanaka catchment is more
balanced, and the variables for modelling in the case of Wanaka would be different.
23Case Study 2. Rotorua Lakes and the Value of Monitoring
Prof. David Hamilton, Prof. of Lakes Restoration, University of Waikato
(An introductory comment was made regarding the Chair of Lakes Restoration, occupied by Prof. Hamilton.
This chair, plus a number of post-doctoral fellowships, plus funding for PhD programmes are all funded by
the Regional Council. This funding attracts complementary funding from central government and the
university, to provide total funding of approximately $1m. per annum.)
Prof. Hamilton’s presentation focuses on how good monitoring leads to good science, which supports good
lake management. It covers the following aspects:
Monitoring lakes across the globe, and the timescales necessary to perceive trends
An explanation as to why was nothing done earlier in the Rotorua area
The importance of leverage
Supporting innovations in monitoring
Some comments regarding the future
Lake Tahoe in the US provides an example of a deep-water lake which is affected by activities from a wide
area – even by dust storms in China. Monitoring data recorded over an extended period was able to show
the degradation effects and provide a basis for introducing clean air legislation in order to protect the lake
from further deterioration.
Lake Mendota, Wisconsin, USA, is one of the most studied lakes in the world. Records over 142 years were
required to show that the annual ice cover has gone down from 120 days to 90 days.
Lake Taihu in China has very good long term data, showing that, from about 1950 it has gone from a clear
water lake with abundant fish resources to 2007 when it was showing substantial deterioration – a cause of
concern as it is the source of drinking water for around 7 million people.
All of these show the importance of long term monitoring, as short term variation from year to year can
mask trends.
Rotorua Lakes
These are culturally very significant, and this has been a
major driver in achieving action on lake restoration. At
the time when ownership of the lake beds was returned
to Te Arawa in 2004, it was pointed out how much
deterioration there had been during the time since they
had gone into Crown ownership in 1922.
They are an amazing set of lakes, made particularly
interesting because of the geothermal activity in the
area.
Lake Rotorua is around 80sq.kms – less than half the size of Wanaka, and relatively shallow with an average
depth of around 10m. It previously had treated waste water discharging into the lake, until 1991, when it
was discharged to land. Less than 10% of the original waste water load now travel through ground water
leaching to the waterways.
24Nitrogen Run-off
The Kaituna catchment scheme was designed to
restore riparian vegetation, and this along with
the change in waste water treatment was
designed to reduce degradation. However
there was still considerable nitrogen run-off
with intensification of land use. The trend in
the Ngongotaha stream was replicated in 9 of
the 10 streams running into the lake.
Knowledge and Action
It is interesting to note that as far back as 1969 a paper
by Geoff Fish identified agricultural run-off as the
major cause of increased levels of nitrogen.
A recent PhD study has been started to examine the
relationship between what was known scientifically
and the follow-up with enactment of regulations and
other responses
Land Use
The map shows land use in the catchment as in
2010, as a result of natural development rather
than through any policies or regulations, but
leading to a situation where it may be difficult to
change land use to protect the lakes.
By 2010 there were roughly 25 dairy farms in the
catchment.
Oxygen Levels at Surface and Depth
The chart shows the surface reading (blue line) which
shows the seasonal lack of oxygen, and the red line, which
shows the reading at depth. The readings were taken with
the use of a deep water buoy, which has been in
continuous use for about 5 years.
Each time the bottom line reaches zero it indicates a
chemical reaction of huge releases of nutrients - an
equivalent of almost the whole nutrient load of the
catchment being released from the sediments.
25It shows seasonal lack of oxygen fairly clearly until 2011. At that time the change was interpreted as
being indicative of a windy summer. As a result the lake was mixing a lot and not showing the usual
loss of oxygen. 2012 has been one of the hottest, and certainly the driest summers ever experienced,
but interestingly shows a similar pattern of oxygen loss.
It is for this kind of data that continuous recording is particularly important. It would be quite
impossible to get “snapshot” recordings of activity and oxygen levels at depth with a random recording
method, or even with good sampling, for example monthly.
Variation in Land Use
An interesting feature of the Rotorua lakes catchment is the
variation in land use for different lakes eg Okaro with almost
totally pastoral land use, Okataina, with almost totally native
vegetation.
Similarly, there are a variety of algal groups within the lakes,
which reflected the type of surrounding land use. Eg Okaro
has more than 75% blue-green algae.
Rotoma, which is generally the lake with the
highest quality water, is dominated by diatom
algae, while Okaro for example is dominated by
cyano bacteria – the level of which appears
generally related to the level of total phosphorus,
the tropic state, and the level of pastoral use in
the catchment.
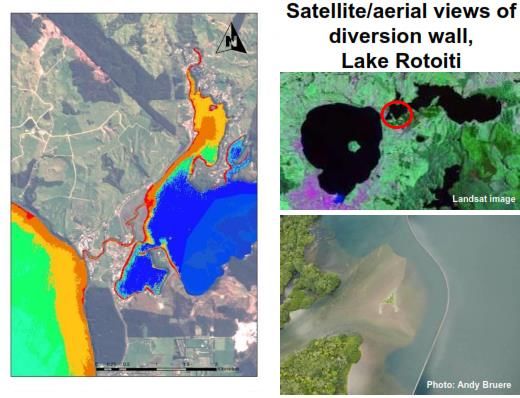
Rotoiti, which had been considered the “jewel in
the crown,” by 2003/04 had some very severe
algal blooms. It was considered was that the
water from Rotorua, going through the Ohau
Channel to Rotoiti was the cause of the problem,
and that improvement could be achieved by
diverting the water from Lake Rotorua directly
through into the Kaituna River. Substantial
modelling was undertaken as a basis for the
diversion design.
The satellite image shows the effect of the $10m.
wall.
Implementation of options depends on good science underpinning decisions. A Rotorua Lakes’
Technical Advisory Group of about 10 scientists meets about 3 monthly to review options for
implementation.
Regulations and policies flow from good information and well-founded recommendations. Eg the use
of the chemical zeolite to lock up some of the phosphorus in the lake, and the introduction of wetland
areas and detention dams adjacent to lakes to trap sediment and prevent nutrients going into the lake.
26A masters student has been working on the effects of detention bunds, intended to pool water for 2 or
3 days, so that there is potentially still productive pasture, but much of the sediment will be prevented
from reaching the lakes.
Another project has been destratification – basically aeration in order to create mixing. Two aerators
are installed in Lake Rotoehu, and effects have been intensively monitored.
Weed harvesting has been trialled to deal particularly with hornwort, and is removing large quantities,
not just of hornwort, but also of nitrogen and phosphorus.
Over $100m. is going in to sewage reticulation in the Rotorua lakeside communities.
The range of costs in the chart shows how expensive the range of remediation efforts can be.
The cost of phosphorus applied at the top of the catchment is about 20 – 30 cents per kg.
To remove the equivalent amount at the bottom of the catchment in lake remediation efforts may be
$250 per kg. The more that can be kept at the top of the catchment, and kept on the land the better,
because of the very high cost of remedial treatments lower down.
27Remedial Actions
The chart shows the beneficial effects of a
range of remedial actions in Lake Rotorua.
Based on concerns generated by earlier data,
a target level of 0.02 parts per million was
identified, and has now been achieved, and
has allowed the lake to become a
recreational playground again.
Lakes Restoration Chair, Waikato University
The establishment of the Lake Restoration Chair in 2002 has generated a great deal of leverage and co-
benefits. Internationally and nationally, it has provided a focus for the range of research which has
underpinned the ability to take action.
There is a complementary value in the existence of the technical advisory group, with scientists from
NIWA, other universities, SION, as well as consultants and council staff
Discussion
Funding sources for the range of actions such as the bunds, aerators etc. were queried. It came from
a variety of sources – primarily the regional council, but augmented by targeted central government
funding, predominantly the Ministry for the Environment, and the Ministry of Health for the lakeside
sewage reticulation (approx. $105m.)
A key issue for Lake Wanaka is the desire not to let things get to anything like the state of the Rotorua
lakes. It is a major quandary for government, in terms of supporting initiatives, that they wish to
support both the development of agricultural production, which is so important to the country, and at
the same time to protect the quality of lakes.
The efficacy of riparian planting was questioned. While there has been a great deal of riparian
planting, this highlights the difference between phosphorus and nitrogen, which leaches underground
through the porous volcanic soils. The greatest inflow is nearly 3 cub.m. per sec. It is also an issue
that, while it is practical to fence streams on flat land, such as in Canterbury, in the sloping areas
higher in the Rotorua catchment, it is not a practical reality. Maximising good farming practice and
the uptake of new technologies will be a key. The range of actions shown on the table is backed up by
a whole range of other initiatives developed in conjunction with AgResearch and others.
(Comment from Jonathon Wallis). It is fortunate in the Wanaka area that there is a high acceptance of
the importance of goo land management practice, and a recognition that water protection is not just
an encumbrance on the land which lowers the land value. It is recognised that there is an intrinsic
value in sustainable land management. It is important to recognise those things which cannot be
controlled, such as climate change.
28Farmers are noting higher, less frequent, rainfall – even though the average has remained the same.
This makes nutrient run-off harder to control. Wanaka has some areas of shallows, and areas of
pastoral land which is close to the water table, which make it different to Wakatipu. There are many
challenges, and sound science is essential in developing the response to those challenges.
Marc Schallenberg questioned whether, in relation to the Rotoiti diversion wall, there was much
debate about sending the polluted water directly into the Kaituna Stream. The Kaituna Makatu
system was substantially modified in the 1960s by engineering works, primarily for flood control, and
because of development in the lower catchment. That was the initial action which alienated iwi in the
area.
There was extensive modelling done around the effects of the diversion – showing that water spent a
maximum of two or three days in the Makatu system and the increase in nutrients was minimal, but it
was recognised as inefficient to be sending the nutrients out to the coastal zone. Sewage and
meatworks discharge contributed as much to the Kaituna system as was being diverted through from
Rotorua. At the moment, because Rotorua has improved so much, there has also been an
improvement in the Kaituna system, but there is potentially another massive clean-up required in that
water system taking into account the waste water and meat works discharges.
A numerical measure of the improvement in Rotorua compared to when it was at its worst. This can
be answered in terms of the target level of 4.2. This was exceeded about the late 1960s or early
1970s, reaching a level of around 4.9 at its peak, and coming down to a level in the last year of 4.1.
The quality of the water monitoring was good enough that it was possible to look back to a time when
quality was acceptable, not at pre-European levels, but acceptable as an aim.
The impact of tourist development was questioned eg Treble Cone with up to 1000 visitors per day and
minimal treatment plants, golf courses and subdivisions with increasing fertiliser run-off. Comparison
made with the Lake Tarawera catchment, with 323 properties, to spend around $13m. to reticulate the
waste water away from Lake Tarawera. (Roughly $31,000 per household, spread over 20 or so years.)
29You can also read