LANDSCAPE AND REGIONAL IMPACTS OF HURRICANES IN PUERTO RICO
←
→
Page content transcription
If your browser does not render page correctly, please read the page content below
Ecological Monographs, 74(2), 2004, pp. 335–352
q 2004 by the Ecological Society of America

               LANDSCAPE AND REGIONAL IMPACTS OF HURRICANES
                              IN PUERTO RICO
                            EMERY R. BOOSE,1 MAYRA I. SERRANO,2         AND   DAVID R. FOSTER
                           Harvard Forest, Harvard University, Petersham, Massachusetts 01366 USA

                 Abstract. Puerto Rico is subject to frequent and severe impacts from hurricanes, whose
             long-term ecological role must be assessed on a scale of centuries. In this study we applied
             a method for reconstructing hurricane disturbance regimes developed in an earlier study
             of hurricanes in New England. Patterns of actual wind damage from historical records were
             analyzed for 85 hurricanes since European settlement in 1508. A simple meteorological
             model (HURRECON) was used to reconstruct the impacts of 43 hurricanes since 1851.
             Long-term effects of topography on a landscape scale in the Luquillo Experimental Forest
             (LEF) were simulated with a simple topographic exposure model (EXPOS).
                 Average return intervals across Puerto Rico for F0 damage (loss of leaves and branches)
             and F1 damage (scattered blowdowns, small gaps) on the Fujita scale were 4 and 6 years,
             respectively. At higher damage levels, a gradient was created by the direction of the storm
             tracks and the weakening of hurricanes over the interior mountains. Average return intervals
             for F2 damage (extensive blowdowns) and F3 damage (forests leveled) ranged from 15 to
             33 years and 50 to 150 years, respectively, from east to west. In the LEF, the combination
             of steep topography and constrained peak wind directions created a complex mosaic of
             topographic exposure and protection, with average return intervals for F3 damage ranging
             from 50 years to .150 years. Actual forest damage was strongly dependent on land-use
             history and the effects of recent hurricanes. Annual and decadal timing of hurricanes varied
             widely. There was no clear centennial-scale trend in the number of major hurricanes over
             the historical period.
                Key words: Caribbean; Fujita scale; historical record; hurricane; landscape patterns; modeling;
             natural disturbance; Puerto Rico; regional patterns; topographic exposure; tropical forests; wind
             damage.

                        INTRODUCTION                              In recent years, our understanding of the short-term
                                                               (,10-year) impacts of a single hurricane on the wet
   Puerto Rico and neighboring islands of the Carib-
                                                               forests of Puerto Rico has advanced greatly, especially
bean are subject to frequent and severe impacts from
                                                               through intensive field studies of Hurricane Hugo
hurricanes, including wind damage to forests, scouring
                                                               (1989) as part of the Luquillo LTER program (e.g.,
and flooding of river channels, landslides triggered by
                                                               Walker et al. 1991, 1996). After Hugo, for example,
heavy rains, and salt water inundation along shorelines
                                                               the Tabonuco forests of the Luquillo Experimental For-
(Dunn and Miller 1964, Simpson and Riehl 1981, Diaz
                                                               est (LEF) were found to exhibit remarkable resilience
and Pulwarty 1997). The intensity of wind damage to
                                                               to wind damage: despite major structural reorganiza-
forest stands is often highly variable, ranging from leaf
                                                               tion, there was rapid regeneration of canopy cover
stripping and branch break to individual tree gaps to
                                                               through releafing, sprouting, or recruitment, which
extensive blowdowns. At larger spatial scales, complex
                                                               helped to reduce impacts on soil moisture, temperature,
patterns of damage often result from the interaction of
                                                               and nutrient-cycling processes (Walker 1991, Zimmer-
meteorological, topographic, and biological factors
                                                               man et al. 1994, Scatena et al. 1996). Nutrient retention
(Boose et al. 1994). Long-term impacts to forests may
                                                               was high despite initial export pulses (Steudler et al.
include sudden or delayed tree mortality, changes in
                                                               1991, Silver et al. 1996). Key ecosystem elements
regeneration method and successional direction, in-
                                                               showed a range of responses over the first five years,
creased species turnover and age class diversity, faster
                                                               including rapid or gradual increase and return to normal
biomass and nutrient turnover, and greater below-
                                                               levels (e.g., forest floor biomass and net primary pro-
ground biomass allocation and carbon storage (Lugo
                                                               ductivity, respectively); as well as rapid decline fol-
2000).
                                                               lowed by a rise to above-normal levels (e.g., above-
                                                               ground pools of K and Mg), a return to near-normal
   Manuscript received 10 July 2002; revised and accepted 13   levels (e.g., tree biomass), a slow increase to below-
May 2003; final version received 3 July 2003. Corresponding    normal levels (e.g., total fine litterfall), or little recov-
Editor: W. K. Lauenroth.
   1 E-mail: boose@fas.harvard.edu                             ery (e.g., fine-root biomass) (Zimmerman et al. 1996).
   2 Present address: 1 Park Street, Boston, Massachusetts        The results of such field studies must be considered
02108 USA.                                                     in a longer temporal context. Indeed, the frequency of
                                                            335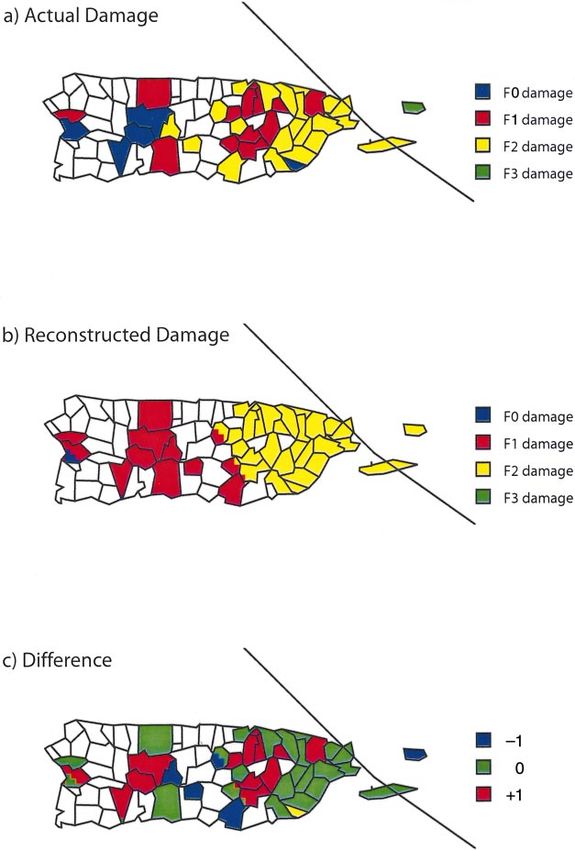
336                                          EMERY R. BOOSE ET AL.                                      Ecological Monographs
                                                                                                                Vol. 74, No. 2

  FIG. 1. Tracks of six hurricanes that caused F3 damage on the Fujita scale (see Table 1) during the period 1851–1997.
LEF is the Luquillo Experimental Forest.

hurricanes, the life span of trees, and the lags and leg-    day forests in much of Puerto Rico (Foster et al. 1999),
acies inherent in ecological systems are such that the       protected forests of the future, like those of the past,
long-term impacts of hurricanes on forests can be un-        will be largely shaped by the hurricane disturbance
derstood only on a scale of centuries. Such a temporal       regime described in this study. The HURRECON and
scale is needed to identify the natural range in distur-     EXPOS models and the historical data used in our anal-
bance intensity over space and time. The effects of a        ysis of Puerto Rican hurricanes are available on the
single hurricane lasting several hours may persist for       Harvard Forest web page.3
decades (Foster et al. 1998). Moreover, the impacts of
                                                                                      STUDY AREA
successive hurricanes are not necessarily independent,
because forest susceptibility to wind damage is strongly                              Puerto Rico
influenced by composition and structure, which in turn          Puerto Rico, the easternmost and smallest of the
are strongly influenced by previous disturbance and          Greater Antilles, is a mountainous island roughly 55
land use (Foster and Boose 1992). Although the history       3 160 km in size (Fig. 1). Mountain ranges include
of hurricanes in Puerto Rico and the Caribbean has been      the Cordillera Central extending across the island from
documented in several studies (e.g., Salivia 1950, Mil-      west to southeast (maximum elevation 1338 m), and
las 1968), and simple indices of hurricane impacts for       the Sierra de Luquillo in the northeast (maximum el-
particular sites have been proposed (e.g., Scatena and       evation 1074 m), site of the LEF. Considerable variation
Larsen 1991), estimates in the ecological literature of      in climate is caused by the interaction of topography
hurricane frequency and intensity in Puerto Rico vary        and the prevailing northeasterly trade winds. Annual
widely and a comprehensive study based on meteo-             precipitation ranges from 750 mm in the southwest to
rological principles and the historical record is lacking.   1500–2000 mm in the northeast to more than 4000 mm
   In an earlier study of New England hurricanes, we         in the higher elevations of the LEF (Birdsey and Weav-
developed a method for reconstructing hurricane re-          er 1982). Major life zones include Subtropical Dry For-
gimes using a combination of historical research and         est in the southwest, Subtropical Moist Forest else-
computer modeling (Boose et al. 2001). In the present        where at lower elevations, Subtropical Wet Forest and
study, we apply this method to quantify the impacts of       Rain Forest at higher elevations, and Lower Montane
hurricane winds in Puerto Rico over a period of 490          Wet Forest and Rain Forest near the highest summits
years since European settlement. Our results provide         (Holdridge 1946, Ewel and Whitmore 1973). Politi-
the most accurate estimate to date of long-term hur-         cally the island is divided into 78 municipalities (mun-
ricane impacts in Puerto Rico, as well as an historical      icipios) that include the neighboring islands of Culebra
context in which to place intensive studies of recent        and Vieques and range in area from 13 to 330 km2.
hurricanes. Although land use has emerged as a critical
factor shaping the structure and function of present-           3   URL: ^http://harvardforest.fas.harvard.edu&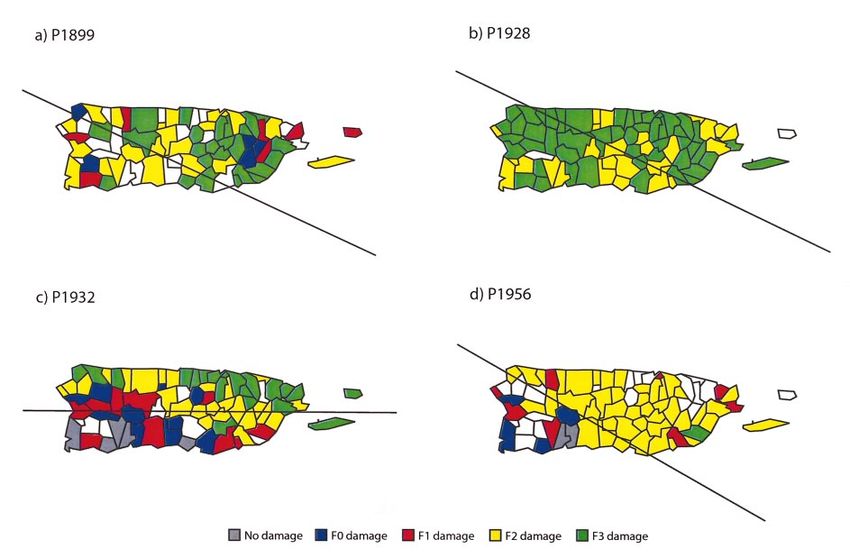
May 2004                         IMPACTS OF HURRICANES IN PUERTO RICO                                             337

              Hurricanes in Puerto Rico                    from the National Hurricane Center web page.4 Hur-
                                                           ricane tracks before 1871 were obtained from Fernan-
   Hurricane frequency in Puerto Rico is among the
                                                           dez-Partagas and Diaz (1995); these data have recently
highest in the North Atlantic basin (Neumann et al.
                                                           been incorporated into HURDAT (Landsea et al. 2002).
1987). Most storms approach from the east and south-
                                                           Studies of individual hurricanes in the Monthly Weath-
east (Fig. 1). Although hurricanes sometimes originate
                                                           er Review were consulted, and surface-wind obser-
close to the island, the most intense storms often form
                                                           vations at San Juan were obtained from the U.S. Na-
off the west coast of Africa and reach Puerto Rico at
                                                           tional Climatic Data Center for seven hurricanes since
or near maximum intensity. Impacts on both human
                                                           1899. (2) For the period 1508–1850, meteorological
and natural systems can be devastating. For example,
                                                           reconstructions were not attempted in the absence of
in the San Felipe storm of 1928, a category 5 hurricane
                                                           reliable estimates of hurricane tracks. Such estimates,
on the Saffir-Simpson scale, winds of hurricane force
                                                           which would require extensive analysis of historical
($33 m/s) lasted 12–18 hours across much of the is-
                                                           reports from surrounding islands and ships at sea, may
land, with peak winds measured at 72 m/s in San Juan
                                                           become available in the future (C. Landsea, personal
(before the anemometer blew apart); rainfall exceeded
640 mm in the higher terrain and some towns near the
                                                           communication) but were beyond the scope of this pro-
                                                           ject.
center of the storm were practically leveled (Fassig
                                                              Hurricane selection.—Historical evidence was ex-
1928); forests at higher elevations were almost com-
                                                           amined for all hurricanes that met the following cri-
pletely destroyed (Bates 1930). The catastrophic loss
                                                           teria: (1) for the period 1851–1997, tropical cyclones
of life in Puerto Rican hurricanes until recent decades,
                                                           that passed within 500 km of Puerto Rico with sus-
including more than 3000 people in the San Ciriaco
                                                           tained winds of hurricane force ($33 m/s) according
hurricane of 1899, resulted mainly from river flooding
                                                           to HURDAT; (2) for the period 1508–1850, hurricanes
and, to a lesser extent, from building collapse. The
                                                           that impacted Puerto Rico according to Saliva (1950),
mountainous topography of the island affects both the
                                                           Millas (1968), or the other secondary studies previ-
overall intensity of hurricanes that make landfall as
                                                           ously listed. In total, 143 hurricanes were investigated.
well as the extent of local protection from damaging
                                                           Of these, 85 hurricanes for which we found historical
winds.
                                                           evidence of wind damage in Puerto Rico (F0 or higher
                      METHODS                              on the Fujita scale; see next section) were selected for
                                                           detailed study.
                    Historical data
   Damage data.—Principal sources of wind damage                           Actual damage 1508–1997
data were as follows: (1) for the period 1876–1997,           Fujita scale.—Actual wind damage in each hurricane
contemporary Puerto Rican newspapers, especially           was classified using Fujita’s (1971, 1987) system for
Boletin Mercantil de Puerto Rico, Correspondencia de       assessing wind damage in tornadoes and hurricanes.
Puerto Rico, La Democracia, El Imparcial, El Mundo,        This system has been used by the U.S. National Weath-
El Nuevo Dia, Porto Rico Progress, Puerto Rico Il-         er Service for tornadoes since the early 1970s (Grazulis
ustrado, El Regionalista, The San Juan Star, and El        1993). Fujita’s damage classes extend from F0 (minor
Vocero, with Salivia (1950) providing valuable sec-        damage caused by gale or storm force winds) to F5
ondary information; (2) for the period 1508–1875, sec-     (extreme damage in the most severe tornadoes). Each
ondary studies, especially Salivia (1950) and Millas       F-scale (Fujita scale) class is defined by specified levels
(1968), as well as Asenjo (1886), Brau (1904), Van         of damage to common cultural and biological features
Middeldyk (1910), and Coll y Toste (1914–1927).            of the landscape. The system was designed for rapid
These works were supplemented wherever possible by         application in the field and does not require detailed
primary sources (letters and other documents) from the     engineering analysis.
Archivo de Indias at the University of Puerto Rico in         For this study, Fujita’s system was modified and ex-
Rio Piedras and from the General Archives of Puerto        tended slightly for better application to Puerto Rico
Rico in San Juan. Efforts were focused on obtaining a      (Table 1; cf. Boose et al. 2001). Changes were based,
good map of wind damage across Puerto Rico for each        in part, on the work of Grazulis (1993) and, in part,
hurricane.                                                 on historical evidence of comparable damage in the
   Meteorological data.—Principal sources of meteo-        hurricanes studied. The following changes were most
rological data were as follows. (1) For the period 1851–   important. (1) Trees: blowdowns were classified as F0
1997, the HURDAT (Hurricane Data) database main-           only if the trees were described as weak. Fujita re-
tained by the U.S. National Hurricane Center, which        garded the pushing over of shallow-rooted trees as F0,
provides location and maximum sustained (1-min)            but in most cases it was impossible to determine the
wind speed every six hours for Atlantic hurricanes (Jar-   condition of the tree from the historical reports. (2)
vinen et al. 1984). HURDAT data for 1871–1992 were         Roofs: partial removal of a roof was not distinguished
retrieved from the Global Tropical/Extratropical Cy-
clone Climatic Atlas (NOAA 1994), and for 1993–1997           4   URL: ^http://www.nhc.noaa.gov&
338 EMERY R. BOOSE ET AL. Ecological Monographs
Vol. 74, No. 2
TABLE 1. The Fujita scale of wind damage, modified for application to Puerto Rico.
Fujita rating
Measure F0 damage F1 damage F2 damage F3 damage
Sustained wind speed 18–25 26–35 36–47 48–62
(m/s)†
Trees leaves and fruit trees blown down extensive blowdowns most trees down
off, branches
broken, trees
damaged
Crops damaged or blown
down
Wood-zinc houses‡ minor damage unroofed or damaged blown down or de- 50% or more blown
stroyed down or destroyed§
Masonry buildings minor damage roof peeled, windows unroofed blown down or de-
broken, chimneys stroyed
down
Wood houses,\ munici- minor damage roof peeled, windows unroofed or destroyed 31 blown down or de-
pal buildings broken, chimneys stroyed
down
Cabins, outbuildings, minor damage unroofed, blown down
warehouses or destroyed
Huts¶ damaged blown down or de-
stroyed
Furniture, bedding, not moved blown out of building
clothes
Masonry walls, radio no damage blown down
towers, traffic lights
Utility poles wires down poles damaged or
blown down, high-
tension wires down
Signs, fences damaged blown down
Autos no damage moving autos pushed stationary autos moved heavy autos lifted and
off road or pushed over thrown
Trains no damage pushed along tracks boxcars pushed over trains overturned
Marinas, small airplanes minor damage destroyed
Small boats blown off moor- sunk
ing
Missiles none none light objects, metal
roofs
† Sustained wind speed values are derived from Fujita’s equations (1971), assuming a wind gust factor of 1.5 over land.
‡ Also barns, town halls, wood churches, schools, sugar mills, commercial buildings, military buildings, and unspecified
buildings.
§ F2 was assigned if buildings were described as rural or poor.
\ Wood-frame houses described as well-constructed or owned by a wealthy person.
¶ Constructed of palm leaves or similar materials.
from complete removal. Fujita required that the entire palities were assigned F3 damage if at least half of the
roof of a wood house be removed to qualify for F2 wood-zinc houses were completely blown down (unless
damage, but in most cases it was impossible to deter- described as rural or poor). Such cases were often ac-
mine exactly how much of the roof was blown off. (3) companied by other evidence of F3 damage. (5) Huts:
Wood houses: only houses described as well-construct- simple huts constructed of palm leaves or similar ma-
ed or owned by a wealthy person were regarded as terials are easily damaged by high winds. Damage to
equivalent to Fujita’s wood-frame house. F3 was as- such buildings was classified as F0 and blowdown or
signed if at least three such houses in the same mu- destruction as F1.
nicipality were completely blown down; this restriction Database and map compilation.—Reports of wind
was added to increase the likelihood that at least one damage were collected and indexed by municipality to
of the three houses was well-built and in good con- create a database for each hurricane. Each report that
dition. (4) Wood–zinc houses: Puerto Rican houses are contained sufficient information was assigned an F-
often built with a light wood frame and zinc-plated scale value based on the highest level of damage re-
metal roof (or thatch, before the late 19th century; Jo- ported. Care was taken to exclude coastal damage
pling 1988). Such buildings were found to sustain dam- caused by the storm surge, valley damage caused by
age comparable to barns in Fujita’s system. Munici- river flooding, and local damage caused by landslides.May 2004 IMPACTS OF HURRICANES IN PUERTO RICO 339
motion of storm (1.0), T is the clockwise angle between
the forward path of hurricane and a radial line from
hurricane center to point P, Vh is the forward velocity
of the hurricane, Rm is the radius of maximum winds
(20–80 km), R is the radial distance from the hurricane
center to point P, and B is the scaling parameter con-
trolling the shape of the wind profile curve (1.2–1.5).
This equation was adapted from Holland’s equation for
the cyclostrophic wind (Holland 1980: Eq. 5). The peak
wind gust velocity (Vg) at point P is estimated from
Vs as
Vg 5 GVs (2)
FIG. 2. HURRECON model. The estimated wind speed where G is the gust factor (water 5 1.2, land 5 1.5).
along a radial line outward from the storm center is a function The maximum 0.25-mile wind velocity (Vf) is estimated
of the radius of maximum winds (Rm), the wind speed at that
radius (Vrm), and the scaling parameter B, which controls the
from Vs and G using Fujita’s method (Fujita 1971: Eq.
shape of the curve. Each hurricane was modeled using four 12). Wind direction (D) at point P is estimated as
combinations of Rm and B: (a) 20 km, 1.5; (b) 40 km, 1.4;
(c) 60 km, 1.3; and (d) 80 km, 1.2. Wind velocity curves are D 5 Az 2 90 2 I (3)
shown for an arbitrary value of Vrm 5 50 m/s. where Az is the azimuth from point P to the hurricane
center, and I is the cross isobar inflow angle (i.e., the
angle between the inwardly spiraling surface wind and
Maps of actual wind damage across Puerto Rico were the circular isobars around the hurricane center: water
then created for each hurricane, assigning to each mu- 5 208, land 5 408). In the southern hemisphere, where
nicipality the maximum F-scale value from all reports the wind circulation is clockwise around the center, T
for that municipality. Reports from larger areas (e.g., is the counterclockwise angle between the forward path
the entire island) were assigned F-scale values, but of the hurricane and a radial line from the hurricane
were not used in the creation of the damage maps. Map center to point P, and D 5 Az 1 90 1 I.
resolution was 0.5 km. Parameterization and validation.—For this study,
the HURRECON model was parameterized and tested
Meteorological reconstructions 1851–1997 as follows. (1) Parameters were assigned from the lit-
HURRECON model.—A simple meteorological erature and adjusted as necessary in detailed studies of
model (HURRECON; Boose et al. 1994, 1997, 2001), seven major hurricanes since 1899 (P1899, P1916a,
based on published empirical studies of many hurri- P1928, P1931, P1932, P1956, P1989). These storms
canes, was used to reconstruct the impacts of each combined reasonably good meteorological data with
storm. HURRECON uses information on the track, extensive and well-documented wind damage. For each
size, and intensity of a hurricane, as well as the cover hurricane, model estimates were compared to actual
type (land or water), to estimate surface wind speed wind and damage observations. The goal was to find
and direction. The model also estimates wind damage parameters or a range of parameters that worked well
on the Fujita scale by using the correlation between for all seven storms. (2) The model thus parameterized
maximum 0.25-mile wind velocity (i.e., maximum was tested by comparing actual and reconstructed dam-
wind velocity sustained over a 0.25-mile [;0.40-km] age for the remaining 36 hurricanes since 1851, where
distance) and wind damage proposed by Fujita (1971; damage data were independent of the (input) meteo-
see Table 1). rological data.
Model equations follow. Wind velocity and direction Parameter values for F, G, and I were adopted di-
are measured relative to the Earth’s surface, and angles rectly from published sources (Dunn and Miller 1964,
are measured in degrees. Parameter values used in this Fujita 1971, Simpson and Riehl 1981, Powell 1982,
study are given in parentheses. The sustained wind ve- 1987); F and G were chosen so that peak gust speeds
locity (Vs) at any point P in the northern hemisphere are the same over water and land. The value S 5 1.0
is estimated as (i.e., peak wind speed on the right side minus peak
wind speed on the left side 5 Vh) was adopted from
V s 5 F [Vm 2 S (1 2 sin T )Vh /2] an earlier study of New England hurricanes (Boose et
al. 2001). The modeled wind profile (i.e., wind speed
3 [(Rm /R) B exp(1 2 [Rm /R] B )]1/2 (1)
along a radial line) for a given value of Vm is controlled
where F is the scaling parameter for effects of friction by the parameters Rm and B (Fig. 2). However, direct
(water 5 1.0, land 5 0.8), Vm is the maximum sustained measurements of the wind profile by aerial reconnais-
wind velocity over water anywhere in the hurricane, S sance are available only for hurricanes since 1944
is the scaling parameter for asymmetry due to forward (Landsea 1993) and only for hurricanes over open water340 EMERY R. BOOSE ET AL. Ecological Monographs
Vol. 74, No. 2
(H. Willoughby, personal communication). For this most have been recommended for inclusion in the up-
reason, and to test model sensitivity to these critical coming revision of HURDAT (C. Landsea, personal
parameters, each storm was separately modeled for four communication).
combinations of Rm and B chosen to span the range Maps of actual damage showed evidence of storm
from very narrow to very wide storms: (1) Rm 5 20 weakening (at least at surface levels) in nearly all cases
km, B 5 1.5; (2) 40 km, 1.4; (3) 60 km, 1.3; and (4) where hurricanes passed directly over the island. In a
80 km, 1.2. The combination of Rm and B that produced few recent cases, this weakening was confirmed by
the best agreement between actual and reconstructed direct measurements; e.g., radar showed that the eye
damage across the island was selected for the final of Hurricane Betsy (P1956) became distorted over land,
results. increasing in diameter from 10 to 45 km and tilting
Input variables for each model run included location vertically in the direction of motion (Grace 1956). Such
of the storm center and maximum sustained wind ve- weakening was simulated for the 15 hurricanes that
locity (Vm) at regular (6-h) intervals from HURDAT, passed over the island by estimating Vm at landfall
with modifications described in the next section. Model (from HURDAT values, modified as before) and then
runs for individual sites were made using a time step reducing Vm by 1.5 m/s (3 knots) for each hour that
of 5 min, and the cover type was assumed to be land. the storm center remained over land (Appendix A).
Regional estimates were made at 3-km resolution using This rate corresponds to an increase in minimum pres-
a time step equal to the minimum time required for sure of ;3 mb/h (s1 units 300 Pa/h) for a category 3
each hurricane to traverse one 3 3 3-km grid cell in a hurricane (which is consistent with empirical obser-
regional study window adjusted to include the storm’s vations; Anthes 1982); and slightly less than the av-
closest approach to Puerto Rico. erage 2.1 m/s (4 knots) per hour predicted by a recent
Model reconstructions were tested by comparing ac- empirical model for a comparable hurricane during the
tual and reconstructed F-scale wind damage across the first four hours after landfall (Kaplan and DeMaria
island (Fig. 3). Such comparisons were quantified by 1995).
creating and analyzing a difference map (reconstructed At the regional scale, maps of reconstructed F-scale
damage minus actual damage) for each storm. The dif- damage for each hurricane were compiled to generate
ference maps provided a measure of the overall ac- maps showing the number of storms at a given mini-
curacy of each reconstruction as well as the spatial mum intensity (F0, F1, F2, or F3) for each 3 3 3-km
pattern of agreement. Reconstructed and observed sur- cell. Each frequency map was divided by hand into 3–
face wind speeds were also compared for seven major 4 regions, and an average return time was calculated
hurricanes since 1899. However, a detailed study of for each region based on the average number of storms
observed wind speeds, although desirable, was beyond and the observation period. For two sites within the
the scope of this project. Accurate comparisons require regional hurricane gradient, the LEF in the northeast
careful correction of the observed wind speed for var- and the city of Mayaguez on the west coast, model
ious factors including height of the anemometer, sur- reconstructions were collated to create plots of recon-
face roughness over the approaching wind trajectory, structed F-scale damage as a function of (1) time and
and duration of measurement (Powell et al. 1994). In (2) reconstructed peak wind direction. Landscape-level
addition, wind observations were available for only one impacts in the LEF were explored with the EXPOS
station in Puerto Rico (San Juan) for all but the most model (Boose et al. 1994, 2001) and an elevation map
recent hurricanes. at 30-m resolution (digitized from the 1:24 000 U.S.
Reconstructions.—Meteorological reconstructions Forest Service map). A map of topographic exposure
were based on the HURDAT database, which, although was created for each hurricane, using the reconstructed
widely used, has known deficiencies (including both peak wind direction and an inflection angle of 68. These
systematic and random errors) and is currently under maps were compiled to produce maps showing esti-
revision by NOAA (Landsea 1993, Neumann and mated average return intervals for F3 damage across
McAdie 1997, Landsea et al. 2002). HURDAT 6-h wind the LEF.
speeds at landfall or closest approach to Puerto Rico
were increased for 11 hurricanes and decreased for two RESULTS
hurricanes in order to reconcile significant differences
Actual damage 1508–1997
between observed and reconstructed F-scale wind dam-
age. The average increase was 10.8 m/s (maximum 20.6 Damage reports.—As expected, the number of re-
m/s) and the average decrease was 12.9 m/s (maximum ports and the completeness of the resulting damage
15.4 m/s). Hourly wind speed adjustments for each maps were greater for recent or severe hurricanes. Spe-
hurricane are detailed in Appendix A. The track for cific reports for the earliest hurricanes (before 1673)
Hurricane Betsy (P1956) was also moved 25 km to the were confined to the capital city of San Juan. In general,
southwest over Puerto Rico in order to improve spatial the level of wind damage was consistent within reports
agreement between observed and reconstructed dam- and among reports for the same municipality. The max-
age. These modifications were reported to NOAA and imum reported damage for each hurricane was distrib-May 2004 IMPACTS OF HURRICANES IN PUERTO RICO 341 FIG. 3. Comparison of actual and reconstructed wind damage on the Fujita scale for Hurricane Hugo (P1989): (a) actual damage by municipality; (b) reconstructed damage for the same municipalities at 3-km resolution using the HURRECON model; (c) difference map showing reconstructed damage minus actual damage. uted as follows: 12 hurricanes (14%) with F0 damage; of damage usually lessened along the storm track for 28 hurricanes (33%) with F1 damage; 31 hurricanes hurricanes that passed over the island (Fig. 4). For (37%) with F2 damage; and 14 hurricanes (16%) with the most part, neighboring municipalities had similar F3 damage. Numbers of municipalities falling into each F-scale values. In the most severe storms, buildings Fujita damage class for each hurricane are given in and forests were sometimes leveled over broad areas, Appendix B. with significant secondary damage and personal in- Patterns of damage across the island created by in- jury resulting from airborne missiles such as metal dividual hurricanes were consistent with meteorolog- roofs. ical expectations: (1) damage was usually somewhat Temporal variation.—Our analysis of temporal var- greater to the right of the storm track, where wind iation in Puerto Rican hurricanes was based on 73 hur- velocities are normally higher; and (2) the intensity ricanes whose dates are known and whose maximum
342                                         EMERY R. BOOSE ET AL.                                  Ecological Monographs
                                                                                                           Vol. 74, No. 2

reported wind damage equaled or exceeded F1 on the          ricanes (35%) made landfall in Puerto Rico. The best-
Fujita scale (Table 2). On a seasonal scale, 84% of these   fit values for Rm and B combinations were as follows:
hurricanes, including 86% of the hurricanes that caused     20 km, 1.5 5 six hurricanes (14%); 40 km, 1.4 5 14
F3 damage, occurred during the months of August and         hurricanes (33%); 60 km, 1.3 5 16 hurricanes (37%);
September (Fig. 5). On an annual scale, there were          and 80 km, 1.2 5 seven hurricanes (16%). Best-fit val-
seven years in which two hurricanes in the same year        ues for each hurricane are included in Appendix C.
caused F1 or F2 damage (1738, 1772, 1813, 1891,                Actual and reconstructed damage.—In most cases
1894, 1995, 1996); none of these storms caused F3           there was good agreement between actual and recon-
damage. From 1851 to 1997, the average interval be-         structed F-scale damage by municipality. Reconstruct-
tween years in which hurricanes caused F11 damage           ed F-scale damage equaled actual damage in 52% of
in Puerto Rico was 4.0 years, whereas the maximum           the cases, was within one damage class in 92% of the
interval since 1867 was 13 years (1876–1889). Note          cases, and was within two damage classes in 99% of
that these values apply to the entire island and not to     the cases. There was a tendency to overestimate dam-
any given site.                                             age (30% of cases) rather than underestimate damage
   On a decadal scale, the number of hurricanes that        (18% of cases). Numbers of municipalities in each dif-
caused F11 damage in Puerto Rico since 1851 varied          ference class (reconstructed damage minus actual dam-
from a minimum of zero storms in the 1850s to a max-        age) for each hurricane are given in Appendix C.
imum of seven storms in the 1890s, with similar var-           Spatial variation.—Because historical records are
iation over the earlier historical period (Fig. 6). His-    non-existent at many sites, and incomplete at all sites,
torical reconstructions at other sites may help to con-     our analysis of spatial variation in hurricane impacts
firm these patterns (for nearby sites) or to document       was based on meteorological reconstructions of each
regional differences (for more distant sites). For ex-      storm using the HURRECON model. The frequency of
ample, in the mid-19th century, a period of major cool-     F0 events was no doubt underestimated, because F0
ing in the northern hemisphere (Mann et al. 1998), our      damage could result from storms not included in this
studies suggest a lull in hurricane activity in Puerto      study; e.g., hurricanes that passed farther out to sea or
Rico, with a matching decrease in the Yucatan (Boose        tropical storms that did not attain hurricane strength.
et al. 2003) but an increase in New England (Boose et          At a regional scale, composite maps of individual
al. 2001). As our understanding of the links between        hurricane reconstructions showed gradients of recon-
hurricane activity and other global climatic factors im-    structed frequency across Puerto Rico at the higher
proves (e.g., Gray 1990, Gray et al. 1997), hurricane       damage levels (Fig. 7). The mean return interval for
activity may be added to existing proxies for past cli-     F0 damage (loss of leaves and branches) or higher was
matic conditions.                                           ;4 years, and for F1 damage (scattered blowdowns,
   On a centennial scale, the number of F3 hurricanes       small gaps) or higher ;6 years; these values were fairly
was fairly constant over the historical period, with the    constant across the island. Mean return intervals for
greatest number (four storms) in the 19th and 20th          F2 damage (extensive blowdowns, large gaps) or high-
centuries and the smallest number (one storm) in the        er ranged from ;15 years in Culebra, Vieques and the
18th century (Fig. 6). At lower damage levels, the num-     northeastern tip of the main island, to ;33 years in
ber of F2 hurricanes increased steadily over time and       western sections. Mean return intervals for F3 damage
the number of F1 hurricanes increased steadily until        (forests leveled) ranged from ;50 years in the northeast
the 19th century. These trends are probably the result      part of the island to ;150 years in western and central
of improvements in meteorological observations and          sections.
records, and the natural tendency to retain records of         Analysis of model sensitivity to the parameters Rm
the most damaging storms. Little information is avail-      and B yielded the following range of values for the
able for the F1 storms in the 15th and 16th centuries,      maximum number of storms causing F3 damage over
and it is quite possible that one or more of these storms   some part of the island: five storms (80 km, 1.2); three
caused unreported F2 damage.                                storms (60 km, 1.3; 40 km, 1.4; and best-fit combi-
                                                            nation), and two storms (20 km, 1.5); with correspond-
      Meteorological reconstructions 1851–1997              ing mean return intervals of 29, 49, and 74 years, re-
  Meteorological characteristics.—The intensity of          spectively. Thus estimated return intervals, if all storms
the reconstructed hurricanes ranged from category 1 to      were assumed to be very wide (80 km, 1.2) or very
category 5 on the Saffir-Simpson scale at the point of      narrow (20 km, 1.5), were within ;50% of the best-
landfall or closest approach to Puerto Rico (Table 2).      fit value for Rm and B.
Twelve hurricanes (28%) were category 1 (Vm 5 33–              At the site scale, time lines of reconstructed damage
42 m/s); 12 hurricanes (28%) were category 2 (Vm 5          were created for the Luquillo Experimental Forest and
43–49 m/s); eight hurricanes (19%) were category 3          the city of Mayaguez (Fig. 8). Although the temporal
(Vm 5 50–58 m/s); seven hurricanes (16%) were cat-          patterns are similar, there are important differences de-
egory 4 (Vm 5 59–69 m/s); and four hurricanes (9%)          spite the fact that the sites are only ;140 km apart.
were category 5 (Vm 5 $70 m/s). Fifteen of these hur-       On average, hurricane damage is more frequent and
May 2004 IMPACTS OF HURRICANES IN PUERTO RICO 343
FIG. 4. Regional patterns of actual wind damage by municipality for selected major hurricanes: (a) P1899, (b) P1928,
(c) P1932, and (d) P1956.
more severe in the LEF than in Mayaguez, as one would wind directions and steep topography produced striking
expect from the regional gradients previously de- differences in the predicted impacts on the north and
scribed. For example, F3 damage was estimated to oc- south slopes of the Luquillo mountains.
cur three times in the LEF and only once in Mayaguez
over the period 1851–1997. DISCUSSION
Peak hurricane wind directions were also compared
Historical-modeling method
for the two sites (Fig. 9). The plot for the LEF showed
peak winds above F1 mostly from the northwest and Historical completeness.—The most difficult prob-
northeast quadrants, with the highest winds from the lem in using historical materials to reconstruct hurri-
northeast quadrant (i.e., storms passing to the south- cane regimes is estimating the completeness of the ear-
west). The plot for Mayaguez also showed peak winds ly records. Given the frequency of hurricanes in Puerto
above F1 mostly from the northwest and northeast Rico, it is quite possible that all records of a storm
quadrants, with the highest winds from the northwest before 1851 were lost, especially if the storm did not
quadrant (i.e., storms passing to the northeast). At both cause extensive damage. Many early storms that re-
sites, peak hurricane winds were concentrated in certain portedly did cause extensive damage were not included
directions. in this study because specific examples of damage were
At a landscape scale, the role of local topography in not given or the cause (wind, flooding, or landslide)
modifying hurricane impacts was investigated for the was not specified. However, there is reason to believe
LEF with the EXPOS model (Fig. 10). For the three that the historical record of hurricanes that caused F3
hurricanes that were estimated to cause F3 damage, damage in San Juan may be complete, because such
26% of the landscape within the LEF boundary was storms are mentioned in the earliest records. In the
predicted to be exposed to all three storms (average future, as work on HURDAT continues, it may be pos-
return interval 5 50 years), 30% was exposed to two sible to reconstruct hurricanes before 1851. There are
storms (75 years), 22% was exposed to one storm (150 also vast historical records in the Archives of the Indies
years), and 22% was protected from all three storms in Seville, Spain that remain largely untouched by his-
(.150 years). The combination of constrained peak torians but that may someday shed more light on Ca-344 EMERY R. BOOSE ET AL. Ecological Monographs
Vol. 74, No. 2
TABLE 2. Dates, maximum reported damage, and meteorological characteristics for the 85
hurricanes investigated in this study.
Hurricane No.† Date‡ Name Fmax§ SS\ Track¶
P1508 26 Aug S. Roque F0*
P1526 14 Oct S. Francisco F3
P1530 5 Aug S. Ana F3
P1568 3 Sep S. Bartolome F1*
P1615 12 Sep S. Leoncio II F3
P1626 15 Sep S. Nicomedes F3
P1641 unknown F0*
P1642 Sep F3
P1657 Aug F1*
P1673 unknown F1
P1678 unknown F1
P1718 7 Sep S. Regina F1
P1738a 30 Aug S. Rosa II F2
P1738b 12 Sep S. Leoncio III F1*
P1740a 3 Aug S. Esteban F2
P1740b 11–12 Sep S. Vicente F0*
P1742 28 Oct S. Judas Tadeo F1*
P1751 18 Aug S. Agapito, Elena F1
P1766 19 Sep S. Jenaro F3
P1767 7 Aug S. Cayetano F1*
P1772a 28 Aug S. Agustin F2*
P1772b 31 Aug S. Ramon Nonato II F2
P1775 1 Aug S. Pedro F2
P1780 13 Jun S. Antonio F1*
P1785 25 Sep S. Lupo F1*
P1805 11 Sep S. Vicente II F2*
P1806 11 Sep S. Vicente III F2
P1807 17–19 Aug S. Jacinto, Agapito F2*
P1812a 23 Jul S. Liborio F0*
P1812b 21 Aug S. Juana F0*
P1813a 23 Jul S. Liborio II F1
P1813b 21 Aug S. Juana II F1
P1814 23 Jul S. Liborio III F0
P1816 18–20 Sep S. Prisca, Jose F2
P1819 21 Sep S. Mateo III F3
P1824 8 Sep La Monserrate F2
P1825 26 Jul S. Ana II F3
P1826 1 Sep F1
P1827 17 Aug S. Jacinto II F2
P1829 unknown F1
P1835 13 Aug S. Hipolito F2
P1837 2 Aug Los Angeles F2
P1867 8 29 Oct S. Narciso F1 2 land
P1871 4 21 Aug S. Juana III F1 3 NE
P1876 2 13 Sep S. Felipe F3 3 land
P1889a 4 3–4 Sep S. Martin d. Hinojosa F1 1 NE
P1889b 6 12–13 Sep F0 1 S
P1891a 3 19–20 Aug S. Magin F1 2 land
P1891b 10 14 Oct F1 2 E
P1893 3 16–17 Aug S. Roque III F2 3 land
P1894a 3 21–22 Sep F2 3 SW
P1894b 5 13–14 Oct F2 2 NE
P1896 2 1 Sep S. Ramon Nonato III F1 2 land
P1899 2 8 Aug S. Ciriaco F3 4 land
P1901 3 7 Jul S. Cirilo F0 1 land
P1909 5 22 Aug F1 1 S
P1910 2 6–7 Sep S. Zacarias II F2 2 S
P1915 2 11 Aug S. Tiburcio F2 2 S
P1916a 5 22 Aug S. Hipolito II F2 3 land
P1916b 12 9 Oct F0 2 E
P1921 3 9–11 Sep S. Pedro Claver II F2 2 W
P1926 1 23–24 Jul S. Liborio IV F2 2 land
P1928 4 13–14 Sep S. Felipe II F3 5 land
P1931 6 10–11 Sep S. Nicolas F2 1 land
P1932 7 26–27 Sep S. Cipriano II F3 4 land
P1933 5 26 Jul S. Ana III F0 1 NE
P1943 9 14 Oct S. Calixto II F1 1 WMay 2004 IMPACTS OF HURRICANES IN PUERTO RICO 345
TABLE 2. Continued.
Hurricane No.† Date‡ Name Fmax§ SS\ Track¶
P1949 9 21–22 Sep S. Mateo IV F2 1 SW
P1950 4 2 Sep Dog F0 3 NE
P1955 2 6–7 Aug Connie F1 4 NE
P1956 3 12 Aug Betsy F3 3 land
P1960 5 5 Sep Donna F2 4 NE
P1963 6 26–27 Sep Edith F1 1 SW
P1964 5 23 Aug Cleo F0* 5 S
P1966 9 28 Sep Inez F1 4 S
P1967 2 9–10 Sep Beulah F1 4 SW
P1975 5 15–16 Sep Eloise F2 1 N
P1979 4 30–31 Aug David F2 5 SW
P1980 1 4–5 Aug Allen F2 5 SW
P1988 8 10–11 Sep Gilbert F2 2 SW
P1989 8 18 Sep Hugo F3 3 land
P1995a 12 5–6 Sep Luis F1 4 NE
P1995b 13 15–16 Sep Marilyn F2 2 NE
P1996a 2 8 Jul Bertha F2 1 NE
P1996b 8 9–10 Sep Hortense F2 1 land
† Tropical cyclone number in HURDAT.
‡ Date of landfall or closest approach to Puerto Rico (Gregorian calendar).
§ Maximum reported damage in Puerto Rico (asterisk [*] 5 based on regional report).
\ Saffir-Simpson category at landfall or closest approach to Puerto Rico.
¶ The hurricane track made landfall (land) or passed to north (N), northeast (NE), etc. of
Puerto Rico.
ribbean hurricanes during the colonial period (Marx for more populated areas where there are more ob-
1983). servers, more property subject to potential damage, and
Damage assessment.—In this study, Fujita-scale val- better records. In at least one case (P1876), the gov-
ues were assigned to entire municipalities on the basis ernment of Puerto Rico decided not to disclose the full
of historical reports of wind damage. Potential sources extent of the damage in order to avoid a negative impact
of error are as follows. (1) Damage levels may be over- on commerce (Salivia 1950). (3) Systematic errors may
estimated if the object damaged was weak or defective occur because of differences in construction practices
before the storm. This problem is most likely to occur over time, or from place to place. The susceptibility of
on a broad scale when two or more severe storms strike a particular building to wind damage is a complex func-
over a short period of time; e.g., some of the buildings tion of building design and construction quality, as well
that failed in 1932 may have been weakened by pre- as state of repair, wind direction, topographic position,
vious hurricanes in 1928 and 1931 (NWS 1932). Fail- surrounding wind breaks, and whether or not doors and
ure to exclude damage caused by landslides, river windows are open, closed, or shuttered (Liu 1993).
flooding, or storm surge may also lead to overesti- Unfortunately, this information is generally unavail-
mation of the level of wind damage. (2) Damage levels able from historical sources. Finally, (4) random errors
may be underestimated if examples of higher damage may result from inaccuracies in the historical accounts.
are not reported. F-scale values may tend to be higher The problems just described arise mainly from the
need to rely on nonsystematic written records and pho-
tographs for damage assessment. However, the basic
technique was found to work well for the purposes of
this study, largely because the Fujita damage classes
are so broad. The overall tendency for the model to
overestimate damage probably resulted from the under-
reporting of actual damage, especially from smaller
municipalities.
Meteorological modeling.—Meteorological model-
ing complements wind damage assessment by provid-
ing informed estimates for sites that lack actual ob-
servations, as well as a complete picture of the esti-
mated impacts of each hurricane on a regional scale.
Potential sources of error include the following. (1)
FIG. 5. Seasonal distribution of hurricanes with maximum
reported damage on the Fujita scale equal to F1 or higher
The HURRECON model is based on an idealized wind
(1508–1997), showing date of landfall or closest approach to profile that works best for intense hurricanes. The mod-
Puerto Rico (Gregorian calendar). el is not able to reconstruct multiple wind maxima or346 EMERY R. BOOSE ET AL. Ecological Monographs
Vol. 74, No. 2
FIG. 6. Number of hurricanes by decade (1508–1997) over the entire study area with maximum reported damage on the
Fujita scale equal to (a) F1 or higher, (b) F3, (c) F2, and (d) F1.
other mesoscale features (Willoughby 1995). (2) Dam- ricanes that make landfall or pass very close to the
age estimates are based on peak 0.25-mile wind speed island. Although the four combinations of Rm and B
following Fujita’s method (1971), which assumes that used in this study enabled a good fit between actual
the period of sustained wind required to produce spe- and reconstructed damage for Puerto Rico, there is, in
cific damage is inversely proportional to wind speed. general, no correlation between these two parameters.
This approach yields wind durations appropriate for A more accurate estimate of Rm and B would require
tree and building damage (e.g., 12 seconds for minimal data from a much larger area. (4) Regional gradients
hurricane force winds), but does not take into account of reconstructed hurricane frequency at higher damage
fatigue and stress damage that may occur on a scale of levels were a direct consequence of the simulated
minutes or hours. Nor does it account for damage weakening of hurricanes that passed over the island.
caused by a shift in wind direction (Powell et al. 1995). Although there was evidence of such weakening in
(3) Puerto Rico is too small to provide good evidence nearly every case, it is unlikely that all of these storms
for the radius of maximum winds (Rm) except for hur- weakened at the same rate. (5) Meteorological data areMay 2004 IMPACTS OF HURRICANES IN PUERTO RICO 347 FIG. 7. Regional gradients in reconstructed hurricane damage (1851–1997) using best-fit values for Rm and B, showing numbers of storms and average return intervals (range 15–150 years): (a) F21 damage; (b) F3 damage. FIG. 8. Time lines of reconstructed hurricane damage on the Fujita scale by year for (a) Luquillo Experimental Forest and (b) Mayaguez, Puerto Rico.
348 EMERY R. BOOSE ET AL. Ecological Monographs
Vol. 74, No. 2
FIG. 9. Reconstructed hurricane damage on the Fujita scale by peak wind direction (1851–1997) for (a) Luquillo Ex-
perimental Forest and (b) Mayaguez. Each point represents one hurricane.
more accurate for more recent hurricanes, especially on a scale of years, and major damage or mortality on
since the advent of aerial reconnaissance (1944) and a scale of decades.
continuous satellite coverage (mid-1960s; Landsea At a regional scale, the impact of these events is
1993). controlled by broad-scale differences in natural vege-
Despite these problems, regional maps of actual and tation and in land-use and disturbance history. For ex-
reconstructed damage were found to agree closely for ample, the scrub forests of the dry southwest may be
the hurricanes modeled. This agreement was no doubt more resilient to wind damage because of their shorter
enhanced by the small number of predicted damage stature and open-growth forms. Similarly, high-ele-
classes (no damage, F0, F1, F2, F3); a larger number vation forests in the LEF, particularly the dwarf forest
of classes would provide a more robust test of the mod- on the highest peaks and ridge tops, may be more wind-
el, but this was not practical, given the nature of the resistant because of their reduced height and routine
historical materials. exposure to higher wind speeds, although they may also
be subject to higher winds during a hurricane. Exten-
Ecological significance for Puerto Rico sive deforestation along the coastal plain and at lower
Regional impacts.—Historical evidence suggests elevations, culminating in the early 20th century
that Puerto Rico experiences frequent and intense dis- (Wadsworth 1950), greatly reduced the extent of nat-
turbance from hurricane winds. Loss of foliage and ural forest subject to wind disturbance, while at the
branches (F01) or scattered blowdowns and small gaps same time increasing exposure for remaining trees, or-
(F11) occur every 4–6 years across the island. At high- chards, and crops.
er damage levels, a regional gradient from northeast to Site and landscape impacts.—On a landscape scale,
southwest results from the consistent direction of the the impacts of hurricane winds may be greatly modified
storms tracks and the tendency for hurricanes to weak- by local topography. Hilly or mountainous terrain may
en over the interior mountains. Extensive blowdowns provide local protection from certain wind directions,
and large gaps (F21) occur about twice as often in the and such protection may be long-term if the damaging
northeast (15 years) as in western sections (33 years); winds come from the same direction in most or all
whereas forest leveling (F3) occurs about three times hurricanes. In the LEF, the highest hurricane winds tend
as often in the northeast (50 years) as in western sec- to come from the northeast (northwest to east), because
tions (150 years). Except in topographically protected of the direction of the storm tracks, the inward spiraling
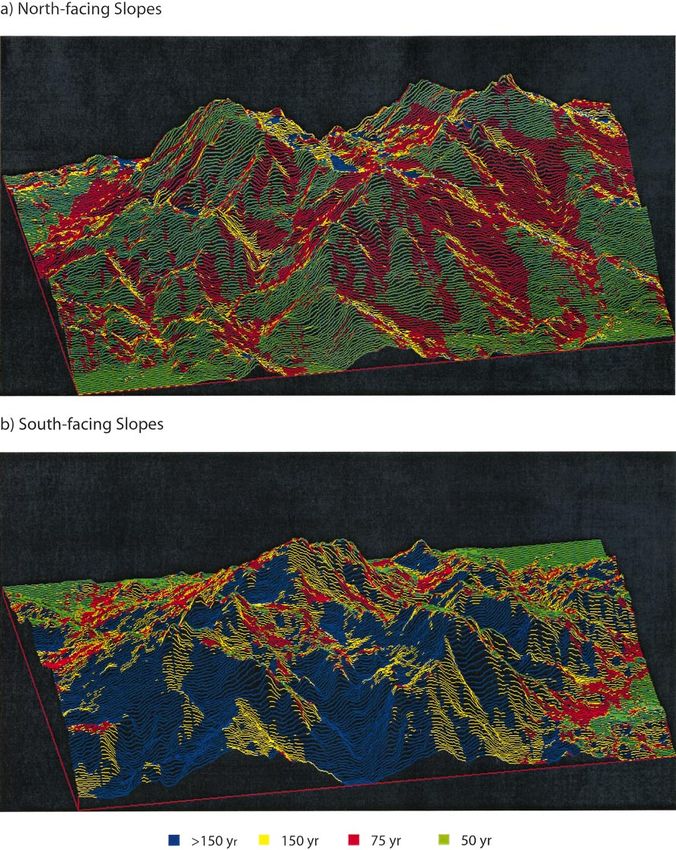
areas, most trees are subject to repeated minor damage of winds at the surface, and the tendency for hurricanesMay 2004 IMPACTS OF HURRICANES IN PUERTO RICO 349 FIG. 10. Landscape gradients in reconstructed F3 damage for the Luquillo Experimental Forest (1851–1997) using the EXPOS model, showing average return intervals (range 50 to .150 years) for (a) north-facing slopes and (b) south-facing slopes.
350                                          EMERY R. BOOSE ET AL.                                    Ecological Monographs
                                                                                                              Vol. 74, No. 2

to weaken over land. The result is a strong landscape-       ricane wind damage. Although the frequency of F01
scale gradient of predicted impacts, with extended areas     damage is comparable, the LEF experiences F11 dam-
on the southern slopes and pockets on the northern           age three times as often and F21 damage eight times
slopes protected from the most damaging winds. Actual        as often as Harvard Forest; whereas F3 damage, which
forest damage will be influenced by previous distur-         is rare and isolated in New England, occurs about every
bance and land-use history: like other disturbances,         50 years in the LEF. (2) The average forward velocity
hurricanes both create and respond to spatial hetero-        of hurricanes in New England is about three times the
geneity (Turner et al. 2003). Although all of the LEF        velocity in Puerto Rico; thus (for storms of equal size
has been affected by human land use (Foster et al.           and strength) damaging winds in Puerto Rico last about
1999), and the legacies of past land use may persist         three times as long. (3) Most hurricanes in Puerto Rico
through several episodes of natural disturbance (Foster      occur in August and September, whereas in New Eng-
et al. 2003), the ecological consequences of topograph-      land about one quarter of all hurricanes occur in Oc-
ic protection from hurricane winds might be discernible      tober and November, when leaf senescence dramati-
at higher elevations where human land use has been           cally changes the susceptibility of hardwoods to wind
less extensive.                                              damage. (4) In the LEF, the steep mountain topography
   At finer spatial scales, the effects of terrain on wind   in close proximity to the ocean creates dramatic pat-
flow may be complex and difficult to predict. For ex-        terns of topographic exposure, with extended protected
ample, in Hurricane Hugo (P1989), there was evidence         areas, whereas in central New England, most of the
of wind deflection around local peaks and channeling         gently rolling landscape is fully exposed to hurricane
along river valleys in the LEF (Boose et al. 1994), with     winds. (5) The year-round warm temperatures and high
severe damage on summit ridges perpendicular to the          precipitation of the LEF create high rates of regener-
wind (E. R. Boose, personal observation). In Hurricane       ation and decomposition, so that even catastrophic
Betsy (P1956), valleys sometimes sustained more dam-         damage disappears from casual view in a matter of
age than neighboring ridges, presumably because of           years. In New England, on the other hand, recovery
taller trees resulting from better soils (Grace 1956,        from wind damage is much slower and the effects of
Wadsworth and Englerth 1959). Unfortunately, such            past storms may be visible for decades.
patterns are virtually impossible to discern for earlier                         ACKNOWLEDGMENTS
hurricanes because of the lack of spatial information
                                                                The authors thank K. Chamberlin, L. Hoffman, M. Mon-
on forest damage in the historical record, the rapid         talvo, and R. Ramos for assistance with the historical re-
recovery of Puerto Rican forests, and the obscuration        search; B. Slater and J. Thomlinson for help with the GIS
of earlier damage by successive storms.                      data; B. Hall for assistance with figure preparation; and W.
   At the stand level, damage caused by winds of a           Lauenroth and two anonymous reviewers for invaluable com-
                                                             ments on the manuscript. The research was supported by
given speed and duration varies as a function of stand       grants from the National Science Foundation (DEB-9318552,
composition and structure, which, in turn, are strongly      DEB-9411975, and DEB-9411973) and is a contribution from
influenced by land-use and natural disturbance history.      the Harvard Forest and Luquillo Long-Term Ecological Re-
Forest damage from Hurricane Hugo (P1989), for ex-           search Programs.
ample, was no doubt enhanced by increases in forest                              LITERATURE CITED
cover and height that resulted from farm abandonment         Anthes, R. A. 1982. Tropical cyclones: their evolution, struc-
and a lull in hurricane activity in preceding decades          ture and effects. American Meteorological Society, Boston,
(Foster et al. 1999). At the species level, susceptibility     Massachusetts, USA.
to wind damage varies greatly. Key factors appear to         Asenjo, F. 1886. Efemerides de la Isla de Puerto Rico. San
be plant architecture (size, shape, strength), which           Juan, Puerto Rico.
                                                             Bates, C. G. 1930. Hurricane damage to Porto Rican forests.
makes some species (e.g., palms) more resistant to wind        Journal of Forestry 28:772–774.
damage; and rate of defoliation, which greatly reduces       Birdsey, R. A., and P. L. Weaver. 1982. The forest resources
wind drag (Francis and Gillespie 1993). At the indi-           of Puerto Rico. USDA Forest Service Resource Bulletin
vidual plant level, rooting conditions (soil depth and         SO-85.
                                                             Boose, E. R. 2003. Hurricane impacts in New England and
moisture) and growth form influence a tree’s resistance        Puerto Rico. Pages 25–42 in D. Greenland, D. Goodin, and
to wind throw (Weaver 1989).                                   R. C. Smith, editors. Climate variability and ecosystem
   Comparisons with New England.—Puerto Rico and               response at Long-Term Ecological Research sites. Oxford
New England, both located in the North Atlantic hur-           University Press, Oxford, UK.
ricane basin and occasionally subject to the same            Boose, E. R., K. E. Chamberlin, and D. R. Foster. 1997.
                                                               Reconstructing historical hurricanes in New England. Pag-
storms, provide interesting examples of tropical and           es 388–389 in Preprints of the 22nd Conference on Hur-
temperate hurricane disturbance regimes (cf. Boose et          ricanes and Tropical Meteorology. American Meteorolog-
al. 2001, Boose 2003). For example, the following dif-         ical Society, Boston, Massachusetts, USA.
ferences over the historical period between the LEF          Boose, E. R., K. E. Chamberlin, and D. R. Foster. 2001.
                                                               Landscape and regional impacts of hurricanes in New Eng-
(northeastern Puerto Rico) and the Harvard Forest (cen-        land. Ecological Monographs 71:27–48.
tral Massachusetts) are ecologically significant. (1) The    Boose, E. R., D. R. Foster, A. Barker Plotkin, and B. Hall.
LEF is subject to more frequent and more intense hur-          2003. Geographical and historical variation in hurricanes
May 2004 IMPACTS OF HURRICANES IN PUERTO RICO 351 across the Yucatan Peninsula. Pages 495–516 in A. Gómez- Holland, G. J. 1980. An analytical model of the wind and Pompa, M. F. Allen, S. Fedick, and J. J. Jiménez-Osornio, pressure profiles in hurricanes. Monthly Weather Review editors. Lowland Maya area: three millennia at the human– 108:1212–1218. wildland interface. Haworth Press, New York, New York, Jarvinen, B. R., C. J. Neumann, and M. A. S. Davis. 1984. USA. A tropical cyclone data tape for the North Atlantic Basin, Boose, E. R., D. R. Foster, and M. Fluet. 1994. Hurricane 1886–1983: contents, limitations, and uses. NOAA Tech- impacts to tropical and temperate forest landscapes. Eco- nical Memo NWS NHC 22. Coral Gables, Florida, USA. logical Monographs 64:369–400. Jopling, C. F. 1988. Puerto Rican houses in sociohistorical Brau, Salvador. 1904. Historia de Puerto Rico. D. Appleton, perspective. University of Tennessee Press, Knoxville, Ten- New York, New York, USA. nessee, USA. Coll y Toste, C. 1914–1927. Boletin Historico de Puerto Kaplan, J., and M. DeMaria. 1995. A simple empirical model Rico. 14 volumes. San Juan, Puerto Rico. for predicting the decay of tropical cyclone winds after Diaz, H. F., and R. S. Pulwarty, editors. 1997. Hurricanes: landfall. Journal of Applied Meteorology 34:2499–2512. climate and socioeconomic impacts. Springer-Verlag, New Landsea, C. 1993. A climatology of intense (or major) At- York, New York, USA. lantic hurricanes. Monthly Weather Review 121:1703– Dunn, G. E., and B. I. Miller. 1964. Atlantic hurricanes. 1713. Revised edition. Louisiana State University Press, Baton Landsea, C., C. Anderson, N. Charles, G. Clark, J. Fernandez- Rouge, Louisiana, USA. Partagas, P. Hungerford, C. Neumann, and M. Zimmer. Ewel, J. J., and J. L. Whitmore. 1973. Ecological life zones 2002. Atlantic hurricane re-analysis project. NOAA/Hur- of Puerto Rico and the U.S. Virgin Islands. USDA Forest ricane Research Division web page. [Online: ^http:// Service Research Paper ITF-18. www.aoml.noaa.gov/hrd/hurdat&.] Fassig, O. L. 1928. San Felipe—the hurricane of September Liu, H. 1993. Calculation of wind speeds required to damage 13, 1928, at San Juan, P.R. Monthly Weather Review 56: or destroy buildings. Pages 535–541 in C. Church, D. Bur- 350–352. gess, C. Doswell, and R. Davies-Jones, editors. The tor- Fernandez-Partagas, J., and H. F. Diaz. 1995. A reconstruc- nado: its structure, dynamics, prediction, and hazards. Geo- tion of historical tropical cyclone frequency in the Atlantic physical Monograph 79. American Geophysical Union, from documentary and other historical sources 1851 to Washington, D.C., USA. 1880. Part I (1851–1870) and Final Report. Climate Di- Lugo, A. E. 2000. Effects and outcomes of Caribbean hur- agnostics Center, NOAA, Coral Gables, Florida, USA. ricanes in a climate change scenario. Science of the Total Foster, D. R., and E. R. Boose. 1992. Patterns of forest dam- Environment 262:243–251. age resulting from catastrophic wind in central New Eng- Mann, M. E., R. S. Bradley, and M. K. Hughes. 1998. Global- land, U.S.A. Journal of Ecology 80:79–98. scale temperature patterns and climate forcing over the past Foster, D. R., M. Fluet, and E. R. Boose. 1999. Human or six centuries. Nature 392:779–787. natural disturbance: landscape-scale dynamics of the trop- Marx, R. F. 1983. Shipwrecks in the Americas. Bonanza ical forests of Puerto Rico. Ecological Applications 9:555– Books, New York, New York, USA. 572. Millas, J. C. 1968. Hurricanes of the Caribbean and adjacent Foster, D. R., D. H. Knight, and J. F. Franklin. 1998. Land- regions. Academy of the Arts and Sciences of the Americas, scape patterns and legacies resulting from large, infrequent Miami, Florida, USA. forest disturbances. Ecosystems 1:497–510. Neumann, C. J., B. R. Jarvinen, and A. C. Pike. 1987. Trop- Foster, D. R., F. Swanson, J. Aber, I. Burke, N. Brokaw, D. ical cyclones of the North Atlantic ocean 1871–1986. Third Tilman, and A. Knapp. 2003. The importance of land-use revised edition. NOAA-National Climatic Data Center, legacies to ecology and conservation. BioScience 53:77– Asheville, North Carolina, USA. 88. Neumann, C. J., and C. J. McAdie. 1997. The Atlantic trop- Francis, J. K., and A. J. R. Gillespie. 1993. Relating gust ical cyclone file: a critical need for a revision. Pages 401– speed to tree damage in Hurricane Hugo, 1989. Journal of 402 in Preprints of the 22nd Conference on Hurricanes and Arboriculture 19:368–373. Tropical Meteorology, American Meteorological Society, Fujita, T. T. 1971. Proposed characterization of tornadoes and Boston, Massachusetts, USA. hurricanes by area and intensity. SMRP (Satellite and Me- NOAA (National Oceanic and Atmospheric Administration). someteorology Research Project) Research Paper 91. Uni- 1994. Global tropical/extratropical cyclone climatic atlas. versity of Chicago Press, Chicago, Illinois, USA. CD-ROM, version 1.0. NOAA/U.S. Navy, Washington, Fujita, T. T. 1987. U.S. Tornadoes: part one, 70-year statistics. D.C., USA. SMRP (Satellite and Mesometeorology Research Project) NWS (National Weather Service). 1932. Monthly meteoro- Research Paper 218. University of Chicago Press, Chicago, logical notes at San Juan, Porto Rico, for the month of Illinois, USA. September, 1932. U.S. National Climatic Data Center, Grace, R. J. 1956. Weather notes: Betsy’s roving eye. Month- Asheville, North Carolina, USA. ly Weather Review 84:311–312. Powell, M. D. 1982. The transition of the Hurricane Frederic Gray, W. M. 1990. Strong association between West African boundary-layer wind field from the open Gulf of Mexico rainfall and U.S. landfalling intense hurricanes. Science to landfall. Monthly Weather Review 110:1912–1932. 249:1251–1256. Powell, M. D. 1987. Changes in the low-level kinematic and Gray, W. M., J. D. Sheaffer, and C. W. Landsea. 1997. Climate thermodynamic structure of Hurricane Alicia (1983) at trends associated with multidecadal variability of Atlantic landfall. Monthly Weather Review 115:75–99. hurricane activity. Pages 15–53 in H. F. Diaz and R. S. Powell, M. D., S. H. Houston, and I. Ares. 1995. Real-time Pulwarty, editors. Hurricanes: climate and socioeconomic damage assessment in hurricanes. Pages 500–502 in Pre- impacts. Springer-Verlag, New York, New York, USA. prints of the 21st Conference on Hurricanes and Tropical Grazulis, T. P. 1993. Significant tornadoes 1680–1991. En- Meteorology, American Meteorological Society, Boston, vironmental Films, St. Johnsbury, Vermont, USA. Massachusetts, USA. Holdridge, L. R. 1946. A brief sketch of the Puerto Rican Powell, M. D., S. H. Houston, and T. A. Reinhold. 1994. flora. Pages 81–83 in F. Verdoorn, editor. Plants and plant Standardizing wind measurements for documentation of science in Latin America. Chronica Botanica, Waltham, surface wind fields in Hurricane Andrew. Pages 52–69 in Massachusetts, USA. R. A. Cook and M. Soltani, editors. Hurricanes of 1992:
You can also read