Mantle wedge diapirs detected by a dense seismic array in Northern Taiwan - Nature
←
→
Page content transcription
If your browser does not render page correctly, please read the page content below
www.nature.com/scientificreports
OPEN Mantle wedge diapirs detected
by a dense seismic array
in Northern Taiwan
Cheng‑Horng Lin1,2,3,4*, Min‑Hung Shih1,3 & Ya‑Chuan Lai2,3
It is conventionally believed that magma generation beneath the volcanic arc is triggered by the
infiltration of fluids or melts derived from the subducted slab. However, recently geochemical analyses
argue the arc magma may be formed by mélange diapirs that are physically mixed by sediment,
altered oceanic crust, fluids, and mantle above the subducted slab. Further numerical modeling
predicts that the mantle wedge diapirs have significant seismic velocity anomalies, even though
these have not been observed yet. Here we show that unambiguously later P-waves scattered from
some obstacles in the mantle wedge are well recorded at a dense seismic array (Formosa Array) in
northern Taiwan. It is the first detection of seismic scattering obstacles in the mantle wedge. Although
the exact shape and size of the scattered obstacles are not well constrained by the arrival-times of
the later P-waves, the first order approximation of several spheres with radius of ~ 1 km provides
a plausible interpretation. Since these obstacles were located just beneath the magma reservoirs
around depths between 60 and 95 km, we conclude they may be mantle wedge diapirs that are likely
associated with magma generation beneath active volcanoes.
The strongest and most frequent volcanic eruptions on Earth usually take place in volcanic arcs, where energetic
magma reservoirs are often observed in the overlying crust above the subducted slab. It is conventionally believed
that those magmas that gradually accumulate within the reservoirs are first generated in the mantle wedge due
to infiltration of fluids and melts derived from subducted oceanic sediments or crust, and then ascend into the
reservoirs1–3. However, such a conventional concept of magma generation beneath volcanic arcs has been chal-
lenged by some numerical models4–6 as well as geochemical observations7–10. A novel model has proposed that
arc-like magmas might be formed by mélange diapirs directly ascending from the slab-top. Those mélange diapirs,
which are hybrid rocks composed of blocks of altered oceanic crust and sediments mixed with mantle-wedge
peridotite, may rise from the slab-mantle interface. The petrological-thermomechanical model further suggests
those mélange diapirs have significant characteristics of seismic anomalies5.
However, there has been no direct seismic evidence that shows mélange diapirs in the past, even though many
seismic images within mantle wedges have been captured across the world11–16. Among these seismic images,
the most typical observations in mantle wedges are some ambiguous low-velocity zones without any significant
seismic boundary, which are likely linked to partial melting above the subducted slab. If diapirs do exist, then
the absence of seismic evidence for mélange diapirs might be attributed to the poor resolution of seismic images
obtained from seismic tomography or other seismic techniques. In other words, the mélange diapirs might be
too small to be detected due to the limitation of seismic station coverage as well as the particular geometry of
seismicity along the subduction zone.
Taiwan is located at the convergent boundary between the Philippine Sea plate and Eurasian plate (Fig. 1).
The Philippine Sea plate is moving northwestward and subducting beneath the Eurasian plate along the Ryukyu
trench17. Like many ordinary subduction systems, plenty of active volcanoes develop along the Ryukyu volcanic
arc from Kyusyu, southern Japan, to northern Taiwan18,19. Taiwan is located just at the westernmost end of the
Ryukyu volcanic arc20–22, where two active volcanoes have been identified23–28. One is the Tatun Volcano Group
(TVG) nearby the Taipei metropolitan area, and the other is Kueishantao (or Turtle Island), named for its shape,
offshore from the Ilan plain of northeastern Taiwan. Despite the absence of eruption records in human history,
both volcanoes have been recognized as active based on a variety of recent observations including Helium iso-
tope analyses25, dating of volcanic a shes26, seismic detection of magma r eservoirs27,28, and some other interesting
1
Institute of Earth Sciences, Academia Sinica, Nankang, PO Box 1‑55, Taipei, Taiwan. 2National Center for Research
on Earthquake Engineering, National Applied Research Laboratories, Taipei, Taiwan. 3Taiwan Volcano Observatory
at Tatun, Taipei, Taiwan. 4Department of Geosciences, National Taiwan University, Taipei, Taiwan. *email: lin@
earth.sinica.edu.tw
Scientific Reports | (2021) 11:1561 | https://doi.org/10.1038/s41598-021-81357-7 1
Vol.:(0123456789)
www.nature.com/scientificreports/
Figure 1. Locations of large earthquakes (diamonds), background seismicity (small dots), diapirs (blue
lightbulbs or circles) and two active volcanoes (red areas) are projected on the map (a) and two depth profiles
(b) and (c), respectively. The general tectonics in the Taiwan area is plotted in (d). This figure was created by
Generic Mapping Tools (GMT version 4.5.2; URL: gmt.soest.hawaii.edu).
seismic activities such as heartbeat-like seismicity29, VLP tremors30, infrasonic signals31, and many others32,33.
Thus, more detailed investigation of both volcanoes becomes very important in Taiwan since potential volcanic
impacts cannot be totally excluded in the future.
For improving seismic images of magma reservoirs as well as other subsurface structures in the northern
part of Taiwan, a high-density broadband seismic array (Formosa Array) has been deployed since 2018 (Fig. 2).
Despite the fact that magma reservoirs beneath both the TVG and Turtle Island have been detected by seismic
observations of both S-wave shadows and P-wave delays from the dense seismic stations focused on two volcanic
areas27,28, the exact geometry of magma reservoirs are still poorly obtained. The Formosa Array is designed to
examine the existence of magma reservoirs and to improve seismic images beneath volcanic areas, with the
installation of 146 broadband seismic stations in the northern Taiwan area. This dense seismic array with station
spacing distances of ~ 5 km evenly covers the northernmost part of Taiwan, an area of ~ 50 km × ~ 80 km. Each
seismic station is equipped with a broadband seismometer (Meridian Compact PH by Nanometrics) installed
into a shallow borehole at a depth of ~ 200 cm below the surface. Seismic data are continuously recorded with a
sampling rate of 100 Hz and then transmitted in real-time by either telephone cable or wireless radio to the Insti-
tute of Earth Sciences, Academia Sinica, and the Taiwan Volcano Observatory at Tatun (TVO) in Taipei, Taiwan.
Results
Strong later P‑waves. Four earthquakes (Fig. 2, Table 1) that have clear later P-waves recorded at the For-
mosa Array were chosen after we carefully examined all deep earthquakes (depth > 50 km) beneath the northern
Taiwan area since 2018. The later P-waves were recorded at seismic stations less than a few of seconds after the
direct P-waves. In fact, some later P-waves can also be recognized from other earthquakes but these are not
discussed below in detail because the amplitudes of later P-waves are not very clear for reading the arrivals. For
Events A, B, C, and D listed in Table 1, it is surprising to note that strong later P-waves are unambiguously identi-
fied at almost all seismic stations in the Formosa Array (Fig. 2). In addition to the direct P-waves (P1) from the
hypocenter to stations, the later P-wave (P2) arrivals are coincidently found from four earthquakes whose loca-
Scientific Reports | (2021) 11:1561 | https://doi.org/10.1038/s41598-021-81357-7 2
Vol:.(1234567890)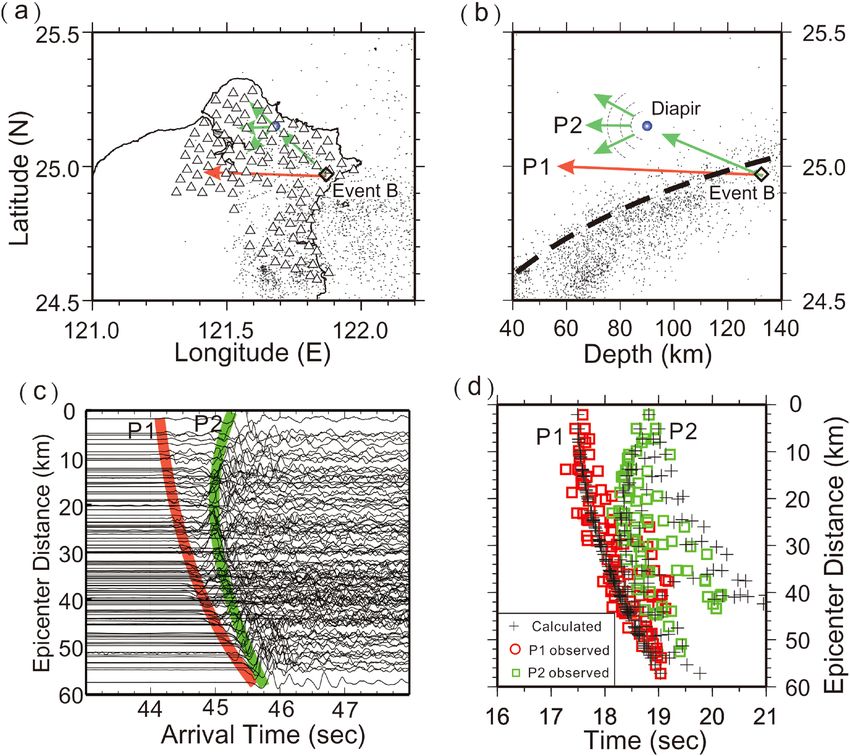
www.nature.com/scientificreports/

                                  Figure 2.  Locations of Formosa Array (the upper panel) and strong later P-waves (P2) are recorded at the
                                  vertical seismograms generated by 4 earthquakes (Events A, B, C and D shown at the lower panels) from the
                                  subduction zone beneath northern Taiwan. This figure was created by Generic Mapping Tools (GMT version
                                  4.5.2; URL: gmt.soest.hawaii.edu) and SAC software (version 101.5; URL: ds.iris.edu).

                                             Earthquakes                                              Diapirs
                                   No        Longitude     Latitude   Depth (km)   ML    Date         Longitude   Latitude   Depth (km)
                                   Event A   122.05°E      24.64°N    55           4.3   2018/07/19   121.95°E    24.88°N    61
                                   Event B   121.86°E      25.02°N    138          5.3   2019/03/12   121.68°E    25.15°N    90
                                   Event C   121.93°E      24.75°N    83           4.9   2019/03/19   121.98°E    25.00°N    88
                                   Event D   122.18°E      25.07°N    152          5.0   2019/06/29   121.63°E    25.10°N    92

                                  Table 1.  Earthquake and diapir parameters.

                                  tions are distributed at different depths along the subduction zone (Fig. 1c and Table 1). In general, it is unusual
                                  to see such a later P-wave (P2) because most ray-paths from local deep earthquakes propagate through the upper
                                  mantle, which is too homogeneous to reflect or scatter seismic waves. For instance, the P1 and P2 arrivals from
                                  Event A can be directly identified at each individual station because most seismic amplitudes of both P1 and P2
                                  are comparable (i.e., Fig. 3). In addition to the individual station, the consistent energy of P2 arrivals can be rec-
                                  ognized from seismograms at adjacent stations within distances of ~ 5 km. In other words, P2 arrivals can be well

Scientific Reports |   (2021) 11:1561 |                  https://doi.org/10.1038/s41598-021-81357-7                                                   3

                                                                                                                                                 Vol.:(0123456789)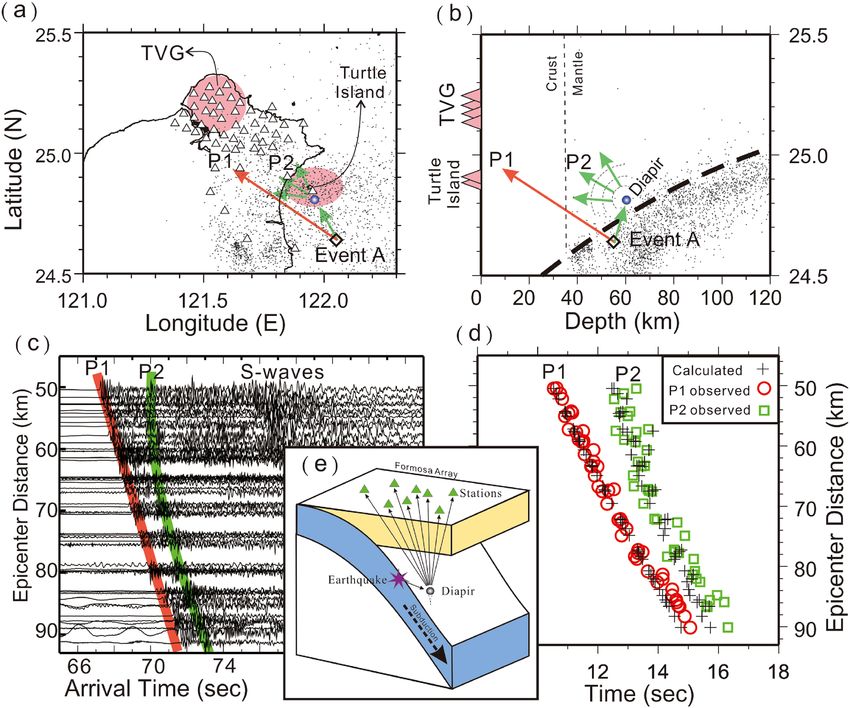
www.nature.com/scientificreports/
Figure 3. Arrivals of P1 and P2 (vertical bars) generated by Event A and recorded at the Formosa Array. The
dashed lines mark the alignment of P1 and P2 arrivals at the adjacent stations. The insert map shows locations
of seismic stations (triangles) and Event A (diamond). This figure was created by SAC software (version 101.5;
URL: ds.iris.edu).
aligned in the dense seismic array even at the metropolitan area, such as Taipei City, where background noises
are usually strong. In general, the delay times between P1 and P2 vary significantly with hypocentral depth. For
Events A and C, whose depths are shallower than 90 km, the delay times between P1 and P2 can reach up to
2—4 s. For Events B and D, whose depths are deeper than 130 km, most of the delay times between P1 and P2
are less than 1 s. Those travel-time features between P1 and P2 imply that some scattering obstacles or reflection
boundaries may exist within the mantle wedge.
In fact, for Event B, a preliminary analysis based on two-dimensional ray-tracing modeling had suggested
that P2 might be reflected from a dipping plane around the depths of 80–110 km within the mantle wedge34.
But such a simple dipping plane cannot explain the other P2 arrivals recorded at seismic stations away from the
2-D vertical profile. The fact that P2 is recorded at all seismic stations of the Formosa Array in northern Taiwan
indicates that seismic energy is likely scattering from different azimuths. Thus, instead of a simple dipping plane,
a 3-D obstacle might be more suitable for explaining seismic energy scattering in all incident directions.
To examine possible locations of the scattering obstacles beneath northern Taiwan, we apply a trial and error
method to fit the calculated travel-times of both P1 (direct waves) and P2 (scattered waves) with the observa-
tions. Assuming a simplified 1D velocity model of the uppermost mantle and overlying crust, the travel times of
both direct and scattering P-waves are calculated for any possible scattering obstacles beneath northern Taiwan.
For successfully producing seismic energy at almost any incident direction, we simply assume that the 1st order
approximation of the obstacle is a sphere with a radius of ~ 1 km based on the scaling analysis of instability
growth rates35. Thus, the seismic energy propagating to the sphere obstacle will be scattered into all directions36–38
because the radius of the spherical obstacle is much less than the wavelength (~ 8 km) of P-wave, by given its
period of ~ 1.0 s and velocity of ~ 8 km/s. The detailed algorithm and data process are described in the Method
section. The results below suggest several sphere-like obstacles in the mantle wedge around the depths between
60 and 95 km may exist just beneath two active volcanoes (Turtle Island and the TVG) in the northern Taiwan
area (Figs. 4, 5, 6, 7).
Scattering obstacles beneath the Turtle Island. For Event A, the sphere-like scattering obstacle that
fits both P1 and P2 arrivals is located just beneath Turtle Island at a depth of 61 km within the mantle wedge
and above the subducted slab (Fig. 4a,b). At first, the calculated P1 arrivals recorded at Formosa Array (Fig. 4c)
fit well with the observations (Fig. 4d) because they are simply dependent on the hypocentral distances. On the
other hand, the P2 arrivals are sensitive to both the scattering obstacle and the hypocenter. Most P2 arrivals
basically follow a hyperbolic curve on the travel-time table (Fig. 4d) because the epicenter is located outside the
Scientific Reports | (2021) 11:1561 | https://doi.org/10.1038/s41598-021-81357-7 4
Vol:.(1234567890)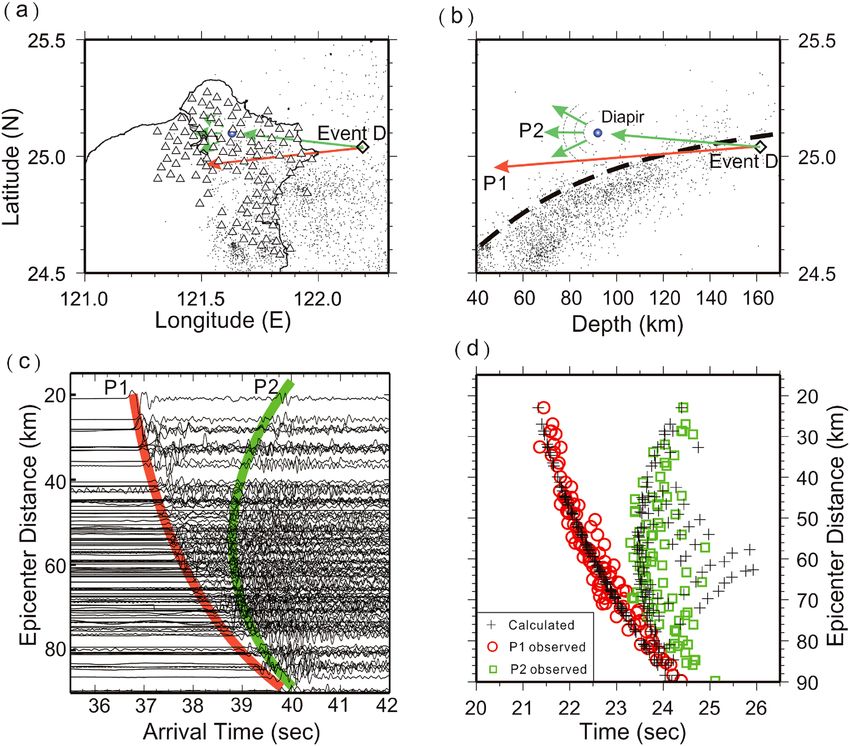
www.nature.com/scientificreports/

                                  Figure 4.  Locations of seismic stations (triangles), Event A (diamond) and diapir (blue circle) on the map (a)
                                  and depth profile (b). Locations of two active volcanoes, the Tatun volcano group (TVG) and Turtle Island
                                  are marked in pink. (c) The arrivals of P1 and P2 are, respectively, marked in red and green on the vertical
                                  seismograms plotted with epicentral distances. (d) The comparison between the observed arrivals of P1 (red
                                  circles) and P2 (green squares), and their calculated arrivals (pluses). (e) A schematic plot showing the ray-paths
                                  scattered from the diapir in the mantle wedge. This figure was partially created by Generic Mapping Tools (GMT
                                  version 4.5.2; URL: gmt.soest.hawaii.edu) and SAC software (version 101.5; URL: ds.iris.edu).

                                  seismic array. Although there are some small differences (less than 1 s) between the calculations and observa-
                                  tions, the general patterns between them are comparable. Outliers between the calculations and observations
                                  could be attributed to not only a simplified 1D model and earthquake location for calculating travel-times, but
                                  also possible reading errors produced by unexpected noise at each seismic station. A schematic plot of ray-paths
                                  scattered from the sphere-like obstacle in the mantle wedge is shown at Fig. 4e.
                                      The scattering obstacle of Event C is also identified nearby Turtle Island, but at a depth of 88 km (Fig. 5).
                                  Although its depth is greater than that obtained from Event A, both are found just on top of the subducted slab
                                  with a distance of less than 20 km (Fig. 1). Again, most P2 arrivals basically follow a hyperbolic curve on the travel
                                  time table because the scattering obstacle and earthquake are located outside the Formosa Array (i.e., Fig. 4).
                                  The travel-time fit for both P1 and P2 is generally acceptable without considering complicated structures and
                                  possible reading errors at seismograms.

                                  Scattering obstacles beneath the TVG. The scattering obstacles of Events B and D are grouped beneath
                                  the TVG at depths of ~ 90 km (Figs. 6 and 7), which are only around 20–30 km away from the subducted slab
                                  (Fig. 1). Since both obstacles are detected inside the Formosa Array, the travel-time differences between P1 and
                                  P2 strongly change with epicentral distance and then become more complicated (Fig. 6). Most P2 arrivals also
                                  follow a hyperbolic curve on the travel time table, but it is interesting to note that some P2 arrivals on the travel-
                                  time table become more scattered at the same epicentral distances (Figs. 6 and 7). This scattering phenomenon is
                                  attributed to the fact that the obstacle is located in the middle of the Array. In other words, at the same epicentral
                                  distances, the delay time between P1 and P2 becomes significant if P2 largely scatters backward. Although some
                                  differences between the calculations and observations might reach up to ~ 1 s, the general patterns between them
                                  are still comparable if we consider possible uncertainties from both calculating 1D velocity model and reading

Scientific Reports |   (2021) 11:1561 |                https://doi.org/10.1038/s41598-021-81357-7                                                     5

                                                                                                                                                 Vol.:(0123456789)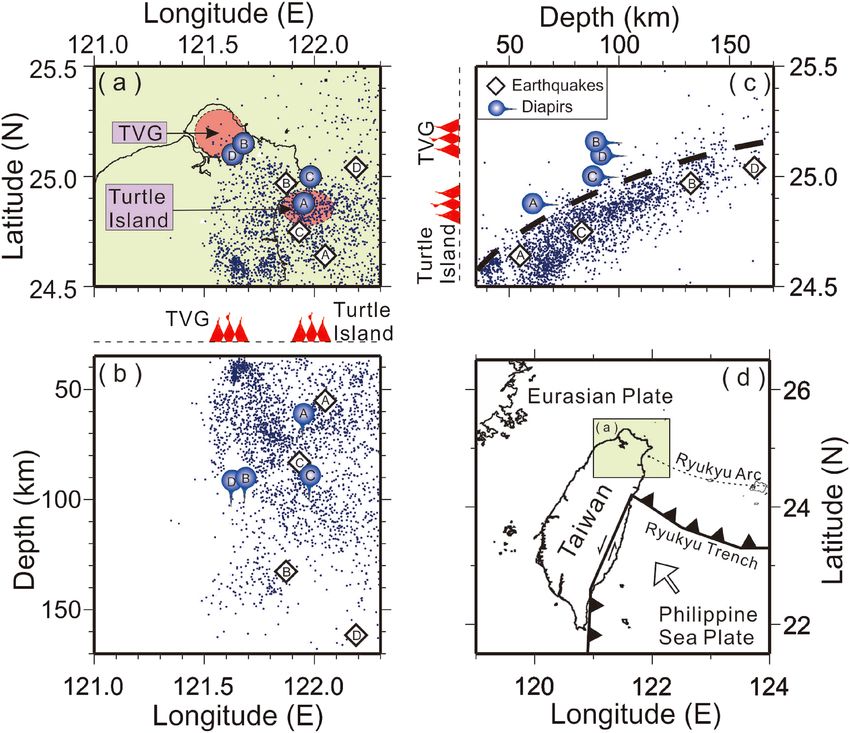
www.nature.com/scientificreports/
Figure 5. Locations of seismic stations (triangles), Event B (diamond) and diapir (blue circle) on the map (a)
and depth profile (b). (c) The arrivals of P1 and P2 are, respectively, marked in red and green on the vertical
seismograms plotted with epicentral distances. (d) The comparison between the observed arrivals of P1 (red
circles) and P2 (green squares), and their calculated arrivals (pluses). This figure was partially created by Generic
Mapping Tools (GMT version 4.5.2; URL: gmt.soest.hawaii.edu) and SAC software (version 101.5; URL: ds.iris.
edu).
errors again. Even so, the small number of outliers (less than 1.0 s) at some stations might only result in an uncer-
tainty of several kilometers for locating the obstacle.
Sensitivity of locating scatter obstacles. Although there are some location uncertainties, the results
above are sufficient to distinguish the scatter obstacles from any known possible structures in and around the
subduction zone because the general pattern of the P1 and P2 arrivals is very sensitive to the obstacle locations.
To check the location sensitivity, for example, we calculate the travel-time differences between P1 and P2 arriv-
als for Event A as the scatter obstacle (Point 1) is shifted 10 km in the horizontal (Point 2) and vertical (Point 3)
directions, respectively (Fig. 8). The results show significant travel-time deviations at Points 2 and 3, which are
very close to the subducted slab. This means the location uncertainty of the scatter obstacle is less than a few
kilometers and that the obstacle cannot be located at the subduction boundary. For the obstacles around depths
of 90 km (Fig. 1), they are far away from the subduction slab and located within the mantle wedge where no
significant structures have been reported. Similar sensitivity tests of locating scatter obstacles for Events B, C
and D are shown in Figs. A1–A3. The results also show the locations of the obstacles are basically sensitive to the
P2 arrivals, except Event D whose focal depth is largely deeper than that of the obstacles. Thus, the horizontal
uncertainty of Event D might be slightly larger than that of other events.
Discussion
This is the first seismic detection of scattering obstacles in the shallow mantle wedge just below active volca-
noes in the Earth. Although some interesting structures have been imaged in the mantle wedge11–15, none have
yet shown any seismic obstacles beneath active volcanoes. For instance, many seismic images obtained from
Scientific Reports | (2021) 11:1561 | https://doi.org/10.1038/s41598-021-81357-7 6
Vol:.(1234567890)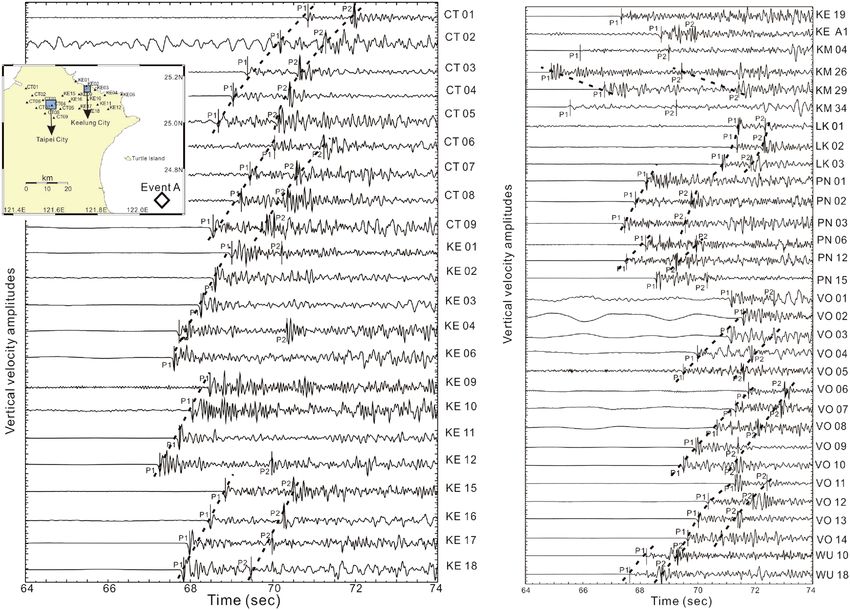
www.nature.com/scientificreports/
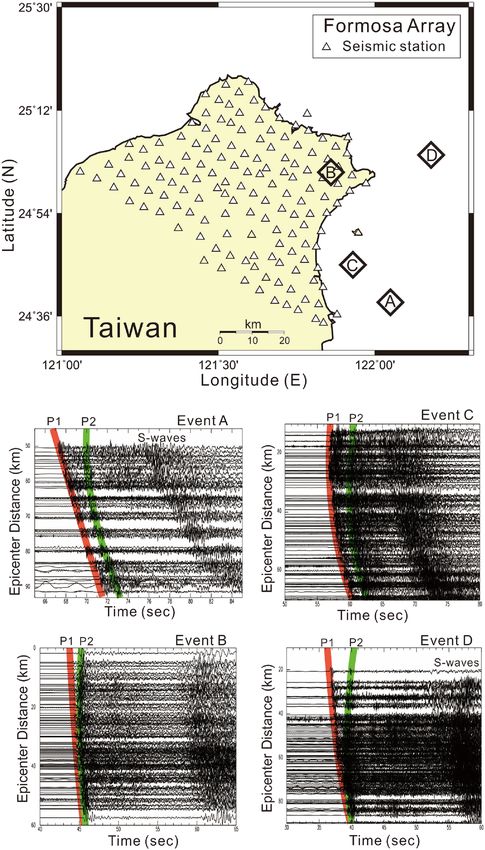
Figure 6. Locations of seismic stations (triangles), Event C (diamond) and diapir (blue circle) on the map (a)
and depth profile (b). (c) The arrivals of P1 and P2 are, respectively, marked in red and green on the vertical
seismograms plotted with epicentral distances. (d) The comparison between the observed arrivals of P1 (red
circles) and P2 (green squares), and their calculated arrivals (pluses). This figure was partially created by Generic
Mapping Tools (GMT version 4.5.2; URL: gmt.soest.hawaii.edu) and SAC software (version 101.5; URL: ds.iris.
edu).
tomographic inversion of either seismic velocity or attenuation often demonstrate some negative anomalies
beneath the volcanic a rc11–13. Those negative zones without any significant seismic boundary, likely representa-
tive of partial melting in the mantle wedge, are hardly scattering or reflecting seismic energy. The only case of
detecting seismic reflections within the mantle wedge shows some nearly horizontal boundaries associated with
a series of metasomatism within the mantle w edge15. Those boundaries are not only far away from the volcanic
arc, but also too deep to be relative to typical magma generation at depths less than 100 km39. Therefore, the new
discovery of seismic obstacles in the shallow mantle wedge beneath active volcanoes is entirely different from
any previous seismic observations.
To explain the seismic observation of these scattering obstacles in the mantle wedge, a novel seismic model
with mélange diapirs (or mantle-wedge plume) is preferentially considered here. Without any past seismic evi-
dence, mélange diapirs have in fact been repeatedly proposed according to geochemical analyses and laboratory
study7–10. In short, the concept is that mélanges first form along the interface between the subducted slab and the
overlying mantle as the slab subducts. Blobs of low-density mélange, diapirs, then rise buoyantly from the surface
of the subducting slab and are transported into the mantle wedge. Finally, the mélange diapirs partially melt to
form magmas and gradually accumulate in magma reservoirs beneath the volcanic arc. The seismic detection
of scattering obstacles here strongly support the model of mélange diapirs in the shallow mantle wedge based
on the following considerations.
At first, strong seismic energy (P2) recorded at all seismic stations in the Formosa Array shows that the seis-
mic boundary (or discontinuity) is significantly sharp. Such a sharp seismic boundary is wholly different from
any vague seismic image of low velocity zones obtained from seismic t omography11–13, but might be representative
of the chemical difference between the diapirs and surrounding mantle peridotite. Although the diapirs might
Scientific Reports | (2021) 11:1561 | https://doi.org/10.1038/s41598-021-81357-7 7
Vol.:(0123456789)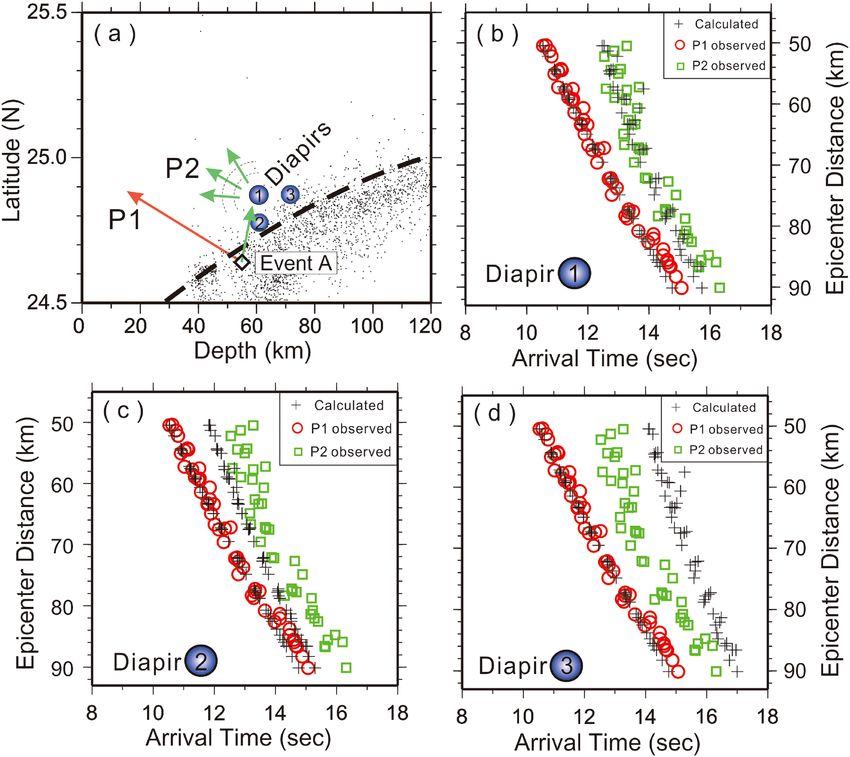
www.nature.com/scientificreports/
Figure 7. Locations of seismic stations (triangles), Event D (diamond) and diapir (blue circle) on the map (a)
and depth profile (b). (c) The arrivals of P1 and P2 are, respectively, marked in red and green on the vertical
seismograms plotted with epicentral distances. (d) The comparison between the observed arrivals of P1 (red
circles) and P2 (green squares), and their calculated arrivals (pluses). This figure was partially created by Generic
Mapping Tools (GMT version 4.5.2; URL: gmt.soest.hawaii.edu) and SAC software (version 101.5; URL: ds.iris.
edu).
be formed by a variety of compositions, the physical mixing by subducted sediments and crust, released fluids,
and mantle peridotite is one of the most acceptable candidates that have been well d iscussed7–10.
Second, some small sphere-like obstacles are suitable for showing the diapirs (or mantle plumes) whose shape
might be hypothesized as an upwelling of mélange from the top of the slab4,5. The spherical obstacles, representing
upwelling diapirs, can very efficiently scatter seismic energy in all directions. Although it is currently unclear how
large the scattering obstacles are, a radius of 1.0–1.5 km may be a reasonable estimation based on scaling analysis
of instability growth rates35. The scattering obstacles might not be too large not only because they were not been
detected by any seismic tomography in the past, but also because they might have problem to create all later
P-waves (P2) recorded at the entire Formosa Array. Considering the diapir as a sphere with 1.0–1.5 km radius,
thus, it will act as a scattering point because the radius of the diapir is significantly shorter than that (~ 8 km) of
the incidence w avelength38. In other words, the diapir hit by the direct P-waves becomes as an activated source
that radiates waves in all directions36,37. Therefore, a reasonable estimate of the obstacle radius may be less than
a few kilometers. But such a small diapir is hardly detected by seismic tomography, and then other observations
are needed before this can be later proven.
Third, the locations of the detected obstacles are basically consistent with the model of mélange diapirs just
beneath two magma reservoirs at typical depths in northern T aiwan9,10. Based on map distributions (Fig. 1a),
these scattering obstacles are separated into two groups. One is located beneath the TVG; the other is near
Turtle Island. The location of scattering obstacles beneath the TVG almost overlies that of one magma reservoir
detected by the S-wave shadow and P-wave delay27. Although the shallow group is very close to the subduction
zone, it could not be at the interface between the subducted slab and the overlying mantle wedge according to
the uncertainty estimation (Fig. 8). Similarly, the scattering obstacles near Turtle Island are just beneath another
magma reservoir28. Although the obstacles are separated into two different depths, ~ 60 km and ~ 95 km, both
Scientific Reports | (2021) 11:1561 | https://doi.org/10.1038/s41598-021-81357-7 8
Vol:.(1234567890)www.nature.com/scientificreports/
Figure 8. Sensitivity test for comparing diapirs at three locations (1, 2 and 3) separated by 10 km. (a) Locations
of diapirs (blue circles), earthquake (diamond) and background seismicity (small dots). The comparison
between the observed arrivals of P1 (red circles) and P2 (green squares), and their calculated arrivals (pluses) for
the reflectors at locations 1, 2 and 3 are shown (b–d), respectively. This figure was created by Generic Mapping
Tools (GMT version 4.5.2; URL: gmt.soest.hawaii.edu).
are located just on top of the subducted slab. Overall, the scattering obstacles are located not only above the sub-
ducted slab but also just beneath the magma reservoirs. The depths of those scattering obstacles ranging between
~ 60 and ~ 95 km are basically similar to most typical diapir depths estimated from global subduction z ones35.
Besides, the spherical obstacles are formed by the mixed rocks of both the subducted crust and the overlying
mantle around the depths greater than 50 km in the mantle wedge5. On the other hand, the flattened diapirs are
formed by unmixed mantle at the depths between 30 and 50 km. Therefore, sphere-like scattering obstacles may
be suitable for representing mélange diapirs beneath two active volcanoes in northern Taiwan.
Finally, previous isotope analyses of volcanic rocks at the TVG show that the mixing of subducted sediments
with the lithosphere mantle is required. Based on a mixing calculation of the Nd–Sr isotope composition39, 2%
subducted sediments added to the mantle are enough to explain the observations of 87Sr/86Sr (0.7038–0.7048)
and 143Nd/144Nd (0.5126–0.5128) at volcanic rocks in the TVG. This chemical feature is extremely similar to
those observed at other typical volcanic arcs, such as Marianas, Tonga, and Lesser A ntilles6, where the mantle
and sediments are mixing in the volcanic rocks. Furthermore, the Nb/La ratio of ~ 0.5 obtained from volcanic
rocks in the TVG indicates that they are derived from the lithosphere mantle altered by subduction-related
metasomatism40. Such a result can be sufficiently distinguished from an asthenospheric source, MORB (mid-
ocean ridge basalt), that has an Nb/La ratio greater than 1.041,42. The isotope data consistently demonstrate that
volcanic rocks in the TVG result from the mixing of subducted sediments or slab with the lithosphere mantle.
In summary, this study is the first to report seismic scattering obstacles in the shallow mantle wedge of the
subduction zone (Fig. 1c). For the first order approximation, those scattering obstacles might be simply consid-
ered as a sphere with a radius of ~ 1 km even though the exact shape and size are still not well constrained. These
obstacles might be delegated to the mélange diapirs that are physically mixed by the subducted sediments and
crust, released fluids, and mantle peridotite. Although the mélange diapirs are preferentially considered here,
Scientific Reports | (2021) 11:1561 | https://doi.org/10.1038/s41598-021-81357-7 9
Vol.:(0123456789)www.nature.com/scientificreports/
other possibility, such as formed by ascending melts or slab material only, might not be totally excluded. Some
further studies from the seismic data recorded by the Formosa Array might be helpful to distinguish the content
of the scattering obstacles in the near future. Finally, these obstacles might be directly associated with magma
generation in the uppermost mantle because they are identified just beneath two active volcanoes of the TVG
and Turtle Island in northern Taiwan.
Methods
We have carefully assessed the P1 and P2 arrivals from the seismograms recorded at the Formosa Array in
northern Taiwan. Because of near-vertical incidences, the P1 arrivals are clearly detected on the seismograms
generated by local mantle-depth earthquakes. Although P2 arrivals might be contaminated by some scattering
energy from P1 due to possible heterogeneity in the crust, the consistent energy of P2 arrivals can be identi-
fied when we check the seismograms at one station with those of adjacent stations within ~ 5 km. In Fig. 3, for
example, the arrivals of P2 are consistently observed along the dashed lines at Stations CT01–CT05, CT06–CT09,
and KE15–KE18, at which the background noises are strong in the Taipei metropolitan area. For the typical Sta-
tion CT02, where background noises are strong, the P1 and P2 arrivals can be detected not only at individual
stations but also aligned with adjacent stations (CT01 and CT03). In other words, a high-density seismic array
significantly improves the detection of seismic energy coming from the same source.
A conventional trial and error method is employed to find the most suitable scattering obstacle for each
earthquake. Since the general trend of P2 arrivals often follow a hyperbolic curve, it follows that the P2 arrivals
are originating from the hypocenter, but scattered by other structures. To fit the observations, we simply calcu-
late the travel-time of P1 and P2 in a layer velocity model of the upper mantle and overlying crust. The mantle
velocity is given by 8.0 km/s and the crustal velocity is assumed to be an averaged value of 6.5 km/s in Taiwan43.
The travel-time of P1 is directly calculated from an earthquake to all seismic stations. The travel-time of P2 is
the summation of two parts: one is the travel-time from the earthquake to the scattering obstacle and the other
is from the scattering obstacle to the seismic stations. For successfully scattering seismic energy at any incident
direction, we simply assume that the 1st order approximation of the scattering obstacle is a sphere with a radius
of 1 km based on the scaling analysis of instability growth r ates35.
In fact, the location of the scattering obstacle can be roughly estimated from P2 arrivals recorded at the For-
mosa Array. Since the Formosa Array has high-density seismic stations with a spacing of ~ 5 km, the possible
scattering obstacle will be close to the station at which the P2 arrival is faster than any other seismic station. The
depth of the scattering obstacle can also be estimated from the delay time (dt) between the seismic stations at
different distances from the scattering source if the scattering is inside the Formosa Array (i.e., 34). The following
equation shows the delay time (dt) at seismic stations with horizontal distances between x and 0 from the source:
√
x2 + z 2 z
dt = − , (1)
v v
in which x is the horizontal distance from the source, z is the source depth, and v is the P-wave velocity. Thus,
reading delay time (dt) at a horizontal distance (x), we can calculate the depth (z) value by given v = 7.8 km/s.
This estimated location from the P2 arrivals provides an initial position for further calculations.
Through some trial and error processes, the final location of the suitable scattering obstacle is effectively
obtained when most of the calculated and observed times are comparable (Figs. 4, 5, 6, 7). Although there are
some small outliers between the calculations and observations, the result might be acceptable without considering
both the possible reading errors produced by unexpected noises at each seismic station and calculated uncertain-
ties due to the 1D model and earthquake location. Even so, estimated uncertainty of the scattering locations is
limited to within a few kilometers due to the small number of outliers (less than 1.0 s) at some stations.
Received: 24 August 2020; Accepted: 5 January 2021
References
1. Gill, J. B. Orogenic Andesites and Plate Tectonics (Springer Verlag, Berlin, 1981).
2. Tatsumi, Y. & Eggins, S. M. Subduction Zone Magmatism (Wiley, Chichester, 1985).
3. Tatsumi, Y., Sakuyama, M., Fukuyama, F. & Kushiro, I. Generation of Arc basalt magma and thermal structure of the mantle wedge
in subduction zones. J. Geophys. Res. 88, 5815–5825 (1983).
4. Gerya, T. V. & Yuen, D. A. Rayleigh-Taylor instabilities from hydration and melting propel “cold plumes” at subduction zones.
Earth Planet. Sci. Lett. 212, 47–62 (2003).
5. Gerya, T. V., Connolly, J. A. D., Yuen, D. A., Gorczyk, W. & Capel, A. M. Seismic implications of mantle wedge plumes. Phys. Earth
Plant. Int. 156, 59–74 (2006).
6. Hasenclever, J., Morgan, J. P., Hort, M. & Rupke, L. H. 2D and 3D numerical models on compositionally buoyant diapirs in the
mantle wedge. Earth Planet. Sci. Lett. 311, 53–68 (2011).
7. Marschall, H. R. & Schumacher, J. C. Arc magmas sourced from mélange diapirs in subduction zones. Nat. Geosci. 5, 862–867
(2012).
8. Nielsen, S. G. & Marschall, H. R. Geochemical evidence for mélange melting in global arcs. Sci. Adv. 3, e1602402 (2017).
9. Codillo, E. A., Le Roux, V. & Marschall, H. R. Arc-like magmas generated by mélange-peridotite interaction in the mantle wedge.
Nat. Commun. 9, 2864 (2018).
10. Cruz-Uribe, A. M., Marschall, H. R., Gaetani, G. A. & Le Rou, V. Generation of alkaline magmas in subduction zones by partial
melting of mélange diapirs—An experimental study. Geology 46, 343–346 (2018).
Scientific Reports | (2021) 11:1561 | https://doi.org/10.1038/s41598-021-81357-7 10
Vol:.(1234567890)www.nature.com/scientificreports/
11. Zhao, D. A., Hasegawa, A. & Horiuchi, S. Tomographic imaging of P and S wave velocity structures beneath Northeastern Japan.
J. Geophys. Res. 97, 19909–19928 (1992).
12. Zhao, D., Hasegawa, A. & Kanamori, H. Deep structure of Japan subduction zone as derived from local, regional and teleseismic
events. J. Geophys. Res. 99, 22313–22329 (1994).
13. Sato, H., Muro, K. & Hasegawa, A. Three-dimensional mapping of magma source and transport regions from seismic data: The
mantle wedge beneath northeastern Japan. Pure Appl. Geophys. 153, 377–398 (1998).
14. Tamura, Y., Tatsumi, Y., Zhan, D. P., Kido, Y. & Shukuno, H. Hot fingers in the mantle wedge: New insights into magma genesis in
the subduction zone. Earth. Planet. Sci. Lett. 197, 105–116 (2002).
15. Zheng, Y., Lay, T., Flanagan, M. P. & Williams, Q. Pervasive seismic wave reflectivity and metasomatism of the Tonga mantle wedge.
Science 316, 855–858 (2007).
16. Nakajima, J. & Hasegawa, A. Tomographic evidence for the mantle upwelling beneath southeastern Japan and its implications for
arc magmatism. Earth. Planet. Sci. Lett. 254, 90–105 (2007).
17. Tsai, Y. B., Liaw, Z. S., Lee, T. Q., Lin, M. T. & Yeh, Y. H. Seismological evidence of an active plate boundary in the Taiwan area.
Mem. Geol. Soc. China 4, 143–154 (1981).
18. Kizaki, K. Tectonics of the Ryukyu island arc. J. Phys. Earth 26, 301–307 (1978).
19. Shiono, K., Mikumo, T. & Ishikawa, Y. Tectonics of the Kyushu-Ryukyu arc as evidenced from seismicity and focal mechanism of
shallow to intermediate-depth earthquakes. J. Phys. Earth 28, 17–43 (1980).
20. Juang, W. S. Diversity and origin of Quaternary basaltic magma series in northern Taiwan. Bull. Natl. Museum Nat. Sci. 4, 125–166
(1993).
21. Chung, S. L., Yang, T. F., Lee, C. Y. & Chen, C. H. The igneous provinciality in Taiwan: Consequence of continental rifting super-
imposed by Luzon and Ryukyu subduction systems. J. Southeast Asian Earth Sci. 11, 73–80 (1995).
22. Teng, L. S. Extensional collapse of the northern Taiwan mountain belt. Geology 24, 949–952 (1996).
23. Chen, Y. G., Wu, W. S., Chen, C. H. & Liu, T. K. A date for volcanic eruption inferred from a siltstone xenolith. Quat. Sci. Rev. 20,
869–873 (2001).
24. Chiu, C. L., Song, S. R., Hsieh, Y. C. & Chen, C. X. Volcanic characteristics of Kueishantao in Northeast Taiwan and their implica-
tions. Terr. Atm. Ocean. Sci. 21, 575–585 (2010).
25. Yang, T. F. & Song, S. R. 3He/4He ratios of fumaroles and bubbling gases of hot springs in Tatun Volcano Group, North Taiwan.
Nuovo Cimento Della Societa Italiana Di Fisica C22(3–4), 281–286 (1999).
26. Belousov, A., Belousova, M., Chen, C. H. & Zellmer, G. F. Deposits, character and timing of recent eruptions and gravitational
collapses in Tatun Volcanic Group, Northern Taiwan: Hazard-related issues. J. Volcanol. Geotherm. Res. 191, 205–221 (2010).
27. Lin, C. H. Evidence for a magma reservoir beneath the Taipei metropolis of Taiwan from both S-wave shadows and P-wave delays.
Sci. Rep. 6, 39500 (2016).
28. Lin, C. H., Lai, Y. C., Shih, M. H., Pu, H. C. & Lee, S. J. Seismic detection of a magma reservoir beneath Turtle Island of Taiwan by
S-wave shadows and reflections. Sci. Rep. 8, 16401 (2018).
29. Lin, C. H. Dynamic triggering of drumbeat seismicity at Tatun volcano group in Taiwan. Geophys. J. Int. 210, 354–359 (2017).
30. Lin, C. H. & Pu, H. C. Very-long-period seismic signals at the Tatun Volcano group, northern Taiwan. J. Volcanol. Geotherm. Res.
328, 230–236 (2016).
31. Lin, C. H. et al. Extremely similar volcano sounds from two separated fumaroles at the Tatun volcano group in Taiwan. Seismo.
Res. Lett. 89, 2347–2353 (2018).
32. Lin, C. H. et al. A major hydrothermal reservoir underneath the Tatun volcano group of Taiwan: Preliminary clues from a dense
linear geophone array. Pure Appl. Geophys. 177, 2889–2902 (2020).
33. Pu, H. C. et al. Active volcanism revealed from a clustering seismicity conduit beneath the long-resting Tatun volcano group in
northern Taiwan. Sci. Rep. 10, 6153 (2020).
34. Lin, C. H., Shih, M. H. & Lai, Y. C. A strong seismic reflector in the mantle wedge above the Ryukyu subduction system beneath
northern Taiwan. Seism. Res. Lett. 91, 310–316 (2019).
35. Behn, M. D., Kelemen, P. B., Hirth, G., Hacker, B. R. & Massonne, H.-J. Diapirs as the source of the sediment signature in arc lavas.
Nat. Geosci. 4, 641–646 (2011).
36. Yamakawa, N. Scattering and attenuation of elastic waves. Geophys. Mag. 31, 63–103 (1962).
37. Wu, R. & Aki, K. Scattering characteristics of elastic waves by an elastic heterogeneity. Geophysics 50, 582–595 (1985).
38. Pollitz, F. F. Scattering of spherical elastic waves from a small-voulme spherical inclusion. Geophys. J. Int. 134, 390–408 (1998).
39. Tatsumi, Y., Sakuyama, M., Fukuyama, H. & Kushiro, I. Generation of arc basalt magmas and thermal structure of the mantle
wedge in subduction zones. J. Geophys. Res. 88, 0148–0227 (1983).
40. Wang, K. L. et al. Geochemical constraints for the genesis of post-collisional magmatism and the geodynamic evolution of the
northern Taiwan region. J. Petrol. 45, 975–1011 (2004).
41. Sun, S. S., Nesbitt, R. W. & Sharaskin, A. Y. Geochemical characteristics of mid-ocean ridge basalt. Earth Planet. Sci. Lett. 44,
119–138 (1979).
42. Sun, S. S. & McDonough, W. F. Chemical and isotopic systematics of oceanic basalts: implications for mantle composition and
processes. In Magmatism in the Ocean Basins Vol. 42 (eds Saunders, A. D. & Norry, M. J.) 313–345 (Geological Society, London,
1989) (Special publications).
43. Chen, Y. L. & Shin, T. C. Study on the earthquake location of 3-D velocity structure in the Taiwan area. Meteo. Bull. 42, 135–169
(1998).
Acknowledgements
We would like to thank our colleagues at the Institute of Earth Sciences, Academia Sinica as well as National
Centre for Research on Earthquake Engineering, National Applied Research Laboratories in Taipei, Taiwan
for deploying and maintaining the Formosa Array. This work was fully funded by the Ministry of Science and
Technology, Taiwan (109-2740-M-001-001) under the 4-year Grants (2018–2021). Maps and figures were plot-
ted with SAC software (version 101.5; URL: ds.iris.edu) and Generic Mapping Tools (GMT version 4.5.2; URL:
gmt.soest.hawaii.edu). Finally, the valuable comments and suggestions by two anonymous reviewers and the
editorial board member are deeply appreciated.
Author contributions
M.H.S. and Y.C.L. collected the data and joined the discussion; C.H.L. analyzed the data and wrote the paper.
Competing interests
The authors declare no competing interests.
Scientific Reports | (2021) 11:1561 | https://doi.org/10.1038/s41598-021-81357-7 11
Vol.:(0123456789)www.nature.com/scientificreports/
Additional information
Supplementary Information The online version contains supplementary material available at https://doi.
org/10.1038/s41598-021-81357-7.
Correspondence and requests for materials should be addressed to C.-H.L.
Reprints and permissions information is available at www.nature.com/reprints.
Publisher’s note Springer Nature remains neutral with regard to jurisdictional claims in published maps and
institutional affiliations.
Open Access This article is licensed under a Creative Commons Attribution 4.0 International
License, which permits use, sharing, adaptation, distribution and reproduction in any medium or
format, as long as you give appropriate credit to the original author(s) and the source, provide a link to the
Creative Commons licence, and indicate if changes were made. The images or other third party material in this
article are included in the article’s Creative Commons licence, unless indicated otherwise in a credit line to the
material. If material is not included in the article’s Creative Commons licence and your intended use is not
permitted by statutory regulation or exceeds the permitted use, you will need to obtain permission directly from
the copyright holder. To view a copy of this licence, visit http://creativecommons.org/licenses/by/4.0/.
© The Author(s) 2021
Scientific Reports | (2021) 11:1561 | https://doi.org/10.1038/s41598-021-81357-7 12
Vol:.(1234567890)You can also read