Monitoring of Underwater Critical Infrastructures: the Nord Stream and Other Recent Case Studies
←
→
Page content transcription
If your browser does not render page correctly, please read the page content below
1

                                             Monitoring of Underwater Critical Infrastructures:
                                             the Nord Stream and Other Recent Case Studies
                                                  Giovanni Soldi, Domenico Gaglione, Simone Raponi, Nicola Forti, Enrica d’Afflisio, Paweł Kowalski,
                                                   Leonardo M. Millefiori, Dimitris Zissis, Paolo Braca, Peter Willett, Alain Maguer, Sandro Carniel,
                                                                             Giovanni Sembenini, and Catherine Warner

                                             Abstract—The explosions on September 26th, 2022, which
                                          damaged the gas pipelines of Nord Stream 1 and Nord Stream 2,
arXiv:2302.01817v1 [eess.SP] 3 Feb 2023

                                          have highlighted the need and urgency of improving the resilience
                                          of Underwater Critical Infrastructures (UCIs). Comprising gas
                                          pipelines and power and communication cables, these connect
                                          countries worldwide and are critical for the global economy and
                                          stability. An attack targeting multiple of such infrastructures
                                          simultaneously could potentially cause significant damage and
                                          greatly affect various aspects of daily life. Due to the increasing
                                          number and continuous deployment of UCIs, existing underwater
                                          surveillance solutions, such as Autonomous Underwater Vehicles
                                          (AUVs) or Remotely Operated Vehicles (ROVs), are not adequate
                                          enough to ensure thorough monitoring.
                                             We show that the combination of information from both un-
                                          derwater and above-water surveillance sensors enables achieving
                                          Seabed-to-Space Situational Awareness (S3A), mainly thanks to
                                          Artificial Intelligence (AI) and Information Fusion (IF) method-
                                          ologies. These are designed to process immense volumes of infor-
                                          mation, fused from a variety of sources and generated from mon-
                                          itoring a very large number of assets on a daily basis. The learned
                                          knowledge can be used to anticipate future behaviors, identify
                                          threats, and determine critical situations concerning UCIs.
                                             To illustrate the capabilities and importance of S3A, we con-
                                          sider three events that occurred in the second half of 2022: the
                                          aforementioned Nord Stream explosions, the cutoff of the under-                   Fig. 1. Nord Stream leak as captured by Pléiades Neo (ESA © Pléiades Neo).
                                          water communication cable SHEFA-2 connecting the Shetland                         The diameter of the leak is estimated in 0.5–0.7 km [2].
                                          Islands and the UK mainland, and the suspicious activity of a
                                          large vessel in the Adriatic Sea. Specifically, we provide analy-
                                          ses of the available data, from Automatic Identification System
                                                                                                                            an image of the methane leak acquired by the satellite con-
                                          (AIS) and satellite data, integrated with possible contextual in-
                                          formation, e.g., bathymetry, Patterns Of Life (POLs), weather                     stellation Pléiades Neo, made available by ESA.
                                          conditions, and human intelligence (HUMINT).                                         Despite suspicions of sabotage from certain authorities and
                                                                                                                            organizations, particularly given the current political climate
                                                                                                                            in Eastern Europe, there is currently no concrete evidence to
                                                                     I. I NTRODUCTION                                       indicate how and by whom the explosions were caused. At
                                             On September 26th, 2022, Danish and Swedish seismome-                          the same time, these events have also put the whole climate
                                          ters detected [1] a series of explosions on the Nord Stream 1                     community on alert, due to the much more powerful green-
                                          and Nord Stream 2 underwater gas pipelines. These explo-                          house effect (approximately 30 times) of methane compared
                                          sions, besides causing severe damage to the pipes, led to three                   to carbon dioxide, especially in the short term. It has been
                                          underwater gas leaks, with the subsequent release of an enor-                     estimated that more than 220,000 tonnes of methane, compa-
                                          mous amount of methane into the atmosphere. Figure 1 shows                        rable to the annual anthropogenic methane emissions in Aus-
                                                                                                                            tria, had probably been released in the atmosphere during the
                                             G. Soldi, D. Gaglione, S. Raponi, N. Forti, E. d’Afflisio, P. Kowalski, L.     Nord Stream leakage [2]. While the accident per se is not sig-
                                          M. Millefiori, P. Braca, A. Maguer, S. Carniel, G. Sembenini, and C. Warner
                                          are with the NATO STO Centre for Maritime Research and Experimentation
                                                                                                                            nificantly changing the figures of greenhouse gas emissions
                                          (CMRE), La Spezia, Italy (e-mail: {name.surname}@cmre.nato.int)                   leading to global warming and climate change, it neverthe-
                                             D. Zissis is with the University of the Aegean, 84100 Syros, Greece (e-mail:   less represents an unprecedented case of interlink between cli-
                                          dzissis@aegean.gr).
                                             P. Willett is with the University of Connecticut, Storrs, CT 06269, USA
                                                                                                                            mate change and security aspects, that needs to be properly
                                          (e-mail: peter.willett@uconn.edu).                                                accounted for by governments.
                                             Financial support from the Office of the NATO Chief Scientist and the             The Nord Stream incident has brought attention to the vul-
                                          NATO Allied Command Transformation (ACT) is greatly acknowledged.
                                             The views expressed in this research paper are the responsibility of the       nerability of Underwater Critical Infrastructures (UCIs) such
                                          authors and do not necessarily reflect the opinions of the NATO.                  as gas pipelines and underwater cables. This has led to in-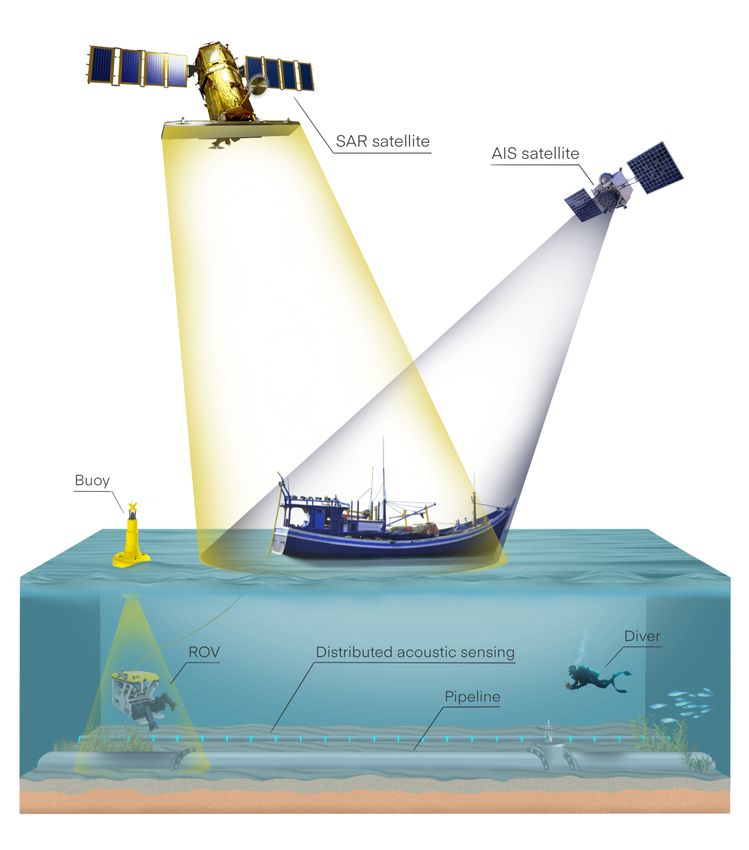
2
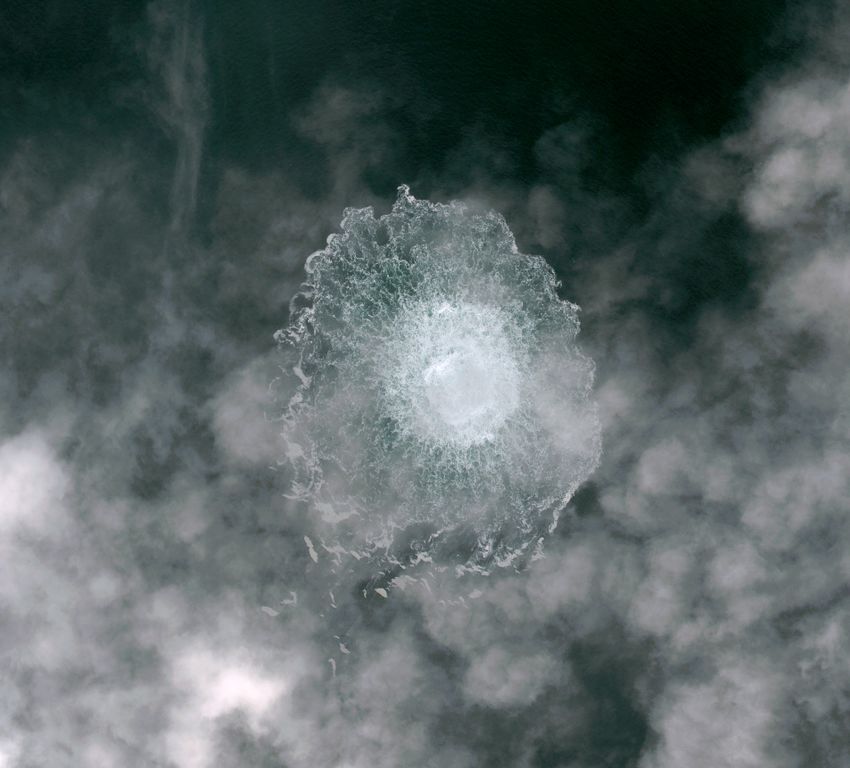
Fig. 2. Conceptual illustration of the monitoring of an UCI. Depending on the location of the UCI and weather conditions, an above-water sabotage might be
potentially conducted by a specialized diver supported by a surface vessel; a remotely operated vehicle (ROV) may also be employed in some circumstances.
Above-water systems and sensors, such as the Automatic Identification System (AIS) and Synthetic Aperture Radar (SAR), may provide large-scale monitoring
capabilities. These may be complemented by underwater assets, such as Distributed Acoustic Sensing (DAS), to ensure a comprehensive maritime surveillance.
creased focus from both the public and policymakers on im- matic Identification System (AIS), satellite sensors [4], and
proving the resilience of these vital assets, as there is grow- terrestrial radars, may have a crucial role to provide a seam-
ing concern that similar malicious operations will occur in less large-scale Maritime Surveillance (MS), even in remote
the future. Indeed, recently, on December 22nd, 2022, Italian areas of the world. In the latter case, underwater sensors (such
newspapers reported [3] the suspicious activity of a large ves- as active/passive sonars and cameras) installed on the UCIs [5],
sel in close proximity to the Trans Adriatic Pipeline (TAP) in or equipped on Unmanned Underwater Vehicles (UUVs) [6],
the Adriatic Sea. Therefore, the protection and surveillance of would complement MS by providing undersea monitoring ca-
UCIs are crucial elements that will be included in any future pabilities. Besides sensory data, the analysis of contextual in-
maritime strategy. formation, such as bathymetry, weather data, human intelli-
gence (HUMINT), and open source intelligence (OSINT), is
Sabotage of UCIs can occur through the use of surface as- of paramount importance. More in general, the joint use of
sets such as warships or commercial vessels, or by underwa- underwater and above-water heterogeneous sensors, together
ter assets, as shown in Fig. 2. In the former case, multiple with contextual and intelligence information is a key con-
above-water heterogeneous systems and sensors, e.g., Auto-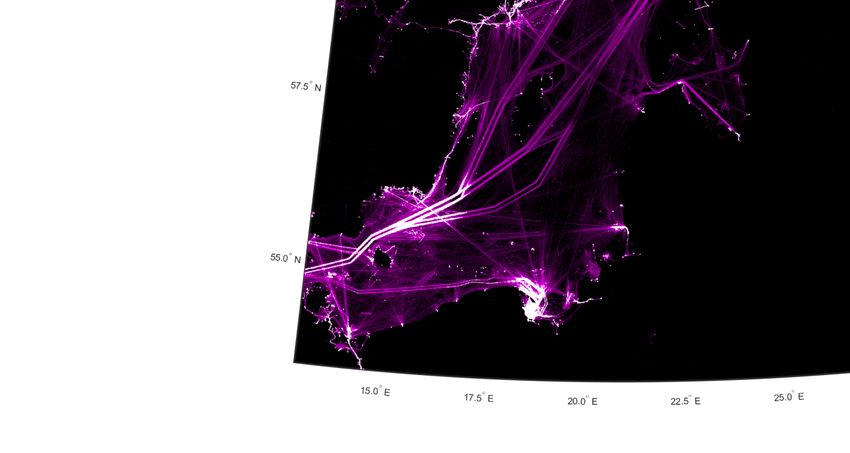
3

cept for the transition towards a Seabed-to-Space Situational      public concern about the resilience of these important infras-
Awareness (S3A). Given the scale of the problem and the large      tructures. Similarly, the submarine cable network, with more
amount of data to be processed, achieving S3A related to the       than 400 active cables spanning at least 1.3 million kilome-
monitoring of UCIs can be done by using advanced Artifi-           ters globally, is a vital asset composed of optical fibers and
cial Intelligence (AI) and Information Fusion (IF) techniques.     energy cables laid on the ocean floor. They constitute the most
These techniques allow for the integration of vast amounts of      efficient and cost-effective solution to sending digital informa-
information from various sources and monitoring a large num-       tion across the globe. This network digitally connects countries
ber of assets on a daily basis. Examples of such techniques in-    worldwide, with more than 10 trillion USD dollars in financial
clude Bayesian Multi-Target Tracking (MTT) techniques [7]–         transactions exchanged every day, and represents the backbone
[9], multi-reasoning systems based on the Dempster-Shafer          for internet communications globally.
theory [10], and anomaly detection techniques. These enable           Compared to underwater energy pipelines, underwater ca-
the fusion of diverse information at multiple levels. The knowl-   bles are more vulnerable, since they are more flexible and
edge gained from these techniques, once extracted and made         fragile. The major causes of damage are represented by hu-
easily understandable, can provide end-users such as govern-       man errors and negligence. To make an example, 40% of the
ment authorities, defense forces, coast guards, and police, not    incidents occur due to trawling activities by fishing boats,
only with a better understanding of the entities and actors        while another 15% is caused by anchoring accidents, such
involved in a specific event, such as the Nord Stream inci-        as improperly stored anchors, anchoring outside approved ar-
dent, their relations, and the potential consequences of these     eas, anchoring mispositioning due to weather conditions, and
relations, but also with an effective tool to anticipate future    emergency dropping of an anchor. Other human-driven be-
threats to UCIs and other critical assets. We anticipate that      nign causes of incidents include oil and gas development, off-
these techniques will provide the ability to prevent potential     shore wind and energy constructions, hydro-energy projects,
future attacks on UCIs and will become of increasing interest      and deep-sea mining operations. Intentional sabotage opera-
to national and international institutions and agencies, as well   tions to underwater cables classified as hybrid warfare op-
as the maritime industry.                                          erations have not yet been officially documented. However,
   The remainder of this paper is organized as follows: Sec-       different Russian submarine activities in the proximity of un-
tion II provides an overview of UCIs and describes impor-          derwater cables have been publicly reported since 2015, rais-
tant aspects related to their resilience. Section III provides     ing concern among NATO officials, as the Russian navy has
a description of sensor technologies that could effectively        clearly demonstrated an unprecedented interest in undersea ca-
be used for monitoring UCIs, and details useful contextual         bles [13]. In February 2022, Russia has conducted a naval
information. Section IV provides an overview of S3A and,           exercise just outside Ireland’s exclusive economic zone, very
in particular, it describes state-of-the-art information fusion,   close to several submarine cables connecting France, the UK,
anomaly detection, and automated reasoning techniques. Sec-        and the USA. According to an Irish military source, the scope
tion V presents analyses on the Nord Stream explosions, the        of this operation was a demonstration of capability to sabotage
cutoff of the underwater cable SHEFA-2 connecting the Shet-        underwater cables [14].
land Islands and the UK mainland [11], and the anomalous              The highest risk associated with underwater cables is rep-
behaviour of a large vessel in the Adriatic Sea. Concluding        resented by high-density maritime bottlenecks. For instance,
remarks are provided in Section VI.                                seven intercontinental cables pass through the Strait of Gibral-
                                                                   tar, between Morocco and the Iberian Peninsula, connecting
                                                                   the Mediterranean Sea with the Atlantic Ocean. Another crit-
      II. U NDERWATER C RITICAL I NFRASTRUCTURE
                                                                   ical point is the passage through the Red Sea between the
   Nowadays, submarine pipelines and cables represent a vital      Mediterranean Sea and the Indian Ocean, with sixteen un-
infrastructure for global finance, economy, maritime security,     derwater cables passing through the Egyptian mainland [12].
and everyday life. Due to their undersea concealment, con-         Even though most countries could cope with a significant de-
cern about UCIs is usually risen to the public and institutional   crease in bandwidth in case of simultaneous damage to multi-
attention only after a major accident occurs, a phenomenon         ple underwater cables, island states and oversea territories, not
referred to in [12] as “collective sea blindness”. Despite their   boasting the same redundancy, are the most vulnerable ones.
importance and influence on many aspects of our societies,         A recent example is the interruption of communications with
UCIs have only recently seen increasing political and schol-       the Shetland Islands and the Faroe Islands, after the commu-
arly attention, mostly sparked by military concerns and recent     nication cable SHEFA-2 was severely damaged in two distinct
accidents involving underwater gas pipes and cables. Subma-        points, most likely by trawling fishing boats.
rine pipelines are the backbone for energy transportation to the      The aforementioned critical aspects of the underwater ca-
market, e.g., oil and gas, as they connect increasingly com-       ble networks are analyzed in terms of graph robustness and
plex structures, such as offshore rigs, floating storage, and      resilience in the next subsection.
floating processing units, that directly feed ashore. The pipes
themselves are of steel, and concrete is used to prevent im-
pacts and damage from ships’ anchors. But these resources are      A. Robustness and resilience
nonetheless vulnerable and thence of concern, witness the re-        UCIs are increasingly interconnected and interdependent,
cent explosion of the Nord Stream pipeline and its effect on       thus providing valuable benefits in terms of efficiency, quality
4

of service, performance, and cost reduction. However, these         dency is a bidirectional relationship between two infrastruc-
interdependencies increase the vulnerability of UCIs to acci-       tures through which the state of each infrastructure influences
dental and malicious threats, as well as the risk of a domino       or is correlated to the state of the other. Types of interdepen-
effect on the whole networked infrastructure. Consequently,         dencies include the following [21].
the impact of infrastructure components’ failures can be ag-           • Physical interdependencies, which arise from physical
gravated and more difficult to predict, compared to failures             links or connections among elements of the network. In
confined to a single infrastructure. As an example, blackouts            this context, disruptions and perturbations in one compo-
can be caused by the outage of a single transmission element             nent can propagate to other elements.
not properly managed by automatic control actions or operator          • Cyber interdependencies, which occur when the state of a
intervention, gradually leading to cascading outages and even-           component depends on data transmitted through the infor-
tually to the collapse of the entire network. Examples of cas-           mation infrastructure. Such interdependencies result from
cading effects due to infrastructure interdependencies leading           the increased use of computer-based information systems
to catastrophic events across multiple infrastructures spanning          for monitoring and management activities (e.g., SCADA).
wide geographical areas are documented in [15].                        • Geographic interdependencies, which exist between two
   UCIs such as pipelines, internet lines, and power cables are          infrastructures when a local environmental event can pro-
part of a complex network of critical infrastructure elements            voke changes in both of them. This generally occurs when
on the bottom of the seas. A complex system can be analyzed              the components are in close spatial proximity, e.g., infras-
by understanding how its components interact with each other             tructures that cross borders or that provide cross-border
by using network science [16]. A network representation offers           services, thus impacting the interests of different nations.
a common language to study different types of UCIs through             • Finally, logical interdependencies, which gather all inter-
graph theory, where a network is described by the system’s               dependencies that are not physical, cyber or geographic,
components called nodes or vertices, and the direct interac-             caused by, e.g., regulatory, legal, or policy constraints.
tions between them, called links or edges. The structure and
topology of such a complex network plays an essential role in
                                                                    B. Legal aspects
a system’s ability to survive random failures or deliberate at-
tacks. In a network context, the system’s ability to carry out         The legal status of underwater pipes and cables varies based
its basic functions even when some of its nodes and links may       on the legal zone in which they are located, as determined by
be missing is referred to as robustness. Additionally, a system     the United Nations Convention of the Law Of the Sea (UNC-
is resilient if it can adapt to component failures by changing      LOS). Within a country’s territorial waters, which extend up
its mode of operation, without losing its ability to function.      to 12 nautical miles from the coastline, the country has full
In order to improve resilience, it is important to identify the     jurisdiction over the pipe/cable. In the contiguous zone, which
most critical nodes of networked UCIs that are most likely          extends from 12 to 24 nautical miles from the coastline, states
to be failure points or vulnerable to attacks, and assess the       have specific law enforcement duties and obligations. Outside
consequences. Recent research on robustness and resilience          of these zones, particularly in the high seas (areas outside
of complex networks to failures and attacks include, respec-        of national jurisdiction) as well as in the exclusive economic
tively, [17] and [18]. Moreover, different models (e.g., [19],      zones of states (i.e., up to 200 nautical miles from a nation’s
[20]) have been proposed to capture the dynamics of cascading       coastline), the legal status of pipes/cables and responsibility
failures in systems characterized by some flow (e.g., informa-      for their protection is currently defined as “unclear” and “am-
tion, natural gas, electric current) over a network. This allows    biguous” [12], [22]. Furthermore, underwater pipes may also
us to understand the fraction of nodes that can be removed be-      be subject to additional regulations and laws depending on the
fore global connectivity of the network is lost, how to stop a      activities they are associated with and their specific use. To
cascading failure, and how to enhance a system’s dynamical          make an example, oil and gas underwater pipes may be sub-
robustness. As already anticipated in Section II, considering       ject to additional environmental protection and safety-related
the underwater cable infrastructure, maritime choke points can      regulations, while underwater pipes crossing national borders
be identified as critical points due to their high density of ca-   (or used for international trade) may be subject to additional
bles and maritime traffic. According to a recent analysis on        international laws and agreements.
security threats and consequences for the EU [12], two key
maritime bottlenecks are the Strait of Gibraltar and the pas-            III. S ENSORS AND C ONTEXTUAL I NFORMATION
sage between the Indian Ocean and the Mediterranean Sea via            In this section, we describe different types of sensors and
the Red Sea, respectively. The former, connecting the Mediter-      technologies that are available and can be exploited for UCIs
ranean Sea and the Atlantic Ocean, is a dense area used for         surveillance.
various maritime activities including submarine activities, with
seven intercontinental cables passing through the strait. The
latter represents the core connectivity to Asia where intercon-     A. Coastal radars and AIS
tinental cables pass through the Egyptian mainland adjacent to         Among the surveillance sensors commonly used for MS, S-
the Suez Canal to enhance the system’s dynamical robustness.        band or X-band pulse radar sensors installed along the coast-
   Understanding and analyzing the interaction and interde-         line represent a relevant and consistent source of informa-
pendencies among UCIs is of utmost importance. Interdepen-          tion [23]. However, their coverage area and maximum range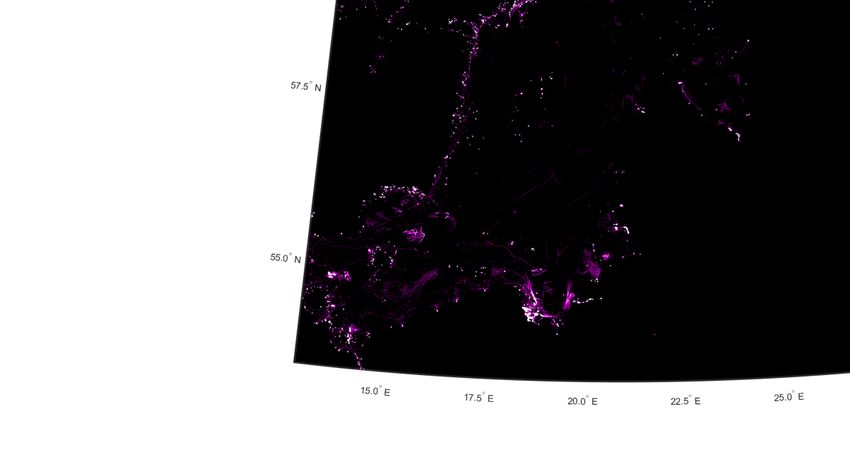
5

might be limited by line-of-sight propagation. This limita-           cal geo- and time-referenced images provided by space-based
tion can be overcome by the installation and employment               sensors, e.g., SAR, multi-spectral (MSP), and hyper-spectral
of long-range sensors such as High-Frequency Surface-Wave             (HSP) sensors.
(HFSW) radars which have been considered for ship local-
ization and tracking [24]–[28]. Initially introduced for ocean        B. Satellite sensors: SAR, MSP and HSP
remote sensing, HFSW radars could dramatically increase MS               SAR is a high-resolution imaging system typically em-
coverage by their ability to detect targets at Over-The-Horizon       ployed on board satellites (or aircrafts) that has become es-
(OTH) distances. In particular, multiple HFSW radars [26]–            sential for wide-area monitoring to detect and track vessels at
[28], combined with other data sources such as AIS, satel-            sea independently of their compliance with the SOLAS con-
lite images, and contextual information, have the potential to        vention. It is an active remote sensing technology based on
provide continuous-time coverage of large sea areas at OTH            the transmission of an electromagnetic (EM) microwave sig-
distances [8], [9].                                                   nal toward the Earth, and the reception and processing of the
    Besides conventional and OTH coastal radars, AIS — an             signals scattered by any natural or artificial features on the
anti-collision broadcast system of transponders automatically         surface. The use of EM microwave signals — that undergo a
exchanging ship traffic information for maritime safety — def-        weak scattering and absorption from the atmosphere — makes
initely represents the major source of information by volume          the monitoring capability of SAR systems independent of sun-
and granularity on surface vessel traffic. According to the           light illumination, thus allowing an effective sensing regard-
International Association of Marine Aids to Navigation and            less of the weather conditions. SAR systems typically oper-
Lighthouse Authorities (IALA), the scope of AIS is “to im-            ate in a monostatic geometry, where the receiving antenna
prove the maritime safety and efficiency of navigation, safety        is co-located with the transmitting one. In this configuration,
of life at sea and the protection of the marine environment”          only the energy reflected in the backscattering direction is col-
[29]. In 2002, the International Maritime Organization (IMO)          lected by the system. The received signals are then properly
Safety of Life at Sea (SOLAS) convention [30] included a              processed to form a 2-dimensional (2D) image of the scene
mandate that requested many commercial vessels to fit on-             reflectivity in slant-range/azimuth coordinates. The features of
board AIS. Specifically, IMO requires ships over 300 Gross            the obtained image largely depend on both surface parameters,
Tonnage (GT), cargo vessels over 500 GT, all passenger ships,         e.g., material composition, small- and large-scale roughness,
and all fishing vessels over 45 meters (in EU countries over          and sensor parameters, e.g., viewing angle, frequency, polar-
15 meters [31]) to be equipped with an AIS transponder on-            ization, and spatial resolution.
board. AIS messages can be exchanged through both satellite              While active microwave remote sensing systems, such as
and terrestrial receivers [4] and convey information about ship       SAR, offer a key support for gathering rather coarse informa-
identifier, i.e., the Maritime Mobile Service Identity (MMSI),        tion at multiple frequencies, polarizations, and viewing angles,
route (position, speed, course, and true heading), and other          MSP and HSP optical sensors can be exploited fruitfully to in-
ship and voyage information, including ship and cargo type,           fer more accurate details in the spatial and spectral domains.
size, destination, and estimated time of arrival.                     MSP and HSP sensors cover the entire optical region — be-
    The analysis of AIS trajectories is used, among others, to        tween microwaves and X-rays — which refers to wavelengths
pinpoint potentially illegal or illicit activity performed by ves-    ranging from 0.3 µm to 15 µm. Space-based MSP missions
sels in specific areas of interest (see, e.g., [32], [33]). A first   allow to collect imagery easy to interpret at a usually higher
filtering of AIS trajectories could be performed according to         spatial resolution than SAR systems; however, MSP sensors
some selection criteria. In particular, considering a bounding        are sensitive to cloud and sunlight conditions, and they usually
area of Dmax kilometers around an UCI or a point of interest,         cover limited areas during each acquisition. On the other side,
e.g., Nord Stream explosion point, one could select all the AIS       HSP satellite images are characterized by very high-spectral
trajectories that have spent at least a given period of time Tmin     resolution and are suited to accurate classification, but they
inside the area. A further filtering to spot stationary or drifting   have low spatial resolution, require a large computational bur-
ships could be achieved by selecting those trajectories whose         den, and are as well sensitive to cloud and sunlight conditions.
average speed is lower than a maximum speed Smax , or whose           For the interested reader, a comprehensive review of satellite
average rate of manoeuvres per minute is higher than a pre-           sensors can be found in [4].
defined threshold. Non-kinematic information may be useful
as well for AIS-based filtering. For example, a non-kinematic-        C. UUVs equipped with acoustic sensors
based selection criteria may consist of excluding vessels whose          Unmanned Underwater Vehicles (UUVs) equipped with
small size would not allow them to represent a possible threat        acoustic sensors are rapidly becoming the predominant plat-
to underwater pipes (e.g., fishing vessels in very deep waters).      forms for undersea observation and monitoring. UUVs can be
A combination of kinematic-based and non-kinematic-based              generally classified into Remotely Operated Vehicles (ROVs)
selection criteria can also be taken into account.                    and Autonomous Underwater Vehicles (AUVs) [34]. The for-
    In reality, AIS messages can be counterfeited and AIS             mer ones are tethered to ships or marine platforms and oper-
transponders can be easily switched off, or vessels could nav-        ated from above the water’s surface. The tether allows opera-
igate outside the coverage of coastal/satellite AIS receivers.        tors to receive sensor data, e.g., sea-bottom images from cam-
For these and other reasons, AIS data is often complemented           eras, and, if needed, guide remotely the ROVs almost in real-
with data from other sensors or sources; for instance, histori-       time; however, the operation range is limited by the tether’s
6

                                60 ◦N

                                                                                                                                 60 ◦N
                             59 ◦N

                                                                                                                              59 ◦N
                  egrees]

                                                                                                                   egrees]
                            58 ◦N

                                                                                                                             58 ◦N
       Latitude [d

                                                                                                        Latitude [d
                        57 ◦N

                                                                                                                         57 ◦N
                     56 ◦N

                                                                                                                      56 ◦N
                  55 ◦N

                                                                                                                   55 ◦N
               54 ◦N

                                                                                                                54 ◦N
                                                          0             200              500 km                                                            0             200              500 km

                             14 ◦    E   16◦E
                                                                                                   ◦E
                                                                                                  28                          14 ◦    E   16◦E                                                     28◦ E
                                                18◦ E         20◦ E   22◦ E   24◦ E   26◦ E                                                      18◦ E         20◦ E   22◦ E   24◦ E   26◦ E

                                                        Longitude [degrees]                                                                              Longitude [degrees]
                 (a) Density map of the entire maritime traffic of the Baltic Sea.                                            (b) Density map of the stationary areas of the Baltic Sea.
Fig. 3. Density maps of the maritime traffic in the Baltic Sea built using AIS data from September 1st to September 15th, 2022. A higher brightness
corresponds to a higher traffic density. Green and red dotted lines show the Nord Stream 1 and 2 gas pipelines, respectively.

length. On the other side, AUVs are untethered and computer-                                              analysis of seismic waves on the ocean bottom and for subma-
controlled, with little or no operator interaction while perform-                                         rine structural characterization [38], [39]. It is enabled by fiber
ing their pre-programmed subsea mission; multiple AUVs can                                                optic installed along underwater infrastructures, that continu-
also cooperatively form an intelligent sensing network for the                                            ously allows the monitoring in real time of underwater assets.
monitoring of large regions of interest [35], [36]. Even though                                           While traditional monitoring systems rely on discrete sensors
AUVs can be programmed to survey larger areas than ROVs,                                                  measuring at pre-fixed points, the fiber optic cable enables a
their operating range is dependent on the duration of their bat-                                          continuous monitoring along a very long portion of the un-
teries. Furthermore, underwater communications, commonly                                                  derwater infrastructure. Even though current commercial DAS
exploiting the sound channel, are unreliable and character-                                               systems allow a thorough monitoring along a maximum dis-
ized by limited bandwidth and range, thus limiting the ability                                            tance of 50 kilometers, recent studies have shown that per-
of AUVs to effectively share sensor information in real time.                                             sistent monitoring could be enabled up to a hundred kilome-
Therefore, the choice among ROVs and AUVs is dependent                                                    ters. The most common DAS technologies are based on phase
on the mission requirements as well as on maximum range,                                                  sensitive Optical Time Domain Reflectometer (φ-OTDR) and
operating depth, time to cover a required distance, and type                                              coherent OTDR (C-OTDR) [40]. A DAS interrogator unit gen-
and size of sensors they could bring on board, e.g., acoustic,                                            erates a series of laser pulses, sends them through the optical
magnetic, optical, and oceanographic.                                                                     fiber cable, and collects the backscattering of the light along
   Since optical and magnetic waves do not propagate well in                                              the length of the fiber. The analysis of the backscattered sig-
seawater, acoustic sonars, which employ sound waves to de-                                                nal by means of classification algorithms allows to detect and
tect and consecutively localize underwater objects, are nowa-                                             locate events such as leaks, intrusion activities, cable faults,
days the most common technology for undersea surveillance.                                                or other anomalous events.
Passive sonars rely on the reception and processing of acous-
tic information that is radiated by underwater noise sources                                              E. Contextual Information
e.g., the noise produced by ships or submarines propellers;                                                  Contextual information is generally intended as information
active sonars, instead, send an acoustic waveform and process                                             that does not directly refer to the assets under surveillance,
the signals reflected by underwater objects. Synthetic aper-                                              but to their surroundings. Contextual information adds to the
ture sonars (SAS) [37] represent an established technology to                                             operational picture the clarity that is needed to drive the ac-
collect high-resolution images of the seabed and underwater                                               tions to be taken. As such, contextual information is seldom
infrastructures. Similarly to SAR, a SAS continously transmits                                            conveyed by a single piece of information alone, but is rather
acoustic signals and combines successive received pulses re-                                              derived from a mixture of experience, domain knowledge, and
flected by an object or a surface along a known track to create                                           data artifacts. In the MS setting, examples of contextual infor-
a 2D image of the illuminated area.                                                                       mation include geographic databases, such as the bathymetry
                                                                                                          and the displacement of critical infrastructures; geospatial in-
                                                                                                          formation, such as meteorology and oceanography; intelli-
D. Distributed acoustic sensing
                                                                                                          gence reports, comprising human intelligence–HUMINT–and
  Distributed Acoustic Sensing (DAS) is an emerging tech-                                                 open-source intelligence–OSINT; reports on business owner-
nology which is commonly employed for the detection and                                                   ship structures, sanctions, and criminal behavior of ship own-
7
ers; and derived information from past/historical data, such as or a false alarm. In a Bayesian formulation, the MTT method
maritime Patterns-Of-Life (POLs). To make a practical exam- amounts to estimating at each time (approximations of) the
ple, a vessel’s trajectory could raise major concern if the vessel marginal posterior distributions of the detected targets’ states,
was previously involved in criminal activities, if only opaque using all the measurements available up to the current time.
ownership-related information of the vessel is available, or if MTT methods have to deal with various challenges, for exam-
there is evidence of the vessel deploying specialized equipment ple, the heterogeneity of the different information sources [8],
in proximity of sensitive infrastructures. Moreover, taking into [9], asynchronicity, out-of-sequence measurements [41], la-
account bathymetry is crucial, since the difficulty and risk in tency, and the measurement-origin uncertainty (MOU) [42],
performing sabotage operations are directly proportional to the i.e., the fact that it is unknown which target (if any) generated
sea depth. Furthermore, POLs can be considered as particu- which measurement. Existing MTT algorithms can be broadly
lar sets of behaviors and movements, e.g., waiting, navigating, classified as vector-type algorithms, such as the joint proba-
or drifting, associated with specific entities, e.g., fishing ves- bilistic data association filter [43] and the multiple hypothesis
sels, cargo vessels, and oil tankers, over a defined period of tracker [44], [45], and set-type algorithms, such as the (car-
time. In this context, density maps, built using historical AIS dinalized) probability hypothesis density filter [46], [47] and
data in a given time interval and area, provide a preliminary multi-Bernoulli filters [48]. Vector-type algorithms represent
insight on the most common POLs. This crucial information the multitarget states and measurements by random vectors,
can be used for a preliminary classification of AIS trajecto- whereas set-type algorithms represent them by random finite
ries. In fact, a selected AIS trajectory can be considered more sets. Algorithms of both types have been developed and eval-
or less suspect depending on whether its behavior seems com- uated, and several limitations have been noted [9]. First, the
patible with the detected POLs in the given period of time fusion of heterogeneous information sources is not straightfor-
and area. Figure 3a shows a density map of the entire mar- ward. Second, they do not adapt to time-varying model param-
itime traffic in the Baltic Sea, built using AIS data collected eters. And third, their complexity usually does not scale well
from September 1st to September 15th, 2022. Purple patterns in relevant system parameters, e.g., the number of sensors.
highlight the most common maritime routes in the considered An emerging approach to MTT and IF — one with flexi-
region. The same data have been used to derive a density map bility, low complexity, and useful scalability — is based on a
of the stationary areas as shown in Fig. 3b. factor graph and the sum-product algorithm (SPA) [42]. First,
a factor graph representing the statistical model of the MTT
IV. S EABED - TO -S PACE S ITUATIONAL AWARENESS (S3A) problem is derived; then, the SPA is used to solve efficiently
The major challenge that operators and analysts face is iden- the MOU problem and obtain a principled and intuitive ap-
tifying patterns emerging within very large datasets, e.g., AIS, proximation of the Bayesian inference needed for target detec-
SAR, optical, and multispectral data, when the goal is to an- tion and estimation. A major advantage of the SPA is its abil-
ticipate possible future behaviors of suspicious assets and the ity to exploit conditional independence properties of random
related threats. In this context, information undoubtedly plays variables for a drastic reduction of complexity; thereby, SPA-
a crucial role, and artificial intelligence (AI) opens up unprece- based MTT algorithms can achieve an attractive performance–
dented possibilities for surveillance systems to improve MS, complexity compromise, making them suitable for large-scale
and in particular the resilience of UCIs. AI and Information tracking scenarios involving a large number of targets, sen-
Fusion (IF) can easily process immense volumes of informa- sors, and measurements, and allowing their use on resource-
tion, fused from a variety of sources and generated from a limited devices. Generally, the complexity of an SPA-based
very large number of monitoring assets on a day-to-day ba- MTT algorithm scales quadratically in the number of targets,
sis, thus enabling a potential future transition to an holistic linearly in the number of sensors, and linearly in the number
perspective of S3A. The learned knowledge therefrom can be of measurements per sensor, and outperforms previously pro-
used as a valuable support to the cognitive processes (percep- posed methods in terms of accuracy (see [42] and references
tion, comprehension, and projection) of analysts and opera- therein).
tors to anticipate future behaviors and/or identify threats and SPA-based MTT algorithms can be easily extended to auto-
critical situations that might endanger UCIs. In the follow- matically estimate unknown and time-varying parameters [49],
ing, we will provide an overview of state-of-the-art Bayesian such as detection probabilities of sensors, incorporate multiple
IF and Multi-Target Tracking (MTT), anomaly detection, and dynamic models, and in particular fuse heterogeneous data [8],
automatic reasoning techniques, that might enable S3A and e.g., from terrestrial radars, SAR, optical sensors, and AIS. In
improve the monitoring of UCIs. the context of S3A and in particular UCIs monitoring, the fu-
sion of satellite data, e.g., SAR, with AIS potentially allows the
identification of ships, which switch off the AIS during anoma-
A. Bayesian IF and MTT lous activities or sabotage operations. The fusion of this infor-
The main objective of a multisensor MTT method is to se- mation is often difficult due to the asynchronicity and sparsity
quentially estimate the number of targets together with their of AIS messages, and the non-trivial association between mes-
states, e.g., position, velocity, course, and heading, in a par- sages and targets. Indeed, although each AIS message usually
ticular maritime area, by fusing measurements from multiple includes a unique identifier–the MMSI–, this may be absent,
heterogeneous sensors. Each measurement is either a noisy incorrectly received, or observed for the first time, in which
observation of a target’s kinematics, shapes, or other features, case no prior information is available on the target–message8
association. The SPA-based MTT method can be efficiently anomaly detection fit a statistical model representing normal
extended to fuse AIS messages and measurements obtained vessel behavior to the given historical vessel movement data,
from SAR, optical images, or other sensors, and to identify and then apply a statistical inference test to determine whether
(or label) each detected ship by means of the MMSI. a new vessel observation belongs to this model or not. Obser-
vations that have a low probability of being generated from
B. Anomaly detection the learned model, based on the applied test statistic, are de-
Increasing automation through a large number of advanced clared as anomalous behaviors. Bayesian networks, Gaussian
data-driven methods and techniques for maritime anomaly de- processes, and the Gaussian mixture model represent the ma-
tection has enabled the system and the operator to spot com- jor methods within the stochastic approach.
plex situations by correlating various events from all surveil- Current research on maritime anomaly detection considers
lance sensors and classify them into important incidents [50]– the aforementioned types of anomalies. The deviation from a
[52]. An anomaly in the maritime domain can be described standard route is the most prominent anomaly type that re-
as a behavior that is not “normal” or, more specifically, not search addresses by extracting frequently traveled sea routes
expected to occur during regular operations [50], and it can from historical AIS data, e.g., via clustering. Unknown AIS
refer to a sudden change in vessel kinematic behavior (such as tracks can then be compared in order to investigate whether
unusual speed or location), deviation from standard sea lanes, they are similar enough to the extracted routes, or in the case
unexpected AIS activity, unexpected port arrivals, close ap- of clustering, belong to one of the identified route clusters.
proach, and zone entry [53]. In particular, zone entry anoma- These approaches work very well in areas where many ships
lies involve ships entering in protect environmental areas, or take similar routes [56]–[58]. A different approach [32], [59]
approaching military installations or UCIs. faces the same anomaly within a stochastic framework by com-
Most anomaly detectors require learning an underlying bining the available context data with a parametric model of
model representing the normal behavior by using the available the vessel’s kinematic behavior and running a hypothesis test-
historical data. Based on the learned normalcy model, detec- ing procedure to make decisions on the existence of anoma-
tors can decide whether new data can be classified as normal or lous deviations relying upon the available measurements (e.g.,
anomalous behavior. According to the available proposals and AIS, radar, SAR). Further stochastic strategies address the joint
studies [51], [54], the data-driven methodologies for maritime problem of sequential anomaly detection and tracking of a tar-
anomaly detection can be divided into machine learning and get subject to switching anomalous deviations in a Bayesian
stochastic approaches. Machine learning techniques are able framework [60]–[62]. Other approaches particularly consider
to identify patterns emerging within huge amounts of maritime deviations from standard routes in the presence of unexpected
data, fused from various uncertain sources and generated from AIS activity. Indeed, AIS tracks of ships are often character-
monitoring thousands of vessels a day, so as to act proactively ized by large blind spots, and this may be due to uninten-
and minimize the impact of possible threats. The general aim tional technical problems, radio interference, attenuation, or
of such an approach includes frequent pattern discovery, trajec- actual equipment manipulation, such as intentionally turning
tory pattern clustering in a multidimensional feature space, tra- off AIS transceivers [32], [63], [64]. Moreover, AIS signals
jectory classification, forecasting, and anomalies/outliers de- can be easily spoofed by external attackers or the crew itself
tection. The machine learning framework mainly comprises willing to obscure their locations [33], [65]. The AIS inten-
the following unsupervised and supervised methodologies. i) tional interruption or spoofing could indicate a will to hide
Distance-based clustering methods are mainly based on the some illegal activities, such as smuggling on coast or with
nearest neighbor algorithm and implement a well-defined dis- other ships, or entry in unauthorized areas. Zone entry as an
tance metric; the greater the distance of the object to its neigh- anomaly type is considered only marginally [53], [66]. Re-
bor, the more likely it is to be an outlier. ii) Density-based stricted zones with entry ban are learned implicitly as part
clustering methods identify distinctive groups/clusters in the of the general shipping routes and trajectories [66], whereas
data based on the idea that a cluster in a data space is a con- more elaborate methods such as predicting whether a zone en-
tiguous region of high point density, separated from other such try is likely to occur soon are proposed in [53]. Anomalous
clusters by contiguous regions of low point density. In particu- port arrival is taken into account in [67] looking at ferries that
lar, the Density-Based Spatial Clustering of Applications with run regular routes according to a fixed schedule, while close
Noise (DBSCAN) algorithm and its variations have become approach anomalies are investigated in [53], [68], [69].
very popular for their convenient properties: these methods do
not require specifying the number of clusters and have the
ability to derive arbitrarily shaped clusters and identify out- C. Reasoning for situation awareness
liers [55]. iii) Classification methods require the construction Besides the data-driven approaches described earlier, there
of a classifier, that is, a function that assigns a class label to exist situations where higher-level reasoning needs to be con-
instances described by a set of attributes. Using supervised sidered. This can be useful for aligning highly heterogeneous
learning approaches, trajectories or segments of a trajectory information sources, which range from HUMINT and OSINT
can be classified into some categories, which can be motions, descriptions of the vessels’ current and projected behavior,
human activities, or transportation modes. The main classifi- through contextual information to MTT tracks and anomaly
cation methods include neural networks, support vector ma- reports. This is in line with the Activity-Based Intelligence
chines, and decision trees. Stochastic approaches to maritime (ABI) [70], [71] paradigm that has been in use since the war9
AIS Interpolated Trajectory
56.1◦ N
SAR Detection y
56.0◦ N
55.9◦ N Nord Stream Leakage
55.8◦ N
Latitude [degrees]
Panel (b)
1
am
tr e
55.7◦ N
r dS
No 2
am
tr e
r dS
55.6◦ N
No
55.5◦ N
55.4◦ N
Panel (c)
55.3◦ N
0 20 50 km
55.2◦ N
14.4◦ E 14.6◦ E 14.8◦ E 15.0◦ E 15.2◦ E 15.4◦ E 15.6◦ E 15.8◦ E 16.0◦ E 16.2◦ E 16.4◦ E 16.6◦ E 16.8◦ E 17.0◦ E
Longitude [degrees]
(a) Full Sentinel-1 SAR image over the Baltic Sea.
56.76◦ N
Trajectory
56.50◦ N
Trajectory
AIS Reported Positiony AIS Reported Position
SAR Detection
55.74◦ N
SAR Detectiony
Interpolated Position Interpolated Position
55.48◦ N
Latitude [degrees]
Latitude [degrees]
55.72◦ N
55.46◦ N
55.70◦ N
55.44◦ N
55.68◦ N
55.42◦ N
0 2 5 km 0 2 5 km
15.40◦ E 15.44◦ E 15.48◦ E 15.52◦ E 15.56◦ E 15.98◦ E 16.02◦ E 16.06◦ E 16.10◦ E 16.14◦ E
Longitude [degrees] Longitude [degrees]
(b) Detail of the SAR image showing three associated detections. (c) Detail of the SAR image showing one not-associated detection.
Fig. 4. Nord Stream use case. Sentinel-1 SAR image acquired over the Baltic Sea some days before the explosions. Colored solid lines are vessels’ trajectories
obtained by interpolating the AIS positions provided by the vessels themselves. Circles are ships as detected within the SAR image: the color of the circle
identifies the detection as coming from a vessel whose AIS trajectory has the same color; a white circle indicates that the detection is not associated with
any AIS trajectory. Panels (b) and (c) present two details of the full SAR image showing examples of associated detections and not-associated detections,
respectively. Here, the crosses depict AIS reported positions, and the stars are the interpolated positions of the vessels at the time of the image acquisition.
in Afghanistan and has brought a new vision of intelligence count for its reliability and possibly contextual information.
pushing forward the development of multi-intelligence (multi- In cases where different sources provide reports on the same
INT) capabilities, which aim at considering in an exhaustive target property, these reports can be aligned in accordance to
way all sources of information. In order to make sense of an appropriate correction model; if the reports refer to differ-
this kind of data, each source needs to be corrected to ac- ent properties, instead, they are used as inputs to a reasoning10
0 1 2 3 4 5 6 7 8 9 10 11 12 13 kn
56.4◦ N
0 10 25 50 km
56.0◦ N
Latitude [degrees]
55.6◦ N
55.2◦ N
Trajectory
54.8◦ N
Nord Stream 1y
Nord Stream 2y
Nord Stream Leakage
0 20 50 100 km
14.0◦ E 14.5◦ E 15.0◦ E 15.5◦ E 16.0◦ E 16.5◦ E 17.0◦ E 17.5◦ E 18.0◦ E 18.5◦ E 19.0◦ E
Longitude [degrees]
Fig. 5. Nord Stream use case. Full trajectory of the vessel of interest a few days before the explosions. The trajectory spans several days and its color (cyan
to magenta) is related to the vessel’s speed (slower to faster); grey arrows indicate the direction of the vessel at the beginning and at the end of the trajectory.
The locations of the gas leakage are marked by yellow diamonds.
system that verifies their consistency. For example, consider Possible uses of such rule-based approaches range from triv-
source A which reports a particular vessel as a tanker, and a ial to significantly more complex ones. A trivial illustration
source B which reports it to be a cargo vessel. Given that the could be reasoning about a vessel’s inconsistent AIS status. For
reports are concerned with the same property with different example, a trajectory classifier can be considered one source,
degrees of semantic granularity, this information can be read- and the vessel’s AIS navigational status the other. If the navi-
ily aligned. On the other hand, a source may report on the gational status is inconsistent with the type of trajectory pro-
vessel type, and the other on its speed. In this case, the prop- vided by the classifier, the AIS information reported by the
erties can be aligned using a reasoning system verifying the vessel can be considered inconsistent. This by itself is un-
consistency of the speed given the vessel type. This can high- likely to mean that the vessel is involved in illegal activity,
light conflict between the sources which can further lead to but it may be an indication of anomaly which should lead to
conclusions about spoofing or another anomaly, depending on further investigation. More complex evidential networks have
the exact scenario. also been proposed in this context to assess the vessel’s in-
tent, likelihood of criminal activity, or the overall threat level
Tackling hybrid threats is particularly challenging as it is posed. One particular strength of the belief-theoretic approach
necessary to predict an event, that, above all, is rare and can provided by the evidential networks is that the rules are con-
be essentially considered a black-swan event. As such, it is sidered to be partially uncertain, thus the reasoning can still
unlikely to provide an analysis based on data and machine be performed with missing data. This can be leveraged to
learning only; in these cases it is possible to leverage ex- identify which sources of information should be queried in
pert information using rule-based systems. One such approach, order to improve the quality of the inference results. Finally,
which allows a degree of semi-causal reasoning, involves using the transparent-by-design property of expert systems facilitates
valuation-based systems with the Dempster-Shafer theory [72] the implementation of explanation abilities; these describe the
(also known as the theory of belief functions). Such systems relative contribution of each source to the decision made, the
are also known as evidential networks. The information pro- overall conflict and uncertainty in the answer obtained, as well
vided by the myriad of sources described earlier is corrected as the impact of various uncertainties in data [76].
and aligned with a common vocabulary using a mechanism
such as contextual belief correction [73], behavior-based cor- Furthermore, for a better understanding of overall situation
rection (BBC) [74], or its context-aware extension [10]. A set awareness which includes multiple entities interconnected by
of rules elicited from the experts is used to construct a valu- a set of relations, we can leverage conceptual graphs or knowl-
ation network which is defined by a set of variables (some of edge graphs. Recent work on these has explored embedding
which may be directly mapped to the observations provided by uncertainty in such graphs and establishing links with belief
the sources whereas the others are inferred) and the relations functions theory and evidential networks in order to allow un-
between them [75]. certain reasoning about multiple entities [77]. In the context11
13 kn 13 kn
55.65◦ N
Trajectory Trajectory
55.60◦ N
12 12
Nord Stream Leakage Nord Stream Leakage m 1
11 Strea
SAR Detection Nord 11
SAR Detection
10 10
55.60◦ N
55.55◦ N
9 9
Latitude [degrees]
Latitude [degrees]
8 8
55.55◦ N
7 7
55.50◦ N
6 6
5 2 5
m
55.50◦ N
rea
55.45◦ N
4 St 4
rd
No
3 3
1 2
am m
rea
55.45◦ N
re 2 2
St St
55.40◦ N
rd rd
No No 0 2 5 10 km 1 0 2 5 10 km 1
0 0
15.4◦ E 15.5◦ E 15.6◦ E 15.7◦ E 15.8◦ E 15.6◦ E 15.7◦ E 15.8◦ E 15.9◦ E 16.0◦ E
Longitude [degrees] Longitude [degrees]
(a) Extract of the trajectory also reporting the vessel’s location as de-(b) Extract of the trajectory also reporting the vessel’s location as de-
tected tected
in a SAR image acquired at time TA . in a SAR image acquired at time TB .
13 kn 13 kn
55.60◦ N
Trajectory Trajectory
12 12
Nord Stream Leakage Nord Stream Leakage
55.60◦ N
11 1 11
m
Strea
10 Nord 10
55.55◦ N
m 1
Strea
Nord 9 9
Latitude [degrees]
Latitude [degrees]
55.55◦ N
m 2
8 Strea 8
Nord
55.50◦ N
m2 7 7
Strea
Nord
6 6
55.50◦ N
5 5
55.45◦ N
4 4
55.45◦ N
3 3
55.40◦ N
2 2
0 2 5 10 km 1 0 2 5 10 km 1
0 0
15.5◦ E 15.6◦ E 15.7◦ E 15.8◦ E 15.9◦ E 15.5◦ E 15.6◦ E 15.7◦ E 15.8◦ E 15.9◦ E
Longitude [degrees] Longitude [degrees]
(c) Extract of the trajectory. (d) Extract of the trajectory.
Fig. 6. Nord Stream use case. Extracts of the full trajectory of the vessel of interest reported in Fig. 5. Each panel reports a portion of the full trajectory that
spans several hours. The colors (cyan to magenta) are related to the vessel’s speed (slower to faster); speeds below 3 knots are all reported in black. Grey
arrows indicate the direction of the vessel at the beginning and at the end of the trajectory, and yellow diamonds mark the locations of the gas leakage. A
red dot (in panels (a) and (b)) reports the location of the vessel as detected in a SAR image; additional details on the SAR detections are presented in Fig. 7.
of hybrid threats, this is particularly relevant to synchronised ships, while solid lines represent vessels’ trajectories that cover
threats originating simultaneously from several vessels coor- a time interval from 10 minutes before to 10 minutes after the
dinating their activity. SAR image acquisition time. These trajectories are obtained
by interpolating the AIS positions reported by the ships them-
V. C ASE S TUDIES selves, and filling gaps in the data of at most 6 hours. The
interpolation requires the availability of AIS positions both be-
This section reports analyses on the Nord Stream and Shet-
fore and after the image acquisition time; when this informa-
land Islands accidents, as well as on the anomalous behavior
tion is not available, e.g., during (quasi) real-time operations,
of a large vessel in the Adriatic Sea, and how surveillance
the vessel’s position at the time of the image acquisition can
sensors data, in particular AIS reported information and SAR
be inferred from the available past data [78]. The combined
images, might be beneficial for UCIs monitoring.
use of AIS data and satellite images (SAR, optical, MSP, and
HPS) allows giving an identity to a picture of a vessel that
A. Nord Stream could complement AIS for MS and that, otherwise, would re-
Figure 4 reports a Sentinel-1 SAR image acquired over the main unknown. On the other hand, the unavailability of AIS
Baltic Sea some days before the explosions that affected the data for a detected ship within a satellite image can be caused
Nord Stream gas pipeline [1]. The circles indicate detected by incorrect or lost data, or might highlight an anomalous be-12
circle matches that of the AIS trajectory, obtained as the in-
55.534◦ N
AIS Reported Position
Interpolated Position at TA
terpolation of the AIS reported positions represented by the
Interpolated Trajectory crosses. The stars indicate the interpolated positions of the
vessels at the time of the image acquisition; the offset be-
Latitude [degrees]
tween the shape of a vessel as detected by the SAR and its
55.530◦ N
TA + 0.4 mins
interpolated AIS position is due to the unknown Doppler fre-
quency generated by the motion of the vessel itself, and it is
TA − 25.3 mins thus related to its velocity [79]. Figure 4c, instead, shows a
TA + 10.7 mins
single detected ship — enclosed in the white circle — which
55.526◦ N
is not associated with any AIS trajectory; the closest available
0.1 0.2 0.5 1 km AIS interpolated position, indeed, is more than 3 km away.
This AIS trajectory, however, presents a relevant characteris-
15.465◦ E 15.470◦ E 15.475◦ E 15.480◦ E 15.485◦ E 15.490◦ E tic, that is, a gap of several hours (yet less than 6 hours) in
Longitude [degrees] the AIS data before and after the acquisition of the SAR im-
(a) Detail of the Sentinel-1 SAR image acquired at time TA . age. On one hand, this could suggest that the detected object
and the AIS trajectory depicted in Fig. 4c do refer to the same
vessel; on the other hand, the gap in the AIS data and the de-
AIS Reported Position
tection of the ship in a position that deviates from a linear
55.428◦ N
Interpolated Position at TB
TB − 28.8 mins
Interpolated Trajectory path, might be an indication of an anomalous behavior.
From the analysis of the AIS data, the behavior of another
Latitude [degrees]
vessel appears significant. Figure 5 shows its full trajectory
— over several days — before the Nord Stream accident. The
55.424◦ N
TB + 1.6 mins
colors, from cyan to magenta, reflect the speed of the vessel.
Extracts of the trajectory, each spanning several hours, are re-
ported in Fig. 6. Speeds below 3 knots are reported in black
because large vessels, such as the one considered, are hard to
55.420◦ N
0.1 0.2 0.5 1 km be maneuvered at such low speeds and tend to drift. These
TB + 26.9 mins
portions of the trajectory may suggest that the ship is follow-
15.840◦ E 15.845◦ E 15.850◦ E 15.855◦ E 15.860◦ E 15.865◦ E ing a search path, that is, it is maneuvering to approach the
Longitude [degrees] pipeline, and moving away from it while drifting. Note that
(b) Detail of the Sentinel-1 SAR image acquired at time TB . such behavior might also be compatible with other scenarios
Fig. 7. Nord Stream use case. Details of two Sentinel-1 SAR images showing
as, for example, loitering while waiting for orders. Neverthe-
the vessel of interest. Panel (a) shows the SAR image of the vessel located less, it is worth mentioning that the region where the Nord
as marked in Fig. 6a; likewise, panel (b) shows the SAR image of the vessel Stream accident occurred is not designed as a stationary area.
located as marked in Fig. 6b. TA and TB are the acquisition times of the
SAR images, respectively, in panel (a) and panel (b). Magenta dots represent
The presence of the vessel in the area is corroborated by
the vessel’s locations as reported by the AIS, while the blue stars indicate the its detection in two Sentinel-1 SAR images; Figs. 6a and 6b
vessel’s interpolated locations at time TA and time TB . Dashed lines reproduce report the locations of the vessel as detected in the SAR im-
the vessel’s trajectories obtained by interpolating the AIS reported locations.
ages, while Figs. 7a and 7b show details of the mentioned
Sentinel-1 SAR images. Both the SAR images are acquired
while the vessel is drifting: this is confirmed by the vessel’s
havior that requires further investigation. speeds reported in Figs. 6a and 6b at the time of the acqui-
The association between AIS trajectories and SAR detec- sition (below 3 knots) and by the orientation of the vessel as
tions in Fig. 4a is achieved by solving a specific assignment reported in Fig. 7. Finally, note that the slight offset between
problem (clearly, other solutions are available in the MTT lit- the vessel’s trajectory (dashed line) and the shape of the ship
erature, discussed in the previous section). The assignment as acquired by the SAR, particularly evident in Fig. 7b, is
cost between any SAR detection–AIS trajectory pair is the compatible with the vessel’s AIS reference point.
relative distance between the location of the SAR detection Beyond the aforementioned kinematic characteristics, two
and the interpolated position of the vessel at the time of the important remarks are useful to assess the potential implica-
image acquisition if such a distance is below 3 km, and it tion of the vessel in the Nord Stream explosions. The former
is assumed infinite otherwise. The association is then repre- is related to the vessel’s ownership risk assessment that is
sented by the color of the circle that matches the color of considered very high, thus not facilitating the identification of
the AIS trajectory which it is associated with; white circles beneficial owners. The second remark is related to the opera-
represent SAR detections that are not associated with any AIS tions which can be conducted by the vessel: according to sev-
trajectory. We observe that the majority of the vessels detected eral navy officers, consulted by the authors, the vessel would
in Fig. 4a are associated with an AIS trajectory. Figures 4b have been perfectly able to support and coordinate a sabotage
and 4c present two examples of associated detections and not- operation using specific instrumentation, such as a ROV.
associated detections, respectively. The first panel shows three As discussed in the previous sections, all the aforementioned
detected ships, each within a colored circle. The color of the information needs to be ingested and automatically processedYou can also read