Multifilter photometry of Solar System objects from the SkyMapper
←
→
Page content transcription
If your browser does not render page correctly, please read the page content below
A&A 658, A109 (2022)
https://doi.org/10.1051/0004-6361/202142074                                                                                                                Astronomy
c A. V. Sergeyev et al. 2022                                                                                                                                &
                                                                                                                                                           Astrophysics

Multifilter photometry of Solar System objects from the SkyMapper
                         Southern Survey?
   A. V. Sergeyev1,7 , B. Carry1 , C. A. Onken2,3 , H. A. R. Devillepoix4 , C. Wolf2,3 , and S.-W. Chang2,5,6

      1
          Université Côte d’Azur, Observatoire de la Côte d’Azur, CNRS, Laboratoire Lagrange, France
          e-mail: alexey.sergeyev@oca.eu
      2
          Research School of Astronomy and Astrophysics, Australian National University, Canberra 2611, Australia
      3
          Centre for Gravitational Astrophysics, College of Science, The Australian National University, ACT 2601, Australia
      4
          School of Earth and Planetary Sciences, Curtin University, Perth WA 6845, Australia
      5
          SNU Astronomy Research Center, Seoul National University, 1 Gwanak-rho, Gwanak-gu, Seoul 08826, Korea
      6
          Astronomy program, Dept. of Physics & Astronomy, SNU, 1 Gwanak-rho, Gwanak-gu, Seoul 08826, Korea
      7
          V. N. Karazin Kharkiv National University, 4 Svobody Sq., Kharkiv 61022, Ukraine
     Received 23 August 2021 / Accepted 20 October 2021

                                                                                      ABSTRACT

     Context. The populations of small bodies of the Solar System (asteroids, comets, and Kuiper Belt objects) are used to constrain the
     origin and evolution of the Solar System. Their orbital distribution and composition distribution are both required to track the dynam-
     ical pathway from their formation regions to their current locations.
     Aims. We aim to increase the sample of Solar System objects (SSOs) that have multifilter photometry and compositional taxonomy.
     Methods. We searched for moving objects in the SkyMapper Southern Survey. We used the predicted SSO positions to extract
     photometry and astrometry from the SkyMapper frames. We then applied a suite of filters to clean the catalog from false-positive
     detections. We finally used the near-simultaneous photometry to assign a taxonomic class to objects.
     Results. We release a catalog of 880 528 individual observations, consisting of 205 515 known and unique SSOs. The catalog com-
     pleteness is estimated to be about 97% down to V = 18 mag and the purity is higher than 95% for known SSOs. The near-simultaneous
     photometry provides either three, two, or a single color that we use to classify 117 356 SSOs with a scheme consistent with the widely
     used Bus-DeMeo taxonomy.
     Conclusions. The present catalog contributes significantly to the sample of asteroids with known surface properties (about 40% of
     main-belt asteroids down to an absolute magnitude of 16). We will release more observations of SSOs with future SkyMapper data
     releases.
     Key words. minor planets, asteroids: general – catalogs

1. Introduction                                                                                        We analyze here the images from the SkyMapper South-
                                                                                                  ern Survey (Minor Planet Centre (MPC) observatory code Q55),
The small bodies of our Solar System (asteroids, comets, Kuiper-                                  which uses a suite of filters that is well adapted to asteroid spec-
belt objects) are the remnants of the building blocks that accreted                               tral characterization (Fig. 1), similar to those of the Sloan Digital
to form the planets. Their orbital and compositional distributions                                Sky Survey (SDSS, the main source of compositional informa-
hold the record of the events that shaped our planetary system                                    tion over almost two decades; Szabó et al. 2004; Nesvorný et al.
(Levison et al. 2009; DeMeo & Carry 2014; Morbidelli et al.                                       2005; Carvano et al. 2010; DeMeo & Carry 2013; DeMeo et al.
2015; Clement et al. 2020).                                                                       2014, 2019; Parker et al. 2008; Graves et al. 2018). While the
    While the number of known Solar System objects (hereafter                                     SDSS completed its imaging survey in 2009, SkyMapper has
SSOs) has increased to over a million, the fraction of SSOs with                                  started its operations in 2014 and is currently active.
known composition remains limited. Spectroscopy in the visible                                         The present article aims to increase the number of aster-
and near-infrared has been used for decades to assert the com-                                    oids with multifilter photometry and taxonomy by identifying
position, but the sample remains small (several thousands, e.g.,                                  known SSOs in the SkyMapper source catalog. The article is
Bus & Binzel 2002; DeMeo et al. 2009; Fornasier et al. 2014;                                      organized as follows. In Sect. 2 we summarize the characteris-
Devogèle et al. 2019; Binzel et al. 2019). On the other hand,                                     tics of the SkyMapper Southern Survey. In Sect. 3 we describe
multifilter photometry can be used to classify SSOs into broad                                    how we extract SSOs observations from the SkyMapper point-
compositional groups, providing fewer detail but large samples                                    source catalog, and we detail the filters we applied to the sample
(up to several hundreds of thousands, e.g., Ivezić et al. 2001;                                  to reject false-positive sources in Sect. 4. The completeness and
Popescu et al. 2016; Sergeyev & Carry 2021).                                                      purity of the catalog is estimated in Sect. 5. We present the cat-
                                                                                                  alog of SSO colors in Sect. 6 and use it to classify the SSOs
  ?
    The catalogs are only available at the CDS via anonymous ftp                                  consistently with the DeMeo et al. (2009) taxonomic classifica-
to cdsarc.u-strasbg.fr (130.79.128.5) or via http://cdsarc.                                       tion in Sect. 7. We present our plan for future releases in Sect. 8.
u-strasbg.fr/viz-bin/cat/J/A+A/658/A109                                                           Finally, we summarize the released asteroid sample in Sect. 9.

                                                                                                                                                                          A109, page 1 of 15

                 Open Access article, published by EDP Sciences, under the terms of the Creative Commons Attribution License (https://creativecommons.org/licenses/by/4.0),
                                  which permits unrestricted use, distribution, and reproduction in any medium, provided the original work is properly cited.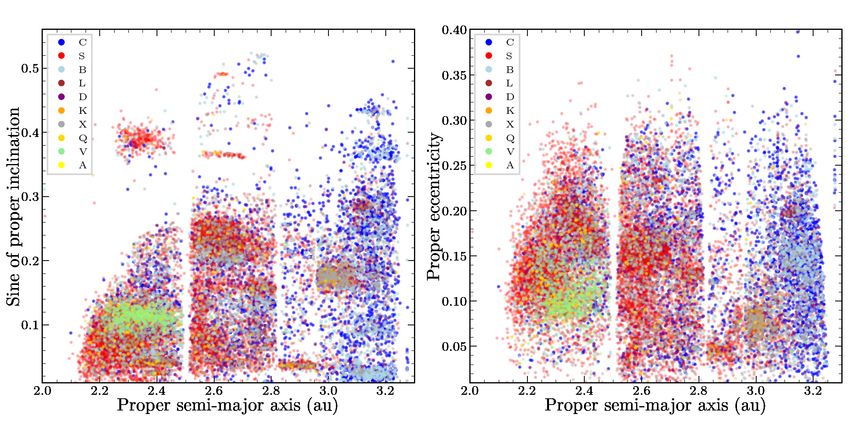
A&A 658, A109 (2022)

                                                                                    We present a typical suite of images illustrating the apparent
                  1.6           A                                                   motion of SSOs in SkyMapper frames (Fig. 2).
                                C
                  1.4
                                D
                                                                                    3. Extracting candidate SSOs
                                S
    Reflectance

                  1.2
                                V                                                   For each of the 208 860 images contained in SMSS DR3, we
                  1.0                                                               compiled all known SSOs that might be present in the images by
                                                                                    performing a search with SkyBoT (Berthier et al. 2006, 2016),
                  0.8                                                               a Virtual Observatory Web Service providing a cone-search util-
                                                                                    ity for SSOs. The 2◦ cone-search radius we used is slightly larger
                  0.6
                                                                                    than the 1.7◦ center-to-corner size of the SkyMapper camera and
                  0.4                                                               returned 43 501 635 predicted SSO locations with no initial fil-
                                                                                    tering with a magnitude limit. Of these, 16 915 791 are predicted
                          u v           g    r             i        z
                                                                                    within the field of view (FoV). The smaller number in the num-
              SM

                                                                                    ber of SSO-predicted locations is explained by the search and
                                                                                    difference in FoV area.
                                                                                          For each predicted SSO position, we extracted all sources
              SDSS

                                                                                    listed in the SMSS DR3 photometry table2 within a radius of
                          u         g         r        i        z
                                                                                    twice the SkyBoT-reported position uncertainty (with a floor of
                    0.3       0.4   0.5     0.6    0.7    0.8   0.9     1.0   1.1
                                                                                    500 ). We obtained a list of 9 367 950 SkyMapper sources that are
                                             Wavelength (µm)
                                                                                    associated with the 2 047 588 predicted SSO positions.

Fig. 1. Reflectance spectra of A, C, D, S, and V asteroid classes from
                                                                                    4. Rejecting false-positive sources
DeMeo et al. (2009) normalized at 550 nm. SkyMapper filters (trans-
mission curves for a normalized quantum efficiency of the CCD are                   The fraction of interlopers among the 9 367 950 sources
shown in SM panel) are well adapted to spectral characterization. We                extracted above is large. First, multiple SkyMapper sources may
also report SDSS filters for comparison.                                            be located by mere chance in close vicinity to predicted SSO
                                                                                    positions. Second, many SSOs are too faint to have been imaged
                                                                                    by SkyMapper, and the extracted sources correspond to spurious
2. SkyMapper survey                                                                 associations. We thus applied two filters to the extracted sources
The SkyMapper Southern Survey (SMSS) is producing a homo-                           to reject false-positive SSOs associations.
geneous multiband atlas of the whole southern hemisphere in
u, v, g, r, i, z filters (Wolf et al. 2018). Observations were carried              4.1. Comparison with Gaia
out with a 1.35 m telescope located at Siding Spring Observa-
tory (IAU code Q55). The telescope has an f/4.8 focal ratio and                     We first identify stationary sources (stars, unresolved galax-
is equipped with a mosaic CCD camera with 268 million pix-                          ies) by comparison with the catalog of sources with Gaia DR2
els. The third data release (DR3) covers an area of more than                       (Brown et al. 2018). We find 8 203 916 Gaia sources within 200
24 000 deg2 and contains over 200 000 images with over eight                        (smaller than the median SkyMapper seeing, Sect. 2) of the
billion individual source detections (see the SkyMapper website1                    extracted sources. Although this certainly includes some real
and the DR2 release article for details: Onken et al. 2019). The                    associations with observed SSOs, we removed them from the
data in DR3 were obtained between March 2014 and October                            catalog to avoid introducing biases in the measured photometry.
2019. Individual deep exposures can reach magnitudes of 20 in
u, v, z, 21 in i, and 22 in g, r (10σ detections) in the AB system                  4.2. Comparison with the expected photometry
(Oke & Gunn 1983). The median seeing ranges from 3.300 in u
to 2.500 in z.                                                                      We present in Fig. 3 a comparison of the predicted V magnitudes
     The SMSS covers each field on the sky in three pri-                            of SSOs with SkyMapper-measured magnitudes. These magni-
mary modes: a shallow six-filter sequence with exposure times                       tudes are in almost all cases the point spread function (PSF)
between 5 and 40 s that reaches depths of 18 ABmag, a deep 10-                      photometry. However, owing to the apparent motion of SSOs
image sequence of uvgruvizuv with 100-s exposures, and pairs                        during an exposure, the PSF photometry may underestimate the
of deep exposures in gr and iz. This observing strategy, in con-                    true magnitude of the observed SSO. We computed this under-
junction with the enhanced sensitivity of g, r, gives rise to a pre-                estimation as a function of exposure time and SSO apparent
dominance of g−r colors in the results presented in Sect. 6, but                    velocity. We report PSF magnitudes for most SSO observations,
almost always leads to the measurement of at least one photo-                       only reporting Petrosian magnitudes for observed SSOs with an
metric color obtained with .2 min between exposure midpoints                        apparent velocity of more than 5000 h and image exposure time
in the two filters.                                                                 of 100 s. PSF photometry was preferred over Petrosian overall
     The work presented here adopts a single photometric mea-                       because its accuracy in the case of nontrailed sources is higher.
surement associated with each SkyMapper image, although for                             Many contaminants are still present and are easily identified
objects with significant motion during the exposure, additional                     by their large magnitude difference with respect to the predicted
information about shape and rotation parameters may be avail-                       magnitudes. These contaminants correspond to SSOs that are
able from a more detailed analysis (e.g., the SkyMapper obser-                      too faint to have been detected and where erroneously associ-
vations of the Earth-impacting 2018 LA, Jenniskens et al. 2021).                    ated with stationary sources.
                                                                                    2
                                                                                       The SMSS photometry table contains the per-image measurements,
1
          See https://skymapper.anu.edu.au                                          as opposed to the averaged quantities in the master table.

A109, page 2 of 15
A. V. Sergeyev et al.: Multifilter photometry of Solar System objects from the SkyMapper Southern Survey

Fig. 2. SkyMapper multicolor observations of SSOs, here the asteroid (4365) Ivanova. The time interval between each frame and the first one
(here v) is reported above each image. North is up and east is left.

Fig. 3. Measured SkyMapper magnitude in each filter compared with        Fig. 4. Sky distribution (equatorial frame) of 880 528 SkyMapper SSO
the predicted V magnitude of SSOs (colored dots). The light gray dots    observations in each filter. The black curve represents the ecliptic
correspond to rejected sources, spuriously associated to SSOs that are   plane.
too faint to have been detected (see text).

                                                                         Table 1. Average values of the slope and magnitude offset
    As these contaminants tend to be located at large angular sep-       between SkyBoT SSOs visual magnitude and each SkyMapper band
aration from the predicted SSO position, we rejected all sources         magnitude.
farther than 500 from SkyBoT prediction (which also implies a
high SkyBoT position uncertainty). The next cleaning procedure                          Filter   Slope     Offset      #SSOs
was based on the SkyBoT and SkyMapper magnitude difference.
We compared visual magnitudes as predicted by SkyBoT with                               u        0.927    −0.776       2850
the SkyMapper sample and calculated regression slopes and off-                          v        0.937    −0.550       5302
sets for each filter, which are presented in Table 1. Then we                           g        0.976     0.133     129789
removed sources showing a difference in magnitude minus the                             r        0.973     0.571     151809
photometry magnitude error larger than 1.0 mag. A few observed                          i        0.971     0.814     125395
SSOs appear to have saturated (g,r,i filters), with magnitudes                          z        0.968     0.837      62774
.10 in shallow images or .13.8, 13.8, and 13 in deeper images,
and the latter condition removes them as well.
    Finally, whenever several SkyMapper sources remained
associated with a SSO, we selected the closest and rejected the          which is well below the typical seeing of SkyMapper images.
others. After these filtering steps, we obtained a list of 880 528       Although the mean number of observations for an individual
measurements of 205 515 individual SSOs. We present their dis-           SSO is about four, hundreds of asteroids have dozens of obser-
tribution on the sky in Fig. 4.                                          vations, while most of them were observed only once or twice:
    The mean difference between predicted and measured SSO               Fig. 6. We present the distribution of measurements of the
positions is −0.014 and −0.075 arcsec with standard deviations           dynamical classes in Table 2 and describe the catalog of mea-
of 0.15 and 0.11 arcsec for RA and Dec respectively (Fig. 5),            surements in Appendix A.
                                                                                                                          A109, page 3 of 15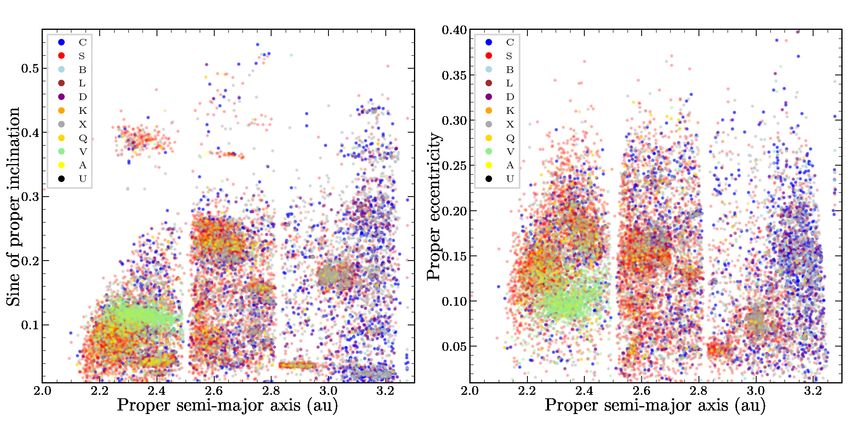
A&A 658, A109 (2022)

    1500                              2000                                                 107
                              ∆ RA                           ∆ DEC                                     SkyBoT
    1250                                                                                   106         SkyMapper
                                      1500
                                                                                                       u
    1000
                                                                                           105         v

                                                                                Fraction
     750                              1000                                                             g
                                                                                           104         r
     500                                                                                               i
                                       500                                                             z
     250                                                                                   103

        0                                0                                                 102
            −0.5       0.0      0.5            −0.5       0.0    0.5                             7.5    10.0   12.5      15.0   17.5   20.0   22.5   25.0
                     arcsec                             arcsec                                                        Visual magnitude
Fig. 5. Distribution of the coordinate difference between SkyMapper
                                                                            Fig. 7. Completeness as a function of predicted V magnitude for the
sources and predicted SkyBoT SSO positions.
                                                                            whole catalog (SkyMapper), and for each filter.

                                                                            of SSO observations predicted by SkyBoT with the number of
                                                                            sources after filtering.
                                                                                At face value (16 915 791 versus 880 528), the completeness
                                                                            is only 5%. Most nondetected SSOs, however, are simply those
                                                                            beyond the SkyMapper FoV or are too faint to be detected. Thus
                                                                            the completeness of the sources inside the CCD field of view for
                                                                            V between 11 and 18 mag is above 97%. (Fig. 7)
                                                                                We estimated the purity through a visual inspection of frames
                                                                            centered on SSO positions in both SkyMapper and Panoramic
                                                                            Survey Telescope And Rapid Response System (Pan-STARRS)
                                                                            archives. We generated cutout frames using the SkyMapper
                                                                            image cutout service3 , and downloaded Pan-STARRS cutout
                                                                            stacked images at the same coordinates (Chambers et al. 2016).
Fig. 6. SkyMapper distribution of asteroid observations.                    The Pan-STARRS survey has a significantly deeper limiting
                                                                            magnitude. Thus, all stationary SkyMapper sources should be
Table 2. Number of observations (Nobs ) of Nobj unique objects, sorted      visible in Pan-STARRS images. As the Pan-STARRS survey did
by dynamical classes.                                                       not image the sky below a declination pf −30◦ , we tested the
                                                                            purity for sources located north of this declination only.
                                                                                We inspected all available 189 Kuiper belt objects (KBO)
              Dynamical class                Nobj        Nobs
                                                                            observations, 1683 near-earth asteroids (NEA), and 1000 ran-
              NEA>Aten                     39             103               domly selected main belt asteroids (MBA) observations with a
              NEA>Apollo                  282             822               declination greater than −30 deg. The purity of the SkyMapper
              NEA>Amor                    348           1289                SSOs survey is about 100% down to magnitude V ≈ 20, where
              Mars-Crosser              2487            9807                it begins to drop (Table 3).
              Hungaria                  4035           13 803
              MBA>Inner                65 231         287 664
              MBA>Middle               71 677         301 935               6. Computation of colors
              MBA>Outer                57 721         245 664
                                                                            We built the colors of the detected SSOs for compositional (tax-
              MBA>Cybele                  811           4481
                                                                            onomic) purposes. Owing to the intrinsic photometric variability
              MBA>Hilda                   829           4298
                                                                            of asteroids caused by their irregular shape (Szabó et al. 2004;
              Trojan                    1928           10 103               Popescu et al. 2016; Carry 2018), color indices have to be cal-
              Centaur                      24             127               culated from near-simultaneous observations. We only consid-
              KBO                          37             189               ered observations taken within a maximum of 20 minutes of each
              Comet                        65             226               other. Although this threshold may appear large, it mainly affects
              Planet                        1              17               u and v filter combinations. The majority (95+%) of g–r and i–z
              Total                   205 515         880 528               colors were acquired within 2 min, and r–i colors were obtained
                                                                            in 6 min (Fig. 8).
                                                                                Szabó et al. (2004) analyzed the color variability of asteroids
                                                                            from the 4th SDSS Moving Object Catalog (MOC4). With con-
5. Purity and completeness                                                  servative assumptions, they showed that 5-min time differences
The completeness indicates the fraction of reported SSO obser-              have an effect on the color of less than 0.03 mag. Therefore the
vations with respect to how many SSOs were present in the FoV.              typical 2-min difference in our g − r and i − z data will not have
The purity indicates the fraction of contamination among the                a significant effect on the color estimation.
released observations. For both estimators, the closer to unity the
better. We estimated the completeness by comparing the number               3
                                                                                See https://skymapper.anu.edu.au/how-to-access/

A109, page 4 of 15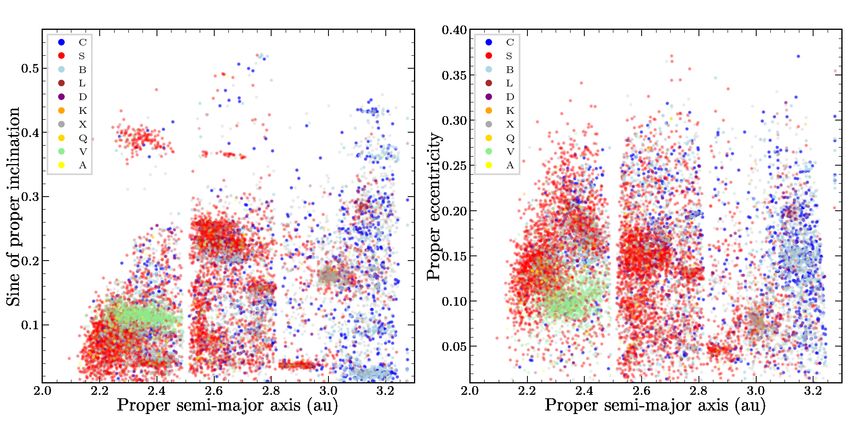
A. V. Sergeyev et al.: Multifilter photometry of Solar System objects from the SkyMapper Southern Survey
Table 3. Purity (expressed in percent) of MBAs, NEAs, and KBOs as a Table 4. Number of measured colors (Nmes ) for each pair of filters, asso-
function of their apparent V magnitude. ciated with Nobj unique SSOs.
V NMBA NNEA NKBO MBA NEA KBO Color Nmes Nobj Ncomp
(mag) (%) (%) (%)
g−r 201 910 117 356 205
10 0 0 0 – – – i−z 130 065 57 735 186
11 2 5 0 100 100 – r−i 86 518 58 626 1425
12 2 0 0 100 – – g−i 74 693 54 759 2737
13 4 23 0 100 100 – r−z 55 560 36 689 3383
14 6 5 0 100 100 – g−z 48 290 34 333 4066
15 14 23 49 100 100 100 u−v 12 028 2628 26
16 40 83 0 100 99 – v−g 9963 4316 211
17 105 247 0 100 100 – v−r 9813 4317 245
18 174 321 14 100 100 100 v−z 9461 4241 306
19 289 421 29 100 100 100 v−i 9396 4254 331
20 298 418 54 99 99 100 u−g 5620 2432 139
21 63 133 30 94 93 97 u−r 5551 2434 148
22 2 4 4 50 100 75 u−z 5363 2410 176
23 0 0 0 – – – u−i 5314 2413 199
Notes. We also list the number of sources (N) that we visually verified Total 669 545 388 943 13 783
in each magnitude bin. Notes. We also report the number of colors computed from linear com-
bination of colors (Ncomp , see text).
1.0
g-r
0.8
i-z
Cumulative fraction
1.0
g-i
0.6
SkyMapper
u-v 0.5 SDSS i-z boundaries
0.4 v-g
g-r
0.2 r-i 0.0
SDSS g-i boundaries
i-z
SDSS g-r boundaries
0.0 2.5 5.0 7.5 10.0 12.5 15.0 17.5 20.0 −0.5
Time difference (minutes) −0.50 −0.25 0.00 0.25 0.50 0.75 1.00 1.25
SDSS
Fig. 8. Cumulative histogram of the time difference between filters.
Fig. 9. g − r (blue), g − i (green), and i − z (orange) colors from the SDSS
compared with SkyMapper for a wide range of stellar classes. Red dots
represent the colors of the Sun (Holmberg et al. 2006). The colored hor-
We provide the catalog of 669 545 measured colors of izontal lines illustrate the range of colors for the SDSS asteroid taxon-
139 220 SSOs, specifying the time difference between each omy (Sergeyev & Carry 2021).
acquisition. We describe the catalog elements in Appendix A.
Some asteroid colors were measured multiple times. We
therefore calculated the weighted mean color value of individ- the latest data release from the Asteroid Lightcurve Database4 ,
ual SSOs, taking the magnitude uncertainty and the time dif- which contains periods and amplitudes of more than 30 000
ference between observations and set weights into account as known SSOs. Then we compared SkyMapper data and selected
1/magerr + 0.1/∆d, where ∆d is the time difference in days while joint asteroids. We obtained samples of more than 12 000 aster-
oids with g − r and i − z colors and almost 8000 asteroids with
q
magerr = mag12err + mag22err is the color uncertainty of two
g − i colors. For each asteroid in the samples, we calculated the
photometry measurements mag1, mag2. If the SSO had multi-
maximum expected color change arising from asteroid rotation
ple color measurements the error was computed as the weighted
between the SkyMapper imaging epochs (still limited to a 20-
mean value of the color uncertainties. We also computed
min window) as the product of the photometric amplitude and
13 783 colors that were not directly observed, but are combina-
the number of half-periods represented by the SkyMapper time
tions of measured colors: for instance, we computed r − z from
difference.
g − r and g − z.
The magnitude difference in our samples from the rotation
As a result, we constructed a catalog of 139 220 SSOs which
effect was less than the color uncertainties for 96, 97, and 87%
contain at least one measured color. The total number of unique
of asteroids in g − r, i − z, and g − i colors. We therefore consider
SSO colors is 388 943, both observed and derived (Table 4).
the overall impact of rotation on the colors we report to be small.
In order to determine the time-lag effect on the SkyMapper
asteroids colors, we estimated the dependence of the bright-
ness variability on the asteroid rotation period. We downloaded 4
See https://minplanobs.org/MPInfo/php/lcdb.php
A109, page 5 of 15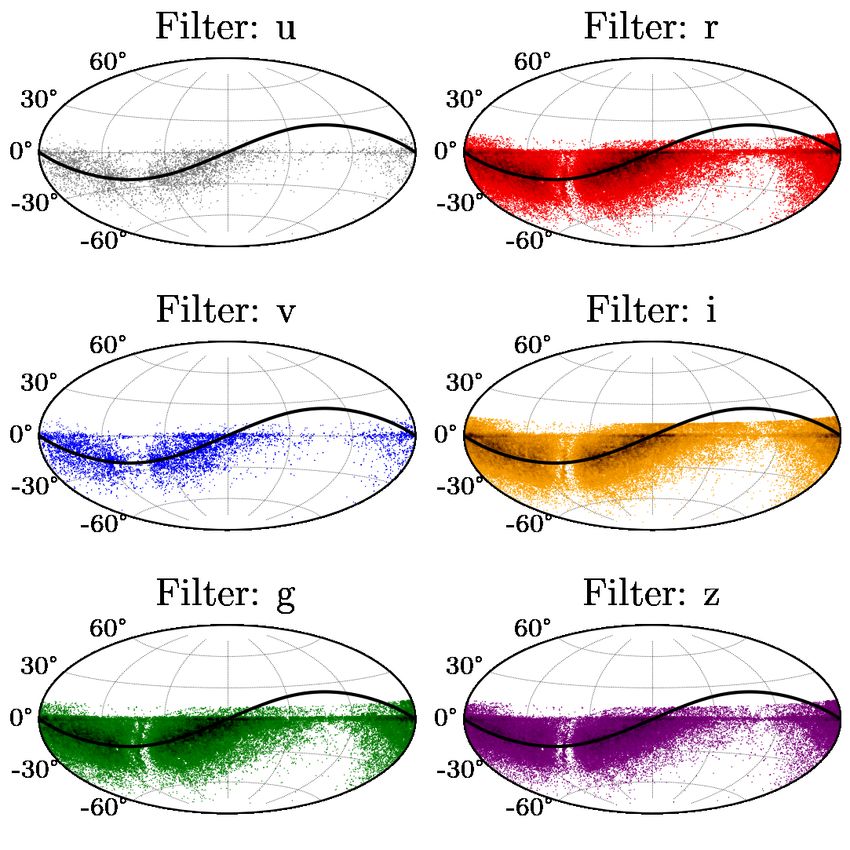
A&A 658, A109 (2022)
Fig. 10. Taxonomy of 29 779 SkyMapper asteroids with a probability higher than 0.2 with three colors. Boxes show the boundaries of the taxonomic
classes. Color points mark individual asteroids.
1.75 BusDeMeo spectra
Normalized reflectance
Bus-DeMeo std
1.50 SkyMapper S B L D
1.25 C
1.00
0.75
g r i z g r i z g r i z g r i z g r i z
1.75
Normalized reflectance
1.50 K X Q V A
1.25
1.00
0.75
0.5 0.6 0.8 0.9 0.5 0.6 0.8 0.9 0.5 0.6 0.8 0.9 0.5 0.6 0.8 0.9 0.5 0.6 0.8 0.9
Wavelength (µ) Wavelength (µ) Wavelength (µ) Wavelength (µ) Wavelength (µ)
Fig. 11. Pseudo-reflectance spectra of asteroids based on their g − r, g − i, and i − z colors. We indicate the average wavelength of each filter in the
lower plots. The distribution of values for each band is represented by whiskers (95% extrema, and the 25, 50, and 75% quartiles). For each class,
we also represent the associated template spectra of the Bus-DeMeo taxonomy (DeMeo et al. 2009).
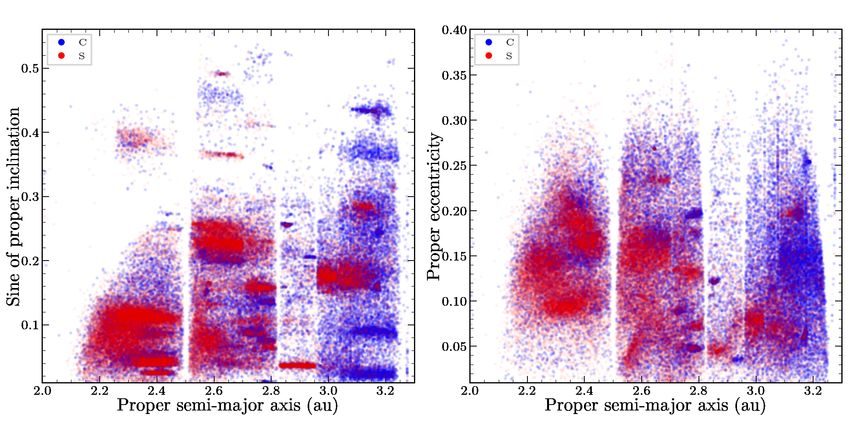
Fig. 12. Orbital distribution of the SSOs, color-coded by taxonomic class based on their g − r, g − i, and i − z colors.
A109, page 6 of 15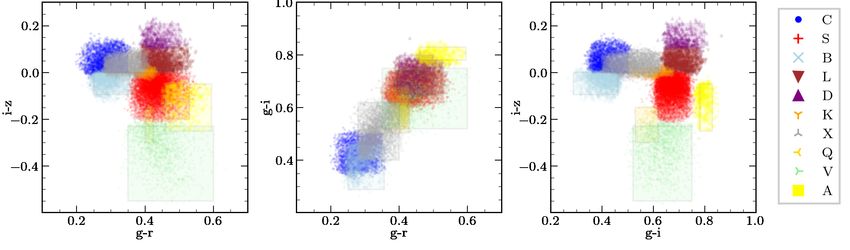
A. V. Sergeyev et al.: Multifilter photometry of Solar System objects from the SkyMapper Southern Survey
Table 5. Number of asteroids in each taxonomic complex for different
38 0 0 0 0 0 0 3 0 0 color sets.
A
0 47 27 1 0 0 0 1 0 5
B
Complex (gr, gi, iz) (gr, iz) (gi, iz) (ri, iz) (gr)
0 26 18 3 0 2 0 0 0 9 A 537 309 947 4551
C
0 0 0 30 0 0 0 0 0 B 1914 4587 2760 1317
4
D
C 2180 6175 2735 3554 40 573
Other sources
0 1 1 6 24 8 0 3 0 4 D 466 901 1544 1404
K
K 1005 1254 2661 882
6 1 1 26 14 44 0 4 1 1 L 1709 3611 1275 973
L
Q 164 633 845 532
0 0 0 0 0 0 0 0 1 0 S 8256 13 753 10 577 10 608 76 783
Q
V 1787 1125 843 1573
56 1 1 11 29 21 25 83 8 1
S
X 4876 2398 4448 5479
0 1 1 1 0 0 75 1 89 0 U 9882 4317 4664 4625
V
Total 32 776 39 063 33 299 35 498 117 356
0 22 53 21 33 21 0 3 0 80
X
A B C D K L Q S V X
SkyMapper
4 SkyMapper
Fig. 13. Confusion matrix of the taxonomy of 1697 obtained by spectra Model
asteroids and from Skymapper observations based on their g − r, g − i, Normalized fraction C1
and i − z colors. The values are reported in percent. 3
S1
7. Taxonomy 2
We used multicolor photometry to classify asteroids into a
scheme consistent with the widely used Bus-DeMeo taxonomy 1
(DeMeo et al. 2009), in which asteroid color values are used to
define a certain taxonomy complex. Following our recent work 0
0.1 0.2 0.3 0.4 0.5 0.6 0.7
with the SDSS (Sergeyev & Carry 2021), we used a modified Color, g-r
version of the approach of DeMeo & Carry (2013), in which a
decision tree based on colors is used to assign the taxonomic Fig. 14. g − r color distribution of SkyMapper asteroids (black) were fit
class. Where, for the each asteroid, we calculate the probabil- by the sum of two normal distributions (orange) that could be associated
ity of it being associated with each taxonomic broad complex with C1 (opaque-rich, blue) and S 1 (mafic-silicate rich, red) asteroid
(A, B, C, D, K, L, Q, S, V, and X). We computed the intersec- complexes.
tion between the volume occupied by each taxonomy complex
and the color(s) of the asteroid, represented as a n-dimensional
For each observation, we computed the volume it occupies
Gaussian probability density function based on color values and
in the color space (either 2D or 3D) based on the corresponding
its uncertainties. (Sergeyev & Carry 2021).
Gaussian distribution, whose σ were set to color uncertainties.
We then computed a score for each class, Pk , based on the vol-
7.1. SkyMapper taxonomy boundaries ume of the intersection between the volume of each observation
We first converted the color ranges of each taxonomic class and the space occupied by each taxonomic complex (Fig. 10),
(DeMeo & Carry 2013) from SDSS into SkyMapper filters. normalized by the volume of the Gaussian:
We used the color coefficients of Casagrande et al. (2019) and N
b j − µ j a j − µ j
Huang et al. (2019). We compared the g − r, g − i, and i − z values Y
Vσ = erf √ − erf √ , (1)
from SkyMapper with those from the SDSS for a wide range of 2σ j 2σ j
j=1
stellar classes (Fig. 9, data from Pickles 1998). We fit the color-
color dependence by linear regression using the Siegel (1982) Rz 2
approximation. These linear coefficients were used to convert the where erf(z) is the error function, erf(z) = √2π 0 e−t dt, the index
SDSS color boundaries into the SkyMapper photometric system. j indicates the colors (with N ∈ {2, 3}), a j and b j are the color
boundaries of the complexes, and µ j and σ j are the color and
7.2. Multicolor based taxonomy uncertainty of the SSO. Hence, for a given observation, the vol-
umes of all intersections sum to one. These normalized volumes
Owing to the survey strategy, not all SSOs have the same correspond to the probabilities Pk of pertaining to each taxo-
suite of colors (Table 4). We therefore adapted our approach nomic class.
(Sergeyev & Carry 2021) to handle both three-color (g − r, g − i, We then assigned to each object its most probable class. The
i − z) and two-color – (g − r,i − z), (g − i,i − z), or (r − i,i − z) only exception to this rule is the unknown class (labeled U),
cases. We restricted the list of pairs of colors to those contain- which was assigned only if its probability was strictly equal to
ing i − z: it probes the 1 µm absorption band which is one of 1. Otherwise, whenever U is the most probable but not equal
the most characteristic spectral features in asteroid taxonomies to unity, we assigned the second most-probable class. As an
(Chapman et al. 1975). We also shrank the boundaries to more example, we present in Fig. 10 the distribution in the three-
stringent ranges for the cases with two colors only. color space of 29 779 asteroids for which the probability is above
A109, page 7 of 15
A&A 658, A109 (2022)

Fig. 15. Orbital distribution of the SkyMapper SSOs, color-coded by taxonomic class based on g–r color only.

0.2 (out of 32 776 asteroids with three colors). Their pseudo-
reflectrance spectra in Fig. 11 (computed using the solar colors
of Holmberg et al. 2006, adapted to SkyMapper) agree well with
the template spectra of taxonomic classes (DeMeo et al. 2009).
    We illustrate the potential of this taxonomic classification in                          90 %                      4%
                                                                                         C

Fig. 12. The photometric classes show clear concentrations in the
orbital parameters for different asteroid families. For example,
asteroids of the Vesta family (light green points) are concentrated
                                                                             Other sources

in the inner belt, which is otherwise dominated by asteroids of S
complex (red points). C and B complexes dominate in the outer
belt region, but the Koronis family at 2.9 AU distance shows a
clear S-complex taxonomy. It is interesting to note that X-type
asteroids (indicated by gray points) are a mixture of P, M, and
E asteroid types in the Tholen classification (Tholen 1989), and                             10 %                     96 %
                                                                                         S

are concentrate in the outer belt region associated with the Eos
family.
    We tested this classification by comparing the SkyMapper
classes against previously reported taxonomy from spectroscopy
(e.g., Bus & Binzel 2002; Lazzaro et al. 2004; Binzel et al.                                   C1                       S1
2019; Fornasier et al. 2004, 2014). We found 1,683 SSOs in                                               SkyMapper
common and compare their classes in Fig. 13). As expected, rare
and peculiar classes such as A, K, L, and Q may be underes-             Fig. 16. Confusion matrix of C and S taxonomy complexes of 1129
timated here and may be misclassified as S. Similarly, there is         joint asteroids with taxonomy known from spectra and SkyMapper tax-
some confusion between C/B and C/X classes, which only differ           onomy based on g–r colors only.
by spectral slope. The values, however, are concentrated on the
diagonal of the confusion matrix, showing an overall agreement.         clearly present a bimodal distribution that is well represented
    We repeated the same exercise for each SSO with two colors          by two normal distributions (Fig. 14) corresponding to the C1
among (g − r,i − z), (g − i,i − z), or (r − i,i − z), accounting for    (bluer) and S 1 (redder) classes.
39 063, 33 299, and 35 498 SSOs, respectively. We present the                From these two normal distributions, we assigned a proba-
statistic for all these taxonomic classes in Table 5.                   bility of belonging to each complex to each asteroid. We then
                                                                        assigned to each object its most probable complex. In this way,
7.3. Single-color-based taxonomy                                        we classified 71 822 asteroids as a S 1 type and 40 590 as C1 type,
                                                                        with the exception of the 4944 asteroids whose probability did
A large number of 117 356 SSOs in SkyMapper have only one               not differ by more than 10%. The distribution of S 1 and C1 aster-
color: g − r. A detailed classification cannot be achieved, but this    oids also reproduces the known distribution of compositions in
color can still be used to split asteroids into mafic-silicate-rich     the asteroid belt (Fig. 15).
and opaque-rich objects. Similarly to the work by (Erasmus et al.            It is interesting to note that even this simplistic taxonomy
2020), we thus classified the asteroids into S-like and C-like          criterion provides a very good agreement with spectral observa-
objects (hereafter labeled S 1 and C1 ). The g−r colors of asteroids    tions (Fig. 16).

A109, page 8 of 15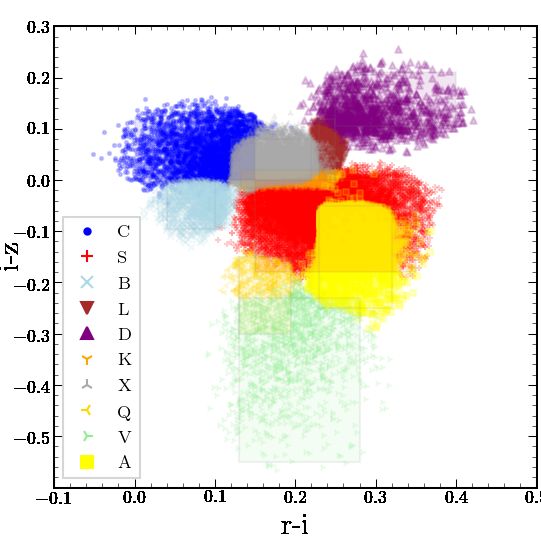
A. V. Sergeyev et al.: Multifilter photometry of Solar System objects from the SkyMapper Southern Survey

                          NEA                         Mars-Crosser                               MBA                                 KBO
          10 3
                    Astorb                                                     105
                    Spectra                 103
                    SkyMapper                                                                                     102
          102       SDSS
                                               2
                                            10                                 103
Numbers

                                                                                                                  101
          101                               101
                                                                               101
          10 0
                                            10 0                                                                  100
           1.0                               1.0                               1.0                                 1.0
 Fraction

            0.5                              0.5                               0.5                                 0.5
            0.0                              0.0                               0.0                                 0.0
                      10        20         30           10        20         30            10        20          30               10        20         30
                  Absolute magnitude (H)            Absolute magnitude (H)             Absolute magnitude (H)                 Absolute magnitude (H)

Fig. 17. Comparison of the number of SSOs with either spectra, SDSS colors, or SkyMapper colors, compared with the total number of SSO
(taken from astorb) for each of the NEA, Mars-crossers, MBA, and KBO dynamical populations.

8. Future work
                                                                                            3     1    0    0     3      10     0    32    1     2

                                                                                       A
The present catalog represents the first release of SSOs observed
by the SkyMapper Southern Survey, based on the data from its                           B    1    64    38   0     0      0      0     0    0    11
third data release (DR3). These data extend the multifilter pho-
tometry provided by the SDSS, which completed its imaging                                   0    145 137    0     1      0      0     3    0    160
                                                                                       C

survey in 2009 (although it is still used by the community, see,
                                                                                            0     0    2    36   10      33     1    29    1    42
                                                                                       D

e.g., Sergeyev & Carry 2021; Beck & Poch 2021). SkyMapper
is still operating and we plan to release observations of SSOs in                           0     1    1    0     5      1      0    20    0    19
                                                                                        K
                                                                                     SDSS

upcoming data releases. SkyMapper near-simultaneous acquisi-
tion of different filters provides instantaneous determination of                           4     0    0    9    13      53     0    104   2    22
                                                                                     L

colors, which can be used by the community even with the start
of operations of the upcoming Legacy Survey of Space and Time                               0     0    0    0     0      0      0     0    1     0
                                                                                       Q

(LSST) by the Vera C. Rubin observatory, which will require
                                                                                            37   13    7    18   72 149         7 1707 104 145
                                                                                       S

years to build the phase functions needed to determine SSO col-
ors (Jones et al. 2009; Mahlke et al. 2021).                                                2     1    1    0     0      6      6    67 388 10
                                                                                       V

     SkyMapper multifilter observations are rather unique as of
today. The observatories that submitted most data to the Minor                              0    29    74   1    10      6      0    18    2    359
                                                                                       X

Planet Center so far this year (2021) are the Catalina Sky
                                                                                            A     B    C    D     K    L   Q          S    V     X
Survey, ATLAS (Asteroid Terrestrial-impact Last Alert Sys-
                                                                                                                 SkyMapper
tem), and Pan-STARRS. While Catalina observed the most, it
only has a wide optical filter. ATLAS uses two filters and its                 Fig. 18. Confusion matrix of 6965 asteroid taxonomy from the SDSS
observing cadence allows for phase functions to be constructed                 and SkyMapper with a probability accuracy of more than 0.2
(Mahlke et al. 2021), and a single color can be used for rough
taxonomic classification (see Sect. 7.3 and Erasmus et al. 2020).
Pan-STARRS has lately contributed to most NEA discover-
ies, but has relied on g, r, i, and a wide w filter, precluding                    The catalog completeness is estimated to be about 97% down
spectral classification as the z filter probes the 1 µm band (the              to V = 18 mag, and the purity is estimated to be almost 100%
most characteristic spectral feature in all major taxonomies since             down to V = 20 mag. The present catalog contains photometry
Chapman et al. (1975).                                                         of 669 near-Earth asteroids, 2487 Mars-crossers, 196 269 MBAs,
     Finally, considering the limiting magnitude of SkyMapper,                 and 1928 Jupiter trojans.
it is unlikely that a large number of unknown SSOs may be dis-                     The SDSS observed 100 005 asteroids previously
covered in its images. We plan to proceed with the extraction of               (Sergeyev & Carry 2021). Combined, the SDSS and SkyMapper
known SSOs only in future releases.                                            data sets account for almost 80% of all MBAs with an absolute
                                                                               magnitude (H) between 10 and 16, each data set contributing
                                                                               equally. As most of the brighter asteroids (H < 10) have spectra,
9. Conclusion                                                                  the present SkyMapper release represents a major step toward
                                                                               a completeness of the taxonomic classification of asteroids in
We extracted known SSOs from SkyMapper Southern Survey                         the main belt (Fig. 17). The situation is somewhat similar for
DR3 images. We applied a suite of filters to minimize contami-                 NEAs and Mars-crossers, with a completeness above 80% of
nation. We release a catalog of 880 528 individual observations,               these two populations down to an absolute magnitude of 16,
consisting of 205 515 unique known SSOs. The catalog con-                      although spectral surveys contributed more (e.g., Perna et al.
tains the SkyMapper identification, astrometry, photometry, SSO                2018; Devogèle et al. 2019; Binzel et al. 2019). The distant
identification, geometry of observation, and taxonomy. Its con-                KBOs are the population with the lowest completeness of color
tent is fully described in Appendix A.                                         characterization, below 50% (caveat: we did not attempted to
                                                                                                                                      A109, page 9 of 15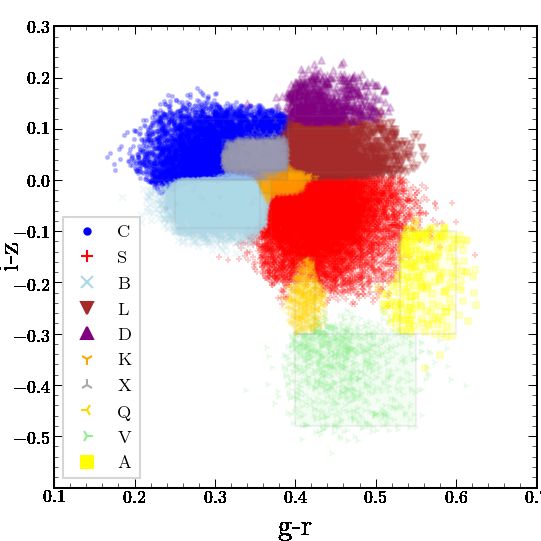
A&A 658, A109 (2022)

compile spectra of KBOs here). As SkyMapper is an ongoing                            Berthier, J., Carry, B., Vachier, F., Eggl, S., & Santerne, A. 2016, MNRAS, 458,
survey, this completeness will increase with future releases.                           3394
    We compared the taxonomy classification of 6965 asteroids                        Berthier, J., Vachier, F., Thuillot, W., et al. 2006, Astronomical Data Analysis
                                                                                        Software and Systems XV, C. Gabriel, C. Arviset, D. Ponz, & S. Enrique,
in common with the recent SDSS release (Sergeyev & Carry                                ASP Conf. Ser., 458, 3394
2021) and the present SkyMapper catalog, considering only                            Binzel, R. P., DeMeo, F. E., Turtelboom, E. V., et al. 2019, Icarus, 324, 41
SSOs with a taxomony based on three colors and a probabil-                           Brown, A. G. A., Vallenari, A., Prusti, T., et al. 2018, A&A, 616, A1
ity above 0.2. The confusion matrix presented in Fig. 18 shows                       Bus, S. J., & Binzel, R. P. 2002, Icarus, 158, 146
                                                                                     Carry, B. 2018, A&A, 609, A113
a good agreement for the most common complexes such as S,                            Carvano, J. M., Hasselmann, P. H., Lazzaro, D., & Mothé-Diniz, T. 2010, A&A,
C, B, and V. Some confusion is present between less prominent                           510, A43
classes, in particular, between K, L, A and S. This highlights the                   Casagrande, L., Wolf, C., Mackey, A. D., et al. 2019, MNRAS, 482, 2770
strength and the limitation of taxonomic classification based on                     Chambers, K.C., Magnier, E.A., Metcalfe, N., et al. 2016, ArXiv e-prints
broadband colors alone.                                                                 [arXiv:1612.05560]
                                                                                     Chapman, C. R., Morrison, D., & Zellner, B. H. 1975, Icarus, 25, 104
                                                                                     Clement, M. S., Morbidelli, A., Raymond, S. N., & Kaib, N. A. 2020, MNRAS,
Acknowledgements. This research has been conducted within the NEOROCKS
                                                                                        492, L56
project, which has received funding from the European Union’s Horizon 2020
                                                                                     DeMeo, F. E., & Carry, B. 2013, Icarus, 226, 723
research and innovation programme under grant agreement No. 870403. CAO
                                                                                     DeMeo, F., & Carry, B. 2014, Nature, 505, 629
was supported by the Australian Research Council (ARC) through Discovery
                                                                                     DeMeo, F., Binzel, R. P., Slivan, S. M., & Bus, S. J. 2009, Icarus, 202, 160
Project DP190100252. SWC acknowledges support from the National Research
                                                                                     DeMeo, F., Binzel, R. P., Carry, B., Polishook, D., & Moskovitz, N. A. 2014,
Foundation of Korea (NRF) grant, No.2020R1A2C3011091, funded by the
                                                                                        Icarus, 229, 392
Korea government (MSIT). We thank J. Berthier, F. Spoto, M. Mahlke for discus-
                                                                                     DeMeo, F. E., Polishook, D., Carry, B., et al. 2019, Icarus, 322, 13
sions related to the present article. The national facility capability for SkyMap-
                                                                                     Devogèle, M., Moskovitz, N., Thirouin, A., et al. 2019, AJ, 158, 196
per has been funded through ARC LIEF grant LE130100104 from the Australian
                                                                                     Erasmus, N., Navarro-Meza, S., McNeill, A., et al. 2020, ApJS, 247, 13
Research Council, awarded to the University of Sydney, the Australian National
                                                                                     Fornasier, S., Dotto, E., Marzari, F., et al. 2004, Icarus, 172, 221
University, Swinburne University of Technology, the University of Queensland,
                                                                                     Fornasier, S., Lantz, C., Barucci, M. A., & Lazzarin, M. 2014, Icarus, 233, 163
the University of Western Australia, the University of Melbourne, Curtin Univer-
                                                                                     Giorgini, J. D., Yeomans, D. K., Chamberlin, A. B., et al. 1996, AAS/Div. Planet.
sity of Technology, Monash University and the Australian Astronomical Obser-
                                                                                        Sci. Meeting Abstracts, 28, 25.04
vatory. SkyMapper is owned and operated by The Australian National Uni-
                                                                                     Graves, K., Minton, D., Hirabayashi, M., DeMeo, F., & Carry, B. 2018, Icarus,
versity’s Research School of Astronomy and Astrophysics. The survey data
                                                                                        304, 162
were processed and provided by the SkyMapper Team at ANU. The SkyMap-
                                                                                     Holmberg, J., Flynn, C., & Portinari, L. 2006, MNRAS, 367, 449
per node of the All-Sky Virtual Observatory (ASVO) is hosted at the National
                                                                                     Huang, Y., Chen, B. Q., Yuan, H. B., et al. 2019, ApJS, 243, 7
Computational Infrastructure (NCI). Development and support of the SkyMap-
                                                                                     Ivezić, Ž., Tabachnik, S., Rafikov, R., et al. 2001, AJ, 122, 2749
per node of the ASVO has been funded in part by Astronomy Australia Lim-
                                                                                     Jenniskens, P., Gabadirwe, M., Yin, Q.-Z., et al. 2021, Meteorit. Planet. Sci., 56,
ited (AAL) and the Australian Government through the Commonwealth’s Edu-
                                                                                        844
cation Investment Fund (EIF) and National Collaborative Research Infrastruc-
                                                                                     Jones, R. L., Chesley, S. R., Connolly, A. J., et al. 2009, Earth Moon Planets,
ture Strategy (NCRIS), particularly the National eResearch Collaboration Tools
                                                                                        105, 101
and Resources (NeCTAR) and the Australian National Data Service Projects
                                                                                     Lazzaro, D., Angeli, C. A., Carvano, J. M., et al. 2004, Icarus, 172, 179
(ANDS). The Pan-STARRS1 Surveys (PS1) and the PS1 public science archive
                                                                                     Levison, H. F., Bottke, W. F., Gounelle, M., et al. 2009, Nature, 460, 364
have been made possible through contributions by the Institute for Astronomy,
                                                                                     Mahlke, M., Carry, B., & Denneau, L. 2021, Icarus, 354
the University of Hawaii, the Pan-STARRS Project Office, the Max-Planck Soci-
                                                                                     Morbidelli, A., Walsh, K. J., O’Brien, D. P., Minton, D. A., & Bottke, W. F. 2015,
ety and its participating institutes, the Max Planck Institute for Astronomy, Hei-
                                                                                        The Dynamical Evolution of the Asteroid Belt, 493
delberg and the Max Planck Institute for Extraterrestrial Physics, Garching, The
                                                                                     Nesvorný, D., Jedicke, R., Whiteley, R. J., & Ivezić, Ž. 2005, Icarus, 173, 132
Johns Hopkins University, Durham University, the University of Edinburgh, the
                                                                                     Oke, J. B., & Gunn, J. E. 1983, ApJ, 266, 713
Queen’s University Belfast, the Harvard-Smithsonian Center for Astrophysics,
                                                                                     Onken, C. A., Wolf, C., Bessell, M. S., et al. 2019, PASA, 36
the Las Cumbres Observatory Global Telescope Network Incorporated, the
                                                                                     Parker, A., Ivezić, Ž., Jurić, M., et al. 2008, Icarus, 198, 138
National Central University of Taiwan, the Space Telescope Science Institute, the
                                                                                     Perna, D., Barucci, M. A., Fulchignoni, M., et al. 2018, Planet Space Sci., 157,
National Aeronautics and Space Administration under Grant No. NNX08AR22G
                                                                                        82
issued through the Planetary Science Division of the NASA Science Mission
                                                                                     Pickles, A. J. 1998, PASP, 110, 863
Directorate, the National Science Foundation Grant No. AST-1238877, the Uni-
                                                                                     Pineau, F. X., Derriere, S., Motch, C., et al. 2017, A&A, 597, A89
versity of Maryland, Eotvos Lorand University (ELTE), the Los Alamos National
                                                                                     Popescu, M., Licandro, J., Morate, D., et al. 2016, A&A, 591, A115
Laboratory, and the Gordon and Betty Moore Foundation. This research made
                                                                                     Rodrigo, C., Solano, E., Bayo, A., & Rodrigo, C. 2012, SVO Filter Profile
use of the cross-match service provided by CDS, Strasbourg (Pineau et al. 2017),
                                                                                        Service Version 1.0, Tech. rep.
the IMCCE’s SkyBoTand Skybot3D VO tools (Berthier et al. 2006, 2016), the
                                                                                     Sergeyev, A. V., & Carry, B. 2021, A&A, 652, A59
JPL Horizons system (Giorgini et al. 1996), the SVO Filter Profile Service
                                                                                     Siegel, A. F. 1982, Biometrika, 69, 242
(http://svo2.cab.inta-csic.es/theory/fps/) supported from the Span-
                                                                                     Szabó, G. M., Ivezić, Ž., Jurić, M., Lupton, R., & Kiss, L. L. 2004, MNRAS,
ish MINECO through grant AYA2017-84089 (Rodrigo et al. 2012), and TOP-
                                                                                        348, 987
CAT/STILTS (Taylor 2005). Thanks to the developers.
                                                                                     Taylor, M. B. 2005, Astronomical Data Analysis Software and Systems XIV, P.
                                                                                        Shopbell, M. Britton, & R. Ebert, ASP Conf. Ser., 347, 29
References                                                                           Tholen, D. J. 1989, Asteroids II, R. P. Binzel, T. Gehrels, & M. S. Matthews,
                                                                                        1139
Beck, P., & Poch, O. 2021, Icarus, 365                                               Wolf, C., Onken, C. A., Luvaul, L. C., et al. 2018, PASA, 35, 10

A109, page 10 of 15
A. V. Sergeyev et al.: Multifilter photometry of Solar System objects from the SkyMapper Southern Survey
Appendix A: Description of catalogs Table A.3. Description of the catalog of measured weighted mean SSO
colors.
We describe here the three catalogs of SSOs we release. The
detection catalog (Table A.1) contains all the information for
ID Name Unit Description
each observation. (mid-observing time, coordinates, etc.). The
color catalog contains all the measured SSO colors (Table A.2), 1 number SSO IAU number
while the object catalog (Table A.3) contains a single entry per 2 name SSO IAU designation
SSOs, with its average colors. 4 color Name of color (e.g., g − r)
5 wdmag mag Weighted value of the color
Table A.4 contains the estimated taxonomy and orbital ele-
6 var mag Weighted uncertainty of the color measurements
ments of asteroids. The most probable taxonomy depends on the 7 n Number of color measurements, 0 - computed
color priority in the follow sequence: g − r, g − i, i − z colors have 6 emag mag Mean value of the color uncertainties
the first priority, two colors (g − r, i − z), (g − i, i − z), (r − i, i − z) 7 dmjd day Mean time difference between color measurements
have the priority 2, 3, and 4, and consequently g − r, have the
color priority 5.
Table A.4. Description of individual SkyMapper SSO color catalog
Table A.1. Description of the SkyMapper catalog of SSO observations. (measured and computed) and their taxonomy.
ID Name Unit Description ID Name Unit Description
1 source Source unique identifier 1 number SSO IAU number
2 frame Image unique identifier 2 name SSO IAU designation
3 JD day Julian Date of observation 3 dynclass SSO dynamic class
4 filter Filter name (u, v, g, r, i, z) 4-18 m[∗ color list] mag Set of the color magnitude
5 exptime s Exposure time values
6 ra deg J2000 Right Ascension 19-33 e[∗ color list] mag Set of the color uncertainties
7 dec deg J2000 Declination 34-48 d[∗ color list] day sSet of time values between
8 psfMag mag PSF magnitude observations
9 psfMagErr mag PSF magnitude uncertainty 49-59 p[C, S, B, L, Probability of the complex
10 petroMag mag Petrosian magnitude D, K, X, Q, values
11 petroMagErr mag Petrosian magnitude uncertainty V, A, U]
12 number SSO IAU number 60 complex Most probably complex
13 name SSO IAU designation 61 pcomplex Probability value of the com-
14 dynclass SSO dynamical class plex
00
15 ra_rate /h RAcos(DEC) rate of motion 62 complex1 First the most probably com-
00
16 dec_rate /h DEC rate plex
17 V mag Predicted visual magnitude 63 complex2 Second the most probably
complex
64 pcomplex1 Probability value of first the
most probably complex
Table A.2. Description of the color catalog extracted from all 65 pcomplex2 Probability value of second
SkyMapper SSO observations. the most probably complex
66 nc The taxonomy priority num-
ber based on used colors (see
ID Name Unit Description
description in Appendix A)
1 number SSO IAU number
∗
2 name SSO IAU designation color list: u-v,u-g,u-r,u-i,u-z,v-g,v-r,v-i,v-z,g-r,g-i,i-z,g-z,r-i,r-z
3 JD day Average epoch of observation
4 color Name of color (e.g., g − r)
5 dmag mag Value of the color
6 edmag mag Uncertainty on the color
7 dmjd day Delay between filters
A109, page 11 of 15A&A 658, A109 (2022)
Appendix B: Multi-color taxonomy
We present here the color distribution, pseudo-reflectance, confusion matrix, orbital distribution, and taxonomy boundaries of aster-
oids with two colors.
1.75 BusDeMeo spectra
Normalized reflectance
Bus-DeMeo std
1.50 SkyMapper S B L D
1.25 C
1.00
0.75
g r i z g r i z g r i z g r i z g r i z
1.75
Normalized reflectance
1.50 K X Q V A
1.25
1.00
0.75
0.5 0.6 0.8 0.9 0.5 0.6 0.8 0.9 0.5 0.6 0.8 0.9 0.5 0.6 0.8 0.9 0.5 0.6 0.8 0.9
Wavelength (µ) Wavelength (µ) Wavelength (µ) Wavelength (µ) Wavelength (µ)
Fig. B.1. Grouped by taxonomic class pseudo-reflectance spectra of asteroids based on two-color taxonomy. Top: g − r, i − z colors, middle: g − i,
i − z colors, and bottom: r − i, i − z colors. We indicate the average wavelength of each filter in the lower plots. The distribution of values for each
band is represented by whiskers (95% extrema, and the 25, 50, and 75% quartiles). For each, we also represent the associated template spectra of
the Bus-DeMeo taxonomy (DeMeo et al. 2009).
A109, page 12 of 15A. V. Sergeyev et al.: Multifilter photometry of Solar System objects from the SkyMapper Southern Survey
4 0 0 0 0 0 0 0 3 0
A
0 47 33 4 6 0 0 4 0 11
B
0 45 50 25 3 8 0 1 0 38
C
0 0 0 21 0 4 0 0 0 0
D
Other sources
4 1 1 7 34 8 0 2 0 6
K
14 1 1 20 12 57 0 6 1 3
L
0 0 0 0 0 0 40 0 8 0
Q
79 4 2 9 34 20 60 86 14 3
S
0 0 0 0 0 0 0 0 73 0
V
0 1 12 13 9 4 0 1 0 39
X
A B C D K L Q S V X
SkyMapper, (g-r vs. i-z)
26 0 0 0 0 0 0 4 2 0
A
0 52 31 1 0 0 14 1 0 5
B
C 0 30 28 0 0 0 0 0 0 15
4 0 2 49 0 11 0 1 0 1
D
Other sources
0 1 3 9 43 11 0 8 0 13
K
9 0 0 14 4 44 0 3 2 1
L
0 1 0 0 0 0 43 1 17 0
Q
57 7 4 9 39 13 29 79 8 4
S
0 0 1 1 0 0 14 0 71 0
V
4 8 31 18 14 20 0 3 0 61
X
A B C D K L Q S V X
SkyMapper, (g-i vs. i-z)
39 2 1 1 9 6 11 33 1 1
A
0 25 7 1 0 0 11 1 0 1
B
0 23 16 2 0 3 0 1 0 9
C
0 0 1 51 3 6 0 0 0 1
D
Other sources
0 2 11 8 18 8 0 3 0 6
K
0 2 0 15 12 36 0 1 0 5
L
0 0 0 0 0 0 22 0 7 0
Q
52 18 14 9 42 17 22 55 5 9
S
0 1 0 0 0 0 33 1 85 0
V
10 25 49 13 15 25 0 4 1 69
X
A B C D K L Q S V X
SkyMapper, (r-i vs. i-z)
Fig. B.2. Taxonomy of SkyMapper asteroids with a probability value Fig. B.3. Confusion matrices of asteroids taxonomy based on (top: g−r,
more than 0.2 with two (top: g − r, i − z, middle: g − i, i − z, and bottom: i−z, middle: g−i, i−z, and bottom: r−i, i−z) SkyMapper color opposite
r − i, i − z) colors. Boxes show the boundaries of the taxonomic classes. taxonomy from published spectral observations. The values are reported
Color points mark an individual asteroid. in percent.
A109, page 13 of 15A&A 658, A109 (2022) Fig. B.4. Orbital distribution of the SkyMapper SSOs, color-coded by taxonomic class based on their (top: g − r, i − z, middle: g − i, i − z, and bottom: r − i, i − z) colors. A109, page 14 of 15
A. V. Sergeyev et al.: Multifilter photometry of Solar System objects from the SkyMapper Southern Survey

Table B.1. Boundaries of taxonomy complexes in g-r, g-i, i-z color      Table B.3. Boundaries of taxonomy complexes in g-i, i-z color space.
space.
                                                                                  complex      gimin    gimax      izmin      izmax
      complex grmin grmax           izmin   izmax    gimin gimax
                                                                                      C        0.360    0.500     0.000        0.120
         C        0.220    0.350    0.000    0.120   0.360     0.50                   S        0.520    0.720    -0.200       0.000
         S        0.370    0.530   -0.200   0.000    0.620     0.73                   B        0.288    0.460    -0.094        0.001
         B        0.250    0.356   -0.094    0.001   0.288     0.46                   L        0.640    0.740     0.005        0.120
         L        0.391    0.527    0.015    0.120   0.650     0.78                   D        0.580    0.780    0.105        0.210
         D        0.400    0.500   0.105    0.210    0.650     0.80                   K        0.503    0.680    -0.025       0.050
         K        0.370    0.430   -0.015   0.020    0.503     0.68                   X        0.417    0.658    0.020        0.080
         X        0.280    0.400   0.000    0.080    0.400     0.62                   Q        0.530    0.620    -0.300       -0.150
         Q        0.400    0.425   -0.300   -0.150   0.530     0.62                   V        0.600    0.750    -0.550       -0.300
         V        0.350    0.600   -0.550   -0.230   0.520     0.75                   A        0.780    0.830    -0.250       -0.050
         A        0.459    0.595   -0.250   -0.050   0.780     0.83

                                                                        Table B.4. Boundaries of taxonomy complexes in r-i, i-z color space.
Table B.2. Boundaries of taxonomy complexes in g-r, i-z color space.
                                                                                  complex      rimin     rimax     izmin      izmax
          complex         grmin    grmax     izmin     izmax
                                                                                      C        0.000    0.150     0.000        0.120
              C        0.220       0.391     0.000     0.120                          S        0.150    0.350    -0.180       0.000
              S        0.370       0.530    -0.200    0.000                           B        0.040    0.100    -0.095        0.001
              B        0.250       0.356    -0.094     0.001                          L        0.230    0.250     0.000        0.120
              L        0.391       0.527     0.015     0.100                          D        0.250    0.400    0.105        0.210
              D        0.400       0.500    0.125     0.190                           K        0.133    0.250    -0.015       0.020
              K        0.356       0.411    -0.025    0.020                           X        0.120    0.220    0.000        0.080
              X        0.309       0.391    0.020     0.080                           Q        0.130    0.195    -0.300       -0.150
              Q        0.400       0.425    -0.300    -0.150                          V        0.130    0.280    -0.550       -0.230
              V        0.400       0.550    -0.480    -0.300                          A        0.230    0.320    -0.250       -0.050
              A        0.530       0.600    -0.300    -0.100

                                                                                                                           A109, page 15 of 15
You can also read