Optimal Transport based Data Augmentation for Heart Disease Diagnosis and Prediction - arXiv
←
→
Page content transcription
If your browser does not render page correctly, please read the page content below
Optimal Transport based Data Augmentation for Heart Disease
                                                                      Diagnosis and Prediction
                                                              Jielin Qiu∗1 , Jiacheng Zhu∗2 , Michael Rosenberg3 , Emerson Liu4 , and Ding Zhao2

                                              Abstract— In this paper, we focus on a new method of data                 the perturbations in rhythm, generally localize the site of
                                           augmentation to solve the data imbalance problem within im-                  the perturbation anatomically, and make predictions of the
                                           balanced ECG datasets to improve the robustness and accuracy                 future cardiac events based on current findings. The computer
                                           of heart disease detection. By using Optimal Transport, we
                                           augment the ECG disease data from normal ECG beats to                        reads at the present time do an excellent job of the first
                                           balance the data among different categories. We build a Multi-               two items – picking out the PQRST elements and measuring
arXiv:2202.00567v1 [eess.SP] 25 Jan 2022

                                           Feature Transformer (MF-Transformer) as our classification                   their duration and intervals – and are reasonably successful
                                           model, where different features are extracted from both time                 in diagnosing the more apparent conditions, but largely fail
                                           and frequency domains to diagnose various heart conditions.                  beyond that.
                                           Learning from 12-lead ECG signals, our model is able to
                                           distinguish five categories of cardiac conditions. Our results                  With the development of machine learning and deep
                                           demonstrate 1) the classification models’ ability to make com-               learning methods, it may be possible to identify additional
                                           petitive predictions on five ECG categories; 2) improvements                 previously unrecognized signatures of disease. Many models
                                           in accuracy and robustness reflecting the effectiveness of our               have been applied on diagnosing physiological signals, i.e.,
                                           data augmentation method.                                                    EEG, ECG, EMG, etc [1]–[3]. One of the main issues is
                                                                                                                        that organizing physiological datasets is extremely difficult,
                                                                  I. INTRODUCTION
                                                                                                                        which is constrained by domain knowledge, time, and pri-
                                              The 12-lead Electrocardiogram (ECG) is the foundation                     vacy regulations. There are not so many publicly available
                                           for much of cardiology and electrophysiology. It provides                    ECG datasets, and the available data is limited by specific
                                           unique information about the structure and electrical activity               diseases categories, making it even harder to apply a complex
                                           of the heart and also systemic conditions, through changes                   classification model to learn the patterns, as it requires lots of
                                           in timing and morphology of the recorded waveforms.                          labeled training samples. Another problem is that the ECG
                                           Computer generated interpretations are standardly provided                   data is mostly imbalanced, where the number of labeled
                                           following ECG acquisition, utilizing predefined rules and                    ECG signals for a certain condition is very small, so the
                                           algorithmic pattern recognition. However, current approaches                 training samples contains many healthy ECG signals, making
                                           miss a lot of the specialized insights and nuances that prac-                it difficult to classify the ECG signals with diseases due to
                                           ticed cardiologists/electrophysiologists can see. Depending                  the introduced imbalance in the original data.
                                           on experience, physician reads can also be variable and                         In this paper, we proposed a new data augmentation
                                           inconsistent. Achievement of reliable ECG reading would                      method based on Optimal Transport (OT) to solve the data
                                           be a significant achievement, akin to reliable autonomous                    imbalance issue within the ECG signals. We augmented
                                           vehicles, not least with respect to safety, such that critical               ECG disease categories, where the number of available data
                                           and timely ECG interpretations of acute cardiac conditions                   is small, from the healthy signals. We build the Multi-
                                           can lead to efficient and cost-effective intervention.                       Feature Transformer model as our classifier to evaluate the
                                              A complete ECG analysis would consist of being able                       performance of our proposed method.
                                           to identify the separate waveforms and their relationships,
                                           measure out the intervals between the waveforms represent-                                      II. RELATED WORK
                                           ing specific electrical events in different areas of the heart,                 Traditionally, when facing an imbalanced data problem,
                                           diagnose those conditions leading to the abnormalities noted                 data augmentation is required before training, aiming to
                                           on ECGs, understand the biology/physiology responsible for                   eliminate the effect caused by the imbalance. Traditional
                                                                                                                        methods include sampling, cost-sensitive methods, kernel-
                                           *Equal contribution                                                          based methods, active learning methods, and one-class learn-
                                           1 Jielin Qiu is with the Computer Science Department, Carnegie
                                           Mellon University, 5000 Forbes Ave, Pittsburgh, PA 15213 USA
                                                                                                                        ing or novelty detection methods [4]. Among them, sampling
                                           jielinq@andrew.cmu.edu                                                       methods are mostly used, including random oversampling
                                           2 Jiacheng Zhu and Ding Zhao are with the Department of Mechanical           and undersampling, informed undersampling, synthetic sam-
                                           Engineering, Carnegie Mellon University, 5000 Forbes Ave, Pittsburgh, PA     pling with data generation, adaptive synthetic sampling, sam-
                                           15213 USA jzhu4@andrew.cmu.edu, dingzhao@cmu.edu
                                           3 Michael Rosenberg is with the School of Medicine, University of Colorado   pling with data cleaning techniques, cluster-based sampling
                                           Anschutz Medical Campus, 13001 E 17th Avenue, E5315, Aurora, CO              method, and integration of sampling and boosting. But tra-
                                           80045 USA michael.a.rosenberg@cuanschutz.edu                                 ditional methods may introduce their own set of problematic
                                           4 Emerson Liu is with the Allegheny General Hospital, Allegheny
                                           Health Network, 320 E North Ave CVI II, Pittsburgh, PA 15212 USA             consequences that can potentially hinder learning [5]–[7],
                                           emersonliu@msn.com                                                           which can cause the classifier to miss important concepts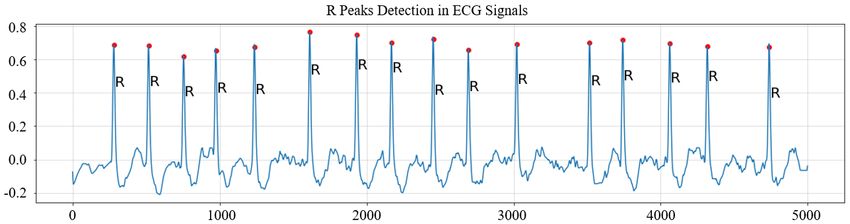
pertaining to the majority class, or lead to overfitting [4], [6],                         III. METHODS
making the classification performance on the unseen testing          A. Overall Pipeline
data generally far worse.
                                                                        The overall pipeline of our method is shown in Fig. 1.
   The ECG data imbalance issue has been a long-standing
                                                                     Given the raw ECG data, we first use Optimal Transport
problem. Martin et al. tried to use oversampling method
                                                                     to augment the data of minority categories to solve the
to augment the imbalanced data [8]. Virgeniya et al. [9]
                                                                     data imbalance issue. Then we perform pre-processing on
also addressed the ECG data imbalance problem, where
                                                                     the raw ECG data as well as the augmented data, which
instead of using synthetic models such as synthetic mi-
                                                                     includes data denoising, ECG temporal segmentation, and
nority oversampling technique (SMOTE), SMOTEBoost, or
                                                                     feature extraction. We extract multiple ECG features from
DataBoostIM, they tried to feed the data into the adaptive
                                                                     both the time domain and frequency domain. Then we use the
synthetic (ADASYN) [10] based sampling model, which
                                                                     MF-Transformer as our classification model for performance
utilized a weighted distribution for different minority class
                                                                     prediction and evaluation. The details of each part are
samples depending upon the learning stages of difficulty.
                                                                     introduced in Section III-B, Section III-C, and Section IV
Liu et al. [11] augmented the ECG data by using band-
                                                                     respectively.
pass filter, noise addition, time-frequency transform and data
selection. The methods above showed that balanced dataset
performance is superior than unbalanced one.
   Optimal Transport (OT) is a field of mathematics that
studies the geometry of probability spaces [12]. The the-
oretical importance of OT is that it defines the Wasser-
stein metric between probability distributions. It reveals a
canonical geometric structure with rich properties to be
exploited. The earliest contribution to OT originated from
Monge in the eighteenth century. Kantorovich rediscovered it
under a different formalism, namely the Linear Programming
formulation of OT. With the development of scalable solvers,
OT is widely applied to many real-world problems [13], [14].                Fig. 1: The overall pipeline of the framework.
   With the development in machine learning, many models
have been applied to ECG disease detection [15]–[20]. Al-
Zaiti et al. predicted acute myocardial ischemia in patients         B. Multi-Feature Transformer
with chest pain with a fusion voting method [21]. Acharya et            For the classification model, we take advantage of the
al. proposed a nine-layer deep convolutional neural network          transformer encoder [28], and proposed a Multi-Feature
(CNN) to classify heartbeats in the MIT-BIH Arrhythmia               Transformer (MF-Transformer) model. The transformer is
database [22], [23]. Shanmugam et al. estimate a patient’s           based on the attention mechanism [28] and outperforms
risk of cardiovascular death after an acute coronary syndrome        previous models in accuracy and performance. The original
by a multiple instance learning framework [2]. Recently,             transformer model is composed of an encoder and a decoder.
Smigiel et al. proposed models based on SincNet [24]                 The encoder maps an input sequence into a latent represen-
and used entropy-based features for cardiovascular diseases          tation, and the decoder uses the representation along with
classification [25].                                                 other inputs to generate a target sequence. Our model is
   ECG signal can be considered as one type of sequential            mostly based on the encoder, since we aim at learning the
data, and Seq2seq models [26] are widely used in time                representations of ECG features, instead of decoding it to
series tasks. Since the attention mechanism was proposed             another sequence.
[27], the Seq2seq model with attention has been improved in             The input for the Multi-Feature Transformer is composed
various tasks, which outperformed previous methods. Then             of three parts, including ECG raw features, time-domain
Transformer model [28] was proposed to solve the problem             features, and frequency domain features. The detailed feature
in the Seq2Seq model, replacing Long Short-Term Memory               pre-processing steps are introduced in Section IV. First, we
(LSTM) models with an attention structure, which achieved            feed out the input into an embedding layer, which is a learned
better results in translation tasks. The transformer model           vector representation of each ECG feature by mapping each
has also recently been adopted in several ECG applica-               ECG feature to a vector with continuous values. Then we
tions, i.e., arrhythmia classification, abnormalities detection,     inject positional information into the embeddings by:
stress detection, etc [29]–[34]. But those models take only
                                                                                 P E(pos,2i) = sin pos/100002i/dmodel
ECG temporal features as input and haven’t considered the                                                                      (1)
frequency domain features. To take advantage of multiple                       P E(pos,2i+1) = cos pos/100002i/dmodel
features across time and frequency domains, we proposed
a Multi-Feature Transformer as our classification model to           The attention model contains two sub-modules, a multi-
predict the heart diseases with 12-lead ECG signals.                 headed attention model and a fully connected network.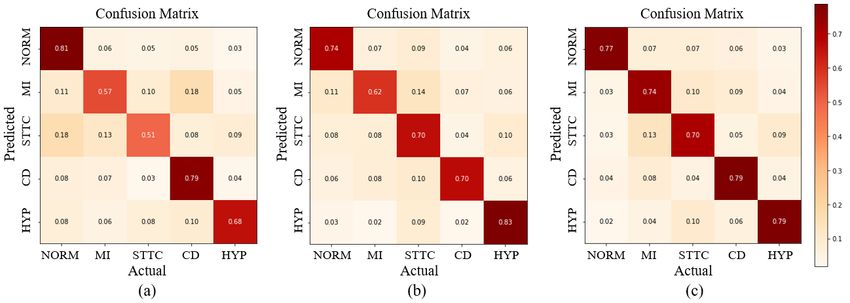
Fig. 2: The architecture of the Multi-Feature Transformer model.

The multi-headed attention computes the attention weights              C. Optimal Transport Based Data Augmentation
for the input and produces an output vector with encoded
                                                                          We use optimal transport to push forward samples from the
information on how each feature should attend to all other
                                                                       distribution of a majority class to a minority class. We expect
features in the sequence. There are residual connections
                                                                       optimal transport to exploit global geometric information
around each of the two sub-layers followed by a layer nor-
                                                                       so that the synthetic samples match the real samples. In
malization, where the residual connection means adding the
                                                                       specific, we denote the data from a majority class to be
multi-headed attention output vector to the original positional
                                                                       Xs = {xs,1 , ..., xs,ns } ∈ Ωs and the minority class data
input embedding, which helps the network train by allowing
                                                                       to be Xt = {xt,1 , ..., xt,nt } ∈ Ωt . We assume that they are
gradients to flow through the networks directly. Multi-headed
                                                                       subject to distributions Xs ∼ µs and Xt ∼ νt , respectively,
attention applies a self-attention mechanism, where the input
                                                                       and we associate empirical measures to data samples:
goes into three distinct fully connected layers to create the
query, key, and value vectors. The output of the residual                                 ns
                                                                                          X                          nt
                                                                                                                     X
connection goes through a layer normalization.                                    µˆs =         ps,i δxs,i , νˆt =         pt,i δxt,i ,    (8)
   In our model, our attention model contains N = 5 same                                  i=1                        i=1

layers, and each layer contains two sub-layers, which are a            where δx is the Dirac function at location x and pi are the
multi-head self-attention model and a fully connected feed-            probabilities masses associated to the samples. Solving the
forward network. Residual connection and normalization are             optimal transport objective give us the coupling:
added in each sub-layer. So the output of the sub-layer can
                                                                                                      nt
                                                                                                   ns X
be expressed as:                                                                  ∗
                                                                                                   X
                                                                                π = arg min                   πi,j Ci,j + γH(π),           (9)
                                                                                           π∈Π
         Output = LayerNorm(x + (SubLayer(x)))                   (2)                               i=1 j=1

For the Multi-head self-attention module, the attention can            where Ci,j = kx           2
                                                                                       Pi − xj k2 is a cost matrix, γ is a coefficient,
be expressed as:                                                       and H(π) =         πi,j log πi,j is the negative entropy regu-
               attention = Attention(Q, K, V )                   (3)   larization that enable us to employ the celebrated Sinkhorn
                                                                       algorithm [35]. The solution to problem (9) actually express
where multi-head attention uses h different linear transforma-         the barycentric mapping
tions to project query, key, and value, which are Q, K, and
                                                                                                        nt
V , respectively, and finally concatenate different attention                                           X
                                                                                   x̂s,i = arg min            π ∗ (i, j)c(x, xt,j ),      (10)
results:                                                                                         x∈Ωt
                                                                                                        j=1
  MultiHead(Q,K,V) = Concat(head1 , ..., headh )W O              (4)
                                                                       where xs,i is source sample and x̂s,i is the resulting mapped
                                                                       sample. When using l2 norm as cost function, the barycenter
         headi = Attention(QWiQ , KWiK , V WiV )                 (5)   has a convenient format that maps the source samples into
                                                                       the convex hull of target samples as X̂s = ns π ∗ X̂t .
where the projections are parameter matrices:
           WiQ ∈ Rdmodel dk ,            WiK ∈ Rdmodel dk                       IV. DATASET AND REPROCESSING
                                                  hdv ×dmodel
                                                                 (6)
           WiV   ∈R   dmodel dv
                                  ,    WiO   ∈R                           We carried out the experiments on the PTB-XL dataset
where the computation of attention adopted scaled dot-                 [36], which contains clinical 12-lead ECG signals of 10-
product:                                                               second length. There are five conditions in total, which
                                                                       include Normal ECG (NORM), Myocardial Infarction (MI),
                                         QK T
          Attention(Q, K, V ) = softmax( √ )V            (7)           ST/T Change (STTC), Conduction Disturbance (CD), and
                                            dk                         Hypertrophy (HYP). The waveform files are stored in Wave-
For the output, we use a 1D convolutional layer and softmax            Form DataBase (WFDB) format with 16-bit precision at a
layer to calculate the final output.                                   resolution of 1µV/LSB and a sampling frequency of 100Hz.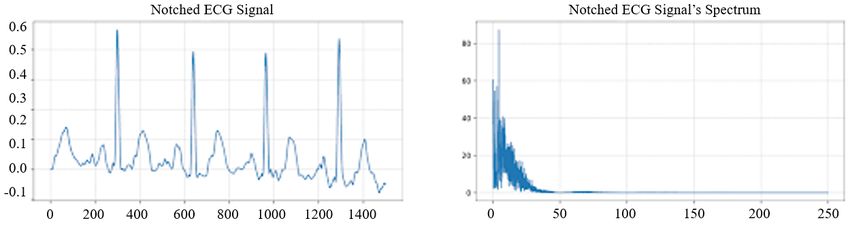
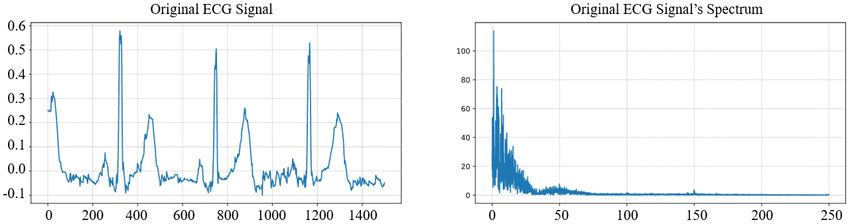
First, we read the raw data by wfdb library1 and perform moment and skewness, kurtosis, kurtosis factor, waveform
Fast Fourier transform (fft) to process the time series data factor, pulse factor, margin factor. The frequency-domain
into the spectrum, which is shown in Fig. 3. Then we features include: fft mean, fft variance, fft entropy, fft energy,
perform n-points window filtering to filter the noise and fft skew, fft kurt, fft shape mean, fft shape std, fft shape skew,
adopt notch processing to filter power frequency interference fft kurt, which are shown in Table I.
(noise frequency: 50Hz, quality factor: 30), where the filtered
result is shown in Fig. 4. TABLE I: ECG signal statistical features in frequency do-
main.
Feature Symbol Formula
1
P N
Z1 N k=1 F (k)
1
P N 2
Z2 N −1 k=1 (F (k) − Z1 )
PN F (k)
Z3 −1 × k=1 Z1 N log2 F (k)
Z1 N
1
P N 2
Z4 N k=1 (F (k))
Fig. 3: ECG data in time and spectrum. 1
PN F (k)−Z1 3
Z5 N k=1
√
Z2
4
1
P N F (k)−Z1
Z6 N k=1
√
Z2
PN
k=1 (f (k)−F (k))
Z7 PN
F (k)
rP k=1
N
k=1 [ (f (k)−Z 2
6 ) F (k)]
Z8 PN
F (k)
k=1
PN 3
k=1 [(f (k)−F (k)) F (k)]
Z9 PN
F (k)
PN k=1
4
k=1 [(f (k)−F (k)) F (k)]
Z10
Fig. 4: ECG filtered data after n-points window filtering and
PN
k=1
F (k)
notch processing.
Like many other datasets, the imbalance issue is a problem
We then detect the R peaks of each signal by ECG and needs to be solved before further steps. There are five
detectors2 , so the data can be sliced at the fixed-sized interval categories in total, including NORM, MI, STTC, CD, and
on both sides to obtain individual beats. The examples of HYP. In a balanced dataset, each category should occupy
detecting R peaks in ECG signals and divided pieces are the same proportion. In the original dataset, the number of
shown in Fig. 5 and Fig. 6, respectively. patients in the NORM category is much larger than the oth-
ers. After dividing the ECG signals into individual beats, the
portion of each category changed due to heartbeat variance
among people. However, if we count the segmented ECG
beats and compare different categories’ data, the imbalance
issue still exists, which is shown in Table II. From Table
II, we can find out that NORM category and CD category
is much larger than the other three categories, making the
Fig. 5: Detecting R peaks in the ECG signals. dataset unbalanced.
TABLE II: Statistics of the data.
Category Patients Percentage ECG beats Percentage
NORM 9528 34.2% 28419 36.6%
MI 5486 19.7% 10959 14.1%
STTC 5250 18.9% 8906 11.5%
CD 4907 17.6% 20955 27.0%
HYP 2655 9.5% 8342 10.8%
Fig. 6: Extracted ECG pieces divided by R peaks.
To reduce the dimension of ECG features, we downsample V. E XPERIMENTS AND D ISCUSSIONS
the processed ECG signals to 50Hz. Then we extract more A. Data Augmentation by Optimal Transport
time domain features and frequency domain features to
As discussed in Section (III-C), the augmented data
better represent the ECG signals. The time-domain features
generated by Optimal Transport is used to eliminate the
include: maximum, minimum, range, mean, median, mode,
data imbalance among different categories. In specific, (1)
standard deviation, root mean square, mean square, k-order
We always use NORM individual beats as the source and
1 https://pypi.org/project/wfdb/ transport the samples from the NORM into each other minor
2 https://pypi.org/project/py-ecg-detectors/ categories. (2) In the augmentation procedure, we randomlyFig. 7: Examples of the original ECG signals and the augmented ECG signals within different conditions. The top row
shows the 10-second 12-lead ECG signals of different heart condition categories. The bottom row shows the corresponding
transported samples obtained from our Optimal Transport based data augmentation method.
Fig. 8: Confusion matrix of prediction results on (a) original data; (b) oversampling data; and (c) our augmented data.
sample a batch of ECG signal from both the source and target First, we trained the MF-Transformer model with the original
categories and then use formulation in Equation (10) to get PTB-XL data to obtain the baseline performance for differ-
the barycentric mapping samples. The label of augmented ent categories. Second, we used the oversampling strategy
samples are set to be the target categories. (3) We mix the to augment the ECG signals for the minority categories,
original data and augmented data and then process them for then we trained the MF-Transformer model from scratch to
the MF-Transformer following Fig. 1. We segment the ECG obtain the performance by oversampling data augmentation
into individual beats, then we obtain the time and frequency method. Third, we augmented the data with our OT-based
statistical features with the method introduced in Section data augmentation method, and trained the MF-Transformer
IV. After that we concatenate the ECG signals with all the model from scratch again to evaluate the performance of
features as the input for the MF-Transformer model. our method. Note that the augmented data is only used for
Examples of augmented data is shown in Fig. 7. From the training, and the testing set remains the same as for all the
results, we can find the augmented data preserves the semi- experiments, which only contain the real-world ECG signals
periodic nature, and the results of each lead fit well with the to have a fair evaluation of the proposed method.
ECG pattern compared with original ECG signals by domain The training and testing splitting strategy is the same as in
knowledge. [20], [36]. The experiments are carried out on four Nvidia
Tesla V100 GPUs. The results of different approaches are
TABLE III: Comparison of classification results by different shown in Fig. 8, which shows the corresponding accuracy pf
data augmentation methods. each category in the confusion matrix.
Methods Average Accuracy F1-score From Fig. 8(a) we can see that due to the imbalance within
MF-Transformer-Raw 71.80 % 0.669 the dataset, the accuracies of NORM and CD categories are
MF-Transformer-Oversampling 72.05 % 0.717
MF-Transformer-Ours 75.82 % 0.757
much higher than the other three, meaning the model learns
more patterns from those two categories compared with the
others, which could have a negative impact since the other
B. Heart Disease Detection three heart disease categories can only achieve around 50%
To evaluate our methods, we performed experiments on ∼ 60% classification accuracy. So the data imbalance issue
the PTB-XL dataset to predict the category of ECG signals. needs to be resolved to improve the model’s performanceand robustness to different heart conditions. [11] Y. Liu et al., “Multi-label classification of multi-lead ecg based on
Fig. 8(b) shows by oversampling data from minority deep 1d convolutional neural networks with residual and attention
mechanism,” 2021 Computing in Cardiology (CinC), vol. 48, pp. 1–4,
categories to make the data more balanced, the classification 2021.
accuracy increased, especially for the minority categories. [12] C. Villani, “Topics in optimal transportation,” 2003.
But the improvement is not high enough, and could easily [13] J. Zhu et al., “Functional optimal transport: Mapping estimation and
domain adaptation for functional data,” ArXiv, vol. abs/2102.03895,
lead to overfitting. 2021.
Fig. 8(c) shows the results by learning from both raw data [14] R. Flamary et al., “Pot: Python optimal transport,” 2021.
and our OT-augmented data. Compared with the oversam- [15] S. Kiranyaz et al., “Convolutional neural networks for patient-specific
ecg classification,” 2015 37th Annual International Conference of the
pling results shown in Fig. 8(b), we can see that not only the IEEE Engineering in Medicine and Biology Society (EMBC), pp.
classification accuracy of each category has improved, but the 2608–2611, 2015.
average classification result has also increased from 71.80% [16] N. Nonaka and J. Seita, “In-depth benchmarking of deep neural
network architectures for ecg diagnosis,” in Proceedings of the 6th
(original) and 72.05% (oversampling) to 75.82% (ours). Each Machine Learning for Healthcare Conference, ser. Proceedings of
category’s performance comes to be more balanced, showing Machine Learning Research, K. Jung et al., Eds., vol. 149. PMLR,
the robustness improvement compared with the baseline 06–07 Aug 2021, pp. 414–439.
[17] S. Khurshid et al., “Electrocardiogram-based deep learning and clinical
results and oversampling results in Fig. 8(a) and Fig. 8 (b). risk factors to predict atrial fibrillation.” Circulation, 2021.
[18] S. Raghunath et al., “Deep neural networks can predict new-onset
VI. C ONCLUSIONS AND F UTURE W ORK atrial fibrillation from the 12-lead ecg and help identify those at risk
of atrial fibrillation–related stroke,” Circulation, vol. 143, pp. 1287 –
In this paper, we proposed a new method to deal with the 1298, 2021.
ECG data imbalance problem. We augmented the minority [19] J. R. Giudicessi et al., “Artificial intelligence-enabled assessment of
the heart rate corrected qt interval using a mobile electrocardiogram
category from the majority category with Optimal Transport device.” Circulation, 2021.
to make the data balanced, which can handle the overfitting [20] N. Strodthoff et al., “Deep learning for ecg analysis: Benchmarks
issue introduced by the traditional sampling method. We also and insights from ptb-xl,” IEEE Journal of Biomedical and Health
Informatics, vol. 25, pp. 1519–1528, 2021.
proposed an MF-Transformer as our classification model to [21] S. Al-Zaiti et al., “Machine learning-based prediction of acute coro-
predict the heart conditions from ECG signals. We showed nary syndrome using only the pre-hospital 12-lead electrocardiogram,”
that after data augmentation, there are both accuracy and Nature Communications, vol. 11, 2020.
[22] U. R. Acharya et al., “A deep convolutional neural network model to
robustness improvements on the classification results over classify heartbeats,” Computers in biology and medicine, vol. 89, pp.
five ECG categories, which demonstrate the effectiveness of 389–396, 2017.
our method. [23] G. B. Moody and R. G. Mark, “The impact of the mit-bih arrhythmia
database,” IEEE Engineering in Medicine and Biology Magazine,
Our future work will incorporate standard ECG intervals, vol. 20, pp. 45–50, 2001.
axis, and amplitudes (PR interval, P wave amplitude, etc.) to [24] M. Ravanelli and Y. Bengio, “Speaker recognition from raw waveform
provide a solution with more interpretability. with sincnet,” 2018 IEEE Spoken Language Technology Workshop
(SLT), pp. 1021–1028, 2018.
[25] S. Śmigiel, K. Pałczyński, and D. Ledziński, “Ecg signal classification
R EFERENCES using deep learning techniques based on the ptb-xl dataset,” Entropy,
vol. 23, no. 9, p. 1121, 2021.
[1] W. Liu et al., “Multimodal emotion recognition using deep canonical
[26] I. Sutskever, O. Vinyals, and Q. V. Le, “Sequence to sequence learning
correlation analysis,” ArXiv, vol. abs/1908.05349, 2019.
with neural networks,” in NIPS, 2014.
[2] D. Shanmugam, D. Blalock, and J. Guttag, “Multiple instance learning
[27] D. Bahdanau, K. Cho, and Y. Bengio, “Neural machine translation
for ecg risk stratification,” in Proceedings of the 4th Machine Learning
by jointly learning to align and translate,” CoRR, vol. abs/1409.0473,
for Healthcare Conference, ser. Proceedings of Machine Learning
2015.
Research, vol. 106. PMLR, 2019, pp. 124–139.
[28] A. Vaswani et al., “Attention is all you need,” ArXiv, vol.
[3] U. Côté-Allard et al., “Deep learning for electromyographic hand ges-
abs/1706.03762, 2017.
ture signal classification using transfer learning,” IEEE Transactions
[29] G. Yan et al., “Fusing transformer model with temporal features for
on Neural Systems and Rehabilitation Engineering, vol. 27, pp. 760–
ecg heartbeat classification,” 2019 IEEE International Conference on
771, 2019.
Bioinformatics and Biomedicine (BIBM), pp. 898–905, 2019.
[4] H. He and E. A. Garcia, “Learning from imbalanced data,” IEEE [30] C. Che et al., “Constrained transformer network for ecg signal
Transactions on Knowledge and Data Engineering, vol. 21, pp. 1263– processing and arrhythmia classification,” BMC Medical Informatics
1284, 2009. and Decision Making, vol. 21, 2021.
[5] R. C. Holte, L. Acker, and B. W. Porter, “Concept learning and the [31] A. Natarajan et al., “A wide and deep transformer neural network for
problem of small disjuncts,” in IJCAI, 1989. 12-lead ecg classification,” 2020 Computing in Cardiology, pp. 1–4,
[6] D. Mease, A. J. Wyner, and A. Buja, “Boosted classification trees and 2020.
class probability/quantile estimation,” J. Mach. Learn. Res., vol. 8, pp. [32] B. Behinaein et al., “A transformer architecture for stress detection
409–439, 2007. from ecg,” 2021 International Symposium on Wearable Computers,
[7] C. Drummond and R. C. Holte, “C4.5, class imbalance, and cost 2021.
sensitivity: Why under-sampling beats over-sampling,” 2003. [33] Y. Song et al., “Transformer-based spatial-temporal feature learning
[8] H. Martin et al., “Real-time frequency-independent single-lead and for eeg decoding,” ArXiv, vol. abs/2106.11170, 2021.
single-beat myocardial infarction detection.” Artificial intelligence in [34] K. Weimann and T. O. F. Conrad, “Transfer learning for ecg classifi-
medicine, vol. 121, p. 102179, 2021. cation,” Scientific Reports, vol. 11, 2021.
[9] S. ClementVirgeniya and E. Ramaraj, “A novel deep learning based [35] M. Cuturi, “Sinkhorn distances: Lightspeed computation of optimal
gated recurrent unit with extreme learning machine for electrocar- transport,” Advances in neural information processing systems, vol. 26,
diogram (ecg) signal recognition,” Biomed. Signal Process. Control., pp. 2292–2300, 2013.
vol. 68, p. 102779, 2021. [36] P. Wagner et al., “Ptb-xl, a large publicly available electrocardiography
[10] H. He et al., “Adasyn: Adaptive synthetic sampling approach for dataset,” Scientific Data, vol. 7, 2020.
imbalanced learning,” 2008 IEEE International Joint Conference on
Neural Networks (IEEE World Congress on Computational Intelli-
gence), pp. 1322–1328, 2008.You can also read