Pan-Mitogenomics Approach Discovers Diversity and Dynamism in the Prominent Brown Rot Fungal Pathogens
←
→
Page content transcription
If your browser does not render page correctly, please read the page content below

ORIGINAL RESEARCH
                                                                                                                                               published: 12 May 2021
                                                                                                                                      doi: 10.3389/fmicb.2021.647989

                                             Pan-Mitogenomics Approach
                                             Discovers Diversity and Dynamism in
                                             the Prominent Brown Rot Fungal
                                             Pathogens
                                             Gozde Yildiz 1 and Hilal Ozkilinc 1,2*
                                             1
                                              School of Graduate Studies, MSc Program in Biomolecular Sciences, Çanakkale Onsekiz Mart University, Çanakkale,
                                             Turkey, 2 Faculty of Arts and Sciences, Department of Molecular Biology and Genetics, Çanakkale Onsekiz Mart University,
                                             Çanakkale, Turkey

                                             Monilinia fructicola and Monilinia laxa species are the most destructive and economically
                                             devastating fungal plant pathogens causing brown rot disease on stone and pome
                                             fruits worldwide. Mitochondrial genomes (mitogenomes) play critical roles influencing the
                                             mechanisms and directions of the evolution of fungal pathogens. The pan-mitogenomics
                                             approach predicts core and accessory regions of the mitochondrial genomes and
                          Edited by:         explains the gain or loss of variation within and between species. The present study
                  Vassili N. Kouvelis,
  National and Kapodistrian University
                                             is a fungal pan-mitogenome of M. fructicola (N = 8) and M. laxa (N = 8) species.
                   of Athens, Greece         The completely sequenced and annotated mitogenomes showed high variability in size
                         Reviewed by:        within and between the species. The mitogenomes of M. laxa were larger, ranging from
                     Kelle Cardin Freel,     178,351 to 179,780bp, than the mitogenomes of M. fructicola, ranging from 158,607 to
       University of Hawai‘i at Mānoa,
                          United States      167,838bp. However, size variation within the species showed that M. fructicola isolates
                          Sotiris Amillis,   were more variable in the size range than M. laxa isolates. All the mitogenomes included
  National and Kapodistrian University
                     of Athens, Greece
                                             conserved mitochondrial genes, as well as variable regions including different mobile
                    *Correspondence:
                                             introns encoding homing endonucleases or maturase, non-coding introns, and repetitive
                            Hilal Ozkilinc   elements. The linear model analysis supported the hypothesis that the mitogenome
              hilalozkilinc@comu.edu.tr      size expansion is due to presence of variable (accessory) regions. Gene synteny was
                    Specialty section:
                                             mostly conserved among all samples, with the exception for order of the rps3 in the
          This article was submitted to      mitogenome of one isolate. The mitogenomes presented AT richness; however, A/T
            Evolutionary and Genomic
                                             and G/C skew varied among the mitochondrial genes. The purifying selection was
                          Microbiology,
                a section of the journal     detected in almost all the protein-coding genes (PCGs) between the species. However,
              Frontiers in Microbiology      cytochrome b was the only gene showing a positive selection signal among the total
       Received: 30 December 2020            samples. Combined datasets of amino acid sequences of 14 core mitochondrial PCGs
          Accepted: 29 March 2021
           Published: 12 May 2021
                                             and rps3 obtained from this study together with published mitochondrial genome
                               Citation:
                                             sequences from some other species from Heliotales were used to infer a maximum
          Yildiz G and Ozkilinc H (2021)     likelihood (ML) phylogenetic tree. ML tree indicated that both Monilinia species highly
         Pan-Mitogenomics Approach
                                             diverged from each other as well as some other fungal species from the same order.
    Discovers Diversity and Dynamism
   in the Prominent Brown Rot Fungal         Mitogenomes harbor much information about the evolution of fungal plant pathogens,
                             Pathogens.      which could be useful to predict pathogenic life strategies.
          Front. Microbiol. 12:647989.
     doi: 10.3389/fmicb.2021.647989          Keywords: pan-mitogenomics, mitogenome, evolution, Monilinia species, brown rot

Frontiers in Microbiology | www.frontiersin.org                                    1                                             May 2021 | Volume 12 | Article 647989
Yildiz and Ozkilinc                                                                                Pan-Mitogenomics of Brown Rot Fungal Pathogens

INTRODUCTION                                                               different isolates is crucial to characterize the complete set of
                                                                           accessory genes (Stajich, 2017). Two-speed genome evolution is
Fungi are one of the most remarkable and diverse kingdom,                  referred to indicate compartmentalization of the fungal genomes
with approximately 720,256 species compared with other                     as shared and slowly evolving regions as well as variable and
eukaryotic organisms worldwide (Blackwell, 2011; Badotti et al.,           fast-evolving regions (Dong et al., 2015; Bertazzoni et al.,
2017). Fungal genomics exhibit important data for studies                  2018; Torres et al., 2020). Pangenomics approach has recently
of adaptive behavior and evolutionary research due to their                resolved different fungal nuclear genomes (Kelly and Ward, 2018;
highly dynamic and fast-evolving features. High-throughput                 McCarthy and Fitzpatrick, 2019; Badet et al., 2020); however, only
sequencing technologies have allowed for sequencing of the                 few studies focused on mitochondrial genomes. For instance,
tremendous number of fungal nuclear genomes across many                    sequencing of mitogenomes of Aspergillus and Penicillium species
species, with a total of 2,5991 . However, relatively limited data         were analyzed by presenting core and accessory genes through
is available for whole mitochondrial genomes. For instance, only           comparative mitogenome analyses (Joardar et al., 2012). The
793 mitochondrial genomes have been announced by NCBI                      mitogenome of phytopathogenic fungus Fusarium graminearum
Organelle Genome Resources2 . Mitochondrial genomes present                was analyzed considering the pan-mitochondrial genomics
valuable information to explain both adaptative traits and the             concept (Brankovics et al., 2018).
evolution of pathogens. Fungal mitochondrial genes can be                     Monilinia species include phytopathogenic fungi that belong
targeted for plant disease management (Medina et al., 2020) and            to the Ascomycota division. They cause brown rot disease on
provide specific markers for population studies, as well as species        many stone and pome fruits, which results in severe economic
diagnosis (Santamaria et al., 2009). Furthermore, mitogenome               losses around the world. Monilinia laxa, Monilinia fructicola,
data contribute to expand information of fungal phylogenetics              and Monilinia fructigena are the prevalent pathogenic species
(Chen et al., 2019; Nie et al., 2019; Li Q. et al., 2020). Fungal          of the Monilinia genus causing this disease (Holb, 2006, 2008).
mitochondrial genomes consist of highly conserved proteins                 The complete mitogenome of M. laxa was characterized by
and RNA encoding genes related to respiration and translation              our previous study for the first time and presented higher
processes (Aguileta et al., 2014; Franco et al., 2017). Moreover,          content of mobile introns in comparison to some of the other
the presence of mitochondrial-encoded ribosomal protein genes,             phytopathogenic species from closely related genera (Yildiz and
such as rps3, and its homologs (var1 and S5) differs among fungal          Ozkilinc, 2020). Thus, we expected high mitochondrial diversity
groups, and these genes may have been transferred to the nuclear           within this pathogenic species and its relative, causing the same
genomes in different eukaryotic species (Bullerwell et al., 2000;          disease. This study aimed to uncover mitochondrial variations, by
Smits et al., 2007; Sethuraman et al., 2009; Korovesi et al., 2018;        pan-mitogenomic approach, of the 16 mitogenomes from the two
Yildiz and Ozkilinc, 2020). Furthermore, copy number, gene                 prominent and most abundant species (M. fructicola and M. laxa)
duplications, gain/loss of introns, and transposable and repetitive        that are known to cause brown rot disease. Mitogenomes were
elements are the main factors causing mitogenome variations                annotated as well as phylogenetics, and evolutionary selections
(Basse, 2010; Aguileta et al., 2014). Because of these factors,            were evaluated based on the protein-coding regions of the
mitogenome sizes may vary within and among fungal taxonomic                mitogenomes. This provides an essential foundation for future
groups (Burger et al., 2003). Recent studies showed that homing            studies on population genetics, taxonomy, and crop protection
endonucleases, such as GIY-YIG and LAGLIDADG families,                     strategies from the perspective of mitogenomics.
play a significant role in shaping fungal genome structure and
contribute to variations within and between species (Sandor et al.,
2018; Kolesnikova et al., 2019; Yildiz and Ozkilinc, 2020).                MATERIALS AND METHODS
    Fungal mitogenomes have been evaluated for genomic
features (Li Q. et al., 2020), comparative mitogenomics                    Fungal Isolates and DNA Extraction
(McCarthy and Fitzpatrick, 2019), and pan-mitogenomics                     Isolates of Monilinia species were selected from the collection of
(Brankovics et al., 2018). The pan-genomic approaches, using               Dr. Ozkilinc. Original isolates were long term stored at −20◦ C on
a comparative genomics-based methodology to identify the                   Whatman filter papers no 1. Isolates were obtained from infected
core and accessory genomes or genomic regions, were applied                peach fruits from different orchards in six cities of Turkey
on bacterial genomes at first (Tettelin et al., 2008). Core                (Ozkilinc et al., 2020). Sixteen isolates from a large collection
genomes tend to be conserved among strains, such as many                   of Monilinia samples were selected. The list of selected fungal
housekeeping genes involved in translation, metabolism, and                pathogens of M. fructicola and M. laxa species is represented
oligopeptide metabolism (McCarthy and Fitzpatrick, 2019).                  in Table 1. Selected isolates were grown from their original
However, the accessory genome includes dispensable, variable,              stored cultures on potato dextrose agar media at 23◦ C in the
and “unessential regions,” which may not be present in all strains         dark. Mycelia were transferred to potato dextrose broth and
or isolates within a clade (Torres et al., 2020). Thus, genome             incubated at room temperature on a rotary shaker at 150 rpm for
content can vary in distinct populations of a single fungal species,       5–7 days for genomic DNA isolation (Yildiz and Ozkilinc, 2020).
and the inventory of the variation at the genomic level in                 Total DNA extractions were carried out using a commercial
                                                                           kit for fungi/yeast genomic DNA isolation (Norgen Cat. 27300,
1
    https://www.ncbi.nlm.nih.gov/genome                                    Canada), following the manufacturer’s protocol. Concentration
2
    https://www.ncbi.nlm.nih.gov/genome/organelle/                         and purity of DNAs were assessed with a spectrophotometer

Frontiers in Microbiology | www.frontiersin.org                        2                                      May 2021 | Volume 12 | Article 647989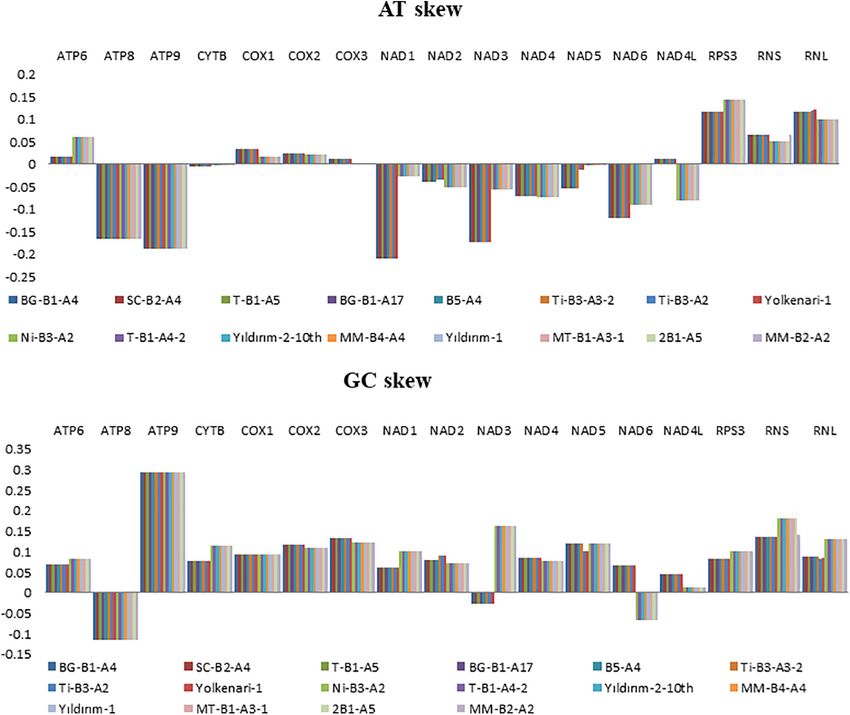
Yildiz and Ozkilinc                                                                                                  Pan-Mitogenomics of Brown Rot Fungal Pathogens

TABLE 1 | The list of selected fungal isolates from M. fructicola and                      (Bernt et al., 2013). Mold/Protozoan/Coelenterate mitochondrial
M. laxa species.
                                                                                           genetic code four was used for the annotation of the
Isolate Code          Species      City/Country      Host species         Orchard          mitogenomes. Annotation of rRNA and tRNA genes was checked
                                                                          number           by using RNAweasel (Beck and Lang, 2010) and tRNAscan-
                                                                                           SE 2.0 (Lowe and Chan, 2016), respectively. Hypothetical
B5-A4             M. fructicola Çanakkale/Turkey        Peach                5
                                                                                           proteins, including ORFs and LAGLIDADG, GIY-YIG homing
T-B1-A5           M. fructicola     Izmir/Turkey        Peach               10
                                                                                           endonuclease families, were detected in intergenic regions
Ti-B3-A2          M. fructicola     Izmir/Turkey        Peach                3
                                                                                           using ORFinder in NCBI and Sequence Manipulation Suite:
Ti-B3-A3-2        M. fructicola     Izmir/Turkey        Peach                3
                                                                                           ORFFinder (Stothard, 2000), as well as the product of possible
Yolkenari-1       M. fructicola     Izmir/Turkey        Peach           Greengrocers
                                                                                           protein sequences, were checked by smart-blast in NCBI.
SC-B2-A4          M. fructicola    Samsun/Turkey        Peach                2
                                                                                           Possible predicted mitochondrial genes were confirmed by a
BG-B1-A4          M. fructicola     Bursa/Turkey        Peach                1
                                                                                           basic local alignment search tool using a nucleotide blast
BG-B1-A17         M. fructicola     Bursa/Turkey        Peach                1
                                                                                           (BLASTN) in NCBI. The previously annotated mitogenome
2B1-A5                M. laxa     Çanakkale/Turkey      Peach                1
                                                                                           of M. laxa isolate (Ni-B3-A2) (accession number: MN881998)
T-B1-A4-2             M. laxa       Izmir/Turkey        Peach                1
                                                                                           was used as a reference to check the annotations. Annotated
Ni-B3-A2              M. laxa       Nigde/Turkey        Peach                3
                                                                                           gene arrangements were analyzed by using MAUVE 2.3.1
MM-B2-A2              M. laxa      Mersin/Turkey        Peach                2
                                                                                           software (Darling et al., 2010). Moreover, duplicate regions in
MM-B4-A4              M. laxa      Mersin/Turkey        Peach                4
                                                                                           mitogenomes of isolate M. fructicola were investigated by using
MT-B1-A3-1            M. laxa      Mersin/Turkey        Peach                1
                                                                                           the Geneious 9.1.8 program (Kearse et al., 2012).
Yildirim-1            M. laxa       Bursa/Turkey        Peach                1
Yildirim-2-10th       M. laxa       Bursa/Turkey        Peach                –
                                                                                           Identification of Repetitive Sequences
                                                                                           The repetitive elements in the mitogenomes were determined
(NanoQuant Infinite M200, Tecan) and a fluorometer (Qubit 3.0,                             by using Tandem Repeats Finder (Benson, 1999). The repetitive
Thermo Fisher Scientific, United States), then the DNAs were                               sequences and their motifs were compared within and
sent to an external service for Illumina-based library construction                        between the species.
and short-read sequencing (Macrogen Inc., Next-Generation
Sequencing Service, Geumcheon-gu, Seoul, South Korea).                                     Pan-Mitogenomics Analysis to Predict
                                                                                           Conserved and Variable Regions Within
Genome Sequences and de novo                                                               Species
Assembly                                                                                   The percentages of the conserved and variable regions of
The whole-genome sequence libraries of the 16 Monilinia spp.                               the mitogenomes within each species were determined using
isolates were constructed using Illumina platform with TruSeq                              bioinformatics tools Spine and AGEnt (Ozer et al., 2014).
Nano kit to acquire paired-end 2 × 151 bp with 350-bp insert                               Additionally, R programming language with a deviance function
size, provided by Macrogen Inc., Next-Generation Sequencing                                from the stats package (R Core Team, 2013) was applied
Service. Adapters and low-quality reads were removed from raw                              to interpret the statistical analysis of whether the intragenic
data by using Trimmomatic 0.36 (Bolger et al., 2014) with the                              intron sizes have contributed to differentiation in mitogenome
parameters as followed previously (Yildiz and Ozkilinc, 2020).                             sizes within the species. Thus, a linear correlation between the
The reads were evaluated to control the quality of sequences                               mitochondrial genome size (as the dependent variable) and
by using FastQC (Andrews, 2010), and the quality-checked data                              intron length (as the independent variable) was tested based on
were used for further analysis. The mitogenomes were assembled                             the null hypothesis of positive correlation expectation.
de novo and extracted from the complete genome data using
GetOrganelle v1.6.2 (Jin et al., 2019) with K-mer value: 105,                              Estimation of Codon Usage and
including the SPAdes v3.6.2 (Bankevich et al., 2012) assembly                              Evolutionary Selection Patterns in
program. QUAST reports presenting contig sizes, N50, and                                   Mitogenomes of Monilinia Species
L50 were checked for the assembled contigs, including possible                             The non-synonymous (Ka) and synonymous substitution rates
mitogenomes (Gurevich et al., 2013). The obtained mitogenomes                              (Ks) were calculated for all PCGs by using DnaSP v6.10.01 (Rozas
for each isolate were visualized using the Geneious 9.1.8 program                          et al., 2017). Since all the coding regions were almost the same
(Kearse et al., 2012). Mitogenomes represented by more than                                within the species, the evolution rate was estimated on the total
one contig were mapped by referring to the other completed                                 data set from both species. The strength of selection was inferred
mitogenomes using Geneious 9.1.8 (Kearse et al., 2012).                                    by considering that if the calculated ratio is equal to, greater than,
                                                                                           or less than 1 indicates neutral evolution, positive (diversifying)
Mitochondrial Genome Annotations and                                                       selection, or purifying (negative) selection, respectively. Ka/Ks
Gene Orders                                                                                values for all protein-coding regions were visualized with ggplot
Core protein-coding genes (PCGs), ribosomal RNA, transfer                                  in R programming language (R Core Team, 2013). The Relative
RNA, and introns were annotated using the online server                                    Synonymous Codon Usage (RSCU) was obtained using MEGA
MFannot (Beck and Lang, 2010) and Mitos WebServer                                          7 software (Kumar et al., 2016) and determined for all coding

Frontiers in Microbiology | www.frontiersin.org                                        3                                        May 2021 | Volume 12 | Article 647989
Yildiz and Ozkilinc                                                                                              Pan-Mitogenomics of Brown Rot Fungal Pathogens

regions. Furthermore, the nucleotide frequency of occurrence in                          2012) with 1,000 bootstrap replicates under BLOSUM62
each protein-coding gene (including the full length of the exons                         substitutional matrix. The phylogenetic tree was visualized
and introns) as well as in genes related to the ribosome (rnl                            by FigTree v1. 4. program (Rambaut, 2012) and rooted
and rns) was assessed for A/T and G/C asymmetry by using the                             at the midpoint.
following formulas:

  AT skew = (A − T)/(A + T); GC skew = (G − C)/(G + C)                                   RESULTS
Phylogenetic Analysis Based on Amino                                                     Sequence Features of Mitogenomes of
Acid Sequences of Mitochondrial                                                          Monilinia Species
Protein-Coding Genes                                                                     Most of the mitogenomes were extracted as one contig. However,
Amino acid translation of the PCGs in the mitochondrial                                  the mitogenomes of five isolates (Yolkenari-1, Yildirim-2–10th,
genomes of M. fructicola and M. laxa isolates were obtained                              Ti-B3-A3-2, BG-B1-A17, and SC-B2-A4) were represented by
based on the mitochondrial translation code data four                                    four contigs. These contigs were mapped by using the other
using the Geneious 9.1.8 program (Kearse et al., 2012). The                              completed mitogenomes as reference. Statistics of QUAST
phylogenetic tree was constructed using a concatenated                                   reports for the assembled mitogenomes of 16 isolates of
amino acid matrix of the 14 core mitochondrial genes and                                 Monilinia species are provided in Table 2. After mapping,
ribosomal protein of M. fructicola and M. laxa isolates. To                              the mitogenome sizes ranged from 158,607 to 167,838 bp for
strengthen the evolutional relationships between our data                                M. fructicola and from 178,351 to 179,780 bp for M. laxa.
and other genera of the Helotiales, amino acid sequences of                              Intraspecific length variations within isolates of M. fructicola
each of the PCGs and ribosomal protein were included from                                were larger than the variations observed for the M. laxa
published mitochondrial genome data. Additional datasets                                 isolates. An isolate of M. laxa (isolate code is MM-B2-
were obtained from NCBI GenBank under the following                                      A2) had the largest mitogenome size with 179,780 bp,
accession numbers; KC832409.1 (Botrytinia fuckeliana),                                   while the isolate (coded as T-B1-A5) from M. fructicola
KJ434027.1 (Sclerotinia borealis), KT283062.1 (Sclerotinia                               species had the smallest mitogenome size with 158,607 bp.
sclerotiorum), KF169905.1 (Glarea lozoyensis), NC_015789.1                               Total GC% content of all mitogenomes ranged between
(Phialocephala subalpine), KF650572.1 (Rhynchosporium                                    30.0 and 31.1%.
agropyri), KF650575.1 (Rhynchosporium secalis), KF650573.1
(Rhynchosporium commune), and KF650574.1 (Rhynchosporium                                 Annotated Mitogenomes of Brown Rot
orthosporum). The multiple protein sequences were concatenated                           Fungal Pathogens
by using the Geneious 9.1.8 program (Kearse et al., 2012)                                The annotated mitogenome, with circular structure, of
and aligned by ClustalW using MEGA software version 7                                    M. fructicola (BG-B1-A4) was chosen as representative sequence
(Kumar et al., 2016). The maximum likelihood (ML) was                                    and submitted for the first time to the NCBI GenBank (accession
constructed using RAxmlGUI v2.0 (Silvestro and Michalak,                                 number MT005827) (Figure 1 and Supplementary Table 1).

TABLE 2 | QUAST report for the 16 mitogenomes of Monilinia spp.

Sample ID             Contigs        Largest contig          Total length        N50∗          N75       L50∗∗      L75      GC%         AT%          Species

MM-B2-A2                 1                179780                179780           179780       179780       1         1       30.09       69.91         M. laxa
2B1-A5                   1                178431                178431           178431       178431       1         1       30.04       69.96         M. laxa
MT-B1-A3-1               1                178421                178421           178421       178421       1         1       30.05       69.95         M. laxa
Yildirim-1               1                178358                178358           178358       178358       1         1       30.06       69.94         M. laxa
Ni-B3-A2                 1                178357                178357           178357       178357       1         1       30.06       69.94         M. laxa
MM-B4-A4                 1                178353                178353           178353       178353       1         1       30.05       69.95         M. laxa
T-B1-A4-2                1                178351                178351           178351       178351       1         1       30.05       69.95         M. laxa
Ti-B3-A2                 1                167471                167471           167471       167471       1         1       31.11       68.89       M. fructicola
B5-A4                    1                159656                159656           159656       159656       1         1       30.95       69.05       M. fructicola
BG-B1-A4                 1                159648                159648           159648       159648       1         1       30.94       69.06       M. fructicola
T-B1-A5                  1                158607                158607           158607       158607       1         1       30.95       69.05       M. fructicola
Yolkenari-1              4                69540                 149868           59243        59243        2         2       31.19       68.81       M. fructicola
Ti-B3-A3-2               4                66346                 146595           59242        59242        2         2       31.21       68.79       M. fructicola
Yildirim-2-10th          4                64887                 142596           56701        56701        2         2       31.05       68.95         M. laxa
BG-B1-A17                4                64885                 142593           56701        56701        2         2       31.05       68.95       M. fructicola
SC-B2-A4                 4                64884                 142592           56701        56701        2         2       31.05       68.95       M. fructicola

*N50: length is at least half (50%) of the total base content of the assembly.
**L50: is the number of contigs equal to or longer than the N50 length.

Frontiers in Microbiology | www.frontiersin.org                                     4                                       May 2021 | Volume 12 | Article 647989

Yildiz and Ozkilinc                                                                                                     Pan-Mitogenomics of Brown Rot Fungal Pathogens

  FIGURE 1 | (A) Annotated reference circular mitogenomes of M. fructicola, showing core conserved protein-coding genes (blue) with introns-encoded homing
  endonucleases (pink and turquoise), reverse transcriptase (black), orf (orange), two ribosomal subunits (green), rps3 (yellow), introns (gray), and tRNAs (red). (B)
  Length variation of 14 protein-coding genes, two ribosomal subunits, and rps3 among 16 mitogenomes of Monilinia pathogens.

Besides, all the mitogenomes were submitted to NCBI GenBank                               (Figure 1). However, alanine (Ala) and cysteine (Cys) amino
and the accession numbers were provided in the “Data                                      acids were absent in the mitochondrial tRNAs of M. fructicola
Availability Statement” section at the end of the paper. On the                           and M. laxa, respectively. Moreover, for both species, some of
other hand, the complete mitogenome of the isolate Ni-B3-A2                               the tRNA genes encoding different anticodons corresponded
of M. laxa species was submitted to the NCBI GenBank with                                 to the same amino acids. For instance, four copies of arginine
accession number MN881998 by our previous study (Yildiz and                               amino acid, which were encoded by TCT and TCG anticodons
Ozkilinc, 2020). Mitogenomes of the 16 isolates of Monilinia                              (Supplementary Table 2). The AT-rich content for tRNA
species had the 14 PCGs responsible for mitochondrial oxidative                           codons was observed in both species (Supplementary Table 2).
phosphorylation system (OXPHOS) and ATP synthesis,                                        The mitogenomes of M. fructicola and M. laxa also contained
including cytochrome c oxidase subunits 1, 2, and 3 (cox1-3),                             some unidentified open reading frames, represented as ORFs
NADH dehydrogenase subunits 1–6 and 4L (nad1-6 and nad4l),                                encoding hypothetical proteins, and those ORFs were conserved
ATP synthase subunits 6, 8, and 9 (atp6-8-9), and cytochrome b                            within the species.
(cob or cytb). Furthermore, two ribosomal RNA genes for large                                The largest gene sizes among the mitochondrial PCGs in the
and small subunits (rnl and rns), 32 transfer RNA (tRNAs), and                            isolates of M. fructicola were detected in cytochrome c oxidase
a gene-encoding ribosomal protein S3 (rps3) were annotated.                               (cox) subunits 1,2,3 and cytochrome b (cytb), ranging from 23.8
A set of 32 tRNAs of Monilinia isolates encoded for 20 essential                          to 11 kb (Figure 1). The large-sized PCGs of M. laxa isolates were
amino acids were involved in the mitochondrial protein synthesis                          cox1,2,3, cytb, and nad5 genes, ranging from 15.3 to 11 kb. Gene

Frontiers in Microbiology | www.frontiersin.org                                       5                                              May 2021 | Volume 12 | Article 647989

Yildiz and Ozkilinc                                                                                                 Pan-Mitogenomics of Brown Rot Fungal Pathogens

lengths were similar within the species but varied between the                         exhibited negative GC skews. Moreover, the GC skew of nad6
species. However, atp8 and atp9 genes showed the same size for                         was positive for the isolates of M. fructicola but negative for
all the 16, regardless of the species (Figure 1 and Supplementary                      the isolates of M. laxa. In addition, genes encoding ribosomal
Table 1). An unknown sequence with 1,219-bp length was                                 subunits (rnl, rns) and ribosomal protein (rps3) showed positive
detected within the rnl gene, only in the mitogenomes of the                           AT and GC skewness in all the mitogenomes of Monilinia
isolates of M. fructicola. This unknown sequence was not matched                       samples (Figure 2).
with any sequence in the NCBI gene bank. Furthermore, another                             Codon usage analysis for the 14 mitochondrial PCGs and
duplication of this unknown sequence was detected within the                           rps3 indicated that the most frequently used codons are as
rnl of the isolate named Ti-B3-A2, which has one of the largest                        shown in the Supplementary Table 3. Codon usage patterns were
mitogenome among all. On the other hand, these sequences were                          quite similar between the 16 mitogenomes. The total number of
not present in any of the isolates of M. laxa.                                         codons was the highest for Leucine (Leu), Isoleucine (Ile), Lysine
                                                                                       (Lys), and Phenylalanine (Phe) amino acids in mitogenomes of
                                                                                       Monilinia species (Supplementary Table 3).
Skewness and Codon Usage Analysis
Nucleotide contents of the 16 mitogenomes were represented
according to their AT and GC skew values (Figure 2). Many of                           Comparison of Gene Arrangements of
the PCGs showed negative AT skews for both species, except for                         the Annotated Mitogenomes
the genes of atp6, cox1, cox2, and cox3, which exhibited a positive                    The Mauve alignment reflected a conserved synteny among the
AT skew (Figure 2). The AT skew of nad4l varied among species                          16 mitogenomes, which were divided into 11 homologous regions
as positive and negative asymmetry for M. fructicola and M. laxa,                      and represented with different colored synteny blocks (Figure 3).
respectively. The GC skews of the core PCGs for 16 mitogenomes                         Gene order in the mitogenomes of M. fructicola isolates 3 was
showed positive asymmetry except for atp8 and nad3, which                              conserved with the exception for the order of the rps3 gene, which

  FIGURE 2 | Graphical illustration showing the (A) AT- and (B) GC-skew in the mitochondrial genes of the 16 isolates of Monilinia spp.

Frontiers in Microbiology | www.frontiersin.org                                    6                                             May 2021 | Volume 12 | Article 647989
Yildiz and Ozkilinc Pan-Mitogenomics of Brown Rot Fungal Pathogens
FIGURE 3 | Gene order of 16 mitogenomes of Monilinia isolates is shown. Homologous regions are colored differently and numbered to follow the order.
differed in the isolate coded T-B1-A5 (Figure 3). Rps3 was found Introns in the Mitogenomes of Monilinia
as a free-standing gene in the mitogenomes analyzed. Gene order Pathogens
in the mitogenomes of M. laxa isolates was conserved within the
Introns distributing within genic and intergenic regions, as well
species (Figure 3).
as mobile intron groups, were detected in all mitogenomes
obtained from different isolates of two pathogenic species. The
Repetitive Sequences in the intron content of different genes varied in both species. In
Mitogenomes of the Isolates of Monilinia M. fructicola, the number of introns for each gene was Cox1
species with 13 introns, cox2 with five introns, cox3 with seven introns,
Different repetitions were detected within the two species cytb with seven introns, nad2 and nad4 with one intron, nad5
(Table 3). Isolates of M. fructicola presented two sequence motifs, with two introns, atp6 with two introns, and large and small
which were (TAC)29 and (TC)18 located in the intergenic regions ribosomal subunit with four introns. On the other hand, nad1,
(Table 3). Among the eight mitogenomes of M. fructicola, 33– nad3, nad4l, atp8, and atp9 were found as intronless genes.
37 repeats were detected, and these repetitions covered 1.23– Besides, some of the mitogenomes showed intron expansions
1.41% of the total mitogenome sizes. All the mitogenomes within nad2 and nad5. The isolates Ti-B3-A2, Ti-B3-A3-2, and
of M. laxa represented repetitive sequences in 59–60 bp Yolkenari-1 presented an additional intron (total 1,459 bp in
in length comprising 1.60–1.69% of the total mitogenomes. size) in the nad2 gene in comparison to the other samples. The
The most longest repeats of more than 10 bp were (AT)17 nad5 gene in the mitogenomes of the two isolates (Ti-B3-A2 and
in the mitogenome of M. laxa was detected previously Yolkenari-1) included two extra introns (total 3,568 bp in size) to
(Yildiz and Ozkilinc, 2020). This repetition was found in the compare other isolates of the same species (Figure 4).
seven other isolates of the species. (AT)17 sequences were For all the eight mitogenomes of M. laxa, a total of 34 intron
within an intron of the cytb gene, as reported previously locations were found in cox1 gene with six introns, cox2 gene
(Yildiz and Ozkilinc, 2020). with seven introns, cox3 gene with four introns, cytb gene with
Frontiers in Microbiology | www.frontiersin.org 7 May 2021 | Volume 12 | Article 647989Yildiz and Ozkilinc Pan-Mitogenomics of Brown Rot Fungal Pathogens
TABLE 3 | Information on repetitive motifs detected in the mitogenomes of 16 detected within genic and intergenic regions of the mitogenomes
isolates of number Monilinia spp.
of M. fructicola. Each of these elements from group I was
Species Isolate Repeat Copy Location of the Total represented as a single copy. Representation of group I mobile
code motif* number of repetition repeats*** introns was given in detail for one isolate of M. laxa in
the our previous study (Yildiz and Ozkilinc, 2020). Group I
repeat** mobile introns encoding homing endonucleases were found as
Monilinia 2B1-A5 AT 17 Intron of cob gene 60 approximately 18.1% of the whole mitogenome of M. fructicola
laxa MM-B2-A2 AT 17 Intron of cob gene 60 and 35.4% of the whole mt-genome of M. laxa. Moreover, three
T-B1-A4-2 AT 17 Intron of cob gene 60 different sequences were annotated as group II introns in the
Yildirim-1 AT 17 Intron of cob gene 60 mitogenomes of M. fructicola. These sequences were the same
Yildirim-2-10th AT 17 Intron of cob gene 60 and located in the same positions within all mitogenomes of
Ni-B3-A2 AT 17 Intron of cob gene 60 the isolates of M. fructicola. These sequences were annotated
MM-B4-A4 AT 17 Intron of cob gene 59 as encoding reverse transcriptase/maturase (Figure 1). Group II
MT-B1-A3-1 AT 17 Intron of cob gene 59 introns were not detected within the mitogenomes of M. laxa.
Monilinia B5-A4 TAC 29 Intergenic region 37
fructicola TC 18 Pan-Mitogenomics
BG-B1-A17 TAC 29 Intergenic region 36 The core mitochondrial genes included 14 PCGs, rns, rnl, and
TC 18 rps3. Except for rnl, rns, nad2, and nad5, all core genes were found
SC-B2-A4 TAC 29 Intergenic region 36 fully conserved within species. Genic and intergenic introns,
TC 18 mobile introns (group I and group II), and repetitive sequences
T-B1-A5 TAC 29 Intergenic region 36 considered accessory regions of mitogenomes. However, many
TC 18 of these accessory elements were conserved within the species.
Ti-B3-A2 TAC 29 Intergenic region 36 The conserved regions formed a large portion of the mitogenome
TC 18 (ranging between 94 and 98%), while the variable regions covered
BG-B2-A4 TAC 29 Intergenic region 36 1.19–5.6% of the whole mitogenomes of the M. fructicola isolates.
TC 18 The most accessory-rich mitogenomes were detected in the
Yolkenari-1 TAC 29 Intergenic region 34 isolates coded Ti-B3-A2 and Yolkenari-1 within M. fructicola
TC 18 (Figure 5). The whole mitogenomes of the isolates of M. laxa
Ti-B3-A3-2 TAC 29 Intergenic region 33 conserved within the species with the exception that one isolate
TC 18 (called MM-B4-A2) carried 0.7% of the total genome as a
variable, which was not shared with any other isolate within this
*The repeat motif having the highest copy number among the all repeats found in
the mitogenome is shown. species (Figure 5).
**Copy number of the whole repeat units is given. According to the linear model test, intragenic introns had a
***All repeat units found in the mitogenome. significant effect (P < 0.0001 for both species) on mitogenome
length variation. R2 values explaining dependent (mitogenome
seven introns, nad5 gene with five introns, nad1 gene with one length) and independent (intron length) variables were found as
intron, as well as the nad2, nad4, atp6, and rnl genes with one 0.9851 and 0.995 for M. fructicola and M. laxa, respectively.
intron. On the other hand, nad3, nad4l, atp8, atp9, and rns did
not contain any intron. Furthermore, MM-B2-A4 had one extra Evolutionary Selection on Mitochondrial
intron within the rns gene encoding a small ribosomal subunit. Genes of Monilinia Species
The total number of introns were greater in the mitogenomes of The evolutionary rates among the 16 mitogenomes from the
M. fructicola than in the mitogenomes of M. laxa; however, the two species showed that most of the genes were under negative
total intron lengths were larger in the mitogenomes of M. laxa (purifying selection) (Figure 6). The Cox3 gene indicated neutral
(Figure 4). Introns in the mitogenomes of M. fructicola isolates selection (Figure 6). The cytb gene was under diversifying or
covered 42.2% of the whole mitogenome, and within the non- positive selection, and the remaining genes were under purifying
coding regions (28%) and within coding regions (14.2%). The selection (Figure 6).
introns in mitogenomes of M. laxa isolates covered 38.9% of
the whole mitogenome and were within the non-coding region Maximum Likelihood Analysis of
(16.3%), and within coding sequences (22.6%).
For M. fructicola isolates, the most intronic sequence carrying
Mitochondrial Protein-Coding Genes of
gene was the cytb with 72.8%, and intron rich genes followed by Monilinia spp. and Other Genera From
cox1 (66.5%), cox2 (61.5%), and cox3 (53%). The most intronic the Heliotales
content was found in the cox2 gene with 65.4% and followed by The ML tree was obtained for the amino acid sequences of
nad1 (65.2%), cytb (62.1%), and cox3 (53%) for M. laxa isolates. 14 PCGs and rps3 of the M. fructicola, M. laxa, as well as
Besides, group I and group II mobile introns were detected in the some other species from Heliotales (Figure 7). Since all the
mitogenomes of M. fructicola (Figure 1). Different LAGDIDADG amino acid sequences were conserved within the species, isolates
and GIY-YIG elements encoding homing endonucleases were were clustered together for each Monilinia species. However,
Frontiers in Microbiology | www.frontiersin.org 8 May 2021 | Volume 12 | Article 647989Yildiz and Ozkilinc Pan-Mitogenomics of Brown Rot Fungal Pathogens FIGURE 4 | Intron size variations among 16 isolates of Monilinia spp. FIGURE 5 | Predicted percentage of conserved and variable regions of the mitogenomes within each species (A) M. fructicola and (B) M. laxa. Frontiers in Microbiology | www.frontiersin.org 9 May 2021 | Volume 12 | Article 647989
Yildiz and Ozkilinc                                                                                          Pan-Mitogenomics of Brown Rot Fungal Pathogens

  FIGURE 6 | The non-synonymous/synonymous mutation rates (Ka/Ks) were of the protein-coding regions and rps3 in the 16 mitogenomes from M. fructicola and
  M. laxa species.

M. fructicola and M. laxa diverged from each other with the                       duplicate was detected within the rnl gene within the isolates of
high bootstrap value. Both Monilinia species were also distinctly                 M. fructicola and were not found in the mitogenomes of isolates
related with the other species from Heliotales (Figure 7).                        of M. laxa. The origin and/or the duplication of this unknown
                                                                                  sequence could be due to the mobility of mobile introns. Since
                                                                                  this sequence was found within an rRNA-encoding gene, a group
DISCUSSION                                                                        I intron-encoding RNA working as a ribozyme could be the
                                                                                  source for this sequence. This further indicates that dynamism
In this study, the complete mitogenomes of M. fructicola and                      has been shaping the evolution and structure of the fungal
M. laxa isolates were evaluated in-depth to understand variations                 mitogenomes continuously.
within and between the species utilizing the pan-mitogenomic                          Fungal mitogenomes are known to have a high AT content, as
approach. The sizes of the 16 mitogenomes varied from 158,607                     confirmed in this study as well as in previous studies (Torriani
to 179,780 bp. The length of fungal mitogenomes is highly                         et al., 2014; Franco et al., 2017). The high GC content of genomes
variable among the fungal species. It can range from 30 kb for                    was reported to affect the genome to evolve the advantage to
the yeast Candida parapsilosis (Nosek et al., 2004) to 235 kb for                 maintain DNA stability in the high temperature, UV exposure,
Rhizoctonia solani (Losada et al., 2014). Based on the published                  and fungicides (Musto et al., 2006; Marsolier-Kergoat, 2013).
data, mitogenomes of Monilinia pathogens seem to be quite                         Furthermore, GC content has an important effect on evolutionary
large compared with other fungal mitogenomes. S. borealis,                        selection, recombination, gene conversion, and recombination in
S. sclerotiorum, and Botrytis cinerea, closely related genera to                  fungal plant pathogens (Stukenbrock and Dutheil, 2018). These
Monilinia, presented mitogenomes of be 203, 128, and 82 kb                        considerations can be extended to mitogenomes as well.
in size, respectively (Mardanov et al., 2014). Mitogenome size                        Fungal mitogenomes have clustered with many tRNA genes
differences are mainly related to the number and size of introns                  with the different anticodons, indicating a strong preference for
and repetitive elements that constitute the accessory part of                     A or T, in the third position of codons. This strong preference
the mitogenomes. Moreover, a variable number of genes of                          using A/T has been defined in other species as wobble pairing
tRNAs, as well as loss/gain of some genes, such as nad and                        and codon usage bias (Novoa and de Pouplana, 2012; Wei et al.,
atp subunits, affect the mitogenome sizes (Aguileta et al., 2014;                 2014). However, having the decoders or iso-acceptors may cause
Franco et al., 2017; Li X. et al., 2020; Yildiz and Ozkilinc, 2020).              mischarging (Pan, 2018), but this situation was not discussed or
In our study, the main factors that determined the differences                    shown in any fungal mitochondrial genome.
in size of mitogenomes were introns, mobile intron groups, and                        Repetitive elements were 1.23–1.69% in the mitogenomes
repetitive sequences. Moreover, an unknown sequence and its                       assessed in this study. The total number of these elements was

Frontiers in Microbiology | www.frontiersin.org                              10                                          May 2021 | Volume 12 | Article 647989
Yildiz and Ozkilinc Pan-Mitogenomics of Brown Rot Fungal Pathogens
FIGURE 7 | Maximum likelihood tree inferred from the dataset of amino acid sequences of the 14 core mitochondrial genes and ribosomal protein for Monilinia
isolates used in this study and other species of the Helotiales obtained from the NCBI GenBank. Node numbers show bootstrap support values. Concatenated order
follows as cox1, nad4, cob (cytb), atp9, nad2, nad3, cox2, nad4l, nad5, nad6, cox3, nad1, atp8, atp6, and rps3. Node numbers show bootstrap support values.
found greater and more diverse in M. laxa than in M. fructicola. accessory regions in the nuclear genomes may change to adapt
Expansion of repetitive elements may have caused replication to evolutionary processes among the fungal isolates of the same
slippage and the correction of mitochondrial replication process species (Plissonneau et al., 2018; Badet and Croll, 2020). However,
together with proofreading efficiency may differ among the the effects of accessory regions of mitogenomes on different
species. It is known that repeat-rich areas evolve more rapidly fungal traits have not been clarified. Mobile introns are another
than other genomic regions (Raffaele and Kamoun, 2012; Dong primary source of the size difference for mitogenomes that are
et al., 2015). If the repeat-rich regions locate within genic regions, highly found in both Monilinia species. Our previous study
changes in these elements may indicate evolutionary selections showed that M. laxa was the most intron-rich species compared
of certain traits such as resistance or host adaptation (Raffaele with closely related species from other genera (Yildiz and
et al., 2010; Nardi et al., 2012). Furthermore, exploring repetitive Ozkilinc, 2020). These mobile introns included many different
elements in mitogenomes could be highly useful in population elements from group I in both species as well as group II
genetics analyses, and they could have an important role for introns in M. fructicola. Relatedness and phylogenetic signals
the dynamic structure of mitogenomes. Besides, mitochondrial of these elements within and between Monilinia species is
repetitive elements can be useful molecular markers to study another question that requires further investigations. Besides,
population structures. these elements may have a contribution to certain traits such as
Core PCGs related to mitochondrial OXPHOS and ATP virulence or fungicide resistance, and our ongoing studies have
synthesis are usually essential for the organisms’ life and, thus, been directed to answer those questions.
highly conserved within the mitogenomes. However, accessory Pan-mitogenomics approach identified that the core and
regions could affect some traits, such as pathogenesis and accessory compartmentalizations occurred within M. fructicola
virulence reference (Tettelin et al., 2008), and not be crucial species. Even though isolates of M. laxa carried many different
for the survival of the organism. We observed a negative introns, mobile elements, and repetitive sequences considered
correlation between mitogenome size and virulence degree for as an accessory part of the genomes, these sequences were
these isolates (unpublished data by HÖ). It is well known that mainly conserved among the mitogenomes within this species.
Frontiers in Microbiology | www.frontiersin.org 11 May 2021 | Volume 12 | Article 647989Yildiz and Ozkilinc Pan-Mitogenomics of Brown Rot Fungal Pathogens
Only one isolate of M. laxa diverged from the other M. laxa DATA AVAILABILITY STATEMENT
isolates with a unique region that was represented as a variable
part for the mitogenomes of M. laxa. This approach indicates The first mitogenome of M. fructicola was submitted in this
that introns, mobile groups, and repetition patterns are highly study can be found in GenBank (Accession number MT005827).
conserved and stable within the mitogenomes of M. laxa. In Besides, the mitogenome of M. laxa used in this study, was
contrast, the mitogenomes of M. fructicola showed variability and submitted in our previous research and can be found in GenBank
dynamism within the species. This could be related to possible (Accession number MN881998.1). All the mitogenomes was
recombination and/or selection pressures on mitogenomes of submitted to GenBank with following accession numbers for
M. fructicola. each isolate used in this study: MW794295 for isolate B5-
A/T and G/C skewness varied among the PCGs as well A4, MW794296 for isolate BG-B1-A17, MW794297 for isolate
as between the species for some genes. Interestingly, genes SC-B2-A4, MW794298 for T-B1-A5, MW794299 for isolate
related to ribosomal RNA and protein synthesis were in positive Ti-B3-A2, MW794300 for isolate Ti-B3-A3-2, MW794301 for
G/C and A/T skewness, indicating the richness of G and isolate Yolkenari-1, MW794302 for isolate Yildirim-2-10th,
A over C and T, respectively. GC compositions were also MW794303 for isolate Yildirim-1, MW794304 for isolate T-B1-
interpreted as related to transcription start sites in plants and A4-2, MW794305 for isolate MT-B1-A3-1, MW794306 for isolate
fungi (Fujimori et al., 2005). The different skewness along the MM-B4-A4, MW794307 for isolate MM-B2-A2, and MW794308
regions may also indicate diverse selection pressures on two for isolate 2B1-A5.
species. This study indicated that most of the coding genes
have been evolving under strong purifying selection between
the species according to the Ka/Ks ratios. Diversely, cytb was
under a positive selection signal between the species. Cytb gene
AUTHOR CONTRIBUTIONS
is one of the target regions of respiratory inhibitors that have
GY performed laboratory work and all the data analyses. HO
been intensively used against fungal plant pathogens. Positive
designed the research, recommended, and directed the data
selection signals on this gene could be related to different
analysis methods, and controlled all steps of the study. Both
adaptation responses of the species against fungicide selection
authors confirmed and discussed the results and wrote the
pressure, which will be discussed in our further study for
article together.
these pathogens.
Amino acid sequences of the core mitochondrial PCGs and
rps3 were fully conserved within M. fructicola and M. laxa
species. Combined protein-coding data set based on ML FUNDING
phylogenetic indicated that these two species are highly diverged
from each other as well as some from other fungal species This study was supported by TUBITAK (Scientific and
from the Heliotales group. However, since one of the main Technological Research Council of Turkey) project no. 217Z134,
variation contributors is the mobile introns, phylogenetic effects granted to HO.
of these elements would be interesting. Mobile introns may shape
evolutionary relationships differently in comparison with core
PCGs as presented by Megarioti and Kouvelis (2020). Besides,
SUPPLEMENTARY MATERIAL
mobile introns may reveal evolving lineages within each fungal
species, and this will be investigated in a further study. The Supplementary Material for this article can be found
Considerable mitogenomic variations were observed within online at: https://www.frontiersin.org/articles/10.3389/fmicb.
and between these two important pathogenic species within the 2021.647989/full#supplementary-material
Monilinia genus. Fungal mitochondrial genomes are still waiting
for many hidden information on fungal traits and evolution. Supplementary Table 1 | Characterization of annotated mitochondrial genes in
Pangenomic approach is successfully applicable for fungal Monilinia fructicola-Isolate BG-B1-A4, accession number: MT005827.
mitogenomes due to relatively expanded accessory regions, as Supplementary Table 2 | Set of 32 tRNAs encoding different anticodons in the
shown in this study. Since these organisms are important mitogenomes of Monilinia fructicola and Monilinia laxa species.
plant pathogens worldwide, resolving their mitogenomes may Supplementary Table 3 | Dataset of the relative synonymous codon usage
suggest new disease management strategies and predictions in (RSCU) and the total number of usages for each of the codons in the 14
evolutionary trajectories of the pathogens and the disease. mitochondrial PCGs, and rps3.
REFERENCES Badet, T., and Croll, D. (2020). The rise and fall of genes: origins and functions of
plant pathogen pangenomes. Curr. Opin. Plant Biol. 56, 65–73. doi: 10.1016/j.
Aguileta, G., De Vienne, D. M., Ross, O. N., Hood, M. E., Giraud, T., Petit, E., et al. pbi.2020.04.009
(2014). High variability of mitochondrial gene order among fungi. Genome Biol. Badet, T., Oggenfuss, U., Abraham, L., McDonald, B. A., and Croll, D.
Evol. 6, 451–465. doi: 10.1093/gbe/evu028 (2020). A 19-isolate reference-quality global pangenome for the fungal wheat
Andrews, S. (2010). FastQC: A Quality Control Tool for High Throughput Sequence pathogen Zymoseptoria tritici. BMC Biol. 18:12. doi: 10.1186/s12915-020-
Data. Babraham: Babraham Institute. 0744-3
Frontiers in Microbiology | www.frontiersin.org 12 May 2021 | Volume 12 | Article 647989Yildiz and Ozkilinc Pan-Mitogenomics of Brown Rot Fungal Pathogens
Badotti, F., de Oliveira, F. S., Garcia, C. F., Vaz, A. B. M., Fonseca, P. L. C., Nahum, Kearse, M., Moir, R., Wilson, A., Stones-Havas, S., Cheung, M., Sturrock, S.,
L. A., et al. (2017). Effectiveness of ITS and sub-regions as DNA barcode et al. (2012). Geneious Basic: an integrated and extendable desktop software
markers for the identification of Basidiomycota (Fungi). BMC Microbiol. 17:42. platform for the organization and analysis of sequence data. Bioinformatics 28,
doi: 10.1186/s12866-017-0958-x 1647–1649. doi: 10.1093/bioinformatics/bts199
Bankevich, A., Nurk, S., Antipov, D., Gurevich, A. A., Dvorkin, M., Kulikov, A. S., Kelly, A. C., and Ward, T. J. (2018). Population genomics of Fusarium
et al. (2012). SPAdes: a new genome assembly algorithm and its applications graminearum reveals signatures of divergent evolution within a major cereal
to single-cell sequencing. J. Comput. Biol. 19, 455–477. doi: 10.1089/cmb.2012. pathogen. PLoS One 13:e0194616. doi: 10.1371/journal.pone.0194616
0021 Kolesnikova, A. I., Putintseva, Y. A., Simonov, E. P., Biriukov, V. V., Oreshkova,
Basse, C. W. (2010). Mitochondrial inheritance in fungi. Curr. Opin. Microbiol. 13, N. V., Pavlov, I. N., et al. (2019). Mobile genetic elements explain size variation
712–719. doi: 10.1016/j.mib.2010.09.003 in the mitochondrial genomes of four closely-related Armillaria species. BMC
Beck, N., and Lang, B. (2010). MFannot, Organelle Genome Annotation Websever. Genomics 20:351. doi: 10.1186/s12864-019-5732-z
Montréal QC: Université de Montréal. Korovesi, A. G., Ntertilis, M., and Kouvelis, V. N. (2018). Mt-rps3 is an ancient gene
Benson, G. (1999). Tandem repeats finder: a program to analyze DNA sequences. which provides insight into the evolution of fungal mitochondrial genomes.
Nucleic Acids Res. 27, 573–580. doi: 10.1093/nar/27.2.573 Mol. Phylogenet. Evol. 127, 74–86. doi: 10.1016/j.ympev.2018.04.037
Bernt, M., Donath, A., Jühling, F., Externbrink, F., Florentz, C., Fritzsch, G., Kumar, S., Stecher, G., and Tamura, K. (2016). MEGA7: molecular evolutionary
et al. (2013). MITOS: improved de novo metazoan mitochondrial genome genetics analysis version 7.0 for bigger datasets. Mol. Biol. Evol. 33, 1870–1874.
annotation. Mol. Phylogenet. Evol. 69, 313–319. doi: 10.1016/j.ympev.2012. doi: 10.1093/molbev/msw054
08.023 Li, Q., Ren, Y., Xiang, D., Shi, X., Zhao, J., Peng, L., et al. (2020). Comparative
Bertazzoni, S., Williams, A. H., Jones, D. A., Syme, R. A., Tan, K.-C., and mitogenome analysis of two ectomycorrhizal fungi (Paxillus) reveals gene
Hane, J. K. (2018). Accessories make the outfit: accessory chromosomes and rearrangement, intron dynamics, and phylogeny of basidiomycetes. IMA
other dispensable DNA regions in plant-pathogenic Fungi. Mol. Plant Microbe Fungus 11:12. doi: 10.1186/s43008-020-00038-8
Interact. 31, 779–788. doi: 10.1094/MPMI-06-17-0135-FI Li, X., Li, L., Bao, Z., Tu, W., He, X., Zhang, B., et al. (2020). The 287,403 bp
Blackwell, M. (2011). The Fungi: 1, 2, 3. . . 5.1 million species? Am. J. Bot. 98, Mitochondrial Genome of Ectomycorrhizal Fungus Tuber calosporum Reveals
426–438. doi: 10.3732/ajb.1000298 Intron Expansion, tRNA Loss, and Gene Rearrangement. Front. Microbiol.
Bolger, A. M., Lohse, M., and Usadel, B. (2014). Trimmomatic: a flexible 11:591453. doi: 10.3389/fmicb.2020.591453
trimmer for Illumina sequence data. Bioinformatics 30, 2114–2120. doi: 10. Losada, L., Pakala, S. B., Fedorova, N. D., Joardar, V., Shabalina, S. A., Hostetler, J.,
1093/bioinformatics/btu170 et al. (2014). Mobile elements and mitochondrial genome expansion in the soil
Brankovics, B., Kulik, T., Sawicki, J., Bilska, K., Zhang, H., de Hoog, G. S., et al. fungus and potato pathogen Rhizoctonia solani AG-3. FEMS Microbiol. Lett.
(2018). First steps towards mitochondrial pan-genomics: detailed analysis of 352, 165–173. doi: 10.1111/1574-6968.12387
Fusarium graminearum mitogenomes. PeerJ 6:e5963. doi: 10.7717/peerj.5963 Lowe, T. M., and Chan, P. P. (2016). tRNAscan-SE On-line: integrating search and
Bullerwell, C. E., Burger, G., and Lang, B. F. (2000). A novel motif for identifying context for analysis of transfer RNA genes. Nucleic Acids Res. 44, W54–W57.
rps3 homologs in fungal mitochondrial genomes. Trends Biochem. Sci. 25, doi: 10.1093/nar/gkw413
363–365. doi: 10.1016/s0968-0004(00)01612-1 Mardanov, A. V., Beletsky, A. V., Kadnikov, V. V., Ignatov, A. N., and Ravin,
Burger, G., Gray, M. W., and Lang, B. F. (2003). Mitochondrial genomes: anything N. V. (2014). The 203 kbp mitochondrial genome of the phytopathogenic
goes. Trends Genet. 19, 709–716. doi: 10.1016/j.tig.2003.10.012 fungus Sclerotinia borealis reveals multiple invasions of introns and genomic
Chen, C., Li, Q., Fu, R., Wang, J., Xiong, C., Fan, Z., et al. (2019). duplications. PLoS One 9:e107536. doi: 10.1371/journal.pone.0107536
Characterization of the mitochondrial genome of the pathogenic fungus Marsolier-Kergoat, M.-C. (2013). Models for the evolution of GC content in
Scytalidium auriculariicola (Leotiomycetes) and insights into its phylogenetics. asexual fungi Candida albicans and C. dubliniensis. Genome Biol. Evol. 5,
Sci. Rep. 9:17447. doi: 10.1038/s41598-019-53941-5 2205–2216. doi: 10.1093/gbe/evt170
Darling, A. E., Mau, B., and Perna, N. T. (2010). progressiveMauve: multiple McCarthy, C. G., and Fitzpatrick, D. A. (2019). Pan-genome analyses of model
genome alignment with gene gain, loss and rearrangement. PLoS One 5:e11147. fungal species. Microb. Genom. 5:e000243. doi: 10.1099/mgen.0.000243
doi: 10.1371/journal.pone.0011147 Medina, R., Franco, M. E. E., Bartel, L. C., Martinez Alcantara, V., Saparrat, M. C.,
Dong, S., Raffaele, S., and Kamoun, S. (2015). The two-speed genomes of and Balatti, P. A. (2020). Fungal mitogenomes: relevant features to planning
filamentous pathogens: waltz with plants. Curr. Opin. Genet. Dev. 35, 57–65. plant disease management. Front. Microbiol. 11:978. doi: 10.3389/fmicb.2020.
doi: 10.1016/j.gde.2015.09.001 00978
Franco, M. E. E., López, S. M. Y., Medina, R., Lucentini, C. G., Troncozo, Megarioti, A. H., and Kouvelis, V. N. (2020). The coevolution of fungal
M. I., Pastorino, G. N., et al. (2017). The mitochondrial genome of the plant- mitochondrial introns and their homing endonucleases (GIY-YIG and
pathogenic fungus Stemphylium lycopersici uncovers a dynamic structure due LAGLIDADG). Genome Biol. Evol. 12, 1337–1354. doi: 10.1093/gbe/evaa126
to repetitive and mobile elements. PLoS One 12:e0185545. doi: 10.1371/journal. Musto, H., Naya, H., Zavala, A., Romero, H., Alvarez-Valín, F., and Bernardi, G.
pone.0185545 (2006). Genomic GC level, optimal growth temperature, and genome size in
Fujimori, S., Washio, T., and Tomita, M. (2005). GC-compositional strand bias prokaryotes. Biochem. Biophys. Res. Commun. 347, 1–3. doi: 10.1016/j.bbrc.
around transcription start sites in plants and fungi. BMC Genomics 6:26. doi: 2006.06.054
10.1186/1471-2164-6-26 Nardi, F., Carapelli, A., and Frati, F. (2012). Repeated regions in mitochondrial
Gurevich, A., Saveliev, V., Vyahhi, N., and Tesler, G. (2013). QUAST: quality genomes: distribution, origin and evolutionary significance. Mitochondrion 12,
assessment tool for genome assemblies. Bioinformatics 29, 1072–1075. doi: 10. 483–491. doi: 10.1016/j.mito.2012.07.105
1093/bioinformatics/btt086 Nie, Y., Wang, L., Cai, Y., Tao, W., Zhang, Y. J., and Huang, B. (2019).
Holb, I. (2006). Possibilities of brown rot management in organic stone fruit Mitochondrial genome of the entomophthoroid fungus Conidiobolus
production in Hungary. Int. J. Hortic. Sci. 12, 87–91. heterosporus provides insights into evolution of basal fungi. Appl. Microbiol.
Holb, I. (2008). Brown rot blossom blight of pome and stone fruits: symptom, Biotechnol. 103, 1379–1391. doi: 10.1007/s00253-018-9549-5
disease cycle, host resistance, and biological control. Int. J. Hortic. Sci. 14, Nosek, J., Novotna, M., Hlavatovicova, Z., Ussery, D., Fajkus, J., and Tomaska,
15–21. L. (2004). Complete DNA sequence of the linear mitochondrial genome of
Jin, J.-J., Yu, W.-B., Yang, J.-B., Song, Y., dePamphilis, C. W., Yi, T.-S., et al. the pathogenic yeast Candida parapsilosis. Mol. Genet. Genomics 272, 173–180.
(2019). GetOrganelle: a fast and versatile toolkit for accurate de novo assembly doi: 10.1007/s00438-004-1046-0
of organelle genomes. bioRxiv [Preprint]. doi: 10.1186/s13059-020-02154-5 Novoa, E. M., and de Pouplana, L. R. (2012). Speeding with control: codon usage,
Joardar, V., Abrams, N. F., Hostetler, J., Paukstelis, P. J., Pakala, S., Pakala, S. B., tRNAs, and ribosomes. Trends Genet. 28, 574–581. doi: 10.1016/j.tig.2012.
et al. (2012). Sequencing of mitochondrial genomes of nine Aspergillus and 07.006
Penicillium species identifies mobile introns and accessory genes as main Ozer, E. A., Allen, J. P., and Hauser, A. R. (2014). Characterization of the core and
sources of genome size variability. BMC Genomics 13:698. doi: 10.1186/1471- accessory genomes of Pseudomonas aeruginosa using bioinformatic tools Spine
2164-13-698 and AGEnt. BMC Genomics 15:737. doi: 10.1186/1471-2164-15-737
Frontiers in Microbiology | www.frontiersin.org 13 May 2021 | Volume 12 | Article 647989Yildiz and Ozkilinc Pan-Mitogenomics of Brown Rot Fungal Pathogens
Ozkilinc, H., Yildiz, G., Silan, E., Arslan, K., Guven, H., Altinok, H. H., et al. (2020). Stajich, J. E. (2017). “Fungal genomes and insights into the evolution of the
Species diversity, mating type assays and aggressiveness patterns of Monilinia kingdom,” in The Microbiol. Spectr. 5:10.1128/microbiolspec.FUNK-0055-
pathogens causing brown rot of peach fruit in Turkey. Eur. J. Plant Pathol. 157, 2016.
799–814. doi: 10.1007/s10658-020-02040-7 Stothard, P. (2000). The sequence manipulation suite: JavaScript programs for
Pan, T. (2018). Modifications and functional genomics of human transfer RNA. analyzing and formatting protein and DNA sequences. Biotechniques 28, 1102–
Cell Res. 28, 395–404. doi: 10.1038/s41422-018-0013-y 1104. doi: 10.2144/00286ir01
Plissonneau, C., Hartmann, F. E., and Croll, D. (2018). Pangenome analyses of the Stukenbrock, E. H., and Dutheil, J. Y. (2018). Fine-scale recombination maps
wheat pathogen Zymoseptoria tritici reveal the structural basis of a highly plastic of fungal plant pathogens reveal dynamic recombination landscapes and
eukaryotic genome. BMC Biol. 16:5. doi: 10.1186/s12915-017-0457-4 intragenic hotspots. Genetics 208, 1209–1229. doi: 10.1534/genetics.117.300502
R Core Team (2013). R: A Language and Environment for Statistical Computing. Tettelin, H., Riley, D., Cattuto, C., and Medini, D. (2008). Comparative genomics:
Vienna: R Foundation for Statistical Computing. the bacterial pan-genome. Curr. Opin. Microbiol. 11, 472–477. doi: 10.1016/j.
Raffaele, S., Farrer, R. A., Cano, L. M., Studholme, D. J., MacLean, D., Thines, M., mib.2008.09.006
et al. (2010). Genome evolution following host jumps in the Irish potato famine Torres, D. E., Oggenfuss, U., Croll, D., and Seidl, M. F. (2020). Genome
pathogen lineage. Science 330, 1540–1543. doi: 10.1126/science.1193070 evolution in fungal plant pathogens: looking beyond the two-speed
Raffaele, S., and Kamoun, S. (2012). Genome evolution in filamentous plant genome model. Fungal Biol. Rev. 34, 136–143. doi: 10.1016/j.fbr.2020.
pathogens: why bigger can be better. Nat. Rev. Microbiol. 10, 417–430. doi: 07.001
10.1038/nrmicro2790 Torriani, S. F., Penselin, D., Knogge, W., Felder, M., Taudien, S., Platzer, M., et al.
Rambaut, A. (2012). FigTree v1. 4. Oxford: University of Oxford. (2014). Comparative analysis of mitochondrial genomes from closely related
Rozas, J., Ferrer-Mata, A., Sánchez-DelBarrio, J. C., Guirao-Rico, S., Librado, P., Rhynchosporium species reveals extensive intron invasion. Fungal Genet. Biol.
Ramos-Onsins, S. E., et al. (2017). DnaSP 6: DNA sequence polymorphism 62, 34–42. doi: 10.1016/j.fgb.2013.11.001
analysis of large data sets. Mol. Biol. Evol. 34, 3299–3302. doi: 10.1093/molbev/ Wei, L., He, J., Jia, X., Qi, Q., Liang, Z., Zheng, H., et al. (2014). Analysis
msx248 of codon usage bias of mitochondrial genome in Bombyx moriand its
Sandor, S., Zhang, Y., and Xu, J. (2018). Fungal mitochondrial genomes and relation to evolution. BMC Evol. Biol. 14:262. doi: 10.1186/s12862-014-
genetic polymorphisms. Appl. Microbiol. Biotechnol. 102, 9433–9448. doi: 10. 0262-4
1007/s00253-018-9350-5 Yildiz, G., and Ozkilinc, H. (2020). First characterization of the complete
Santamaria, M., Vicario, S., Pappadà, G., Scioscia, G., Scazzocchio, C., and Saccone, mitochondrial genome of fungal plant-pathogen Monilinia laxa which
C. (2009). Towards barcode markers in Fungi: an intron map of Ascomycota represents the mobile intron rich structure. Sci. Rep. 10:13644. doi: 10.1038/
mitochondria. BMC Bioinformatics 10(Suppl. 6):S15. doi: 10.1186/1471-2105- s41598-020-70611-z
10-S6-S15
Sethuraman, J., Majer, A., Iranpour, M., and Hausner, G. (2009). Molecular Conflict of Interest: The authors declare that the research was conducted in the
evolution of the mtDNA encoded rps3 gene among filamentous ascomycetes absence of any commercial or financial relationships that could be construed as a
fungi with an emphasis on the Ophiostomatoid fungi. J. Mol. Evol. 69, 372–385. potential conflict of interest.
doi: 10.1007/s00239-009-9291-9
Silvestro, D., and Michalak, I. (2012). raxmlGUI: a graphical front-end for RAxML. Copyright © 2021 Yildiz and Ozkilinc. This is an open-access article distributed
Org. Divers. Evol. 12, 335–337. doi: 10.1007/s13127-011-0056-0 under the terms of the Creative Commons Attribution License (CC BY). The use,
Smits, P., Smeitink, J. A., van den Heuvel, L. P., Huynen, M. A., and distribution or reproduction in other forums is permitted, provided the original
Ettema, T. J. (2007). Reconstructing the evolution of the mitochondrial author(s) and the copyright owner(s) are credited and that the original publication
ribosomal proteome. Nucleic Acids Res. 35, 4686–4703. doi: 10.1093/nar/ in this journal is cited, in accordance with accepted academic practice. No use,
gkm441 distribution or reproduction is permitted which does not comply with these terms.
Frontiers in Microbiology | www.frontiersin.org 14 May 2021 | Volume 12 | Article 647989You can also read