Premium Rock, Returns, Runway

Page created by Claude Kim
 
CONTINUE READING
Premium Rock, Returns, Runway
B A R C L AY S C E O E N E R G Y- P O W E R C O N F E R E N C E
SEPTEMBER 2022
Premium Rock, Returns, Runway
Forward-Looking Statements
This presentation and the accompanying outlook include “forward-looking statements” within the meaning of Section 27A of the Securities Act of 1933 and Section 21E of the Securities Exchange
Act of 1934. Forward-looking statements are statements other than statements of historical fact. They include statements that give our current expectations, management’s outlook guidance or
forecasts of future events, expected natural gas and oil growth trajectory, projected cash flow and liquidity, our ability to enhance our cash flow and financial flexibility, returns to shareholders
through dividend plans and equity repurchases, portfolio/inventory returns, future production and commodity mix, plans and objectives for future operations, ESG initiatives, the ability of our
employees, portfolio strength and operational leadership to create long-term value, and the assumptions on which such statements are based. Although we believe the expectations and forecasts
reflected in our forward-looking statements are reasonable, they are inherently subject to numerous risks and uncertainties, most of which are difficult to predict and many of which are beyond our
control. No assurance can be given that such forward-looking statements will be correct or achieved or that the assumptions are accurate or will not change over time.

Factors that could cause actual results to differ materially from expected results include those described under “Risk Factors” in Item 1A of our annual report on Form 10-K and any updates to
those factors set forth in Chesapeake’s subsequent quarterly reports on Form 10-Q or current reports on Form 8-K (available at http://www.chk.com/investors/sec-filings). These risk factors
include: the ability to execute on our business strategy following emergence from bankruptcy; inflation and commodity price volatility resulting from Russia’s invasion of Ukraine, COVID-19 and
related supply chain constraints, along with the effect on our business, financial condition, employees, contractors and vendors, and on the global demand for oil and natural gas and U.S. and
world financial markets; risks related to the acquisition of Chief E&D Holdings, LP and affiliates of Tug Hill, Inc. (together, “Chief”), including our ability to successfully integrate the business of
Chief into the company and achieve the expected synergies from the Chief acquisition within the expected timeframe; the volatility of oil, natural gas and NGL prices; the limitations our level of
indebtedness may have on our financial flexibility; our inability to access the capital markets on favorable terms; the availability of cash flows from operations and other funds to fund cash
dividends and equity repurchases, to finance reserve replacement costs and/or satisfy our debt obligations; write-downs of our oil and natural gas asset carrying values due to low commodity
prices; our ability to replace reserves and sustain production; uncertainties inherent in estimating quantities of oil, natural gas and NGL reserves and projecting future rates of production and the
amount and timing of development expenditures; our ability to generate profits or achieve targeted results in drilling and well operations; leasehold terms expiring before production can be
established; commodity derivative activities resulting in lower prices realized on oil, natural gas and NGL sales; the need to secure derivative liabilities and the inability of counterparties to satisfy
their obligations; adverse developments or losses from pending or future litigation and regulatory proceedings, including royalty claims; charges incurred in response to market conditions; drilling
and operating risks and resulting liabilities; effects of environmental protection laws and regulations on our business; legislative and regulatory initiatives further regulating hydraulic fracturing; our
ability to achieve and maintain ESG certifications/goals; our need to secure adequate supplies of water for our drilling operations and to dispose of or recycle the water used; impacts of potential
legislative and regulatory actions addressing climate change; federal and state tax proposals affecting our industry; potential OTC derivatives regulation limiting our ability to hedge against
commodity price fluctuations; competition in the oil and gas exploration and production industry; a deterioration in general economic, business or industry conditions; negative public perceptions
of our industry; limited control over properties we do not operate; pipeline and gathering system capacity constraints and transportation interruptions; terrorist activities and cyber-attacks
adversely impacting our operations; and an interruption in operations at our headquarters due to a catastrophic event.

In addition, disclosures concerning the estimated contribution of derivative contracts to our future results of operations are based upon market information as of a specific date. These market
prices are subject to significant volatility. Our production forecasts are also dependent upon many assumptions, including estimates of production decline rates from existing wells and the
outcome of future drilling activity. We caution you not to place undue reliance on our forward-looking statements that speak only as of the date of this presentation, and we undertake no obligation
to update any of the information provided in this presentation, except as required by applicable law. In addition, this presentation contains time-sensitive information that reflects management’s
best judgment only as of the date of this presentation.

                          Barclays CEO Energy-Power Conference – September 2022                                                                                                                           2
Premium Rock, Returns, Runway

  STRATEGIC PILLARS

  Superior
                                                 Most efficient operator, returning more cash
  Capital Returns                                to shareholders than any other gas peer in the U.S.

  Deep, Attractive                                                  >15 years of inventory
                                                 Premier natural gas portfolio with
                                                                                                                           (1)

  Inventory                                      >2,200 gas locations at $4.00 flat pricing >100% IRR

  Premier
  Balance Sheet
                                                 ~0.5x net debt-to-NTM-EBITDAX ratio                              (2)

  ESG                                            Achieved Grade “A” MiQ and EO100 certification              TM

  Excellence                                     Highest available grade for legacy Marcellus and Haynesville operations

            (1) Assume 88 wells per year in Marcellus and Haynesville each
            (2) 6/30/2022 net debt balance as a ratio to consensus NTM EBITDAX

            Barclays CEO Energy-Power Conference – September 2022                                                                3
Premium Rock, Returns, Runway
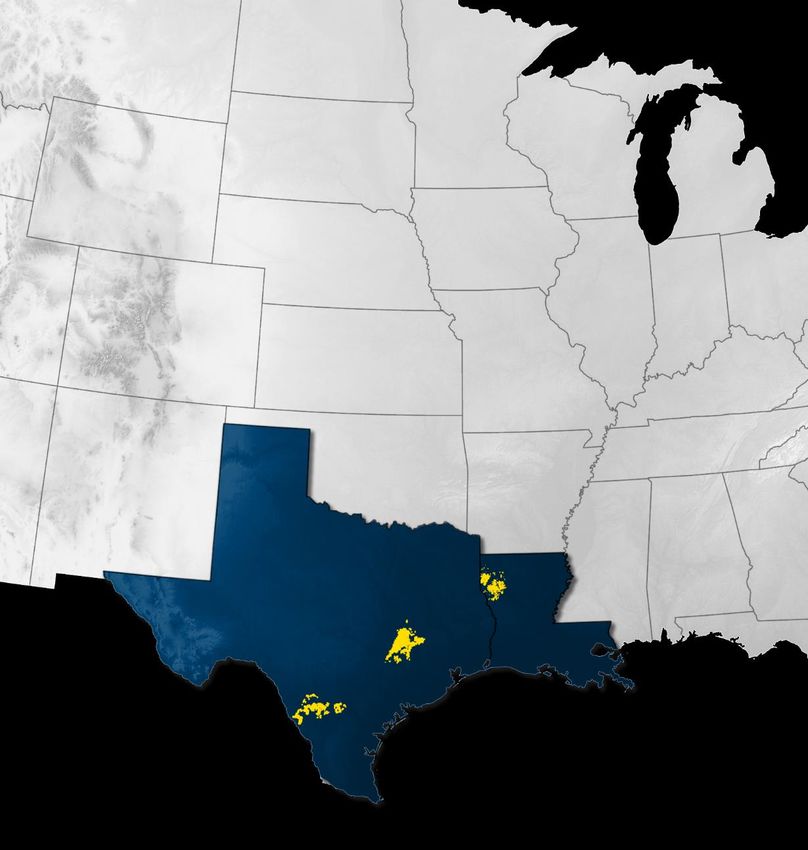
Leading Our Peers: Better Rock, Better Returns, Better Runway
                     Leading Depth of Inventory – Enverus Net Locations(1)                                                                                                            2022 Wells, First 3-Month Gas Production – Enverus mmcf/d(3)

             CHK is #1 in quality and #2 highest inventory                                                                                                                    CHK has 17 of highest 20 IP90s in North America
                                                                                                                       2,809                                                            LINSKI 25HC                                                                                 39.4
                                                                                                                                                                                        LINSKI 24HC                                                                                38.7
            1,844                                                                   1,841
                                                                                                                                                                                       LINSKI 126HC                                                                                38.3
                                                                                                     1,287
                                                 1,015
                                                                                                                                                           CAHILL REALTY BUSINESS UNIT 2H                                                                                  35.5
                                                                    769
                         707      599                                                                                                                      CAHILL REALTY BUSINESS UNIT 1H                                                                               33.3
                                                                                                                                                                       SCHION 13-24 HC 001-ALT                                                                    31.6

           CHK – Gas    Peer 1   Peer 2         Peer 3            Peer 4           Peer 5            Peer 6           Peer 7                                           SCHION 18-19 HC 001-ALT                                                                   30.9
            Assets                                                                                                                                                                MARBAKER 26HC                                                                  30.5
Weighted
              119%       56%      79%             67%               97%              76%              116%              71%
Avg IRR                                                                                                                                                                                AMCOR 21HC                                                             29.2
                                                                                                                                                                                       AMCOR 22HC                                                         28.7

                           Best Capital Efficiency – Enverus $/mcfe                                 (2)                                                    CAHILL REALTY BUSINESS UNIT 3H                                                                 28.3
                                                                                                                                                                                       GMTU MT7-05                                                        28.3
   CHK wells are ~25% more capital efficient than peers                                                                                                                                 RUTH 121HC                                                        28.2
                                                                                                                                                                                  MARBAKER 25HC                                                        26.5

                                                                  $2.71             $2.85            $2.95            $3.05                                                      MARBAKER 124HC                                                    25.7
                                 $2.37           $2.57
            $2.05       $2.09                                                                                                                                 HOPKINS 23&14-15-16HC 002-ALT                                                        25.6
                                                                                                                                                              HOPKINS 23&14-15-16HC 001-ALT                                                       25.4                  CHK Marcellus
                                                                                                                                                               GILLIAM 23&14-13-14HC 002-ALT                                                     24.7                   CHK Haynesville
                                                                                                                                                                                          FINAN 1HC                                             23.8                    Peers
                                                                                                                                                               GILLIAM 23&14-13-14HC 001-ALT                                                    23.8
           CHK – Gas    Peer 1   Peer 2         Peer 3            Peer 4           Peer 5           Peer 6            Peer 7
            Assets

                                    Peer group includes: AR, CNX, CRK, CTRA (Marcellus only), EQT, RRC, SWN.
                                    (1) Source: Public filings and Enverus. Net inventory locations per Enverus estimates; Oil to gas price ratio of 20:1.
                                    (2) Source: Enverus: 2018 – 2021 average single well capex/12-month production.
                                    (3) Source: Enverus: North American wells with first production date after 1/1/2022 and 3 months of production. Well set as of 8/1/2022. Daily rates are 3-month cumulative gas production divided by 90.

                                    Barclays CEO Energy-Power Conference – September 2022                                                                                                                                                                                      4
Premium Rock, Returns, Runway
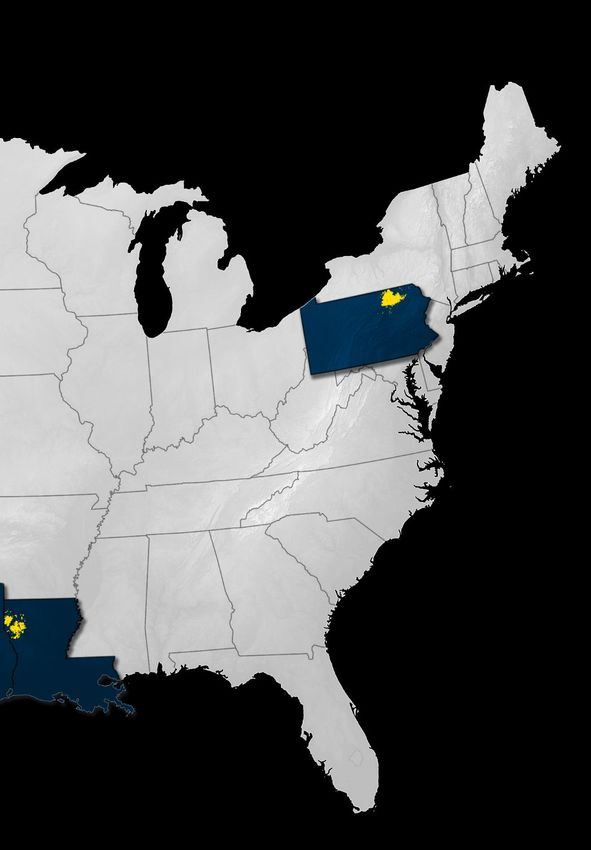
Best-in-Class Shareholder Return Program

➤ #1 returns program of any gas peer
                                                                                                                                                                          2022E Implied Capital Return Yields(2,3)
   • Largest commitment and payout percentage                                                                                                                                             Includes dividends and buybacks

   • Proof of discipline by increasing base dividend
     and aggressively executing buyback program                                                                                                16.0%

➤ Anticipate paying $1.1B – $1.3B in total
  dividends in 2022 (~8% current yield)(1)
                                                                                                                                                                    8.5%
   • 1Q’22 total dividends paid: $210mm                                                                                                                                               7.4%
                                                                                                                                                                                                6.4%
   • 2Q’22 total dividends paid: $298mm                                                                                                                                                                    5.9%

                                                                                                                                                                                                                     3.8%
   • 3Q’22 total dividends paid: $280mm

➤ Completed 1/3rd of $2B share and warrant                                                                                                                                                                                    0.0%     0.0%

                                                                                                                                                  CHK              Peer 1            Peer 3     Peer 6    Peer 5     Peer 7   Peer 2   Peer 4
  repurchase program
   • 7.6mm common shares purchased through
     7/31 at a weighted average price of ~$88 per
     share for a total of ~$670mm
                                                                                                                                                 ✓ ✓ ✓                           Defined Through-Cycle Framework

              Peer group includes: AR, CNX, CRK, CTRA, EQT, RRC, SWN.
              (1) Assumes projections and outlook as of 8/2/2022 and share price data as of 8/31/2022.
              (2) CHK assumes $1 billion of common shares repurchased during 2022.
              (3) Based on consensus estimates as of 7/25 and share price data as of 8/31/2022; Through-cycle framework defined as peers with a committed percent of FCF or CFO return.

              Barclays CEO Energy-Power Conference – September 2022                                                                                                                                                                        5
Premium Rock, Returns, Runway
Premier Balance Sheet

➤ Committed to maintaining strong balance
  sheet, net debt-to-EBITDAX of
Premium Rock, Returns, Runway
Answering the Call for Affordable, Reliable, Lower Carbon Energy
                   CHK’s natural gas portfolio and commitment to deliver sustainable energy are the optimal solutions
                                             for reliable, affordable and lower carbon energy

                • Achieved Grade “A” MiQ and EO100TM
                                                                                      CHK GHG Emissions Intensity                                     CHK Methane Intensity
                  certification for legacy Haynesville and Marcellus                  metric tons CO2e/gross mboe produced              volume methane emissions/volume gross natural gas produced
ENVIRONMENTAL

                • >2,000 continuous methane monitoring devices                  9.1                                                       0.19%
                                                                                                                                                             0.17%
                  operating today paired with periodic Bridger                                        8.2                                           0.16%
                                                                                          7.2
                  Photonics flyovers                                                                             6.0   4.5
                                                                                                                                                                      0.13%
                                                                                                                               4.0
                                                                                                                                                                               0.07%    0.06%
                • Zero routine flaring on wells completed in 2021             CHK PF natural gas plays = 2.3
                  and beyond, enterprise by 2025                                                                                         CHK PF natural gas plays = 0.02%

                • Net zero direct GHG emissions by 2035                        2017      2018      2019         2020   2021   PF 2021      2017     2018     2019      2020     2021    PF 2021

                • Answering today’s energy shortage AND climate concerns                                      • Fresh executive leadership with all Board members having
                                                                                                                less than two years of tenure
                • Culture of transparency, contribution from all employees and

                                                                                                 GOVERNANCE
                  respect for diverse perspectives through our DE&I efforts                                   • Established an ESG Committee dedicated to sustainability
SOCIAL

                                                                                                                strategy and oversight
                • Launched Supplier Diversity Program in 2021
                                                                                                              • Compensation for all employees directly tied to company
                • Investing in systems and processes to enhance royalty                                         performance, shareholder returns and ESG excellence
                  owner engagement
                                                                                                              • Failure to meet ESG performance targets caps bonus payout
                                                                                                                for all other metrics

                              Barclays CEO Energy-Power Conference – September 2022                                                                                                                  7
Premium Rock, Returns, Runway
Marcellus: Premium Scale, Leading Returns
   ➤ Basin leading capital efficiency                                                                                             Gross Inventory by Breakeven

   ➤ ~16 years of drilling using 3 – 5 rigs                                                                  ~14                    ~16                    ~16                    ~16                    ~18
                                                                                                                                  Years of inventory at current pace (3)
   ➤ 2022E BU EBITDAX                $4.0B – $4.1B
                             (1,2)                                                                                                                                                                      1,575
                                                                                                                                   1,430                  1,430                  1,435                                      Upper Marcellus
                                                                                                            1,235                                                                                        760                Lower Marcellus
   ➤ Achieved Grade “A” MiQ and EO100TM certification for legacy Marcellus                                                           760                    760                    760
                                                                                                               610
     operations – projected to be 100% RSG certified by YE’22                                                                                                                                                           Location Assumptions:
                                                                                                                                                                                                                        Average LL = 9,800'
                                                                                                                                                                                                         815
   ➤ Chief integration complete – incremental ~80 gross mmcf/d realized                                        625                   670                    670                    675
                                                                                                                                                                                                                        Average Spacing =
                                                                                                                                                                                                                        1,300' – 1,500'
     through gathering system optimization to date
                                                                                                             $2.25                 $2.50                  $2.75                  $3.00                  Total
                                                                                                                                                                                             Operated Development
                                                                                                                      Operated Development Locations (PV-10) (4)
                                                                                                                                                                                               Locations (PV-0) (5)

$7B
                                                                                   PA                                  Average Cost per Foot and Lateral Length
                                                                                                    $1,000                                                              10,200                                     10,500

                                                                                                       $800              $889                                                                   9,900
5-year projected                                                                                                                                $752
                                                                                                                                                                                                                   10,000
                                                                                                       $600                                                             $710                    $785
FCF(2) net of                                                                                                                                    9,600
                                                                                                                                                                                                                   9,500
allocated hedges,                                                                                      $400
corporate items                                                                                                                                                                                                    9,000
                                                                                                       $200               9,100
and taxes
                                                                                                          $0                                                                                                       8,500
                                                                                                                         2019                   2020                    2021                2022 YTD

                                                                                              (1) BU level EBITDAX based on outlook as of 8/2/2022 and excludes hedges and corporate items
                                                                                              (2) Adjusted strip deck utilizes NYMEX strip pricing as of 7/25/2022 for 2022 ($7.18 HHUB / $97 WTI) and 2023 ($5.92 / $84), then $4.00 / $75 thereafter
                         Lower & Upper Marcellus                                              (3) Assumes 88 wells per year
                                                                             0    6      12   (4) 10% IRR at current spacing assumptions, proven development zones
                         Lower Marcellus                                         Miles        (5) Location counts are based on existing acreage and do not include zones still in early evaluation or exploration wells
                                                                                              Note: Free cash flow and EBITDAX are non-GAAP measures which are defined in the appendix

                     Barclays CEO Energy-Power Conference – September 2022                                                                                                                                                          8
Premium Rock, Returns, Runway
Haynesville: Profitable Growth, Advantaged Markets
   ➤ Basin leading capital efficiency                                                                                          Gross Inventory by Breakeven

   ➤ ~15 years of drilling using 6 – 9 rigs                                                                   ~9                    ~12                   ~12.5                   ~15                    ~18
                                                                                                                                 Years of inventory at current pace (3)
   ➤ 2022E BU EBITDAX                $3.3B – $3.4B
                             (1,2)
                                                                                                                                                                                                         1,530             Bossier
                                                                                                                                                                                 1,300                                     Haynesville
   ➤ First operator to achieve RSG certification basin-wide
                                                                                                                                                                                                         690
                                                                                                                                   1,045                  1,090
                                                                                                                                                                                  685
                                                                                                                                                                                                                        Location Assumptions:
   ➤ Vine integration complete, achieved ~$50mm initial annual synergies                                      790                    615                    630
                                                                                                                                                                                                                        Average LL = 7,500'
                                                                                                              560                                                                                        840
                                                                                                                                                                                                                        Average Spacing =
   ➤ ~15% increase in gas gathering and treatment capacity by 2H’23                                                                                         460
                                                                                                                                                                                  615                                   1,250' – 1,750'
                                                                                                                                     430

   ➤ Focused on firming up gathering, treating, and transport
                                                                                                              230

                                                                                                            $2.25                  $2.50                  $2.75                  $3.00                   Total
                                                                                                                                                                                             Operated Development
                                                                                                                      Operated Development Locations (PV-10) (4)
                                                                                                                                                                                               Locations (PV-0) (5)

                                                                                                                       Average Cost per Foot and Lateral Length

$4B                                                                                                $1,400                                                                                      $1,320               12,000
                                                                                                                       $1,190                                          $1,131
                                                                                                   $1,200                                      $1,085                                                               10,000
                                                                                                   $1,000                9,800
                                                                                                                                                                                                 9,000              8,000
                                                                                                                                                                         8,700
5-year projected                                                                                     $800
                                                                                                                                                                                                                    6,000
                                     TX                                                              $600                                        6,400
FCF(2) net of                                    LA                                                  $400
                                                                                                                                                                                                                    4,000
allocated hedges,                                                                                    $200                                                                                                           2,000
corporate items                                                                                          $0                                                                                                         -
and taxes                                                                                                               2019                    2020                    2021                2022 YTD

                                                                                              (1) BU level EBITDAX based on outlook as of 8/2/2022 and excludes hedges and corporate items
                                                                                              (2) Adjusted strip deck utilizes NYMEX strip pricing as of 7/25/2022 for 2022 ($7.18 HHUB / $97 WTI) and 2023 ($5.92 / $84), then $4.00 / $75 thereafter
                         Haynesville & Bossier                                                (3) Assumes 88 wells per year
                                                                         0   3    6      12   (4) 10% IRR at current spacing assumptions, proven development zones
                         Haynesville                                             Miles        (5) Location counts are based on existing acreage and do not include zones still in early evaluation or exploration wells
                                                                                              Note: Free cash flow and EBITDAX are non-GAAP measures which are defined in the appendix

                     Barclays CEO Energy-Power Conference – September 2022                                                                                                                                                          9
Haynesville: Poised for Growth

➤ Moving from maintenance capital of ~6 rigs
                                                                                       Net Operated Production and Firm Gathering
  to growth with 7 – 8 rigs                                              3.00                                 bcf/d

  • 7th rig added by YE’22

➤ 2023 expected exit rate to increase 5% – 7% YoY
                                                                         2.00

➤ Firming up gathering, treating and transport
  • 100 mmcf/d of interruptible offload added in 2022
  • 1 bcf/d of signed firm gathering and treating added
                                                                         1.00
     - 600 mmcf/d throughout 2023, 400 mmcf/d in 4Q’24
     - Weighted average of ~$0.24/mmbtu
  • 1 bcf/d, nearly half of marketed volumes, of transport
    to Gillis/LNG corridor at market rates added beginning               0.00
    in 2024                                                                 1/1/2021         1/1/2022         1/1/2023             1/1/2024

     - 300 mmcf/d on Golden Pass
                                                                                         Firm Gathering          Actuals
     - 700 mmcf/d on undisclosed pipe and counterparty
                                                                                         Capacity Available      Illustrative Production Forecast
  • Opportunities for small equity stakes and CCUS

                 Barclays CEO Energy-Power Conference – September 2022                                                                              10
Foundations for Value Re-Rating

       Superior
       Capital Returns              ✓ Unwavering commitment to returning cash flow to shareholders
       Deep, Attractive
       Inventory                    ✓ Capital efficient assets that sustainably generate returns
       Premier
       Balance Sheet                ✓        Resilient credit metrics that de-risk equity returns through
                                             commodity price cycles

       ESG
       Excellence                   ✓        Leading emissions profile, commitment to social initiatives
                                             and shareholder-aligned compensation incentives

        Barclays CEO Energy-Power Conference – September 2022                                               11
Appendix
B A R C L AY S C E O E N E R G Y- P O W E R C O N F E R E N C E
SEPTEMBER 2022
Non-GAAP Financial Measures
This document includes non-GAAP financial measures. Such non-GAAP measures should not be considered as an alternative to, or more meaningful than, GAAP measures.
The Company’s management believes that these measures provide useful information to external users of the Company’s consolidated financial statements, such as industry
analysts, lenders and ratings agencies. Due to the forward-looking nature of adjusted EBITDAX, net debt, projected free cash flow, free cash flow yield and free cash flow per
share used herein, management cannot reliably predict certain of the necessary components of the most directly comparable forward-looking GAAP measures. Accordingly, the
Company is unable to present a quantitative reconciliation of such forward-looking non-GAAP financial measures to their most directly comparable forward-looking GAAP
financial measures without unreasonable effort. Amounts excluded from these non-GAAP measures in future periods could be significant.

EBITDAX: Adjusted EBITDAX is a non-GAAP measure used by management to evaluate the Company’s operational trends and performance relative to other oil and natural
gas producing companies. Adjusted EBITDAX excludes certain items that management believes affect the comparability of operating results. The most directly comparable
GAAP measure is net income (loss). Items excluded from net income (loss) to arrive at adjusted EBITDAX include interest expense, income taxes, depreciation, depletion and
amortization expense, and exploration expense as well as one-time items or items whose timing or amount cannot be reasonably estimated.

Net Debt: Net debt is defined as total GAAP debt excluding premiums, discounts, and deferred issuance costs less cash and cash equivalents. Net debt is presented as a
widely understood measure of liquidity, but should not be considered as an alternative to, or more meaningful than, total debt presented in accordance with GAAP.

Free Cash Flow, Free Cash Flow Yield and Free Cash Flow Per Share:
•   Adjusted free cash flow is defined as net cash provided by operating activities (GAAP), less cash capital expenditures.
•   Adjusted free cash flow yield is defined as adjusted free cash flow divided by market capitalization.
•   Adjusted free cash flow per share is defined as adjusted free cash flow divided by the Company’s outstanding shares of common stock.

Adjusted free cash flow, free cash flow yield and adjusted free cash flow per share are non-GAAP supplemental financial measures used by the Company’s management to
assess liquidity, including the Company’s ability to generate cash flow in excess of its capital requirements and return cash to shareholders. Adjusted free cash flow, adjusted
free cash flow yield and adjusted free cash flow per share should not be considered as alternatives to, or more meaningful than, net cash provided by operating activities, or any
other measure of liquidity presented in accordance with GAAP.

                       Barclays CEO Energy-Power Conference – September 2022                                                                                                   13
Glossary
BE: Breakeven – the minimum price at which           GP&T: Gathering, Processing and Transport expense          PDP: Proved Developed Producing – Reserve
cumulative cash flows are zero                                                                                  classification for a producing well
                                                     IP90: Initial production rate for the first 90 days
BU: Business Unit                                                                                               PIR: Profit Investment Ratio = (PV-10 less capex) /
                                                     IRR: Internal Rate of Return is the discount rate
                                                                                                                total net capital
CFFO: Cash flow from Operations                      at which cumulative cash flows equal to zero
                                                                                                                PP&E: Property, Plant, and Equipment expense
CROCI: Cash Returned on Capital Invested is          LHC: Leasehold Capital expense
the 3-year EBITDA – Interest Expense – G&A /                                                                    PV-0: Present Value at a 0% discount rate
                                                     LL: Lateral length is the length from the point at which
Total Net D&C and Non-D&C Capital
                                                     a wellbore enters the target zone to the terminus point    PV-10: Present Value at a 10% discount rate
D&C: Drilling and Completion expense                 of the wellbore
                                                                                                                RSG: Responsibly Sourced Gas
ESG: Environmental, Social, Governance               MVC: Minimum Volume Commitment
                                                                                                                SPUD: To start the well drilling process
FCF: Free Cash Flow                                  NAV: Net Asset Value
                                                                                                                TIL: Turn-In-Line; a well turned to sales
G&A: General and Administrative expense              NPV: Net Present Value
                                                                                                                UAC: Upper Austin Chalk
G&G: Geological and Geophysical expense              NRI: Net revenue interest is a share of production
                                                                                                                WI: Working Interest is a percentage of ownership
                                                     after all burdens, such as royalty and overriding
GHG: Greenhouse Gas                                                                                             in an oil and gas lease granting its owner the right
                                                     royalty, have been deducted from the working interest
                                                                                                                to explore, drill and produce hydrocarbons from a
                                                                                                                tract of property
                                                                                                                WPS: Wells Per Section

                    Barclays CEO Energy-Power Conference – September 2022                                                                                       14
2022 Operating Plan
  ’22E Activity

                                                                                                                                                                                   2Q’22 Actual and 2022E Projected Results

                                                                                                                                                                                                    2Q’22          3Q’22E             FY’22E

                                                                            Marcellus                                                                          Gas Production (bcf/d)                   3.7        3.7 – 3.8          3.6 – 3.7
                                                                            ~650,000 net acres                                                                 Oil Production (mbo/d)                   50         50 – 54            51 – 56
                                                                            ~50% WI, ~40% NRI
                                                                            4 – 5 average rigs                                                                 Total Production (mmcfe/d)            4,125     4,140 – 4,170      4,020 – 4,140
                                                                            85 – 95 wells drilled & TIL’d
                                                                            $750 – $850 cost/lateral foot                                                      Adj. EBITDAX ($mm)(1)                $1,269    $1,275 – $1,375    $4,800 – $5,000

                                                                                                                                                               Total Capex ($mm)(2)                  $511      $550 – $600       $1,750 – $1,950

                                                                                                                                                               Dividends Paid ($mm)                  $298      $275 – $285       $1,100 – $1,300

                                            Oklahoma City Headquarters
Eagle Ford
~610,000 net acres
~80% WI, ~65% NRI                                                                                                                                        ’22E Production Outlook               ’22E EBITDAX Outlook              ’22E Capital Plan
2 – 4 average rigs
40 – 55 wells drilled & TIL’d                                                 Haynesville
+ 10 UAC wells                                                                                                                                                 15%
                                                                              ~350,000 net acres                                                                                                   20%
$700 – $800 cost/lateral foot                                                                                                                                                                                                     25%             30%
                                                                              ~85% WI, ~70% NRI
                                                                              5 – 7 average rigs                                                                   boe 6:1   45%                               45%
                                                                              65 – 75 wells drilled & TIL’d
                                                                              $1,300 – $1,400 cost/lateral foot                                              40%                                  35%
                                                                                                                                                                                                                                        45%

                                                                                                                                                                                   Marcellus         Haynesville         Eagle Ford
                                Note: All values assume closing of Chief assets on 3/9/2022 and divestiture of Powder River Basin assets on 3/25/2022.
                                (1) Reflects strip prices as of 7/25/2022. A non-GAAP measure as defined in the appendix.
                                (2) Total capex FY’22E reconciliation included in appendix.

                                Barclays CEO Energy-Power Conference – September 2022                                                                                                                                                             15
Eagle Ford: Superior Margin, Sustainable Free Cash Flow
   ➤ ~14 years of drilling using 2 – 3 rigs                                                                    Gross Inventory by Breakeven
                                                                                            ~6.5                   ~10                   ~11                    ~14                   ~30
   ➤ 2022E BU EBITDAX                    $1.7B – $1.9B
                                 (1,2)
                                                                                                                Years of inventory at current pace (3)                                2,100               Brazos Valley

   ➤ Eliminated routine flaring on wells completed 2021+                                                                                                                               850                South Texas

   ➤ Emerging Austin Chalk potential, ~10 wells in 2022 program                                                                          790
                                                                                                                                                                980
                                                                                                                                                                                      1,250
                                                                                                                                                                                                       Location Assumptions:
                                                                                                                   725                                                                                 Average LL = 9,600'
   ➤ Minimal offtake constraints with access to premium markets                             460                                                                  595
                                                                                                                   375                    415                                                          Average Spacing =
                                                                                             150                                                                                                       750' – 2,000'
                                                                                                                   350
   ➤ Gas MVC shortfall projected to decline by 50% YoY
                                                                                             310                                          375                    385

                                                                                            $45                    $50                    $55                   $60                   Total
                                                                                                                                                                           Operated Development
                                                                                                    Operated Development Locations (PV-10) (4)
                                                                                                                                                                                & Appraisal
                                                                                                                                                                             Locations (PV-0) (5)
                       Brazos Valley
                       South Texas
                     0 10 20       40                                                    2018 – 2021 Eagle Ford-STX Average Capex/12-Month Production

$3B
                         Miles                                                                                                                     $/boe(6)
                                                                                           $53.14
                                                                                                         $50.60         $48.66

                                                                                                                                      $39.30
                                                                                                                                                   $35.84
                                                                                                                                                                  $33.86
5-year projected                                                                                                                                                                $31.44         $30.73
                                                                                                                                                                                                             $27.49
FCF(2) net of                                                    TX
allocated hedges,
corporate items
and taxes
                                                                                           Peer 1        Peer 2        Peer 3         Peer 4         CHK          Peer 5        Peer 6        Peer 7         Peer 8

                                                                             (1) BU level EBITDAX based on adjusted strip deck and excludes hedges and Corporate items
                                                                             (2) Adjusted strip deck utilizes NYMEX strip pricing as of 7/25/2022 for 2022 ($7.18 HHUB / $97 WTI) and 2023 ($5.92 / $84), then $4.00 / $75 thereafter
                                                                             (3) Assumes 70 wells per year
                                                                             (4) 10% IRR at current spacing assumptions, proven development zones
                                                                             (5) Location counts are based on existing acreage and do not include zones still in early evaluation or exploration wells
                                                                             (6) Source: Enverus; Peer group includes: CPE, DVN, EOG, Mesquite, MGY, MRO, MUR, SM
                                                                             Note: Free cash flow and EBITDAX are non-GAAP measures which are defined in the appendix

                     Barclays CEO Energy-Power Conference – September 2022                                                                                                                                      16
Hedging Program Reduces Risk, Protects Returns
As of 7/29/2022

           Gas % Hedged        71%

                                                   57%            Oil % Hedged

                                                                                                               DOWNSIDE PROTECTION LEVELS                                  RMDR 2022(1)                     2023

                                                                                                               Gas, $/mcf                                                  $2.91 – $3.43           $3.14 – $4.53

                                                                                                               Oil, $/bbl                                                       $45.37            $64.54 – $75.09

                                      FY 2022

                                                                                                  NATURAL GAS                                                                            OIL

                                        SWAPS            SWAPTIONS                       COLLARS                  THREE-WAY COLLARS                  CALLS                SWAPS                COLLARS
                                                                                         Bought     Sold              Sold     Bought    Sold              Sold                                Bought       Sold
                                   Volume Price Volume Price Volume                                          Volume                               Volume               Volume Price Volume
                      Date                                                                 Put       Call              Put       Put      Call              Call                                 Put        Call
                                     bcf  $/mcf   bcf  $/mcf   bcf                                             bcf                                  bcf                mmbbl $/bbl mmbbl
                                                                                          $/mcf     $/mcf             $/mcf     $/mcf    $/mcf             $/mcf                                $/bbl       $/bbl
                     Q3 2022          134.0      2.63            -        -       93.8       3.41     4.56      6.4     2.41      2.90     3.43        -           -      2.7   44.85      -            -           -
                     Q4 2022          117.3      2.60            -        -     120.1        3.12     4.27      6.4     2.41      2.90     3.43        -           -      2.6   45.92      -            -           -
                    RMDR '22          251.3      2.61            -        -     213.9        3.25     4.40     12.9     2.41      2.90     3.43        -           -      5.3   45.37      -            -           -
                     Q1 2023          114.3      2.64          1.8    2.88        55.7       3.48     6.32      0.9     2.50      3.40     3.79     18.0     3.29         1.9   47.17    0.7      76.09     91.21
                     Q2 2023            28.7     2.73          1.8    2.88      119.8        3.39     5.47      0.9     2.50      3.40     3.79        -           -        -       -    2.2      68.45     82.72
                     Q3 2023            27.2     2.75          1.8    2.88      121.2        3.39     5.47      0.9     2.50      3.40     3.79        -           -        -       -    1.9      69.12     82.23
                     Q4 2023            33.3     2.69          1.8    2.88        96.2       3.31     5.47      0.9     2.50      3.40     3.79        -           -        -       -    1.4      70.63     84.25
                     FY 2023          203.5      2.67          7.3    2.88      392.9        3.38     5.59      3.7     2.50      3.40     3.79     18.0     3.29         1.9   47.17    6.2      69.99     83.86

                    Note: Hedged volume and price reflect positions as of 7/29/2022
                    (1) RMDR 2022 includes 3Q’22 – 4Q’22

                    Barclays CEO Energy-Power Conference – September 2022                                                                                                                                               17
Hedged Basis Protection
   As of 7/29/2022
                                                                                   ➤ 19% of Marcellus and 46% of Haynesville basis hedged for the
                                                                                       remainder of 2022
                                                                                   ➤ Since 6/22/2022, CHK has added basis protection for:
                                                                                     • 13.3 bcf of 3Q’22 – 4Q’22 gas at an average differential to NYMEX of $(0.67)
                                                                                     • 8.1 bcf of 2023 gas at $(0.63)
ARGUS HOUSTON VS ARGUS WTI
RMDR 2022: 2.4 mmbbls @ $1.04/bbl
2023: 3.4 mmbbls @ $1.20/bbl
WTI-NYMEX ROLL
RMDR 2022: 4.7 mmbbls @ $0.81/bbl
2023: 2.8 mmbbls @ $0.68/bbl
                                                                                                                                                                                     TRANSPORT
                                                                                                          MARCELLUS                                     HAYNESVILLE
                                                                                                                                                                                      SPREAD(1)
                                                                                      TETCO M3            TGP Z4 300L         LEIDY            CGT MAINLINE        TGT Z1            TETCO M3

                                                                                   Volume    Avg. Price Volume Avg. Price Volume Avg. Price Volume Avg. Price Volume Avg. Price Volume Avg. Price
                                                                         Date
                                                                                     bcf       $/mcf      bcf    $/mcf      bcf    $/mcf      bcf    $/mcf      bcf    $/mcf      bcf    $/mcf

                                                                         Q3 2022      12.0       (0.80)     4.5    (1.24)   26.6      (1.16)    60.2     (0.47)   15.6      (0.28)   11.4        0.79
                                                                         Q4 2022       8.6        0.68      2.8    (1.08)    13.8     (1.04)    59.4     (0.40)    9.8      (0.23)    9.9        0.77

                 HOUSTON SHIP CHANNEL                                   RMDR '22      20.6       (0.18)     7.3    (1.18)   40.4      (1.12)   119.6     (0.43)   25.5      (0.26)   21.3        0.78
                 RMDR 2022: 5.2 bcf @ $(0.10)/mcf                        Q1 2023       6.8        1.99      4.2    (1.13)     9.5     (0.92)    38.3     (0.27)    6.8      (0.17)    6.8        0.76
                 2023: 1.4 bcf @ $0.05/mcf
                                                                         Q2 2023       3.6       (0.86)     2.3    (1.33)     3.6     (1.17)    25.5     (0.30)    3.0      (0.25)    6.8        0.76
                 HSC INDEX SWAPS
                 RMDR 2022: 3.7 bcf @ $(0.002)/mcf                       Q3 2023       3.7       (0.86)     2.3    (1.33)     3.7     (1.17)    25.8     (0.30)    3.0      (0.25)    6.9        0.76
                                                                         Q4 2023       3.7        0.54      3.8    (1.12)     3.7     (1.09)    22.9     (0.27)    2.4      (0.20)    2.9        0.76
                                                                         FY 2023      17.8        0.51     12.6    (1.20)    20.5     (1.04)    112.4    (0.28)   15.1      (0.20)   23.4        0.76

                        (1) TETCO M3 transport spread vs. TGP Z4 300L

                        Barclays CEO Energy-Power Conference – September 2022                                                                                                               18
Pro Forma Maturity Profile
 Net debt-to-2022E EBITDAX ratio(1)

 ~0.6x
 Preserving balance sheet strength

                                                                                        $975                                                                   ~6.5%(4)

                                                                                                                                                            $1,450

                                                                                                  4.5%

                                                                                                                                       5.5%
                                                                                       $775(2)
                           RBL Capacity                                                                                      4.5%
                                                                                                                                    $500
                           Pro Forma
                                                                                                                     $221(3)
                             2022                          2023                          2024                          2025         2026      2027   2028    2029

               (1)   A non-GAAP measure as defined in the appendix. Net debt as of 6/30/2022 over midpoint of 2022 Outlook
               (2)   Revolver balance as of 6/30/2022
               (3)   Represents $221mm of CA-CIB and Natixis Tranche B
               (4)   $500mm at 5.875% and $950mm at 6.75%

               Barclays CEO Energy-Power Conference – September 2022                                                                                                      19
Management’s Outlook as of August 2, 2022
                                                                                                                                                                                             2022 Projections
                                 Total production:
                                    Oil – mbbls per day                                                                                                                                             51 – 56
                                    NGL – mbbls per day                                                                                                                                             15 – 18
                                    Natural gas – mmcf per day                                                                                                                                   3,600 – 3,680
                                      Total daily rate – mmcfe per day                                                                                                                           4,020 – 4,140
                                 Estimated basis to NYMEX prices, based on 7/25/22 strip prices:
                                    Oil – $/bbl                                                                                                                                                  $1.20 – $1.60
                                    Natural gas – $/mcf                                                                                                                                        ($0.45) – ($0.55)
                                    NGL – realizations as a % of WTI                                                                                                                              40% – 45%
                                 Operating costs per mcfe of projected production:
                                    Production expense                                                                                                                                          $0.29 – $0.33
                                    Gathering, processing and transportation expenses                                                                                                           $0.70 – $0.80
                                        Oil – $/bbl                                                                                                                                             $2.80 – $3.00
                                        Natural Gas – $/mcf                                                                                                                                     $0.75 – $0.85
                                    Severance and ad valorem taxes                                                                                                                              $0.16 – $0.18
                                    General and administrative(1)                                                                                                                               $0.08 – $0.11
                                    Depreciation, depletion and amortization expense                                                                                                            $1.17 – $1.33
                                 Marketing net margin and other ($ in millions)                                                                                                                   $25 – $50
                                 Interest expense ($ in millions)                                                                                                                                $125 – $135
                                 Cash taxes ($ in millions)                                                                                                                                      $225 – $275
                                 Cash taxes (as a percent of income before income taxes)                                                                                                          6% – 9%
                                 Adjusted EBITDAX, based on 7/25/22 strip prices ($ in millions)(2)                                                                                            $4,800 – $5,000
                                 Total capital expenditures ($ in millions)                                                                                                                    $1,750 – $1,950
                                   Marcellus D&C                                                                                                                                                 $400 – $440
                                   Haynesville D&C                                                                                                                                               $750 – $800
                                   Eagle Ford D&C                                                                                                                                                $375 – $415
                                   Powder River Basin D&C                                                                                                                                            $25
                                   Non-D&C Field (workover, infrastructure and leasehold)                                                                                                        $115 – $165
                                   Non-D&C Corporate (PP&E, G&G, capitalized interest and G&A)                                                                                                   $85 – $105
        (1) Includes ~$0.01/mcfe of expenses associated with stock-based compensation, which are recorded in general and administrative expenses in Chesapeake's Condensed Consolidated Statement of Operations.
        (2) Adjusted EBITDAX is a non-GAAP measure used by management to evaluate the company's operational trends and performance relative to other oil and natural gas producing companies. Adjusted EBITDAX excludes certain items that management believes affect the
            comparability of operating results. The most directly comparable GAAP measure is net income (loss), but it is not possible, without unreasonable efforts, to identify the amount or significance of events or transactions that may be included in future GAAP net income
            (loss) but that management does not believe to be representative of underlying business performance. The company further believes that providing estimates of the amounts that would be required to reconcile forecasted adjusted EBITDAX to forecasted GAAP net
            income (loss) would imply a degree of precision that may be confusing or misleading to investors. Items excluded from net income (loss) to arrive at adjusted EBITDAX include interest expense, income taxes, depreciation, depletion and amortization expense, and
            exploration expense as well as one-time items or items whose timing or amount cannot be reasonably estimated.

        Barclays CEO Energy-Power Conference – September 2022                                                                                                                                                                                                                           20
Reconciliation of Net Income (Loss) to Adjusted EBITDAX (unaudited)

                                                                                                                                                                                        Successor

                                                                                                                                                           Three Months Ended                         Three Months Ended
                                                                                                                                                              June 30, 2022                              June 30, 2021
                 ($ in millions)

                 Net income (loss) (GAAP)                                                                                                                 $                           1,237          $                           (439)

                 Adjustments:

                    Interest expense                                                                                                                                                      36                                         18

                    Income tax expense                                                                                                                                                    77                                         —

                    Depreciation, depletion and amortization                                                                                                                            451                                        229

                    Exploration                                                                                                                                                             7                                         1

                    Unrealized (gains) losses on oil and natural gas derivatives                                                                                                      (532)                                        617

                    Separation and other termination costs                                                                                                                                —                                          11

                    Gains on sales of assets                                                                                                                                            (21)                                        (2)

                    Other operating expense (income), net                                                                                                                                 16                                        (4)

                    Impairments                                                                                                                                                           —                                          1

                    Other                                                                                                                                                                 (2)                                       (3)

                 Adjusted EBITDAX (Non-GAAP)                                                                                                               $                         1,269           $                             429

        Adjusted EBITDAX is not a measure of financial performance under GAAP, and should not be considered as an alternative to, or more meaningful than, net income (loss) prepared in accordance with GAAP. Adjusted EBITDAX excludes certain items that management believes
        affect the comparability of operating results. The company believes this non-GAAP financial measure is a useful adjunct to cash flow provided by operating activities because: (i) Management uses adjusted EBITDAX to evaluate the company's operational trends and performance
        relative to other oil and natural gas producing companies. (ii) Adjusted EBITDAX is more comparable to estimates provided by securities analysts. (iii) Items excluded generally are one-time items or items whose timing or amount cannot be reasonably estimated. Accordingly, any
        guidance provided by the company generally excludes information regarding these types of items. Because adjusted EBITDAX excludes some, but not all, items that affect net income (loss), our calculations of adjusted EBITDAX may not be comparable to similarly titled measures
        of other companies.

        Barclays CEO Energy-Power Conference – September 2022                                                                                                                                                                                                                          21
Reconciliations of Adjusted Free Cash Flow and Net Debt

                      ADJUSTED FREE CASH FLOW

                                                                                    Successor

                                                                        Three Months            Three Months
                                                                           Ended                   Ended
                                                                        June 30, 2022           June 30, 2021

                     ($ in millions)

                     Net cash provided by operating activities (GAAP)   $           909     $                394

                        Cash paid for reorganization items, net                         —                       47

                        Cash capital expenditures                                  (415)                   (149)

                     Adjusted free cash flow (Non-GAAP)                 $           494     $                292

                      NET DEBT

                                                                                                 Successor

                                                                                                June 30, 2022
                     ($ in millions)

                     Total debt (GAAP)                                                      $              3,046

                      Premiums and issuance costs on debt                                                  (100)

                     Principal amount of debt                                                              2,946

                      Cash and cash equivalents                                                              (17)

                     Net debt (Non-GAAP)                                                    $              2,929

        Barclays CEO Energy-Power Conference – September 2022                                                        22
You can also read