Qualitative skeletal correlates of wing shape in extant birds (Aves: Neoaves)
←
→
Page content transcription
If your browser does not render page correctly, please read the page content below
Hieronymus BMC Evolutionary Biology (2015) 15:30
DOI 10.1186/s12862-015-0303-7

 RESEARCH ARTICLE                                                                                                                           Open Access

Qualitative skeletal correlates of wing shape in
extant birds (Aves: Neoaves)
Tobin L Hieronymus

 Abstract
 Background: Among living fliers (birds, bats, and insects), birds display relatively high aspect ratios, a dimensionless
 shape variable that distinguishes long and narrow vs. short and broad wings. Increasing aspect ratio results in a
 functional tradeoff between low induced drag (efficient cruise) and increased wing inertia (difficult takeoff). Given
 the wide scope of its functional effects, the pattern of aspect ratio evolution is an important factor that contributes
 to the substantial ecological and phylogenetic diversity of living birds. However, because the feathers that define
 the wingtip (and hence wingspan and aspect ratio) often do not fossilize, resolution in the pattern of avian wing
 shape evolution is obscured by missing information. Here I use a comparative approach to investigate the
 relationship between skeletal proxies of flight feather attachment and wing shape.
 Results: An accessory lobe of the internal index process of digit II-1, a bony correlate of distal primary attachment,
 shows weak but statistically significant relationships to aspect ratio and mass independent of other skeletal
 morphology. The dorsal phalangeal fossae of digit II-1, which house distal primaries VIII and IX, also show a trend of
 increased prominence with higher aspect ratio. Quill knobs on the ulna are examined concurrently, but do not
 show consistent signal with respect to wing shape.
 Conclusions: Although quill knobs are cited as skeletal correlates of flight performance in birds, their relationship
 to wing shape is inconsistent among extant taxa, and may reflect diverging selection pressures acting on a
 conserved architecture. In contrast, correlates of distal primary feather attachment on the major digit show
 convergent responses to increasing aspect ratio. In light of the diversity of musculoskeletal and integumentary
 mophology that underlies wing shape in different avian clades, it is unlikely that a single skeletal feature will show
 consistent predictive power across Neoaves. Confident inference of wing shape in basal ornithurine birds will
 require multiple lines of evidence, together with an understanding of clade-specific evolutionary trends within
 the crown.
 Keywords: Aves, Feather, Osteology, Forelimb evolution, Phylogenetic comparative methods, Quill knobs

Background                                                                        AR) typically lower the drag associated with creating lift,
Bird wings represent an extreme modification of the                               leading to more efficient sustained flight, while increa-
tetrapod forelimb to meet the functional demands of                               sing wing area for a given body mass (lowering wing
flight. The most apparent change involves the elongation                          loading) leads to more efficient soaring flight at lower
and stiffening of feathers on the forelimb to form an air-                        speeds [2-4].
foil. The full complement of specially-modified flight                              Extant birds stand out from the other living flyers
feathers contributes more than 85% of total wing area in                          (including bats and insects) in their ability to maintain
most extant birds [1], and the overall wing shapes that                           attached, efficient airflow in flapping and soaring flight
result from the aggregate of individual flight feather                            with high aspect ratio wing shapes and high wing loa-
shapes determine critical aspects of aerodynamic func-                            dings, even at comparatively high Reynolds numbers
tion (Figure 1d): Long, narrow wings (high aspect ratio,                          [1-3,5]. As with many other organismal traits, the evolu-
                                                                                  tion of components of flight performance in extant
Correspondence: thieronymus@neomed.edu                                            birds, including wing shape, is best understood as gra-
Department of Anatomy and Neurobiology, Northeast Ohio Medical
University (NEOMED), 4209 St Rt 44, Rootstown 44272, OH, USA                      dual change along a continuum or a stepwise accretion

                                     © 2015 Hieronymus; licensee BioMed Central. This is an Open Access article distributed under the terms of the Creative
                                     Commons Attribution License (http://creativecommons.org/licenses/by/4.0), which permits unrestricted use, distribution, and
                                     reproduction in any medium, provided the original work is properly credited. The Creative Commons Public Domain
                                     Dedication waiver (http://creativecommons.org/publicdomain/zero/1.0/) applies to the data made available in this article,
                                     unless otherwise stated.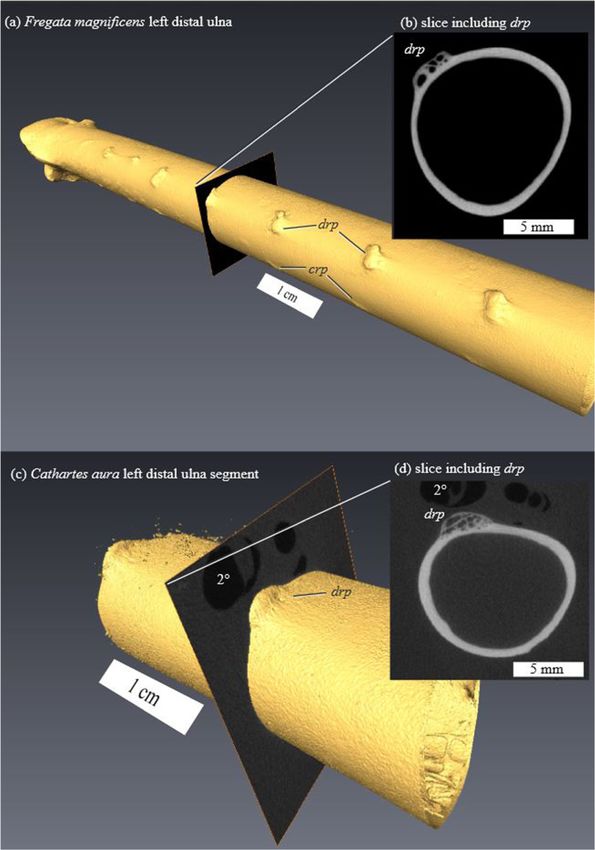
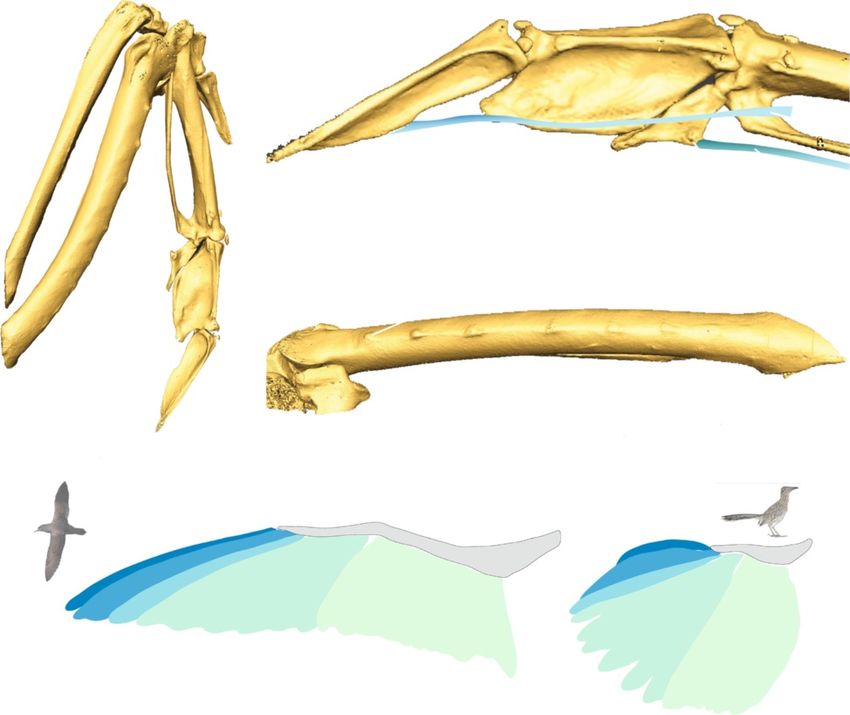
Hieronymus BMC Evolutionary Biology (2015) 15:30                                                                                                            Page 2 of 12

 Figure 1 Bony morphology of feather attachment and composition of wing shape. (a) – (c) Major bony landmarks as visible on a rock
 pigeon (Columba livia). (a) Dorsal view of the distal forelimb. I: digit I; II-1: proximal phalanx digit II; II-2: distal phalanx digit II; III: digit III; IIP: internal
 index process; cmc: carpometacarpus; r: radius; u: ulna. (b) 1° attachment features on digits II-III, dorsal view. dpf: dorsal phalangeal fossae
 (primaries VIII-IX); fp: flexor process of digit III (primaries I-VI); iip1: internal index process (primaries IX-X); iip2: position of caudal lobe of internal
 index process (primary IX); tvi: tendon of ventral interosseous muscle; tfdm: tendon of flexor digiti minimi muscle. (c) 2° attachments on the ulna,
 caudal view. drp: dorsal remigial papillae; crp: caudal remigial papillae. (d) Schematic of flight feather attachment and contribution to wing shape
 in a pink-footed shearwater Puffinus creatopus (left) and a roadrunner Geococcyx californianus (right), taxa with roughly equivalent wing area but
 very different wing shapes and functions. Shading indicates groups of feathers with distinct attachment points. Note that distal primaries form
 the pointed wingtip in Puffinus, while the rounded wingtip in Geococcyx is formed by more proximal primaries. pd1°: predigital primary (II-2);
 md1°: middigital primaries (II-1); ad1°: addigital primary (III); cm1°: carpometacarpal primaries (III + carpometacarpus + tfdm); 2°: secondaries. Bird
 images: Puffinus courtesy M. Taylor (CC-by-SA 3.0) 2009; Geococcyx courtesy G. Kramer and USFWS, 2009.

of traits [6]. Thus a nuanced understanding of avian                                    pectoral skeletal elements as clues to shape and function
wing shape evolution requires information from fossils                                  in extinct taxa. Inferences of wing shape and flight me-
to constrain evolutionary rates and ancestral character                                 chanics in extinct taxa have been primarily based on re-
states in deep time [7,8] as a potential explanation for the                            lationships between whole wing shape parameters and
current ecological and phylogenetic diversity of birds [9].                             the length of skeletal elements, such as the ratio of hu-
  Efforts to reconstruct evolutionary pattern in wing                                   meral and ulnar length [10], or the length of major ske-
shape are hindered by the fact that the entire wing is                                  letal segments [11-13]. Cross-sectional properties [14,15]
often not preserved as a body fossil, leaving only the                                  and bone tissue histology [16,17] of both proximal and
Hieronymus BMC Evolutionary Biology (2015) 15:30                                                               Page 3 of 12

distal wing elements have also been tested as proxies for       between qualitative bony indicators of proximal and dis-
wing shape and flight performance.                              tal remex attachment on one hand (Figure 1a-c, Table 1),
  In contrast, distal limb surface morphology and its re-       and aspect ratio and body mass on the other (Figure 1d,
lationship to wing shape have a limited history of inves-       Table 1). Phylogenetic ANOVA provides a more conven-
tigation. Bird wing morphology is unique among the              tional and widely used approach to dichotomous hy-
known flying vertebrates (which also include bats and           pothesis testing. The results of these tests directly
pterosaurs) in that the distal extent of the wing is not        address the question of whether individual categorically-
demarcated by skeletal features [18,19]. Rather than a          scored bony characters provide a record of AR that
membrane that attaches along the length of the pectoral         might be interpreted for extinct taxa.
skeletal elements, bird wings are mainly composed of
primary (1°) and secondary (2°) flight feathers (remiges,       Methods
sing. remex), that have restricted, focal attachment            Remex attachment morphology
points to the underlying skeleton (Figure 1a-c). These          Several skeletal features have been implicated in the at-
attachment points function as mechanical links that             tachment of flight feathers in past studies [20-24,26].
transfer aerodynamic forces generated by flight feathers        These features have often been employed in systematics,
to the limb skeleton [20-24]. Despite their role in the         and as such are known from a broad taxonomic range of
mechanics of flight, remex attachments have not been as         living birds. Published binary and multistate categorical
thoroughly studied as other potential correlates of flight      scores coded at genus level [34] for six remigial attach-
behavior. Skeletal variability in proximal attachment           ment characters (Table 2) were chosen to represent bony
points (ulnar quill knobs, Figure 1c) has been linked           features known to be associated with remex attachment.
to flightedness [25]. The distal attachments of the 1°          Published scores were then used as a basis to score se-
feathers, specifically the length of the internal index         veral additional taxa for a pooled sample of n = 71 extant
process (iip1, Figure 1b) have been suggested as corre-         taxa (Additional file 1).
lates for aspect ratio [26,27].                                    Published scores for similar characters were also used
  The distal portion of a flapping wing produces the great-     to score three extinct taxa: Parargornis messelensis [37],
est aerodynamic force per unit area [28]. The length and        Eocypselus rowei [38], and Ichthyornis dispar [39]. Pri-
shape of distal 1° feathers is thus expected to have a dis-     mary feathers are well-preserved for Parargornis and
proportionate effect on force production and induced drag       Eocypselus, which allows estimation of AR from the fos-
when compared to 2° feathers and proximal 1° feathers.          sils. Ichthyornis represents an early occurrence of two
My initial hypotheses are: (a) bony correlates of distal 1°     feather attachment features (internal index process and
attachment are more prominent in birds with higher AR,          dorsal phalangeal fossae, Table 2) that are homologous
and (b) bony correlates of proximal 1° and 2° attachment        with extant examples.
are more prominent in birds with lower AR.                         Taxon scores for attachment morphology were sub-
  The prominence of bony attachment features in general         mitted to principal coordinates analysis (PCO) using a
may vary with body size. Mass (M), as a proxy for size, is a    Hamming distance metric with Cailliez correction for
relevant covariate for any study of skeletal morphology.        negative eigenvalues [29]. This analysis and all subse-
My initial expectation is that all bony features in the study   quent analyses were performed using R 2.15.2 [40]. PCO
will be scored as more prominent with increasing mass.          provides a semi-quantitative view of a set of categorical
  I used phylogenetic distance-based Redundancy Analysis        characters that is amenable to linear modeling [29]. Cor-
(RDA) [29,30] and variation partitioning (VARPART)              relations between the original character scores and PCO
[31,32] as means to explore relationships among the sev-        scores provides a projection of the original categorical
eral variables simultaneously. RDA works much like a            variables on the PCO axes [41] analogous to loadings in
principal components analysis (PCA), which is commonly          principal component analysis (PCA). The PCO scores
used to examine several morphological variables at once.        for each taxon form the response matrix Y. Extinct taxa
RDA has the added benefit of explicitly including informa-      were included in this portion of the analysis.
tion from expected functional relationships. Where PCA
reports patterns of greatest morphological variability,         Wing shape and body mass
RDA reports patterns of greatest morphological variability      Measurements of mass (M), wing span (b), and wing area
that are correlated with a second set of variables, in this     (S) for the study taxa were taken from published sources
case AR and M. VARPART then provides a means of                 [1,42,43]. Span and area were recombined into aspect ratio
measuring the magnitude of the effect that the second set       (AR, = b2/S). AR and M were loge transformed to achieve
of variables has on morphology.                                 normality (tested with Shapiro-Wilk W, pnormal = 0.64 &
  After initial exploration of the data, I employed phylo-      0.61, respectively). These two variables form the explana-
genetic ANOVA [33] to test for consistent relationships         tory matrix X. Estimates of AR from Parargornis and
Hieronymus BMC Evolutionary Biology (2015) 15:30                                                                           Page 4 of 12

Table 1 Character scores, AR, and M for taxa used in this              Table 1 Character scores, AR, and M for taxa used in this
study                                                                  study (Continued)
Taxon                    drp crp dpf iip1 iip2 fp AR          M (kg)   Pelecanus erythrorhynchos   2   1   1   1   1   2   9.05   5.09
Accipiter cooperii       1    0    1    1    0     1   5.63   0.558    Pelecanus occidentalis      2   1   1   1   1   2 10.8     2.66
Accipiter gentilis       1    0    1    1    0     1   6.23   0.737    Pelecanus onocrotalus       2   1   1   1   1   2   8.76   7.30
Accipiter nisus          1    0    1    1    0     1   5.81   0.196    Pelecanus rufescens         2   1   1   1   1   2   7.64   4.80
Accipiter striatus       1    0    1    1    0     1   5.66   0.139    Phaethon aethereus          2   1   1   1   1   1 10.8     0.650
Anas crecca              1    0    0    0    0     1   7.96   0.230    Phaethon lepturus           2   1   1   1   1   1 10.0     0.370
Anas georgica            1    0    0    0    0     1   7.20   0.437    Phaethon rubricauda         2   1   1   1   1   1 11.2     0.650
Anas penelope            1    0    0    0    0     1   8.15   0.770    Phalacrocorax aristotelis   1   1   0   1   0   1   6.90   1.642
Anas platyrhynchos       1    0    0    0    0     1   7.43   1.09     Phalacrocorax atriceps      1   1   0   1   0   1   6.98   2.23
Anhinga anhinga          1    1    0    1    0     1   7.65   0.960    Phalacrocorax auritus       1   1   0   1   0   1   7.58   1.28
Anser albifrons          1    0    0    0    0     1   7.86   2.340    Phalacrocorax carbo         1   1   0   1   0   1   8.52   2.53
Anser anser              1    0    0    0    0     1   7.70   3.650    Phasianus colchicus         1   0   0   0   0   1   5.21   1.20
Anser indicus            1    0    0    0    0     1   8.24   2.44     Platalea ajaja              2   1   0   1   0   1   6.91   1.30
Ardea cinerea            2    0    0    1    0     1   7.15   1.21     Plegadis chihi              2   1   0   1   0   1   6.78   0.418
Ardea herodias           2    0    0    1    0     1   8.46   1.65     Puffinus huttoni            1   1   0   1   0   1 11.2     0.364
Caracara plancus         2    0    1    1    0     2   6.83   1.30     Puffinus lherminieri        1   1   0   1   0   1   9.94   0.150
Cathartes aura           2    1    0    1    0     2   7.46   1.64     Puffinus nativitatis        1   1   0   1   0   1   9.61   0.340
Chionis albus            1    1    1    1    0     2   6.44   0.610    Puffinus pacificus          1   1   0   1   0   1 10.2     0.380
Ciconia abdimii          1    0    0    1    0     1   7.00   1.030    Puffinus tenuirostris       1   1   0   1   0   1 12.1     0.544
Coccyzus americanus      2    1    1    1    0     1   6.37   0.059    Rallus longirostris         1   0   0   0   0   1   5.10   0.220
Columba palumbus         1    0    1    1    0     1   7.08   0.495    Rissa tridactyla            1   1   2   1   1   1   9.21   0.394
Diomedea exulans         1    1    0    1    1     1 15.0     7.98     Stercorarius parasiticus    1   1   2   1   1   1   9.85   0.419
Falco columbarius        1    0    1    1    0     2   7.01   0.157    Sterna maxima               2   0   2   1   1   1 12.2     0.256
Falco mexicanus          1    0    1    1    0     2   7.64   0.837    Sula dactylatra             1   0   1   1   1   1 12.2     1.90
Falco peregrinus         1    0    1    1    0     2   8.33   0.798    Sula leucogaster            1   0   1   1   1   1 11.9     0.938
Falco rusticolus         1    0    1    1    0     2   7.88   1.17     Sula sula                   1   0   1   1   1   1 11.2     1.10
Falco sparverius         1    0    1    1    0     2   7.70   0.084    Tyto alba                   1   0   1   1   0   1   7.23   0.380
Fregata magnificens      2    1    2    1    1     2 11.5     1.39     Uria aalge                  1   0   1   1   0   1   9.34   0.831
Fulmarus glacialis       1    0    1    1    1     1 10.5     0.824    Zenaida macroura            1   0   1   1   0   1   5.94   0.098
Gavia immer              1    1    0    1    0     1   9.97   3.58     Ichthyornis dispar          1   0   1   1   0   1
Gavia stellata           1    1    0    1    0     1 10.3     2.31     Eocypselus rowei            0   0   1   1   0   0 (8.15)
Gyps africanus           1    1    0    1    1     2   6.88   5.50     Parargornis messelensis     0   0   1   1   0   0 (5.30)
Gyps rueppellii          1    1    0    1    1     2   7.01   7.30
Haematopus ostralegus    1    1    0    1    0     2   8.19   0.460
                                                                       Eocypselus were excluded from this matrix and from sub-
Limnodromus griseus      2    1    1    1    1     1   8.32   0.061
                                                                       sequent steps.
Megascops asio           1    0    1    1    0     1   5.87   0.098
Mergus serrator          1    1    0    0    0     1   9.64   0.460    Phylogenetic context
Oceanites oceanicus      1    1    0    1    0     1   7.27   0.034    This study accounted for phylogenetic error covariance
Pachyptila desolata      1    1    0    1    0     1   8.60   0.155    using a phylogenetic generalized least squares (PGLS)
                                                                       approach [44]. A subset of 1,000 trees containing the
Pachyptila turtur        1    1    0    1    0     1   9.33   0.132
                                                                       study taxa was obtained from a published avian super-
Passer domesticus        1    0    0    1    0     1   4.80   0.029
                                                                       tree set [9]. A separate phylogenetic covariance matrix
Pelecanoides georgicus   1    1    0    1    0     1   7.66   0.122    was derived from the topology and branch lengths of
Pelecanoides urinatrix   1    1    0    1    0     1   7.43   0.133    each tree [45]. Phylogenetic signal (λi) for each tree was
                                                                       jointly estimated for all variables [46]. Estimated values
                                                                       of λi were tested against λi = 0 and λi = 1 by a likelihood-
Hieronymus BMC Evolutionary Biology (2015) 15:30 Page 5 of 12
Table 2 Categorically scored bony characters included in this study
Character LZ06 # Soft tissue attachment Related remiges
Dorsal remigial papillae (drp)a-e 1521 Dorsal 2° remex ligaments 2°
a-e
Caudal remigial papillae (crp) 1522 Ventral secondary remex ligaments, Septum humerocarpale 2°
Dorsal phalangeal fossae (dpf)b,d,f 1715 Follicles of 1° VIII-IX 1° VIII-IX (md1°)
Internal index process presence/absence (iip1)f 1721 Interphalango-remigial ligamenth 1° IX-X (md1° - ad1°)
f
Internal index process shape (iip2) 1722 Interphalango-remigial ligamenth 1° IX-X (md1° - ad1°)
g
Flexor process (fp) 1731 Tendon of flexor digiti minimi 1° I-VI (cm1°)
Characters related to feather attachment have been identified by several sources (noted below). Corresponding characters described in [34] (LZ06#) included as
an aggregate reference.
a
[20]; b[21]; c[22]; d[23]; e[24]; f[26]; g[35]; h[36].
ratio chi-squared test with one degree of freedom. Esti- transformed variables can be analyzed by standard para-
mated values of λi were used to scale off-diagonal branch metric linear approaches while accounting for expected
lengths in phylogenetic covariance matrices. phylogenetic error covariance among related species.
All variables were phylogenetically centered around an
estimate of ancestral character state [47] for each tree i. Statistical analysis
Because AR and M have heterogeneous units, they were Relationships between bone morphology and wing shape
ranged to (−1, 1) after centering. Centered and ranged were initially evaluated using VARPART [31,32,48] and
variables were then PGLS transformed using the inverse RDA [29,48]. In this study, VARPART partitions the va-
square root of each phylogenetic covariance matrix riation in bony morphology into components that are
(C-1/2
i ). Because the explanatory and response matrices ‘explained’ by correlation with AR and M, and a residual
X and Y are multiplied in the course of VARPART and component that is not correlated to either. RDA then
RDA analyses, this transformation is equivalent to mul- provides a PCA-like view of the components of bony
tiplication by C−1 in standard PGLS approaches. The morphological variation that are correlated to AR and M
Figure 2 Biplots of bone morphology characters on successive PCO axes. Insets show bone feature loadings on Principal Coordinate Axes
(a) 1-2, (b) 3-4, (c) 5-6, and (d) 7-8. drp: dorsal remigial papillae; crp: caudal remigial papillae; dpf: dorsal phalangeal fossae; iip1: presence/absence
of internal index process; iip2: shape of internal index process; fp: flexor process digit III.Hieronymus BMC Evolutionary Biology (2015) 15:30 Page 6 of 12
(the canonical axes) and the residual components (the Table 4 Projection of the original morphological
non-canonical axes). characters onto the first eight PCO axes
VARPART and RDA were run with an iteration to in- PCO1 PCO2 PCO3 PCO4 PCO5 PCO6 PCO7 PCO8
corporate each of the i trees in the sample, to accommo- drp −0.58 0.25 −0.16 0.98 0.29 −0.26 −1.54 −0.13
date uncertainty in phylogeny. Using the set of 1,000 trees crp −0.41 1.05 0.17 −0.22 −0.42 −0.43 0.19 −0.15
provides a distribution of adjusted R2 scores and axis loa-
dpf −0.78 −0.77 −0.52 −0.31 −0.11 0.31 0.16 −2.01
dings. Comparison within this distribution serves as a sen-
iip1 −0.43 0.03 0.12 −0.22 −0.83 0.96 −0.24 0.29
sitivity analysis of VARPART and RDA to assumptions of
tree topology and branch length. As the ordination results iip2 −0.68 0.08 −0.75 −0.39 0.65 0.01 0.15 0.35
are not nested, results for individual trees are not directly fp −0.45 0.00 0.90 −0.45 0.73 −0.16 −1.46 −0.19
comparable. VARPART and RDA results for a single tree This matrix was used to transform the loadings of PCO axes in the RDA
with adjusted R2 values closest to the means for all terms ordination into a biplot of the original morphological variables (Figure 2a).
was taken as a representative ordination.
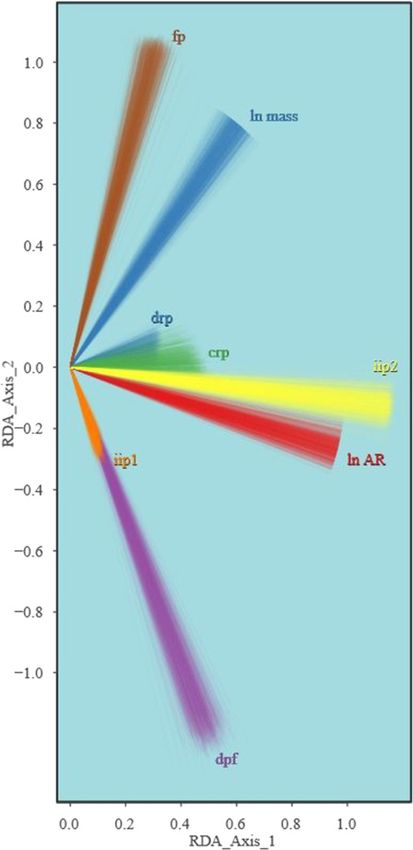
Eigenvectors from RDA were used as a basis to plot Phylogenetic signal
taxon scores in constrained reduced space [15,30] on the Joint estimates of λi for the study data are significantly
canonical axes. In a sense, this step takes taxon scores different from both zero and one (p < 0.001) for all
from an unconstrained ordination that reflects patterns phylogenetic trees considered in the study, and are nor-
of shared variability in bony morphology (PCO), and mally distributed around a mean λi = 0.67 (Figure 3).
projects those scores onto a new set of axes that reflect Variable loadings in the redundancy analysis (RDA) or-
patterns of shared variability in bony morphology that dination space for all trees are clustered around similar
are correlated with AR and M (RDA). The constrained values (Figure 4).
reduced space provides a concise summary of variation
in bone morphology that is directly tied to variation in Aspect ratio is linked to variability in skeletal features of
wing shape. Extinct taxa were placed on this ordination the manus
space using their PCO scores. VARPART and RDA identified significant components of
One-to-one relationships between skeletal features variation in bony feather attachment morphology that
and AR or M identified from the ordination were fur- are best explained by AR (R2 = 0.065, Table 5). Although
ther tested in phylogenetic context using phylogenetic the coefficient of determination is low, this reflects the
ANOVA [33,46]. relationship of AR to all of the included skeletal features
simultaneously. Permutation tests identified both the
Results first canonical axis (Figure 5a,b) and the loadings of AR
Representation of categorically scored bony morphology and M along the first axis as significantly different from
by Principal Coordinates
The first twelve PCO axes are used to represent bony
morphology for subsequent analyses. Of these axes, the
first eight each represent greater than 1% of total varia-
bility (Figure 2). Eigenvalues for PCO axes are presented
in Table 3. Relationships between the unconstrained PCO
space and the original binary or categorically scored bone
morphology characters are presented in Table 4.
Table 3 Eigenvalues of PCO axes used to represent
categorically scored bony characters
Relative eigenvalue Cumulative eigenvalue
PCO1 0.19 0.19
PCO2 0.14 0.33
PCO3 0.07 0.40
PCO4 0.06 0.45
PCO5 0.05 0.50
PCO6 0.02 0.52
PCO7 0.02 0.54 Figure 3 Histogram showing distribution of joint λi values
PCO8 0.02 0.56 estimated for the tree sample.Hieronymus BMC Evolutionary Biology (2015) 15:30 Page 7 of 12
Table 5 VARPART results for single representative tree,
with the range observed in the tree sample
Model Adjusted R2 Upper adj. R2 Lower adj. R2
AR 0.065** 0.057 0.073
M 0.033* 0.022 0.041
AR + M 0.082 0.070 0.092
AR | M 0.050 0.041 0.057
M | AR 0.016 0.011 0.020
AR ∩ M 0.017 0.011 0.023
Residuals 0.918 0.908 0.930
**Significant by permutation test at p ≤ 0.01.
*Significant by permutation test at p ≤ 0.05.
loads along the second canonical axis (Figure 5b), which
is only marginally distinct from a random rearrangement
of the original PCO axes (p = 0.07).
Shape of the caudal margin of digit II is a correlate of
aspect ratio and mass
The presence of a caudal lobe of the internal index
process (iip2, Figure 1b) is associated with significantly
different AR and M (p = 0.001 & p = 0.013, respectively;
phylogenetic ANOVA using the representative tree with
1,000 simulations and Holm multiple comparisons ad-
justment). As scored for this analysis, presence or
absence of the flexor process of digit III (fp) and the
prominence of dorsal phalangeal fossae (dpf ) do not
show significant relationships to AR (p = 0.8 & p = 0.4,
respectively) or M (p = 0.07 & p = 0.8).
Modeled AR for extinct taxa are inconclusive
Fitted AR for Eocypselus, Parargornis (7.3), and Ichythyor-
nis (7.8) were all close to the value inferred for the root of
the neoavian tree in the representative ordination (7.6,
Figure 5d). These values represent an underestimation for
Eocypselus (inferred AR of 8.2 from feather impressions)
Figure 4 Biplots showing the distribution of bone and wing [38], and an overestimation for Parargornis (inferred AR
shape character loadings for the tree sample. drp: dorsal remigial
of 5.3) [37]. The weak fit of AR to the full RDA model,
papillae; crp: caudal remigial papillae; dpf: dorsal phalangeal fossae;
iip1: presence/absence of internal index process; iip2: shape of which contains all of the morphological features, does not
internal index process; fp: flexor process digit III; AR: aspect ratio; allow any conclusions to be drawn regarding wing shape
M: mass. in Ichthyornis.
Discussion
Variation in feather attachment morphology
random (p ≤ 0.05, Table 6). These results, along with the Loadings of the PCO axes identify prominent patterns of
loadings shown in Figure 5b, show that although the variation in bony flight feather attachment features in
statistical model has poor predictive power, there is an living birds (Figure 2a-d). The first PCO axis captures a
association between AR and more prominent bony feather general trend of linked presence or absence among most
attachment features in the hand. This association is con- of the bony characters. The second PCO axis shows a
vergent across multiple neoavian lineages (Figure 5a,d). pattern of divergence in which several taxa possess cau-
Although M has a non-random effect on the ordi- dal remigial papillae (crp) but not dorsal phalangeal fos-
nation of bony morphology (Table 5), mass primarily sae (dpf ), and vice versa, which points to a trade-offHieronymus BMC Evolutionary Biology (2015) 15:30 Page 8 of 12 Figure 5 Summary of VARPART and RDA results. (a) Plot of taxon RDA scores. Hue and shading of points denotes aspect ratio. Silhouettes show representative wing shapes for Anser, Cathartes, Sula, and Fregata. (b) Inset biplot representing PGLS correlations among response matrix Y (solid rays) and explanatory matrix X (dashed rays) in the canonical RDA axes. Note the strong positive correlation between aspect ratio (AR) and distal primary attachment features (iip2). drp: dorsal remigial papillae; crp: caudal remigial papillae; dpf: dorsal phalangeal fossae; iip1: presence/ absence of internal index process; iip2: shape of internal index process; fp: flexor process digit III. (c) – (d) Proximal phalanges of digit II (II-1) from Rallus and Fregata in dorsal view, show morphological disparity at the extremes of the first RDA axis. (e) Representative tree topology with an ancestral character state reconstruction of AR—hues and shading correspond to (a). between the prominence of 2° and distal 1° feather at- Phalangeal morphology and distal primary attachment tachments, respectively. The third PCO axis captures a The simple presence/absence character score for iip1 similar tradeoff between distal (iip2, dpf ) and proximal (Figure 1b) used in this study obscures a broad taxo- (fp) 1° feather attachments. The fourth PCO axis ac- nomic range of shape and relative size in this feature. counts for variability in dorsal remigial papillae (drp) The ‘caudal lobe’ (iip2) [34] is only found in taxa with that does not co-occur with any of the above patterns. very prominent internal index processes (IIP), and thus The remaining axes account for residual variation that may also serve as a crude proxy for the length of the IIP, occurs as exceptions to the abovementioned trends. as defined in the strict sense. Because the IIP and its
Hieronymus BMC Evolutionary Biology (2015) 15:30 Page 9 of 12
Table 6 RDA axis eigenvalues for single representative IIP as a remigial ligament attachment site, although
tree supported by anatomical data, has not previously been
Axis Eigenvalue Relative eigenvalue considered. Further anatomical and histological studies
1st canonical axis 4.46 × 10⁻⁴ ** 8.3% will undoubtedly shed more light on the functional sig-
2nd canonical axis 1.39 × 10⁻⁴ 2.6% nificance of the IIP.
st −3
1 non-canonical axis 1.32 × 10 25%
Ulnar remigial papillae
2nd non-canonical axis 1.28 × 10⁻³ 24%
The prominence of ulnar remigial papillae does not show
3rd non-canonical axis 5.86 × 10⁻⁴ 11% a clear relationship to AR or M (Figure 5b). Biplots of the
4th non-canonical axis 4.68 × 10⁻⁴ 8.7% original morphological variables on the non-canonical
−4
th
5 non-canonical axis 4.01 × 10 7.5% (residual) axes from RDA (Figure 6) show that crp, dpf,
6th non-canonical axis 1.86 × 10⁻⁴ 3.5% and drp show independent patterns of variation on the
th
7 non-canonical axis 1.66 × 10 −4
3.1%
first, second, and third non-canonical axes, respectively.
Distal limb pneumatization (‘hyperpneumatization’ [49]) is
8th non-canonical axis 1.16 × 10⁻⁴ 2.2%
a possible confounding variable for these features, as many
th −4
9 non-canonical axis 1.08 × 10 2.0% of the hyperpneumatized taxa in the study also show
**Significant by permutation test at p ≤ 0.01. prominent drp and dpf. In many birds with distal limb
pneumaticity, subcutaneous airsacs lie adjacent to the fol-
licles of 1° and 2° remiges at their attachments [49]. Cross-
caudal lobe are attachment sites for ligaments that hold sections of drp in these taxa reveal substantial erosion
primaries VIII, IX and X to the major digit, the signifi- rooms within the papillae themselves that are independent
cant relationship between these features and AR suggests of the medullary cavity of the ulna (Figure 7). In a similar
a relatively straightforward interpretation: longer distal manner, dpf of hyperpneumatized taxa (Figure 5d) show
1° feathers contribute to increased span, drive up AR prominent excavations associated with air sacs surround-
(Figure 1d), and presumably exert greater stress on their ing follicles of the distal 1° remiges.
attachment sites, resulting in more prominent bony fea- A single interpretation of quill knobs cannot be ex-
tures (Figure 5d). tended to address all taxa included in the present study.
The relationship between IIP size and AR has been In some taxa (e.g. Ardea), prominent drp are not asso-
suggested to follow from a hypothesized role of the IIP ciated with pneumatization of the distal forelimb—the
as a guide for the tendon of the ventral interosseus same is also true of the dpf of Rissa, Stercorarius, and
muscle (tvi, Figure 1b) [26]. By this interpretation, in- Sterna [49]. Although the morphological pattern of quill
creased IIP length would result in increased moment knobs scored in this study suggests that the overlying
arm for adduction of the distal phalanx and its attached system of feather attachment ligaments is homologous
predigital 1° feather. However, the potential performance among extant birds, the patterns of bone growth and
benefits of increased moment arm for predigital 1° ad- resorption that produce different bony character states are
duction in flapping flight are unclear, and the role of the clearly homoplastic. Quill knobs may appear similar in
Figure 6 Non-canonical axes from RDA, representing residual variation in bony morphology that is not related to AR or M. Plots show
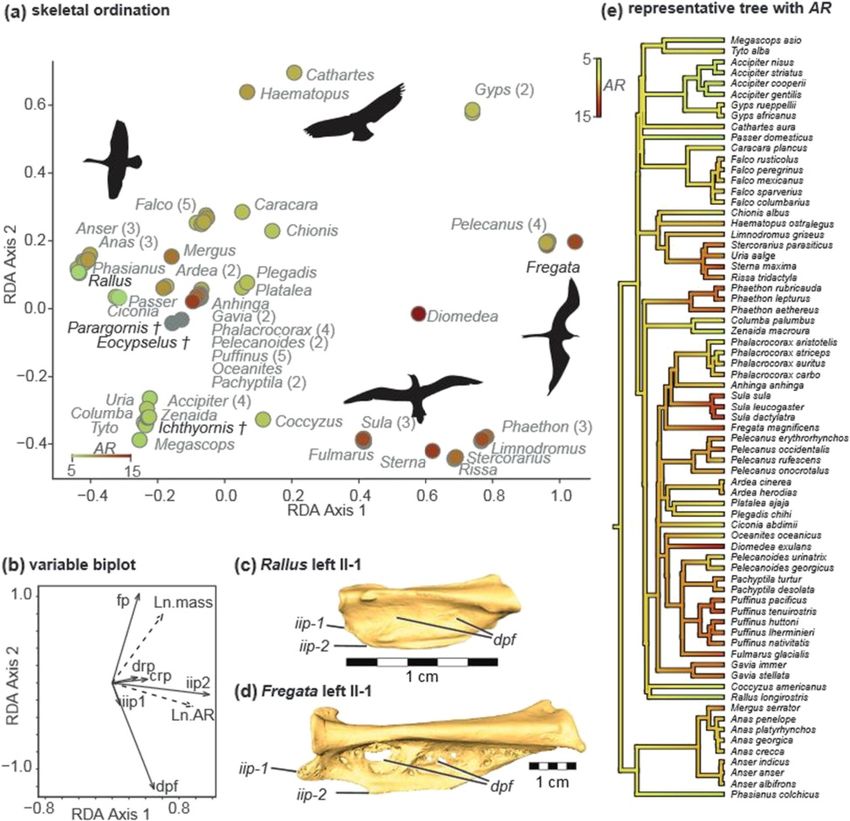
non-canonical axes (a) 1-2, and (b) 3-4.Hieronymus BMC Evolutionary Biology (2015) 15:30 Page 10 of 12 Figure 7 MicroCT surfaces and slices through dorsal remigial papillae (drp). (a-b) Fregata (CM S13606) and (c-d) Cathartes, showing open spaces isolated from the main medullary cavity of the ulna. Cathartes specimen is embedded in plastic for histological sectioning—feather pulp cavities appear as void spaces in the slice. crp, caudal remigial papillae; 2°, pulp cavity of secondary remex.
Hieronymus BMC Evolutionary Biology (2015) 15:30                                                                                  Page 11 of 12

these independent occurrences, but their presence may         character scores. A more fine-grained approach to quan-
very well serve different purposes in different clades.       tifying the size and shape of distal primary attachment
                                                              features would provide a further test of the sensitivity of
Wing shape and many-to-one mapping                            phalangeal morphology as a correlate of wing shape.
The coefficient of determination for AR found by VAR-            Feather attachment features provide a novel line of
PART (Table 5) is noteworthy despite its low value for two    evidence for wing shape and function, alongside pre-
reasons. First, the preservation of any signal that can be    viously established relationships such as element length
detected through the noise and low resolution of several      indices [10-13], cross-sectional properties [14,15], and
anatomically independent, categorically scored characters     bone tissue organization [16]. Combining evidence from
across the diversity of neoavian birds is encouraging. The    feather attachment morphology with other forms of
relationships between phalangeal morphology and AR            skeletal evidence, and restricting the phylogenetic scope
detected by RDA warrant further investigation with more       of modeling efforts, may yet yield accurate skeletal pre-
precise measures of morphology.                               dictors of wing shape to shed light on the evolution of
  Second, although the relationship between discrete          flight mechanics within crown neoavian birds as a dy-
bony attachment characters and AR is weak, it is not a        namic, divergent process [52].
great deal weaker than previous models that employed
brachial index (BI, humerus length/ulna length) as a pre-     Availability of supporting data
dictor of AR when phylogeny was taken into account            The data sets and R language scripts supporting the re-
[50]. Difficulty in predicting wing shape from skeletal       sults of this article are available in Dryad (http://dx.doi.
features in general may be a reflection of distinct func-     org/10.5061/dryad.2p31f ).
tional relationships within different neoavian clades. If
this is the case, predictive power may only be found by       Additional file
considering more phylogenetically restricted samples.
  Extant birds may also display a pattern of many-to-one       Additional file 1: Hieronymus flight feather Table S7.xls: Excel
mapping [51], in which several distinct combinations of        spreadsheet of taxa included in the study. Coding abbreviations:
                                                               LZE—Livezey & Zusi (2007) exemplar taxon; LZC—Livezey & Zusi (2007)
element and feather lengths may result in functionally         exemplar congener; OST—coded from osteological specimen.
equivalent wings with similar AR. Wing span, as a com-         Institutional abbreviations: CM—Carnegie Museum of Natural History.
ponent of AR, is largely a summation of the lengths of         Wing data reference abbreviations: W’77—Warheit (1977); HB’99—Hertel
                                                               & Ballance (1999); P’01—Pennycuick (2001); P’08—Pennycuick (2008).
humerus, ulna, manus, and distal 1° feathers (Figure 1d).
The low predictive power of both the current RDA
                                                              Abbreviations
model and BI may reflect the fact that each model ex-         1: Primary feather; 2: Secondary feather; ad1: Addigital primary feather;
cludes important skeletal information from either the         cm1: Carpometacarpal primary feathers; cmc: carpometacarpus; crp: Caudal
proximal or distal segments of the wing. The consilience      remigial papillae; dpf: Dorsal phalangeal fossae; drp: Dorsal remigial papillae;
                                                              fp: Flexor process digit III; I: Manus digit I; II-1: Proximal phalanx of manus
of results from this study and previous work points in        digit II; II-2: Distal phalanx of manus digit II; III: Manus digit III; IIP: Internal
two directions for future studies: look for relationships     index process (feature); iip1: Internal index process (character score);
in more restricted regions of the avian tree, and begin       iip2: Caudal lobe of internal index process (character score); M: Body mass;
                                                              md1: Middigital primary feathers; PCO: Principal coordinates analysis;
with skeletal data that address all four of the variable-     pd1: Predigital primary feather; PGLS: Phylogenetic generalized least-squares;
length segments in the avian wing.                            r: Radius; AR: Aspect ratio; RDA: Redundancy analysis; tfdm: Tendon of flexor
                                                              digiti minimi muscle; tvi: Tendon of ventral interosseous muscle; u: Ulna;
                                                              VARPART: Variation partitioning.
Conclusions
Although the ulnar papillae have been the most fre-           Competing interests
quently cited correlates of feather attachment, their link    The author declares that he has no competing interests.
to overall wing shape is problematic, and likely driven by
                                                              Acknowledgements
divergent trends in different clades of neoavian birds.       I thank Northeast Ohio Medical University (NEOMED) for supporting this
Homoplasy of prominent ulnar papillae may be better           research. Steve Rogers at Carnegie Museum of Natural History graciously
                                                              provided assistance and access to specimens. Many thanks also to Julia
thought of as a reflection of conserved ligament ar-
                                                              Clarke, Lisa Noelle Cooper, Stephen Gatesy, Jon Marcot, Kevin Middleton,
chitecture, rather than a convergent flight-related func-     Patrick O’Connor, Chris Organ, and Erin Rasmussen Simons for critical
tional signal.                                                discussion. The editor, two anonymous reviewers, and members of the
                                                              NEOMED Skeletal Biology Research Focus Area provided comments and
  The internal index process of digit II-1 and associated
                                                              suggestions that substantially improved the manuscript.
attachment structures have previously been overlooked
as correlates of flight feather attachment, but show a        Received: 27 November 2014 Accepted: 3 February 2015
clear relationship to aspect ratio and the shape of the
distal primaries. This relationship is apparent even at the   References
low level of precision available in binary and categorical    1. Pennycuick CJ. Modelling the flying bird. Amsterdam: Academic; 2008.
Hieronymus BMC Evolutionary Biology (2015) 15:30 Page 12 of 12
2. Rayner JV. Form and function in avian flight. In: Johnston R, editor. Current 31. Desdevises Y, Legendre P, Azouzi L, Morand S. Quantifying phylogenetically
ornithology, vol. 5. New York: Plenum Press; 1988. p. 1–66. structured environmental variation. Evolution. 2003;57:2647–52.
3. Swartz SM, Iriarte-Díaz J, Riskin DK, Breuer KS. A bird? a plane? No, it's a bat: 32. Cubo J, Legendre P, De Ricqlès A, Montes L, De Margerie E, Castanet J, et al.
an introduction to the biomechanics of bat flight. In: Gunnell GF, Simmons Phylogenetic, functional, and structural components of variation in bone
NB, editors. Evolutionary history of bats. New York: Cambridge University growth rate of amniotes. Evol Dev. 2008;10:217–27.
Press; 2012. p. 318–52. 33. Garland T, Dickerman AW, Janis CM, Jones JA. Phylogenetic analysis of
4. Taylor GK, Thomas A. Evolutionary biomechanics. Oxford: Oxford University covariance by computer simulation. Syst Biol. 1993;42:265–92.
Press; 2014. 34. Livezey BC, Zusi RL. Higher-order phylogeny of modern birds (Theropoda,
5. Taylor GK, Nudds RL, Thomas ALR. Flying and swimming animals cruise at a Aves: Neornithes) based on comparative anatomy: I. Methods and
strouhal number tuned for high power efficiency. Nature. 2003;425(6959):707–11. characters. Bull Carnegie Museum of Natural History. 2006;37:544.
6. Hutchinson J, Allen V. The evolutionary continuum of limb function from 35. Stegmann B. Funktionell bedingte Eigenheiten am Metacarpus des
early theropods to birds. Naturwissenschaften. 2009;96(4):423–48. Vogelflügels. J Ornithol. 1965;106(2):179–89.
7. Moran AL. Egg size evolution in tropical American bivalves: the fossil record 36. Baumel JJ, Raikow RJ. Arthrologia. In: Baumel JJ, editor. Nomina anatomica
and the comparative method. Evolution. 2004;58:2718. avium. Cambridge, Massachusetts: Nuttall Ornithological Club; 1993. p. 133–218.
8. Finarelli JA, Flynn JJ. Ancestral state reconstruction of body size in the 37. Mayr G. A new Eocene swift‐like bird with a peculiar feathering. Ibis.
caniformia (Carnivora, Mammalia): the effects of incorporating data from the 2003;145(3):382–91.
fossil record. Syst Biol. 2006;55(2):301–13. 38. Ksepka DT, Clarke JA, Nesbitt SJ, Kulp FB, Grande L. Fossil evidence of wing
9. Jetz W, Thomas GH, Joy JB, Hartmann K, Mooers AO. The global diversity of shape in a stem relative of swifts and hummingbirds (Aves, Pan-Apodiformes).
birds in space and time. Nature. 2012;491:444–8. Proc R Soc B: Biological Sciences. 2013;280(1761):20130580.
10. Rayner JMV, Dyke GJ. Origins and evolution of diversity in the avian wing. 39. Clarke JA. Morphology, phylogenetic taxonomy, and systematics of
In: Vertebrate Biomechanics and Evolution. Bios Scientific; 2003. p. 297–314. Ichthyornis and Apatornis (Aviale: Ornithurae). Bull Am Mus Nat Hist.
11. Nudds RL, Kaiser GW, Dyke GJ. Scaling of avian primary feather length. PLoS 2004;286(1):1–179.
One. 2011;6(2):e15665. 40. R Core Team. R: A language and environment for statistical computing.
12. Wang X, McGowan AJ, Dyke GJ. Avian wing proportions and flight styles: In: http://www.r-project.org. Vienna, Austria: R Foundation for Statistical
first step towards predicting the flight modes of Mesozoic birds. PLoS One. Computing; 2012.
2011;6:e28672. 41. Legendre P, Legendre L. Numerical ecology. Amsterdam: Elsevier; 1998.
13. Chan NR, Dyke GJ, Benton MJ. Primary feather lengths may not be 42. Hertel F, Ballance LT. Wing Ecomorphology of Seabirds from Johnston Atoll.
important for inferring the flight styles of Mesozoic birds. Lethaia. Condor. 1999;101:549–56.
2013;46(2):146–53. 43. Warham J. Wing loadings, wing shapes, and flight capabilities of
14. Habib MB, Ruff CB. The effects of locomotion on the structural procellariiformes. New Zealand J Zoology. 1977;4:73–83.
characteristics of avian limb bones. Zool J Linn Soc. 2008;153:601–24. 44. Martins EP, Hansen TF. Phylogenies and the comparative method: a general
15. Simons ELR, Hieronymus TL, O'Connor PM. Cross sectional geometry of the approach to incorporating phylogenetic information into the analysis of
forelimb skeleton and flight mode in pelecaniform birds. J Morphol. interspecific data. Am Nat. 1997;149:646–67.
2011;272(8):958–71. 45. Paradis E, Claude J, Strimmer K. APE: analyses of phylogenetics and
16. De Margerie E, Sanchez S, Cubo J, Castanet J. Torsional resistance as a evolution in R language. Bioinformatics. 2004;20:289–90.
principal component of the structural design of long bones: comparative 46. Revell LJ. phytools: an R package for phylogenetic comparative biology
multivariate evidence in birds. Anat Rec A Discov Mol Cell Evol Biol. (and other things). Methods in Ecology and Evolution. 2012;3(2):217–23.
2005;282A:49–66. 47. Revell LJ. Size-correction and principal components for interspecific
17. Simons ELR, O'Connor PM. Bone laminarity in the avian forelimb skeleton comparative studies. Evolution. 2009;63(12):3258–68.
and its relationship to flight mode: testing functional interpretations. Anat 48. Oksanen J, Blanchet FG, Kindt R, Legendre P, Minchin PR, O’Hara RB,
Rec. 2012;295(3):386–96. Simpson GL, Solymos P, Stevens MHH, Wagner H: vegan: Community
18. Elgin RA, Hone DWE, Frey E. The extent of the pterosaur flight membrane. Ecology Package. In: http://cran.r-project.org/web/packages/vegan/index.
Acta Palaeontol Pol. 2011;56(1):99–111. html; 2013.
19. Hedenstrom A, Johansson LC, Spedding GR. Bird or bat: comparing airframe 49. O'Connor PM. Evolution of archosaurian body plans: skeletal adaptations of
design and flight performance. Bioinspir Biomim. 2009;4(1):015001. an air-sac-based breathing apparatus in birds and other archosaurs. J Exp
Zool A Ecol Genet Physiol. 2009;311A:629–46.
20. Owen R. On the anatomy of vertebrates, vol. 2. London: Longmans, Green
50. Nudds RL, Dyke GJ, Rayner JMV. Forelimb proportions and the evolutionary
and Co; 1866.
radiation of Neornithes. Proc R Soc Lond Series B: Biol Sci. 2004;271:S324–7.
21. Alix E. Éssai sur l'appareil locomoteur des oiseaux. Paris: G. Masson; 1874.
51. Wainwright PC, Alfaro ME, Bolnick DI, Hulsey CD. Many-to-One mapping of
22. Pelissier M. L'appareil ligamentaire des rémiges des oiseaux. Arch Anat Hist
form to function: a general principle in organismal design? Integr Comp
Embryol. 1923;2:3–5.
Biol. 2005;45:256–62.
23. Sy M. Funktionell-anatomische Untersuchungen am Vogelflügel. J Ornithol.
52. Wang X, Clarke JA. Phylogeny and forelimb disparity in waterbirds.
1936;84:199–296.
Evolution. 2014;68:2847–60.
24. Edington G, Miller AE. The avian ulna: its quill knobs. Proc R Soc Edinb B
Biol. 1941;61:138–48.
25. Turner AH, Makovicky PJ, Norell MA. Feather quill knobs in the dinosaur
velociraptor. Science. 2007;317:1721–1.
26. Stegmann B. Der Processus internus indicis im Skelett des Vogelflügels.
J Ornithol. 1963;104:413–23. Submit your next manuscript to BioMed Central
27. Stegmann BC. Relationships of the superorders alectoromorphae and and take full advantage of:
charadriomorphae (Aves): a comparative study of the avian hand.
Cambridge, Mass: Nuttall ornithological club; 1978.
• Convenient online submission
28. Usherwood JR. The aerodynamic forces and pressure distribution of a
revolving pigeon wing. Exp Fluids. 2009;46(5):991–1003. • Thorough peer review
29. Legendre P, Anderson MJ. Distance-based redundancy analysis: testing • No space constraints or color figure charges
multispecies responses in multifactorial ecological experiments. Ecol
• Immediate publication on acceptance
Monogr. 1999;69(1):1–24.
30. Cooper LN, Hieronymus TL, Vinyard CJ, Bajpai S, Thewissen JGM. New • Inclusion in PubMed, CAS, Scopus and Google Scholar
applications for constrained ordination: reconstructing feeding behaviors in • Research which is freely available for redistribution
fossil remingtonocetinae (Cetacea: Mammalia). In: Hembree DI, Platt BF,
Smith JJ, editors. Experimental approaches to understanding fossil
organisms. Dordrecht: Springer Netherlands; 2014. p. 89–107. Submit your manuscript at
www.biomedcentral.com/submitYou can also read