RECOMMENDATION FOR SEASONAL INFLUENZA VACCINE COMPOSITION FOR NEW ZEALAND FOR 2019 - ESR Public Health ...
←
→
Page content transcription
If your browser does not render page correctly, please read the page content below
RECOMMENDATION FOR SEASONAL
        INFLUENZA VACCINE COMPOSITION
           FOR NEW ZEALAND FOR 2019

PREPARED FOR:                  Ministry of Health

2018/19 SERVICE DESCRIPTION:   Health & Environment Group
CLIENT REPORT No:              FW18055
PUBLISHED:                     December 2018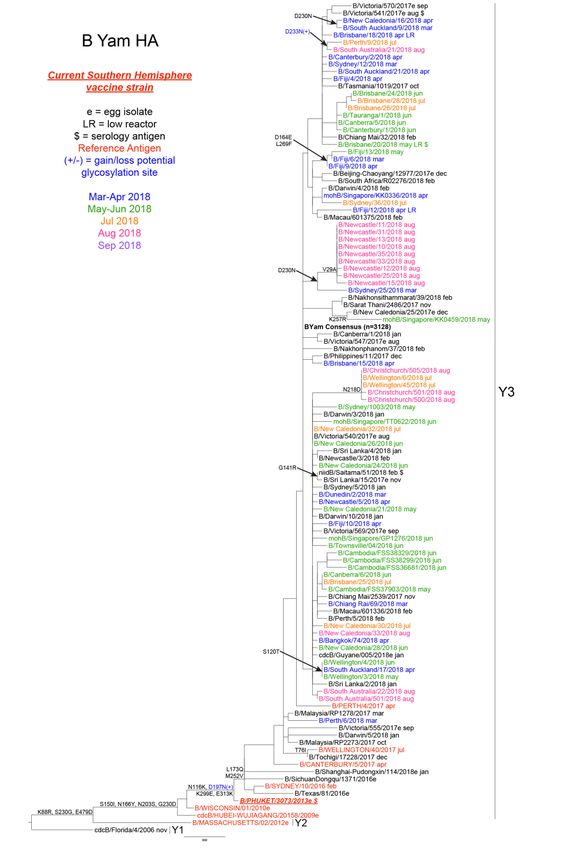
This report is available at www.surv.esr.cri.nz

First published: 21 December 2018

Suggested citation:

Huang, Q.S., Jelley, L., Bocacao, J., Ralston, J., Gunn, W., Lopez, L., Wood, T.
Recommendation for seasonal influenza vaccine composition for New Zealand 2019
2018, Institute of Environmental Science and Research Ltd (ESR):
Wellington, New Zealand

Client Report FW18055
Reproduction is authorised provided the source is acknowledged.

December 2018                                             Vaccine recommendations
Page 2                INSTITUTE OF ENVIRONMENTAL SCIENCE AND RESEARCH LIMITED
ACKNOWLEDGEMENTS
This report was prepared by Sue Huang, Lauren Jelley, Judy Bocacao, Jacqui Ralston, Wendy
Gunn, Liza Lopez and Tim Wood from the Institute of Environmental Science and Research.
We would like to thank the general practitioners and their staff, the local surveillance coordinators,
regional virology laboratories (Auckland, Waikato, Wellington, and Christchurch), and medical
officers of health involved in influenza surveillance for their time and cooperation. We would also
like to acknowledge the WHO National Influenza Centre at ESR for the provision of laboratory data
and ESR’s Information Management Group for assisting in the running of the electronic flu
database. Special thanks also go to:
Dr Andrea McNeill for peer reviewing this report.
The Ministry of Health for providing the funding for sentinel GP (general practice)
surveillance and hospital-based severe acute respiratory illness (SARI) surveillance,
HealthStat, Healthline, and National Minimum Data Set (NMDS) code-based hospital
surveillance;
The WHO Collaborating Centre in Melbourne for providing further characterisations of the
influenza isolates.
The National Institute of Communicable Diseases, Johannesburg in South Africa and
Department of Health and Ageing (DOHA) in Australia for sharing information on their
influenza activity.
The Therapeutic Goods Administration, DOHA for hosting the Australian Influenza Vaccine
Committee.
Participants in the National GP-based influenza-like illness surveillance programme and
hospital-based SARI surveillance programme.
DISCLAIMER
This report or document (the Report) is given by the Institute of Environmental Science and
Research Limited (ESR) solely for the benefit of the Ministry of Health, Public Health Services
Providers and other Third Party Beneficiaries as defined in the Contract between ESR and the
Ministry of Health, and is strictly subject to the conditions laid out in that Contract.
Neither ESR nor any of its employees makes any warranty, express or implied, or assumes any
legal liability or responsibility for use of the Report or its contents by any other person or
organisation.
Vaccine recommendations December 2018
INSTITUTE OF ENVIRONMENTAL SCIENCE AND RESEARCH LIMITED Page i
CONTENTS
List of tables.................................................................................................................................... iii
List of figures ..................................................................................................................................iv
Recommendations .......................................................................................................................... 1
Influenza epidemiology ................................................................................................................... 3
    World-wide influenza activity, February to September 2018 ....................................................... 3
    Influenza activity in Australia, February to September 2018 ....................................................... 4
    Influenza activity in South Africa, February to September 2018 .................................................. 6
Influenza activity in New Zealand in 2018 ....................................................................................... 7
    Community-based surveillance ................................................................................................... 7
    Hospital-based surveillance ...................................................................................................... 16
    Ministry of Health data on publicly funded hospital discharges ................................................. 23
New Zealand strain characterisations ........................................................................................... 26
    Circulating strains in 2018 ........................................................................................................ 26
    Predominant strains during 1997–2018 .................................................................................... 28
    Influenza A(H1N1)pdm09 ......................................................................................................... 30
    Seasonal influenza A(H3N2) .................................................................................................... 30
    Influenza B ............................................................................................................................... 34
    Oseltamivir resistance .............................................................................................................. 34
Influenza vaccine effectiveness ..................................................................................................... 36
Recent strain characterisation for southern hemisphere viruses and likely vaccine candidates ..... 38
    Influenza A(H1N1)pdm09 ......................................................................................................... 38
    Seasonal influenza A(H3N2) .................................................................................................... 39
    Influenza B ............................................................................................................................... 40
Summary of vaccine composition recommendation ...................................................................... 42
    Explanation of “like” strains suitable for inclusion in vaccine ..................................................... 42
Appendix 1 - Composition of the Australian Influenza Vaccine Committee 2018 ........................... 43
Appendix 2 – Isolates received for analysis at the Australian WHO Collaborating Centre ............. 44
Appendix 3 – Influenza A(H1N1)pdm09 ........................................................................................ 45
Appendix 4 - Influenza A (H3N2)................................................................................................... 49
Appendix 5 - Influenza B ............................................................................................................... 52
Appendix 6 - WHO Recommendation for influenza vaccines ........................................................ 57

December 2018                                                    Vaccine recommendations
Page ii                      INSTITUTE OF ENVIRONMENTAL SCIENCE AND RESEARCH LIMITED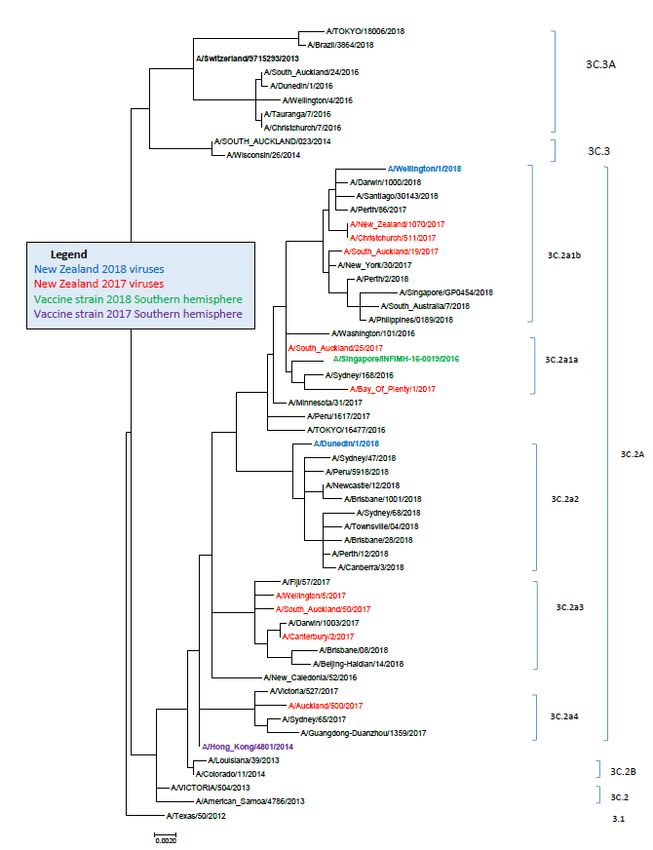
LIST OF TABLES
Table 1. Influenza vaccine recommendations for New Zealand, 1991–2018 ............................... 2
Table 2. Demographic characteristics of ILI and influenza cases, since 30 April 2018 .............. 11
Table 3. Weekly consultation rate for influenza-like illness by District Health Board, 2018 ........ 12
Table 4. Influenza and non-influenza respiratory viruses among ILI cases, 30 April–30 September
          2018 ........................................................................................................................... 13
Table 5. Demographic characteristics of SARI cases and related influenza cases, since 30 April
         2018 ........................................................................................................................... 20
Table 6. Influenza and non-influenza respiratory viruses among SARI cases, 30 April to 30
          September 2018 ......................................................................................................... 21
Table 7. Influenza virus identifications by type and sub-type and lineage-typed, 2018 .............. 26
Table 8. Antiviral susceptibility to oseltamivir for influenza viruses, 2014–2018^ ....................... 35
Table 9. Antiviral susceptibility to zanamivir for influenza viruses, 2014–2018^......................... 35
Table 10. Estimated influenza vaccine effectiveness, by participant age group and by influenza
         virus type and subtype in New Zealand, 2018 influenza season ................................. 37
Table 11. Influenza Viruses Analysed at the Melbourne WHO CC ............................................ 44
Table 12. (H1N1)pdm09 viruses (1) .......................................................................................... 46
Table 13. Summary – HI Characterization of Influenza A(H3N2) Isolates ................................. 49
Table 14. A(H3) Focus Reduction Assay (3) ............................................................................. 50
Table 15. B viruses (B/Victoria lineage) .................................................................................... 54
Table 16. B viruses (B/Yamagata lineage) ................................................................................ 55

                             Vaccine recommendations                                 December 2018
                             INSTITUTE OF ENVIRONMENTAL SCIENCE AND RESEARCH LIMITED       Page iii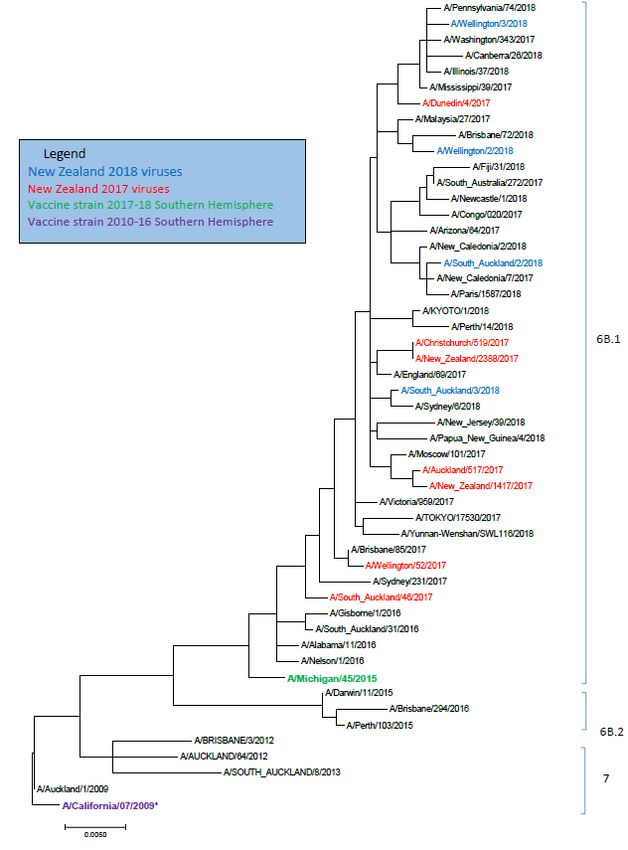
LIST OF FIGURES
Figure 1. Weekly consultation rates for influenza-like illness in New Zealand, 2018.................... 8
Figure 2. Weekly ILI consultation rates in 2018 compared to 2013–2017 .................................... 9
Figure 3. Weekly ILI-associated influenza rates in 2018 compared to 2013–2017 ...................... 9
Figure 4. Weekly Consultation Rates for Influenza-like Illness in New Zealand, 1992–2018 ..... 10
Figure 5. Temporal distribution of the number and proportion of influenza viruses from ILI
specimens, by type and week..................................................................................... 14
Figure 6. Temporal distribution of the number and proportion of non-influenza viruses from ILI
specimens, by type and week1 ................................................................................... 14
Figure 7. Weekly number of ILI-related calls to Healthline, 2010–2018 ..................................... 15
Figure 8. Weekly resident SARI and SARI-associated influenza incidence, 2018 ..................... 17
Figure 9. Weekly hospitalisation rates for SARI in 2018 compared to 2012–2017 ..................... 17
Figure 10. Weekly hospitalisation rates for SARI-associated influenza in 2018 compared to 2012–
2017 ........................................................................................................................... 18
Figure 11. Seriousness of disease indicator in 2018 compared to 2012–2017 .......................... 19
Figure 12. Temporal distribution of the number and proportion of influenza viruses from SARI
specimens, by type and week1 ................................................................................... 22
Figure 13. Temporal distribution of the number and proportion of non-influenza viruses from SARI
specimens, by type and week1 ................................................................................... 22
Figure 14. Influenza hospital discharges, 2000–2018* .............................................................. 23
Figure 15. Influenza hospital discharges by week, 2018* .......................................................... 24
Figure 16. Influenza hospital discharge rates by age group, 2018* ........................................... 24
Figure 17. Hospital discharge rates by prioritised ethnic group, 2018* ...................................... 25
Figure 18. Total influenza viruses by type and week specimen taken, 2018.............................. 27
Figure 19. Total influenza A and B viruses by week specimen taken, 2018............................... 27
Figure 20. Influenza viruses by type, 1997–2018 ...................................................................... 28
Figure 21. Influenza A viruses by subtypes 1997–2018 ............................................................ 29
Figure 22. Influenza B viruses by lineages, 1990–2018 ............................................................ 30
Figure 23..Phylogenetic relationships among influenza A(H1N) haemagglutinin genes ............ 31
Figure 24..Phylogenetic relationships among influenza A(H3N2) haemagglutinin genes........... 32
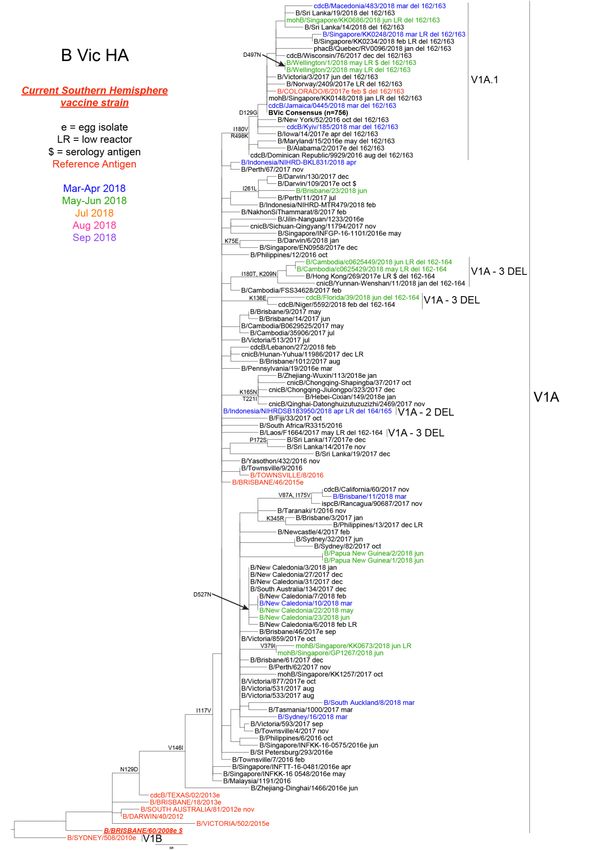
Figure 25. Phylogenetic relationships among influenza B (Yamagata) haemagglutinin genes .. 33
Figure 26. Antigenic cartographic representation of A(H1N1)pdm09 viruses............................. 45
Figure 27. Phylogenetic relationships among influenza A(H1N1)pdm09 HA genes ................... 48
Figure 28. Phylogenetic relationships among influenza A (H3) N2 genes ................................. 51
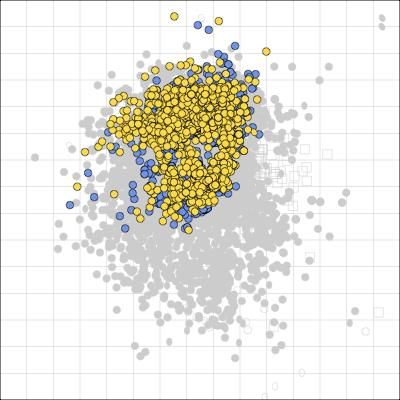
Figure 29. Antigenic cartographic representation of B Victoria viruses ...................................... 52
Figure 30. Antigenic cartographic representation of B Yamagata viruses .................................. 52
Figure 31. B viruses (B/Victoria lineage) ................................................................................... 53
Figure 32. Phylogenetic relationships among influenza B neuraminidase genes B/Yamagata
Lineage ...................................................................................................................... 56
December 2018 Vaccine recommendations
Page iv INSTITUTE OF ENVIRONMENTAL SCIENCE AND RESEARCH LIMITED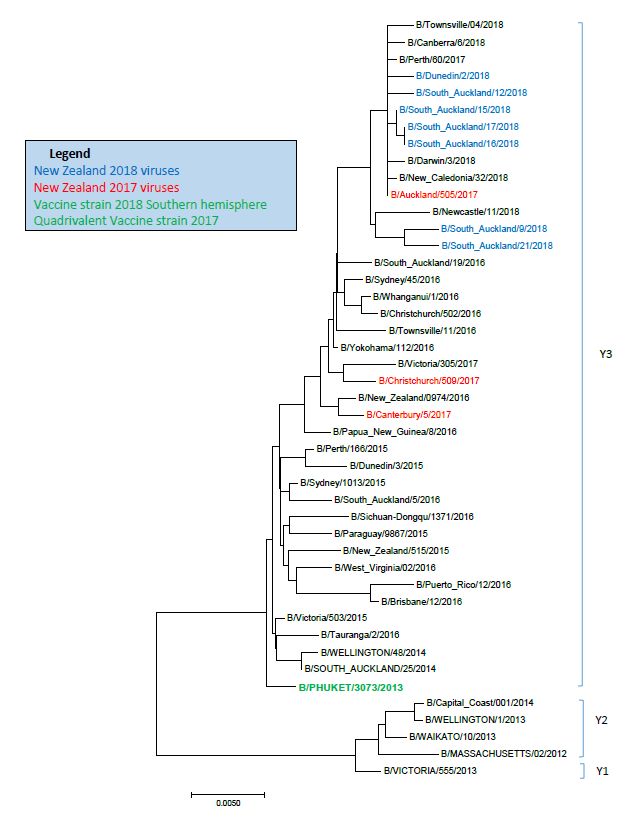
RECOMMENDATIONS
The Australian Influenza Vaccine Committee (AIVC) met with a New Zealand representative
(Appendix 1) in Canberra on 10 October 2018 to consult on the influenza vaccine composition for
2019 for New Zealand, Australia and South Africa (Table 1). The recommended composition for
quadrivalent vaccines was:
A(H1N1) an A/Michigan/45/2015 (H1N1)pdm09-like virus
A(H3N2) an A/Switzerland/8060/2017 (H3N2)-like virus
B a B/Phuket/3073/2013-like virus (belonging to B/Yamagata lineage)
B a B/Colorado/06/2017-like virus (belonging to B/Victoria lineage)
The recommended composition for trivalent vaccines was:
A(H1N1) an A/Michigan/45/2015 (H1N1)pdm09-like virus
A(H3N2) an A/Switzerland/8060/2017 (H3N2)-like virus
B a B/Phuket/3073/2013-like virus (belonging to B/Yamagata lineage)
Vaccine recommendations December 2018
INSTITUTE OF ENVIRONMENTAL SCIENCE AND RESEARCH LIMITED Page 1Table 1. Influenza vaccine recommendations for New Zealand, 1991–2018
Decision Use A H3N2 A H1N1 B (Trivalent) B
year (Quadrivalent)
NZ & WHO* 2018 2019 A/Switzerland/8060/2017 A/Michigan/45/2015 B/Phuket/3073/2013 B/Colorado/06/2017
A/Singapore/INFIMH-16-
NZ & WHO* 2017 2018 A/Michigan/45/2015 B/Phuket/3073/2013 B/Brisbane/60/2008
0019/2016
A/Hong Kong/4801
NZ & WHO* 2016 2017 A/Michigan/45/2015 B/Brisbane/60/2008 B/Phuket/3073/2013
/2014
A/Hong Kong/4801
NZ & WHO* 2015 2016 A/California/7/2009 B/Brisbane/60/2008 B/Phuket/3073/2013
/2014
A/Switzerland/97152
NZ & WHO* 2014 2015 A/California/7/2009 B/Phuket/3073/2013 B/Brisbane/60/2008
93/2013
NZ & WHO* 2013 2014 A/Texas/50/2012 A/California/7/2009 B/Massachusetts/2/2012 B/Brisbane/60/2008
NZ & WHO* 2012 2013 A/Victoria/361/2011 A/California/7/2009 B/Wisconsin/1/2010
NZ & WHO* 2011 2012 A/Perth/16/2009 A/California/7/2009 B/Brisbane/60/2008
NZ & WHO* 2010 2011 A/Perth/16/2009 A/California/7/2009 B/Brisbane/60/2008
NZ & WHO* 2009 2010 A/Perth/16/2009 A/California/7/2009 B/Brisbane/60/2008
NZ & WHO* 2008 2009 A/Brisbane/10/2007 A/Brisbane/59/2007 B/Florida/4/2006
NZ & WHO* 2007 2008 A/Brisbane/10/2007 A/Solomon Islands/3/2006 B/Florida/4/2006
NZ & WHO* 2006 2007 A/Wisconsin/67/2005 A/New Caledonia/20/99 B/Malaysia/2506/2004
NZ & WHO* 2005 2006 A/California/7/2004 A/New Caledonia/20/99 B/Malaysia/2506/2004
NZ & WHO* 2004 2005 A/Wellington/1/2004 A/New Caledonia/20/99 B/Shanghai/361/2002
NZ & WHO* 2003 2004 A/Fujian/411/2002 A/New Caledonia/20/99 B/Hong Kong/330/2001
NZ & WHO* 2002 2003 A/Moscow/10/99 A/New Caledonia/20/99 B/Hong Kong/330/2001
NZ & WHO* 2001 2002 A/Moscow/10/99 A/New Caledonia/20/99 B/Sichuan/379/99
NZ 2000 2001 A/Sydney/5/97 A/New Caledonia/20/99 B/Beijing/184/93
WHO* 2000 2001 A/Moscow/10/99 A/New Caledonia/20/99 B/Beijing/184/93
NZ & WHO* 1999 2000 A/Sydney/5/97 A/Beijing/262/95 B/Beijing/184/93
NZ 1998 1999 A/Sydney/5/97 A/Bayern/7/95 B/Beijing/184/93
WHO** 1997–98 A/Wuhan/359/95 A/Bayern/7/95 B/Beijing/184/93
NZ 1997 1998 A/Wuhan/359/95 A/Texas/36/91 B/Beijing/184/93
WHO** 1996–97 A/Wuhan/359/95 A/Singapore/6/86*** B/Beijing/184/93
NZ 1996 1997 A/Johannesburg/33/94 A/Texas/36/91 B/Beijing/184/93
WHO** 1995-96 A/Johannesburg/33/94 A/Singapore/6/86 B/Beijing/184/93
NZ 1995 1996 A/Guangdong/25/93 A/Texas/36/91 B/Panama/45/90
WHO** 1994–95 A/Shangdong/9/93 A/Singapore/6/86 B/Beijing/184/93
NZ 1994 1995 A/Beijing/32/92 A/Texas/36/91 B/Panama/45/90
WHO** 1993–94 A/Beijing/32/92 A/Singapore/6/86 B/Panama/45/90
NZ 1993 1994 A/Shanghai/24/90 A/Texas/36/91 B/Panama/45/90
B/Yamagata/16/88
WHO** 1992–93 A/Beijing/353/89 A/Singapore/6/86
or B/Panama/45/90
B/Yamagata/16/88
NZ 1992 1993 A/Beijing/353/89 A/Victoria/36/88
or B/Panama/45/90
B/Yamagata/16/88
WHO** 1991–92 A/Beijing/353/89 A/Singapore/6/86
or B/Panama/45/90
* WHO recommendations are for the Southern Hemisphere winter
* * WHO recommendations are for the Northern Hemisphere winter
December 2018 Vaccine recommendations
Page 2 INSTITUTE OF ENVIRONMENTAL SCIENCE AND RESEARCH LIMITEDINFLUENZA EPIDEMIOLOGY
WORLD-WIDE INFLUENZA ACTIVITY, FEBRUARY TO SEPTEMBER 2018
Between February and September 2018, influenza activity was reported globally, with influenza
A(H1N1)pdm09, A(H3N2) and influenza B viruses co-circulating.
NORTHERN HEMISPHERE TEMPERATE REGION
In the northern hemisphere, influenza activity declined from February to April and remained at
inter-seasonal levels in most countries. Influenza A(H1N1)pdm09 was the predominant type A in
most countries in Europe, northern and western Africa and Asian. Influenza A(H3N2) was the
predominant type A in northern Europe, North America and some countries in Asia. Influenza B
viruses circulated in higher proportions than influenza A viruses in many countries in Europe.
Influenza activity in northern Africa was high in several countries in February and March with
widespread A(H1N1)pdm09 outbreaks in Algeria and A(H3N2) in Morocco.
SOUTHERN HEMISPHERE TEMPERATE REGION
In the southern hemisphere, influenza activity increased from March to June. In the southern cone
of South America there was co-circulation of influenza A and B viruses, and in South Africa
A(H1N1)pdm09 virus predominated with regional activity of influenza B virus reported later in the
winter season. Influenza activity was low in Australia and New Zealand throughout this period.
TROPICAL AND SUBTROPICAL REGIONS
Influenza activity in the tropical and subtropical region of Asia was high with regional widespread
outbreaks reported in South-East Asia. Influenza activity in tropical regions of South America was
generally high with A(H1N1)pdm09, A(H3N2) and B outbreaks reported.
(Abridged from the Weekly Epidemiological Record, 2018 93(42):553-576).
INFLUENZA LABORATORY SURVEILLANCE FROM WHO COLLABORATING CENTRE
AT MELBOURNE
The WHO Collaborating Centre for Reference and Research on Influenza in Melbourne, Australia
(Melbourne WHOCC) analysed influenza isolates received from across Oceania during 1 February
to 19 September 2018. Influenza A(H1N1)pdm09 virus was the predominant strain which
accounted for 49% (662/1341) of isolates, while 21% (283/1341) were A(H3N2), 17% (231/1341)
were B/Yamagata lineage and 7% (93/1341) were B/Victoria lineage (Table 11 in Appendix 2).
Vaccine recommendations December 2018
INSTITUTE OF ENVIRONMENTAL SCIENCE AND RESEARCH LIMITED Page 3INFLUENZA ACTIVITY IN AUSTRALIA, FEBRUARY TO SEPTEMBER 2018
Influenza activity in Australia in 2018 in general was at a low level with some regional variations.
Clinical severity for the season was moderate as measured through the proportion of patients
admitted directly to ICU, and deaths attributed to influenza. The impact of influenza was low on
society as measured through the burden on hospitals and the proportion of people with ILI taking
time off work. A(H1N1)pdm09 was the dominant influenza A subtype.
There are 6 influenza surveillance systems in Australia, which can be divided into three categories.
INFLUENZA-LIKE-ILLNESS SURVEILLANCE
o Australian Sentinel Practice Research Network (ASPREN). This system has general
practitioners (GPs) who report influenza-like illness (ILI) presentation rates in New South
Wales, South Australia, Victoria, Queensland, Tasmania, Western Australia and the Northern
Territory. As jurisdictions joined ASPREN at different times and the number of GPs reporting
has changed over time, the representativeness of ASPREN data in 2018 may be different
from that of previous years. The national case definition for ILI is presentation with fever,
cough and fatigue. Overall, the rate of ILI consultations peaked during the week 37 ending 16
September. The peak ILI rate was lower than the previous 5 years (2013–2017).
o FluTracking. FluTracking is an online health surveillance system to detect influenza
epidemics. It involves participants from around Australia completing a simple online weekly
survey, which collects data on the rate of ILI symptoms in communities. Overall, the rates of
fever and cough among participants in 2018 peaked in week 33 ending 15 August, lower
than the previous 5 years.
LABORATORY SURVEILLANCE
o National Notifiable Disease Surveillance System (NNDSS). In Australia, laboratory-
confirmed cases of influenza became notifiable to state and territory health departments from
1 January 2001. From 1 January to 21 October 2018, there have been 44,694 laboratory-
confirmed notifications of influenza diagnosed and reported to NNDSS. Of these, 77% were
influenza A (67% influenza A(unsubtyped), 7% influenza A(H1N1)pdm09 and 3% influenza
A(H3N2)), 23% were influenza B, and less than 1% were influenza C, influenza A&B co-
infections or untyped. Where subtyping information was available, all jurisdictions have
reported a greater proportion of influenza A(H1N1)pdm09 than influenza A(H3N2).
o WHOCC Laboratory Surveillance. This is conducted by the Melbourne WHO Collaborating
Centre (WHOCC). As of 22 October 2018, a total of 972 influenza viruses from Australia
were received for analysis at the Melbourne. Of these, 82% were influenza A (58% influenza
A(H1N1)pdm09 and 24% influenza A(H3N2)), 18% were influenza B (17% influenza B
Yamagata lineage and 1% influenza B Victoria lineage), and less than 1% were influenza
A(H1N1) and influenza A(H3N2) co-infections. None of the 687 influenza viruses tested for
neuraminidase inhibitor resistance, demonstrated reduced inhibition to the antiviral drugs
Zanamivir or Oseltamivir by enzyme inhibition assays.
December 2018 Vaccine recommendations
Page 4 INSTITUTE OF ENVIRONMENTAL SCIENCE AND RESEARCH LIMITEDSEVERITY SURVEILLANCE
o Influenza hospitalisations. The Influenza Complications Network (FluCAN) collects detailed
clinical information on all hospitalised cases of influenza and pneumonia from a sample of
four sentinel hospitals across Australia. Since 3 April 2018, a total of 725 people have been
admitted with confirmed influenza. Of these, 34.8% of people admitted with confirmed
influenza were children aged 15 years and younger, 38.9% were adults aged between 16
and 64 years, and 26.3% were adults aged 65 years and older. Of the children admitted with
confirmed influenza to date, 7.1% were admitted to ICU. This is slightly less than the
percentage of adults aged between 16 and 64 years (9.2%) and adults aged 65 years and
older (7.8%) that were admitted to ICU.
o Death associated with influenza and pneumonia. Nationally reported influenza deaths are
notified by jurisdictions to the NNDSS. As of 21 October, 55 influenza associated deaths
have been notified to the NNDSS. The majority of deaths were due to influenza A (75%,
n=41). The median age of deaths notified was 80 years (range 1 to 100 years). The number
of influenza associated deaths reported to the NNDSS is reliant on the follow up of cases to
determine the outcome of their infection and most likely does not represent the true mortality
impact associated with this disease.
(Abridged from the Australian Influenza Surveillance Report 2018, No.11, Department of Health
and Ageing, Australia and a report by Dr Ian Barr, WHO Collaborating Centre for Influenza,
Melbourne).
Vaccine recommendations December 2018
INSTITUTE OF ENVIRONMENTAL SCIENCE AND RESEARCH LIMITED Page 5INFLUENZA ACTIVITY IN SOUTH AFRICA, FEBRUARY TO SEPTEMBER
2018
Influenza surveillance in South Africa in 2018 consisted of 4 main surveillance programmes:
Viral watch programme. This program was established in 1984. It focuses on patients with
ILI consultations seen mainly by general practitioners (90%) as well as a few paediatricians
and primary health care clinics across the country. This program includes doctors and
primary health care nurses from eight of nine South African provinces.
ILI surveillance in public health clinics. This programme was established in 2012. It
systematically enrols patients meeting a clinical case definition of ILI. Patients are enrolled at
two government funded primary health care clinics in two provinces of South Africa. Detailed
epidemiologic data are collected on all patients.
National syndromic surveillance for pneumonia. The SARI (pneumonia) surveillance
programme was established in 2009 and it monitors SARI cases in hospitalised patients.
Detailed epidemiologic data are collected on all patients. This programme currently includes
six hospitals as five sentinel sites covering five provinces.
Private hospital consultation surveillance. This programme was established in 2002. It is
based on hospital discharge data (ICD-codes J10-J18) for those private hospitals. No
specimens for pathogens testing were collected for surveillance purpose.
In 2018, a total of 5300 suspected influenza specimens were processed up to week 34. Of which,
811 influenza viruses were detected. This gave an overall detection rate of 15%. Among all
detected influenza viruses, influenza A(H1N1)pdm09 was the predominant strain accounting for
75% (610/811) influenza viruses with influenza B detected in 22% (181/811) and influenza
A(H3N2) in 2% (14/811). Six influenza A positive specimens were not subtyped. Both influenza
B/Victoria and B/Yamagata lineage viruses circulated and were detected at frequencies of 51%
(92/181) and 39% (70/181) respectively.
A total of 28 influenza A(H1N1)pdm09 viruses were sequenced and all of them were clustered
genetically in subgroup 6B.1.
A total of two seasonal influenza A(H3N2) viruses were sequenced and they were clustered
genetically in 3C.2a1 subgroup.
A total of two influenza B/Yamagata lineage viruses were subjected to sequencing (in progress).
No genetic mutations associated with reduced susceptibility to oseltamivir were observed in the
neuraminidases of influenza A (27) and B (2) viruses.
(Abridged from a report by Dr Florette Treurnicht, National Institute for Communicable Diseases,
South Africa).
December 2018 Vaccine recommendations
Page 6 INSTITUTE OF ENVIRONMENTAL SCIENCE AND RESEARCH LIMITEDINFLUENZA ACTIVITY IN NEW ZEALAND IN 2018 The national influenza surveillance system in New Zealand is an essential public health tool for assessing and implementing strategies to control influenza. The surveillance system includes community-based surveillance (National sentinel general practice surveillance, Healthline - telephone health advice service) and hospital-based surveillance (SARI surveillance, Ministry of Health data on publicly funded hospital discharges, laboratory-based surveillance for outpatients and hospital in-patients). COMMUNITY-BASED SURVEILLANCE NATIONAL SENTINEL GENERAL PRACTICE SURVEILLANCE New Zealand’s longitudinal sentinel GP-based surveillance system was established in 1989 as part of the World Health Organization’s (WHO) Global Influenza Surveillance and Response System. It is operated nationally by the ESR and locally by influenza surveillance co-ordinators in the public health services (PHS). Previously (1989–2015), every week during the influenza season from May to September (weeks 18–39), GPs are required to record the number of consultations for influenza-like illness (ILI) each week and the age group of the patient (
sub-typed as A(H3N2) or A(H1N1)pdm09. Influenza B viruses were further lineage-typed as
B/Yamagata or B/Victoria lineage. Eight non-influenza respiratory viruses were also tested:
respiratory syncytial virus, parainfluenza virus types 1, 2 and 3, rhinovirus, adenovirus, human
metapneumovirus and enterovirus.

Canterbury Health Laboratory reported to ESR weekly on the total number of swabs received from
each DHB and the influenza viruses identified, and updated details on influenza types and sub-
types from previous weeks. ESR reports national information on epidemiological and virological
surveillance of influenza weekly and yearly to relevant national and international organisations,
including the WHO, with reports published on the ESR website: https://surv.esr.cri.nz/virology.php.
Consultation rates were calculated using the registered patient populations of the participating
practices as a denominator.
The values for the different intensity levels were based on the framework from Pandemic Influenza
Severity Assessment (PISA) – a WHO guide to assess the severity of influenza in seasonal
epidemics and pandemics (http://apps.who.int/iris/bitstream/handle/10665/259392/WHO-WHE-
IHM-GIP-2017.2-eng.pdf;jsessionid=0D8C59A6D4E84A8C5AB9329CADAE374D?sequence=1)

In 2018, 80 sentinel practices were recruited from all 20 DHBs under ESR’s sentinel GP-based
surveillance with a total patient roll of 440,650. Virus transmissibility which reflects the ease of
movements of the influenza virus between individuals and communities was low in 2018. Influenza
like illness (ILI) and ILI-associated influenza consultation rates in 2018 were low and the activity
was later than previous years of 2013–2017 (Figure 1 to 4). From week 18 (commencing 30 April)
through week 39 (ending 30 September), consultation activity remained below the seasonal
threshold. The ILI consultation rate peaked in week 35 with the ILI consultation rate of 30.0 per
100,000.

                                        Figure 1. Weekly consultation rates for influenza-like illness in New Zealand, 2018

                                         35             ILI cases - all others
      Incidence per 100 000 residents

                                         30             ILI cases - influenza positive

                                         25

                                         20

                                         15

                                         10

                                          5

                                          0
                                                   19

                                                             21

                                                                       23
                                                                            24
                                                                                 25
                                                                                      26

                                                                                                 28

                                                                                                            30

                                                                                                                      32

                                                                                                                                34

                                                                                                                                          36

                                                                                                                                                     38
                                                                                                                                                          39
                                              18

                                                        20

                                                                  22

                                                                                           27

                                                                                                       29

                                                                                                                 31

                                                                                                                           33

                                                                                                                                     35

                                                                                                                                               37

                                                   May                 Jun                      July                  Aug                      Sep

                                                                                       Week 2018

December 2018                                                                          Vaccine recommendations
Page 8                                             INSTITUTE OF ENVIRONMENTAL SCIENCE AND RESEARCH LIMITED
Figure 2. Weekly ILI consultation rates in 2018 compared to 2013–2017
250
very high seasonal level
high seasonal level
200
Rate ILI consultations per 100,000 registered patients
moderate seasonal level
150
100
low seasonal level
50
baseline level
0
1 3 5 7 9 11 13 15 17 19 21 23 25 27 29 31 33 35 37 39 41 43 45 47 49 51
Week
2013 2014 2015 2016 2017 2018
Figure 3. Weekly ILI-associated influenza rates in 2018 compared to 2013–2017
90
very high seasonal level
80
high seasonal level
70
Rate SARI hospitalisations per 100,000 residents
moderate seasonal level
60
50
low seasonal level
40
30
20
10
baseline level
0
18 19 20 21 22 23 24 25 26 27 28 29 30 31 32 33 34 35 36 37 38 39 40
Week
2013 2014 2015 2016 2017 2018
Vaccine recommendations December 2018
INSTITUTE OF ENVIRONMENTAL SCIENCE AND RESEARCH LIMITED Page 9Figure 4. Weekly Consultation Rates for Influenza-like Illness in New Zealand, 1992–2018
700
Rate per 100 000 practice population
600
500
400
300
200
100
0
Year (week)
From week 18 (commencing 30 April 2018) through week 39 (ending 30 September 2018), a total
of 1830 consultations for ILI were reported from the 20 DHBs. The cumulative incidence of ILI
consultation during this period was 415.3 per 100,000 population. The average weekly ILI
consultation rate between weeks 18 and 39 was 18.3 per 100,000 population. Among the patients
that met the ILI case definition, 1466 (80.1%) had a specimen tested for influenza. Of these, 462
(31.5%) cases had influenza viruses detected (Table 2).
December 2018 Vaccine recommendations
Page 10 INSTITUTE OF ENVIRONMENTAL SCIENCE AND RESEARCH LIMITEDTable 2. Demographic characteristics of ILI and influenza cases, since 30 April 2018
ILI & influenza cases among sentinel practices
Characteristics Prop ILI Influenza
Influenza Influenza incidence incidence2
ILI cases
cases positive1 (per (per
(%) 100,000) 100,000)
Overall 1830 462 31.5 (100.0) 415.3 130.9
Age group (years)
80 32 4 14.3 (0.9) 214.3 30.6
Unknown 0 0 0.0
Ethnicity
Māori 200 43 30.7 (9.3) 333.5 102.4
Pacific peoples 69 15 27.3 (3.2) 251.9 68.7
Asian 183 51 33.6 (11.0) 477.1 160.1
European and Other 1377 353 31.5 (76.4) 437.2 137.9
Unknown 0 0 0.0
Sex
Female 1050 258 30.5 (55.8) 454.1 138.3
Male 780 204 33.0 (44.2) 372.5 122.8
Unknown 0 0 0.0
1
Proportion of cases tested which were positive for influenza viruses
2
Adjusted to positivity of tested cases
As in previous years, 2018 consultation rates for ILI varied greatly among DHBs (Table 3). From
week 18 (commencing 30 April) through week 39 (ending 30 September), Waitemata DHB had the
highest average consultation rate (76.1 per 100,000), followed by Auckland (62.2 per 100,000), and
South Canterbury (44.5 per 100,000).
Vaccine recommendations December 2018
INSTITUTE OF ENVIRONMENTAL SCIENCE AND RESEARCH LIMITED Page 11Table 3. Weekly consultation rate for influenza-like illness by District Health Board, 2018
Rate per 100,000
DHB Average
18 19 20 21 22 23 24 25 26 27 28 29 30 31 32 33 34 35 36 37 38 39
rate
Auckland 27.4 27.4 29.9 29.9 32.4 37.4 47.4 29.9 42.4 44.9 87.3 49.9 49.9 87.3 107.2 97.3 109.7 102.2 97.3 84.8 87.3 59.8 62.2
Bay of Plenty 0.0 4.9 0.0 0.0 4.9 0.0 9.7 19.4 14.6 14.6 19.4 14.6 4.9 0.0 4.9 9.7 4.9 9.7 9.7 0.0 0.0 4.9 6.9
Canterbury 2.0 6.0 10.0 8.0 6.0 10.0 6.0 6.0 10.0 6.0 10.0 6.0 16.0 10.0 12.0 20.1 20.1 26.1 38.1 42.1 26.1 16.0 14.2
Capital & Coast 7.9 2.6 5.2 23.6 10.5 13.1 10.5 5.2 10.5 18.4 5.2 15.7 13.1 10.5 18.4 44.6 57.7 65.6 34.1 76.1 36.7 31.5 23.5
Counties
Manukau 0.0 0.0 6.3 3.1 9.4 0.0 3.1 0.0 0.0 3.1 0.0 0.0 18.9 12.6 3.1 3.1 3.1 0.0 0.0 3.1 9.4 3.1 3.7
Hawke's Bay 0.0 21.4 21.4 14.3 7.1 7.1 14.3 7.1 28.6 14.3 14.3 7.1 28.6 35.7 21.4 14.3 14.3 28.6 42.9 50.0 64.3 14.3 21.4
Hutt Valley 0.0 0.0 0.0 0.0 0.0 0.0 0.0 0.0 0.0 0.0 0.0 0.0 0.0 0.0 0.0 0.0 0.0 0.0 0.0 0.0 0.0 3.3 0.1
Lakes 0.0 16.5 0.0 16.5 0.0 0.0 0.0 0.0 0.0 0.0 0.0 0.0 0.0 0.0 0.0 0.0 0.0 0.0 0.0 0.0 0.0 0.0 1.5
MidCentral 3.3 9.9 9.9 0.0 13.2 0.0 3.3 0.0 3.3 0.0 3.3 6.6 3.3 3.3 6.6 9.9 9.9 16.5 19.8 6.6 3.3 0.0 6.0
Nelson
Marlborough 10.0 10.0 0.0 10.0 20.1 10.0 10.0 0.0 20.1 20.1 10.0 40.1 0.0 10.0 10.0 0.0 20.1 0.0 0.0 20.1 0.0 40.1 11.8
Northland 0.0 0.0 0.0 0.0 0.0 0.0 0.0 0.0 0.0 0.0 23.6 78.6 39.3 15.7 47.2 23.6 7.9 23.6 15.7 15.7 23.6 7.9 14.7
South Canterbury 9.4 9.4 9.4 0.0 47.1 0.0 18.8 37.7 9.4 28.3 37.7 28.3 56.5 37.7 47.1 56.5 94.2 150.7 94.2 65.9 103.6 37.7 44.5
Southern 0.0 9.2 3.1 6.1 3.1 0.0 15.3 3.1 0.0 0.0 0.0 6.1 21.5 15.3 18.4 9.2 6.1 9.2 3.1 15.3 9.2 30.7 8.4
Tairawhiti 29.7 29.7 29.7 0.0 0.0 29.7 0.0 0.0 0.0 44.5 0.0 0.0 0.0 14.8 0.0 0.0 0.0 29.7 14.8 0.0 14.8 14.8 11.5
Taranaki 0.0 13.3 4.4 17.7 4.4 0.0 0.0 0.0 0.0 4.4 0.0 0.0 4.4 4.4 0.0 4.4 0.0 4.4 8.8 0.0 0.0 0.0 3.2
Waikato 9.4 16.9 22.6 13.2 20.7 3.8 16.9 16.9 13.2 9.4 16.9 16.9 24.4 20.7 22.6 22.6 16.9 15.0 11.3 15.0 15.0 7.5 15.8
Wairarapa 0.0 0.0 0.0 0.0 0.0 0.0 0.0 0.0 40.1 0.0 40.1 0.0 40.1 0.0 0.0 0.0 0.0 40.1 0.0 0.0 0.0 0.0 7.3
119.
Waitemata 0.0 23.8 53.6 41.7 59.6 107.3 125.2 89.4 119.2 95.4 89.4 2 125.2 71.5 65.6 101.3 89.4 47.7 95.4 65.6 71.5 17.9 76.1
West Coast 4.8 0.0 0.0 4.8 0.0 0.0 0.0 0.0 14.3 4.8 4.8 0.0 0.0 4.8 4.8 0.0 0.0 0.0 0.0 4.8 4.8 4.8 2.6
Whanganui 0.0 0.0 0.0 0.0 30.7 0.0 0.0 0.0 0.0 30.7 0.0 0.0 30.7 0.0 61.4 0.0 61.4 122.8 30.7 30.7 61.4 30.7 22.3
New Zealand 5.7 10.1 11.7 11.2 13.2 10.8 15.4 11.2 15.0 14.6 18.3 18.3 22.1 20.3 23.6 25.6 27.4 30.0 27.4 28.9 25.6 17.2 18.3
December 2018 Vaccine recommendations
Page 12 INSTITUTE OF ENVIRONMENTAL SCIENCE AND RESEARCH LIMITEDBetween 30 April to 30 September 2018, a total of 1473 ILI specimens were tested for influenza
viruses (Table 4) and 466 (31.6%) were positive, with more influenza A (426) than influenza B (39)
viruses. Additionally, a total of 1432 ILI specimens were tested for non-influenza viruses and 438
(30.6%) were positive with non-influenza viruses.
Table 4. Influenza and non-influenza respiratory viruses among ILI cases, 30 April–30 September
2018
ILI
Influenza viruses
Cases (%)
No. of specimens tested 1473
No. of positive specimens (%)1 466 (31.6)
Influenza A 426
A (not subtyped) 30
A(H1N1)pdm09 335
A(H1N1)pdm09 by PCR 289
A/Michigan/45/2015 (H1N1)pdm09 - like 46
A(H3N2) 61
A(H3N2) by PCR 58
A/Hong Kong/4801/2014 (H3N2) - like 2
A/Singapore/INFIMH-16-0019/2016 (H3N2) - like 1
Influenza B 39
B (lineage not determined) 3
B/Yamagata lineage 33
B/Yamagata lineage by PCR 17
B/Phuket/3073/2013 - like 16
B/Victoria lineage 3
B/Victoria lineage by PCR 3
B/Brisbane/60/2008 - like 0
Influenza and non-influenza co-detection (% +ve) 18 (3.9)
Non-influenza respiratory viruses ILI
Cases (%)
No. of specimens tested 1432
No. of positive specimens (%)1 438 (30.6)
Respiratory syncytial virus (RSV) 74
Parainfluenza 1 (PIV1) 40
Parainfluenza 2 (PIV2) 3
Parainfluenza 3 (PIV3) 29
Rhinovirus (RV) 175
Adenovirus (AdV) 62
Human metapneumovirus (hMPV) 62
Enterovirus 18
Single virus detection (% of positives) 416 (95.0)
Multiple virus detection (% of positives) 22 (5.0)
1
Number of specimens positive for at least one of the listed viruses; note a specimen may be positive for more than one virus.
Vaccine recommendations December 2018
INSTITUTE OF ENVIRONMENTAL SCIENCE AND RESEARCH LIMITED Page 13The temporal distribution of the number and proportion of the influenza viruses and non-influenza
respiratory viruses, from 30 April to 30 September 2018, is shown in Figure 5 and Figure 6.
Influenza A(H1N1)pdm09 was the predominant strain during this period.
Figure 5. Temporal distribution of the number and proportion of influenza viruses from ILI
specimens, by type and week
55 80
A (Not subtyped)
50
A(H1N1)pdm09 70
45 A(H3N2)
B (Lineage not 60
40
determined)
Proportion positive
B (Yamagata
Number of viruses
35 lineage) 50
B (Victoria)
30 Proportion positive
for influenza 40
25
20 30
15
20
10
10
5
0 0
18 19 20 21 22 23 24 25 26 27 28 29 30 31 32 33 34 35 36 37 38 39
May Jun July Aug Sep
Week (2018)
Figure 6. Temporal distribution of the number and proportion of non-influenza viruses from ILI
specimens, by type and week1
20 80
RSV
parainfluenza 1
70
parainfluenza 2
15 parainfluenza 3 60
rhinovirus
Proportion positive
Number of viruses
adenovirus 50
hMPV
10 40
enterovirus
Proportion positive for non-
influenza pathogen 30
5 20
10
0 0
18 19 20 21 22 23 24 25 26 27 28 29 30 31 32 33 34 35 36 37 38 39
May Jun July Aug Sep
Week (2018)
December 2018 Vaccine recommendations
Page 14 INSTITUTE OF ENVIRONMENTAL SCIENCE AND RESEARCH LIMITEDHEALTHLINE
Healthline is the free national 0800 24 hour telephone health advice service funded by the Ministry
of Health. Calls made to Healthline are triaged using electronic clinical decision support software.
Data collected are daily counts of all symptomatic calls made to Healthline and those triaged for
Influenza-Like-Illness (ILI). Note that about 70% of all calls to Healthline are symptomatic (other
calls not part of this analysis include queries for information etc).
Analysis is frequency based with alarms raised by identifying statistical deviations (aberations) from
previous calls. Data are reported for all ages and in five age bands (0–4, 5–14, 15–44, 45–64, 65+
years). The analysis of the call frequency is based on the cumulative summation (CUSUM)
algorithm implemented in Early Aberration Reporting System (EARS) application developed by the
Centres for Disease Control and Prevention (CDC), Atlanta, United States. EARS has three
sensitivity thresholds (high, medium and low). If the daily call count exceeds a threshold a flag is
signalled.
Cases of ILI are defined as those that are recorded in the Healthline database as having one of the
following 18 guidelines: adult fever; breathing problems; breathing difficulty – severe (paediatric);
colds (paediatric); cough (paediatric); cough – adult; fever (paediatric); flu-like symptoms or
known/suspected influenza; flu like symptoms pregnant; influenza (paediatric); headache;
headache (paediatric); muscle ache/pain; sore throat (paediatric); sore throat/hoarseness; sore
throat/hoarseness pregnant; upper respiratory tract infections/colds; upper respiratory tract
infections/colds – pregnant.
Figure 7 shows the weekly number of calls to Healthline for ILI during 2009–2018. Healthline calls
in 2018 were in the low range, similar to the level in 2016.
Figure 7. Weekly number of ILI-related calls to Healthline, 2010–2018
2500
2010
2011
Weekly number of ILI-related calls
2000 2012
2013
2014
1500 2015
2016
2017
1000
2018
500
0
1 3 5 7 9 11 13 15 17 19 21 23 25 27 29 31 33 35 37 39 41 43 45 47 49 51
January April July October
Vaccine recommendations December 2018
INSTITUTE OF ENVIRONMENTAL SCIENCE AND RESEARCH LIMITED Page 15HOSPITAL-BASED SURVEILLANCE HOSPITAL-BASED SEVERE ACUTE RESPIRATORY ILLNESS (SARI) SURVEILLANCE Inpatients with suspected respiratory infections admitted overnight to any of the four hospitals (Auckland City Hospital and the associated Starship Children’s Hospital, Middlemore Hospital and the associated Kidz First Children’s Hospital) in the Auckland District Health Board (ADHB) and Counties Manukau DHB, were screened by research nurses each day. Overnight admission is defined as: “A patient who is admitted under a medical team, and to a hospital ward or assessment unit”. Case ascertainment followed a surveillance algorithm. The presence of the components of the case definition was determined through a combination of reviewing the clinician’s admission diagnoses and by interviewing patients about their presenting symptoms. Records of all patients admitted overnight to medical wards were reviewed daily to identify anyone with a suspected respiratory infection. These patients were categorised into one of ten admission diagnostic syndrome groups. Research nurses then interviewed the patients and documented the components of the case definition of severe acute respiratory illness (SARI) that were present and ascertain the patients whether meeting the SARI case definition. The case definition being used is the World Health Organisation (WHO) SARI case definition: “an acute respiratory illness with a history of fever or measured fever of ≥38°C, and cough, and onset within the past 10 days, and requiring inpatient hospitalisation”. If a patient with suspected respiratory infection met the SARI case definition, a respiratory sample was collected to test for influenza and other respiratory pathogens. In addition, patient information was captured via a case report form which included patient demographics, presenting symptoms and illness, pre-hospital healthcare, medication usage, influenza vaccination history, co-morbidities, disease course and outcome, including major treatments, ICU admission and mortality, epidemiologic risk factors and laboratory results. The total numbers of all new hospital inpatient acute admissions and newly assessed and tested patients, including ICU admissions and deaths were collected. This allowed calculation of population-based incidence for SARI and associated influenza cases overall and stratified by age, sex, ethnicity and socio-economic status among the ADHB and CMDHB resident population (from 2013 census data). Incidence rates were calculated along with 95% confidence intervals (95%CI). In addition, this allowed the calculation of the proportion of SARI and associated influenza cases, including ICU admissions and deaths, by overall and stratified patients, among all acute admissions regardless of residence status. An acute admission is defined as an unplanned admission on the day of presentation at the admitting health care facility. Admission may have been from the emergency or outpatient departments of the health care facility, a transfer from another facility or a referral from primary care. The overall impact of influenza on healthcare use in hospitals and ICU admissions was low in 2018. Severe acute respiratory illness (SARI) and influenza-associated SARI hospitalization rates in 2018 were at a low level (Figure 8 and Figure 9). From week 18 (commencing 30 April) through week 39 (ending 30 September), SARI hospitalisation rates remained below the seasonal threshold with the exception of a peak at week 33 (ending 19 August). SARI-associated influenza hospitalisation rates in 2018 were at a low level (Figure 10). December 2018 Vaccine recommendations Page 16 INSTITUTE OF ENVIRONMENTAL SCIENCE AND RESEARCH LIMITED
Figure 8. Weekly resident SARI and SARI-associated influenza incidence, 2018
12 SARI cases - all others
Incidence per 100 000 residents
SARI cases - influenza positive
10
8
6
4
2
0
19
21
23
24
25
26
28
30
32
34
36
38
39
18
20
22
27
29
31
33
35
37
May Jun July Aug Sep
Week 2018
Figure 9. Weekly hospitalisation rates for SARI in 2018 compared to 2012–2017
18
very high seasonal level
16
high seasonal level
14 moderate seasonal level
Rate SARI hospitalisations per 100,000 residents
12
low seasonal level
10
8
baseline level
6
4
2
0
1 3 5 7 9 11 13 15 17 19 21 23 25 27 29 31 33 35 37 39 41 43 45 47 49 51
Week
2012 2013 2014 2015 2016 2017 2018
Vaccine recommendations December 2018
INSTITUTE OF ENVIRONMENTAL SCIENCE AND RESEARCH LIMITED Page 17Figure 10. Weekly hospitalisation rates for SARI-associated influenza in 2018 compared to 2012–2017
7
very high seasonal level
6
high seasonal level
Rate SARI influenza hospitalisations per 100,000 residents
5
moderate seasonal level
4
3
low seasonal level
2
1
baseline level
0
1 3 5 7 9 11 13 15 17 19 21 23 25 27 29 31 33 35 37 39 41 43 45 47 49 51
Week
2012 2013 2014 2015 2016 2017 2018
Seriousness of disease (ie, severity) that indicates the extent to which individuals get sick when
infected with the influenza virus was high in 2018 as measured by the ratio of influenza-associated
ICU admission over influenza-associated hospitalization. It has been noticed that when influenza
A(H1N1)pdm09 virus was the predominant strain in 2018, 2014, it appeared to be associated with
high level of severity (Figure 11).
December 2018 Vaccine recommendations
Page 18 INSTITUTE OF ENVIRONMENTAL SCIENCE AND RESEARCH LIMITEDFigure 11. Seriousness of disease indicator in 2018 compared to 2012–2017
14 80
70
12 Extraordinary: >mean+3SD
Ratio SARI ICU influenza/SARI influenza (%)
60
10
Proportion (%) A(H1N1)pdm09/all influenza viruses
50
8 High: Mean+1SD to mean+3SD
40
Moderate: Mean to mean+1SD
6
Low : < mean 30
4
20
2
10
0 0
2012 2013 2014 2015 2016 2017 2018
Year
From 30 April to 30 September 2018, there were 62,168 acute admissions to ADHB and CMDHB
hospitals. A total of 2261 patients with suspected respiratory infections were assessed in these
hospitals. Of these, 1486 (65.7%) patients met the SARI case definition. Among these, 1160 were
residents of ADHB and CMDHB, giving the SARI incidence rate of 105.8 per 100,000 population
(Table 4). Among the 1011 tested SARI cases who were ADHB and CMDHB residents, 250
(24.7%) had positive influenza virus results. This gives a SARI related influenza incidence
(adjusted for non-testing) of 26.2 per 100,000 population.
Between 30 April and 30 September 2018, the 1486 SARI cases give a SARI proportion of 23.9
per 1000 acute hospitalisations (Table 5). Of these SARI cases, 35.7% were children aged less
than 5 years and 19.7% were adults 65 years and older. One hundred and fourteen SARI cases
have been admitted to ICU and 16 SARI-related deaths were reported during this period.
Vaccine recommendations December 2018
INSTITUTE OF ENVIRONMENTAL SCIENCE AND RESEARCH LIMITED Page 19Table 5. Demographic characteristics of SARI cases and related influenza cases, since 30 April 2018
SARI & influenza cases SARI & influenza cases among ADHB & CMDHB
among all hospital patients residents
Characteristics Influenza
Influenza SARI
SARI Cases SARI Influenza incidence
positive1 incidence
(%) cases Cases (per
(%) (per 100,000)
100,000)
Overall 1486 (65.7) 275 (24.9) 1160 105.8 250 26.2
Age group (years)
80 103 (53.1) 26 (27.4) 101 369.0 25 99.2
Unknown 241 (52.5) 7 (38.9) 3 0.0 1
Ethnicity
Māori 261 (62.4) 40 (17.6) 238 182.1 39 34.3
Pacific peoples 469 (74.1) 111 (27.5) 453 261.1 103 69.0
Asian 119 (75.8) 26 (25.2) 113 35.0 24 8.6
European and Other 395 (66.8) 90 (25.6) 352 74.9 82 19.6
Unknown 242 (52.4) 8 (42.1) 4 2
Hospitals
ADHB 754 (89.5) 119 (23.7) 478 88.7 99 20.5
CMDHB 732 (51.6) 156 (25.9) 682 122.3 151 31.7
Sex
Female 611 (69.3) 143 (26.5) 569 102.5 135 27.7
Male 633 (68.9) 125 (22.9) 586 108.2 114 24.3
Unknown 242 (52.6) 7 (33.3) 5 0.0 1 0.0
1
Proportion of cases tested which were positive for influenza viruses
From 30 April to 30 September 2016, 1190 SARI specimens have been tested and 286 (24.0%)
were positive for influenza viruses with more influenza A (266) than influenza B (19) viruses (Table
6). Additionally, 1311 SARI specimens were tested for non-influenza respiratory viruses.
December 2018 Vaccine recommendations
Page 20 INSTITUTE OF ENVIRONMENTAL SCIENCE AND RESEARCH LIMITEDTable 6. Influenza and non-influenza respiratory viruses among SARI cases, 30 April to 30 September
2018
Influenza viruses SARI SARI and non-SARI
Cases (%) ICU (%) Deaths (%)
No. of specimens tested 1190 204 22
No. of positive specimens (%)1 286 (24.0) 42 (20.6) 8 (36.4)
Influenza A 266 39 7
A (not subtyped) 82 15 2
A(H1N1)pdm09 145 21 4
A(H1N1)pdm09 by PCR 142 20 4
A/Michigan/45/2015 (H1N1)pdm09 - like 3 1 0
A(H3N2) 39 3 1
A(H3N2) by PCR 39 3 1
A/Hong Kong/4801/2014 (H3N2) - like 0 0 0
A/Singapore/INFIMH-16-0019/2016 (H3N2) - like 0 0 0
Influenza B 19 2 1
B (lineage not determined) 19 2 1
B/Yamagata lineage 0 0 0
B/Yamagata lineage by PCR 0 0 0
B/Phuket/3073/2013 - like 0 0 0
B/Victoria lineage 0 0 0
B/Victoria lineage by PCR 0 0 0
B/Brisbane/60/2008 - like 0 0 0
Influenza and non-influenza co-detection (% +ve) 16 (5.6) 3 (7.1) 0 (0.0)
Non-influenza respiratory viruses SARI SARI and non-SARI
Cases (%) ICU (%) Deaths (%)
No. of specimens tested 1311 208 27
No. of positive specimens (%)1 483 (36.8) 98 (47.1) 6 (22.2)
Respiratory syncytial virus (RSV) 226 56 3
Parainfluenza 1 (PIV1) 31 4 0
Parainfluenza 2 (PIV2) 1 0 0
Parainfluenza 3 (PIV3) 37 7 0
Rhinovirus (RV) 108 30 3
Adenovirus (AdV) 151 30 1
Human metapneumovirus (hMPV) 100 4 0
Enterovirus 12 8 0
Single virus detection (% of positives) 319 (66.0) 64 (65.3) 0 (-)
Multiple virus detection (% of positives) 168 (34.8) 35 (35.7) 0 (-)
1
Number of specimens positive for at least one of the listed viruses; note a specimen may be positive for more than one virus
The temporal distribution of the number and proportion of the influenza viruses and non-influenza
respiratory viruses is shown in Figure 12 and Figure 13. Influenza A(H1N1)pdm09 was the
predominant strain between 30 April to 30 September 2018.
Vaccine recommendations December 2018
INSTITUTE OF ENVIRONMENTAL SCIENCE AND RESEARCH LIMITED Page 21Figure 12. Temporal distribution of the number and proportion of influenza viruses from SARI
specimens, by type and week1
45 80
A (Not subtyped)
40 70
A(H1N1)pdm09
A(H3N2)
35
B (Lineage not 60
determined)
Proportion positive
30 B (Yamagata
Number of viruses
lineage) 50
B (Victoria)
25 Proportion positive
for influenza 40
20
30
15
20
10
5 10
0 0
18 19 20 21 22 23 24 25 26 27 28 29 30 31 32 33 34 36 37 38 39
May Jun July Aug Sep
Week (2018)
Figure 13. Temporal distribution of the number and proportion of non-influenza viruses from SARI
specimens, by type and week1
45 80
RSV
40 parainfluenza 1 70
parainfluenza 2
35
parainfluenza 3
60
Proportion positive
30
Number of viruses
rhinovirus
50
adenovirus
25
hMPV 40
20 enterovirus
Proportion positive for non- 30
15 influenza pathogen
20
10
5 10
0 0
18 19 20 21 22 23 24 25 26 27 28 29 30 31 32 33 34 35 36 37 38 39
May Jun July Aug Sep
Week (2018)
1
Figures for recent weeks will be underestimates due to time lag in receiving laboratory test results
December 2018 Vaccine recommendations
Page 22 INSTITUTE OF ENVIRONMENTAL SCIENCE AND RESEARCH LIMITEDMINISTRY OF HEALTH DATA ON PUBLICLY FUNDED HOSPITAL
DISCHARGES
Hospitalisation data for influenza (ICD-10AM-VI code I (J09-J11) for 2018 which correlate with
previous versions of ICD-10AM codes J10-J11, were extracted from the New Zealand Ministry of
Health’s NMDS (by discharge date). In this dataset, people who received less than 1 day of
hospital treatment in hospital emergency departments were excluded from any time series analysis
of influenza hospitalisations during 2000–2018. Influenza-related hospitalisations were
conservatively taken to include only those cases where influenza was the principal diagnosis.
Repeat admissions were included, as infections with another influenza A subtype or B virus are
possible.
From 1 January to 7 September, there were a total of 1060 hospitalisations (22.1 per 100,000) for
influenza (Figure 14). Influenza hospitalisation coding has not been completed for the year. This
data only captured a proportion of influenza cases for the winter season of 2018.
Figure 14. Influenza hospital discharges, 2000–2018*
70
60
50
Rate per 100,000
40
30
20
10
0
2000 2001 2002 2003 2004 2005 2006 2007 2008 2009 2010 2011 2012 2013 2014 2015 2016 2017 2018*
Year
*Data from 1 Jan to 7 Sep only. Source: Ministry of Health, NMDS (Hospital Events)
Vaccine recommendations December 2018
INSTITUTE OF ENVIRONMENTAL SCIENCE AND RESEARCH LIMITED Page 23Figure 15 shows influenza hospitalisations by week discharged. The highest number of
hospitalisations (392) occurred in August (weeks 31–34).
Figure 15. Influenza hospital discharges by week, 2018*
140
120
Number of hospital discharges
100
80
60
40
20
0
1 3 5 7 9 11 13 15 17 19 21 23 25 27 29 31 33 35 37 39 41 43 45 47 49 51
Week
*Data from 1 Jan to 7 Sep only. Source: Ministry of Health, NMDS (Hospital Events)
From 1 January to 7 September 2018, the highest influenza hospitalisation rates were recorded
among those aged 80 years (66.8 per 100,000)
(Figure 16).
Figure 16. Influenza hospital discharge rates by age group, 2018*
100
90
80
70
Rate per 100,000
60
50
40
30
20
10
0
80
Age group (years)
*Data from 1 Jan to 7 Sep only. Source: Ministry of Health, NMDS (Hospital Events)
December 2018 Vaccine recommendations
Page 24 INSTITUTE OF ENVIRONMENTAL SCIENCE AND RESEARCH LIMITEDThe ethnic distribution of influenza hospitalisations in 2018 is shown in Figure 17. Pacific peoples
had the highest hospitalisation rate (72.4 per 100,000, 216 hospitalisations) followed by European
or Other (38.3 per 100,000, 483 hospitalisations). Māori (30.4 per 100,000 populations, 216) and
Asian (21.4 per 100,000 populations, 118 hospitalisations) ethnic groups had the lowest rate of
hospitalisations.
Figure 17. Hospital discharge rates by prioritised ethnic group, 2018*
80
70
60
Rate per 100,000
50
40
30
20
10
0
Māori Pacific peoples Asian European or Other
Ethnic group
*Data from 1 Jan to 7 Sep only. Source: Ministry of Health, NMDS (Hospital Events)
Vaccine recommendations December 2018
INSTITUTE OF ENVIRONMENTAL SCIENCE AND RESEARCH LIMITED Page 25You can also read