Reef Check Australia2 - cloudfront.net
←
→
Page content transcription
If your browser does not render page correctly, please read the page content below
Reef Check Australia                                                             2

South East Queensland
Season Summary Report 2020-2021

         REEF CHECK AUSTRALIA
         www.reefcheckaustralia.org
         This report should be cited as: J. Salmond and J Schubert. Reef Check
         Australia South East Queensland Season Summary Report 2020-2021. Reef
         Check Foundation Ltd.
This project was made possible by a network of dedicated volunteers, generous dive operators, wise
advisors, innovative collaborators and supportive funding agencies.

Thank you to the dedicated citizen scientists who have contributed to survey activities and entered
data: Tania Alajo, Ashleigh Borra, Ilha Byrne, Paul Colquist, Philip Dunbavan, Donna Easton, Terry Farr,
Monique Grol, Andy Holland, Chris Klaas, Eva Kovacs, Emily Lansdown, Lisa McComb, Rachel McVeigh,
Peter Nicholls, Andrew O’Hagan, Devin Rowell, Jodi Salmond, Julie Schubert, Mark Stenhouse, Cheryl
Tan, Cedric van den Berg, Breanne Vincent & Lucy Wells.

A special note of acknowledgement to our trainers, professional volunteers and staff: Jody Kreuger,
Josh Passenger, Jodi Salmond and Julie Schubert.

Many of the images used within this document were taken by Reef Check Australia General Manager
Jodi Salmond and SEQ Survey Coordinator Julie Schubert. The image on the front was taken from
Mudjimba Island on the Sunshine Coast by Jodi Salmond.

Project activities were conducted on the traditional lands of the Quandamooka People, Kabi Kabi First
Nation and Yugambeh People. We acknowledge and pay respect to the past, present and future
Traditional Custodians and Elders of this nation and the continuation of cultural, spiritual and
educational practices of Aboriginal and Torres Strait Islander peoples

This project is supported by Reef Check Australia, through funding from the City of Gold Coast, Port of
Brisbane, and the Sunshine Coast Council.

This report should be cited as: J. Salmond and J Schubert
Reef Check Australia South East Queensland Season Summary Report 2020-2021.
Reef Check Foundation Ltd.
2|Page
Message from our General Manager
Around the world, reefs are under pressure from factors such as pollution, development, climate change and
heavy human use of ocean environments. Climate change continues to be the greatest threat to the future of
coral reefs around the world, but we continue to do what we can to inspire, educate and engage those around
us to make the best possible choices for the health of our oceans, and the future of our planet.

The 2020-2021 season was full of challenges for us all. The entire Reef Check Australia team has been working
hard to clean up our coastline, catchments and oceans with a variety of clean-up activities. We have participated
in a huge number of community education and engagement events, despite the challenges, and we continued
vital reef health monitoring along the length of the South East Queensland coastline, despite unpredictable
weather patterns joining forces with the big C to do their collective best to foil continually updated plans. Survey
expeditions were cancelled and rescheduled. Community events were set up and shut down hours later.

But we persevered.

This past year has taught us many things. Resilience, adaptability, and gratitude. We have sharpened our
MacGyver skills and are not only able to adapt quickly, but we can also make just about anything out of zip ties
and duct tape. We have reconnected with ourselves, each other and the world around us. Some of us have
mastered zoom and team meetings. Some of us are still learning. Importantly, we have worked together.

As we look back on the past 12 months, I want to take a moment to say thank you. Thank you to every individual,
community group, business and volunteer that has helped us all get to where we are. It is due to the outstanding
support of funding partners, and the dedicated efforts of oh so many amazing individuals that make up Reef
Check Australia that we are able to continue to do what we all love; better understand, appreciate and work to
protect our marine ecosystems. I am truly thankful to be surrounded by such an amazing team, and community.
Thank you to each and every one of you for your support, kind words and dedication to our reefs and oceans.

To find out more about our activities or help to support us, please visit our website: www.reefcheckaustralia.org.

Jodi Salmond
General Manager, Reef Check Australia

A big Thank you to industry supporters who provided in-kind support during this survey season for surveys,
volunteer training events and advice including: Gold Coast Dive Adventures, GO Dive Brisbane, Subsurface
Scuba and Kirra Dive.

3|Page
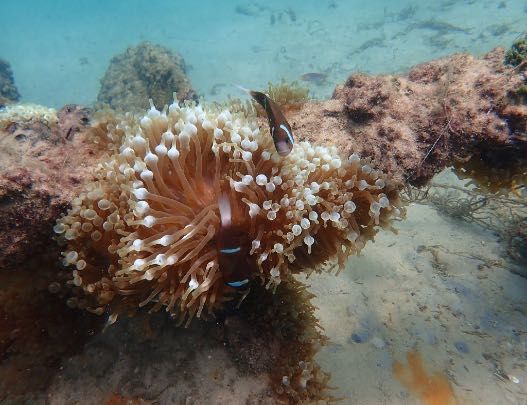
Table of Contents
Message from our General Manager .............................................................................................................. 3

1.0        PROJECT INTRODUCTION.................................................................................................................. 6

1.1        MONITORING SITES .......................................................................................................................... 8

1.2        KEY FINDINGS FROM 2020-2021 SURVEYS: ..................................................................................... 10
   1.2.1        SUBSTRATE........................................................................................................................................ 10
   1.2.2        IMPACTS: CORAL BLEACHING ........................................................................................................... 11
   1.2.3        IMPACTS: CORAL DAMAGE............................................................................................................... 15
   1.2.4        IMPACTS: CORAL DISEASE ................................................................................................................ 15
   1.2.5        IMPACTS: MARINE DEBRIS ............................................................................................................... 15
   1.2.6        IMPACTS: CORAL SCARRING ............................................................................................................. 15
   1.2.7        INVERTEBRATE ABUNDANCE............................................................................................................ 17
   1.2.8        FISH ABUNDANCE ............................................................................................................................. 18
   1.2.9        RARE ANIMALS ................................................................................................................................. 18

2.0 SUNSHINE COAST SITE REPORTS............................................................................................................. 19
   2.1 BULCOCK BEACH, THE BOARDWALK ........................................................................................................ 19
   2.2 CURRIMUNDI REEF, SITE 1 ........................................................................................................................ 20
   2.3 CURRIMUNDI REEF, SITE 2 ........................................................................................................................ 21
   2.4 CURRIMUNDI REEF, SITE 3 ........................................................................................................................ 22
   2.5 INNER GNEERINGS, THE CAVES; SITE 1 ..................................................................................................... 23
   2.6 INNER GNEERINGS, THE CAVES; SITE 2 ..................................................................................................... 24
   2.7 KINGS BEACH ............................................................................................................................................. 25
   2.8 MOOLOOLABA RIVER, LA BALSA NORTH ................................................................................................. 26
   2.9 MUDJIMBA ISLAND, NORTHWEST ............................................................................................................ 27
   2.10 MUDJIMBA ISLAND, THE LEDGE; S1 ....................................................................................................... 28
   2.11 MUDJIMBA ISLAND, THE LEDGE; S2 ....................................................................................................... 29
   2.12 MUDJIMBA ISLAND, THE LEDGE; S3 ....................................................................................................... 30

3.0 INSHORE MORETON BAY SITE REPORTS: ................................................................................................ 31
   3.1 AMITY POINT, SITE 1 ................................................................................................................................. 31
   3.2 AMITY POINT, SITE 2 ................................................................................................................................. 32
   3.3 GREEN ISLAND NORTH, SITE 1 .................................................................................................................. 33
   3.4 GREEN ISLAND WEST, SITE 1 ..................................................................................................................... 34
   3.5 MUD ISLAND, CORAL GALORE .................................................................................................................. 35
4|Page
3.6 MUD ISLAND, RUBBLE PATCH ................................................................................................................... 36
    3.7 ST HELENA, PALINDROME......................................................................................................................... 37
    3.8 ST HELENA, RAY OF SUNSHINE ................................................................................................................. 38

4.0 OUTER MORETON BAY SITE .................................................................................................................... 39
    4.1 SHAG ROCK ISLAND, EAST......................................................................................................................... 39
    4.2 SHAG ROCK ISLAND, WEST ....................................................................................................................... 40
    4.3 FLAT ROCK, SHARK GULLEY....................................................................................................................... 41
    4.4 FLAT ROCK, THE NURSERY ........................................................................................................................ 42

5.0 GOLD COAST SITE REPORTS: ................................................................................................................... 43
    5.1 PALM BEACH REEF, SITE 1 ......................................................................................................................... 43
    5.2 PALM BEACH REEF, SITE 2 ......................................................................................................................... 44
    5.3 GOLD COAST SEAWAY, SOUTHWEST WALL; SITE 1 .................................................................................. 45
    5.4 GOLD COAST SEAWAY, THE PIPE; SITE 1................................................................................................... 46
    5.5 NARROWNECK REEF; SITE 1 ...................................................................................................................... 47
    5.6 WAVEBREAK ISLAND; SITE 1 ..................................................................................................................... 48
    5.7 KIRRA REEF; SITE 1 .................................................................................................................................... 49
    5.8 COOK ISLAND; SITE 1 ................................................................................................................................. 50

6.0 TEAM PHOTOS ....................................................................................................................................... 51

7.0 LITERATURE CITED.................................................................................................................................. 52

5|Page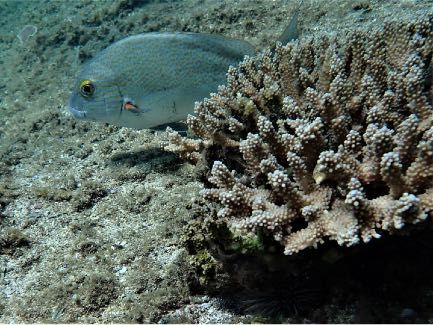
1.0 PROJECT INTRODUCTION
Since 2001, Reef Check Australia (RCA) has supported citizen science reef monitoring projects on reefs
around Australia. For the past 19 years, our surveys have helped with the collection of long-term data
relating to reef health at a local, national and global scale.

RCA’s survey methods collect quantitative data for substrate cover, key invertebrate species, target
fish species, as well as anthropogenic and natural impacts in reef habitats.

This report presents a summary of the findings for surveys conducted in South East Queensland (SEQ)
during the 2020-2021 season. Teams of trained volunteers monitored a total of 32 locations on 18
different reefs, which included survey sites ranging from Mudjimba Island on the Sunshine Coast to
Cook Island south of the Gold Coast. Of these 32 locations, 6 reefs are surveyed twice annually (Mud
Island – Coral Galore and Rubble Patch; St Helena Island – Palindrome and Ray of Sunshine; Green
Island – North and West), all remaining sites are only surveyed once per annum. 12,800m2 of reef
habitat was surveyed in total during the 2020-2021 season (where one survey covers 400m2), resulting
in more than 7000 pieces of data collected, and more than 1,200 hours donated by trained volunteers.

Image 1A Resident schools of fish – Mudjimba Island   Image 1B Moray eel – Currimundi Reef

The SEQ region is divided into the five sub-regions: Noosa, Sunshine Coast, Outer Moreton Bay,
Inshore Moreton Bay and Gold Coast. Some existing RCA monitoring locations were not visited during
the 2020-2021 survey season due to a down-turn in funding resources. Survey site locations are
documented in Table 1 below and those not surveyed in 2020-2021 are shown in italics.

6|Page
Table 1. List of all RCA survey reefs in South East Queensland by Sub-region. Reefs not visited during the 2020-2021 survey
season are represented in italics.
                                               INSHORE MORETON              OUTER MORETON
        NOOSA           SUNSHINE COAST                                                                  GOLD COAST
                                                     BAY                         BAY
 Granite Bay            Bulcock Reef           Amity Point                Flat Rock Island           Cook Island
 Hancocks Shoal         Currimundi Reef        Goat Island                Flinders Reef              Gold Coast Seaway
 Jew Shoal              Dead Mans Reef         Green Island               Hutchinsons Shoal          Kirra Reef
 Little Halls Reef      Inner Gneerings        Macleay Island             Marietta Dal               Narrowneck Reef
 The Caves              Kings Beach            Mud Island                 Shag Rock Island           Palm Beach Reef
                        Mooloolah River        Myora Reef                                            Palm Beach Artificial
                                                                                                     Reef
                        Mudjimba (Old          Peel Island                                           Wavebreak Island
                        Woman) Island
                                               St Helena Island

Faced with uncertainty on the survival of coral reefs due to increased impacts from climate change,
scientists are investigating ways of creating heat resistant corals (e.g. Buerger et al. 2020) to provide
options for the survival of reefs into the future. Subtropical reefs such as those in South East
Queensland are therefore likely to become increasingly important habitats with potential poleward
range shifts in marine organisms (Beger et al. 2014) without the capacity to rapidly adapt to increasing
ocean temperatures and acidification. However these reefs are also subject to thermal stresses in
subtropical and endemic species (Cant et al. 2020).

The reefs of South East Queensland have demonstrated resilience over the years of monitoring
conducted by Reef Check Australia. Whilst percentages of hard and soft corals and algae have
fluctuated from year to year (or season to season in Moreton Bay), none of the areas surveyed
regularly have shown significant long term loss of coral cover, with the exception of Kings Beach. This
area was heavily impacted by floods in 2011 and coral cover on transect has not recovered to pre-
flood levels (Figure 2.7.1). However numerous hard corals were observed in the shallows during the
most recent survey so we hope this is a pre-cursor to overall improvement in this area.

Continued monitoring is important in these habitats to constantly monitor change, positive or
otherwise, else we risk the force of shifting baseline syndrome. As stated by Callum Roberts;

  “this tendency (of shifting baseline syndrome) renders each new generation blind to past losses,
                setting their personal baseline of normality by what they first find”

7|Page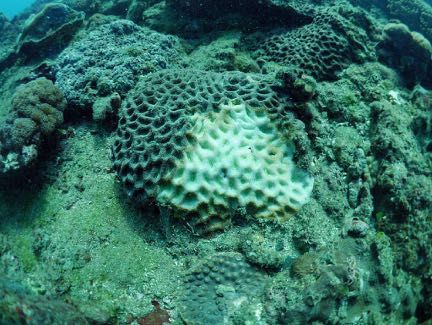
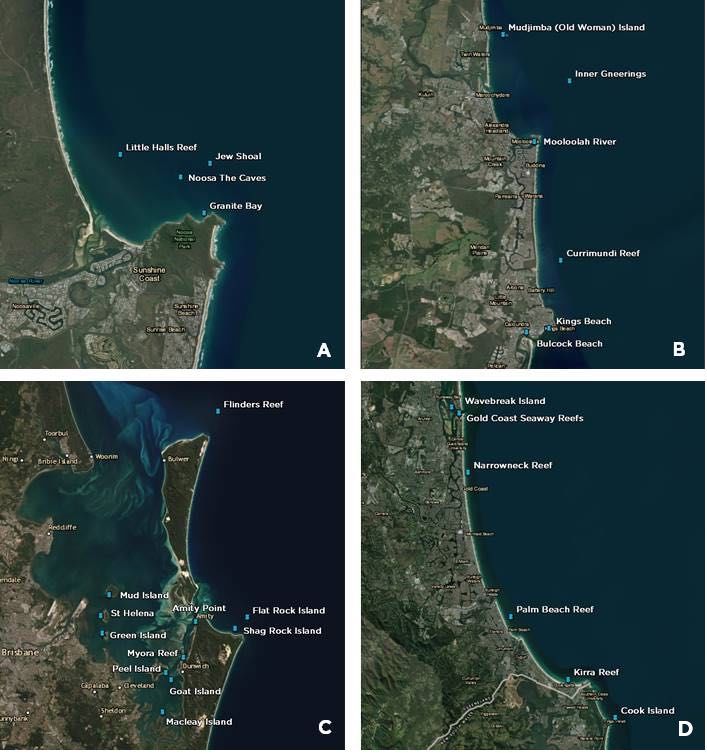
1.1   MONITORING SITES
In the 2020-2021 season, RCA monitored sites along the SEQ coast from Mudjimba Island off the
Sunshine Coast all the way to Cook Island south of the Gold Coast (see Figure 1.1 for map locations).
Reef habitats at the survey sites varied from inshore to offshore areas, and included reef flats, crests
and slopes. Sites also spanned protected (marine national park, no-take zones) and non-protected
areas. Of the 18 reefs surveyed, seven were within the Moreton Bay Marine Park.

 Figure 1: Map of South East Queensland survey sites from Google Earth, A: Noosa; B: Sunshine Coast; C: Moreton Bay;
 D: Gold Coast. Note that Noosa, Flinders Reef and a number of inner and outer Moreton Bay sites were not surveyed
 this season.

8|Page
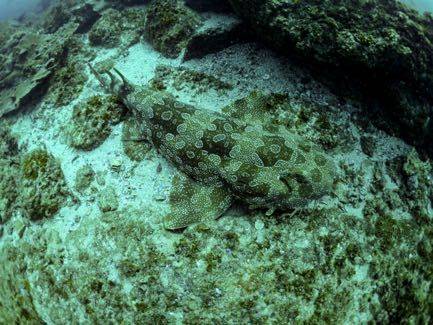
Table 2: Table of RCA monitoring locations from Mudjimba Island to Gold Coast visited in the 2020-2021 SEQ season,
including site number, location, depth, year of initial survey and site designation. Site designation includes four zones
within the Moreton Bay Marine Park: Marine National Park (MNP), Conservation Park (CP), Habitat Protection (HP) and
Ramsar Wetland site status (Ramsar).

                                SITE                                          DEPTH
        LOCATION                                       SITE                                1st SURVEY        SITE ZONING
                                  #                                            (m)
        Sunshine Coast           1            Bulcock Beach, Boardwalk           4             2018           MNP, Ramsar
        Sunshine Coast           1                 Currimundi Reef               9             2009
        Sunshine Coast           2                 Currimundi Reef               9             2009
        Sunshine Coast           3                 Currimundi Reef               9             2019
        Sunshine Coast           1           Inner Gneerings, The Caves          9             2009
        Sunshine Coast           2           Inner Gneerings, The Caves          9             2013
        Sunshine Coast           1                    Kings Beach                5             2009           MNP, Ramsar
        Sunshine Coast           1            Mooloolah River, La Balsa          5             2018
        Sunshine Coast           1           Mudjimba Island, NW Reef            9             2013
        Sunshine Coast           1          Mudjimba Island, The Ledge           5             2007
        Sunshine Coast           2          Mudjimba Island, The Ledge           9             2013
        Sunshine Coast           3          Mudjimba Island, The Ledge           6             2013
     Inshore Moreton Bay         1                    Amity Point                9             2016            CP, Ramsar
     Inshore Moreton Bay         2                    Amity Point                5             2016            CP, Ramsar
     Inshore Moreton Bay         1                Green Island, North            5             2015            CP, Ramsar
     Inshore Moreton Bay         1                Green Island, West             5             2017            CP, Ramsar
     Inshore Moreton Bay         1             Mud Island, Coral Galore          5             2017            HP, Ramsar
     Inshore Moreton Bay         1            Mud Island, Rubble Patch           5             2017            HP, Ramsar
     Inshore Moreton Bay         1              St Helena, Palindrome            5             2018           MNP, Ramsar
     Inshore Moreton Bay         1            St Helena, Ray of Sunshine         5             2018           MNP, Ramsar
      Outer Moreton Bay          1                  Shag Rock, East              9             2008                HP
      Outer Moreton Bay          1                 Shag Rock, West               9             2009                HP
      Outer Moreton Bay          1              Flat Rock, Shark Gulley          9             2009               MNP
      Outer Moreton Bay          1              Flat Rock, The Nursery           9             2008               MNP
          Gold Coast             1          Gold Coast Seaway, SW Wall           5             2007
          Gold Coast             1          Gold Coast Seaway, The Pipe          5             2015
          Gold Coast             1                 Palm Beach Reef               9             2007
          Gold Coast             2                 Palm Beach Reef               9             2009
          Gold Coast             1                 Wavebreak Island              9             2019
          Gold Coast             1                 Narrowneck Reef               9             2007
          Gold Coast             1                     Kirra Reef                5             2016
          Gold Coast             1                    Cook Island                7             2019          Aquatic Reserve

9|Page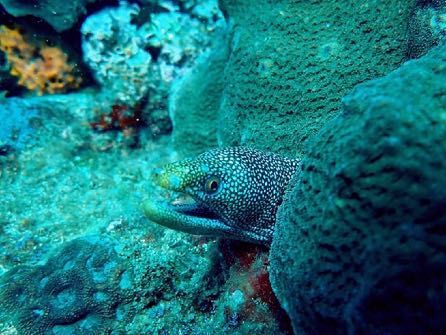
1.2     KEY FINDINGS FROM 2020-2021 SURVEYS:
The 2020-2021 season included surveys at 32 monitoring locations.

1.2.1 SUBSTRATE
Of the 32 locations surveyed, most remained relatively
stable in hard coral cover. Twelve locations had decreases
of less than 10%, six locations had increases of less than
10%, with the remainder showing no change. One site
showed an increase in hard coral cover greater than 10%
(Inner Gneerings, Site 1 – 11%). Soft coral remained
relatively stable, with increases above 10% at Currimundi
Reef (Site 1 - 9%, Site 2 – 12% and Site 3 – 17%) and
Mudjimba Island (Northwest Reef – 12%). Soft coral
                                                                Image 1.2.1A Mudjimba Island (Gary Cranitch)
decreased at one location (Inner Gneerings, Site 1 – 10%).

Hard coral cover ranged from 0% found at Bulcock Beach,
Gold Coast Seaway South West Wall & The Pipe; Kirra Reef;
Mooloolah River; Narrowneck Artificial Reef and
Wavebreak Island to 46% at Mudjimba Island, North West
Reef. The average hard coral cover across all surveyed
locations was 15% (not including sites with no hard coral
recorded). This overall regional average is consistent with
previous years.

The most predominant substrate type recorded across all         Image 1.2.1B Happy surveyors
32 survey sites was rock, attributing to 36% of the benthos
surveyed (this includes all RCA rock categories; rock (RC),
rock covered with coralline algae (RCCA) and rock covered
with turf algae (RCTA). Silt accounted for the second most
abundant substrate, with 26%, sand made up 18%, whilst
soft coral made up 10%. These percentages are based on
the number of sites on which these substrate categories
were recorded. High levels of silt were detected at St
Helena Palindrome (72% during the summer survey),
Mooloolah River – 55% and the Gold Coast Seaway (The
Pipe – 57%, South-west Wall – 54%).                             Image 1.2.1C Umbraculum umbraculum – Sea slug

10 | P a g e
1.2.2 IMPACTS: CORAL BLEACHING Coral bleaching was recorded on 21 of the 32 survey sites (66% of survey sites) which is a slight reduction from 2020 (69%) and a continuing downward trend from previous years (73% of the sites in 2019, 77% in 2018 and 86% in 2017). On average, 4% of the coral population was affected, with individual colonies suffering an average of 18% surface bleaching. Again, these levels are slightly lower than those recorded in 2020 (15% of the population and 24% for individual colonies). Of the regions, Outer Moreton Bay sites (Flat Rock and Shag Rock) had the highest population bleaching, with an average of 14.25% over all the sites. Figures 2 to 5 below depict changes in coral cover, and coral bleaching, over time at each site, and are categorised by sub-regions. Sunshine Coast Regional Summary of Coral Trends and Bleaching Hard coral coverage has remained relatively constant over the years on the Sunshine Coast. Mudjimba, The Ledge, Site 2 exhibited the highest percentage of coral bleaching, but at only 2% of the population. Bleaching ranged from 0.5% to 2.25% of the population, whilst individual colonies ranged from 9.5% to 47% of the surface bleached. Figure 2: Percent cover of hard coral (blue), soft coral (light blue) and bleached coral (orange) for current survey year at Sunshine Coast Reef Check Australia reef health monitoring locations, as per point-intercept substrate surveys for benthic composition. Percentage of the coral population exhibiting bleaching (purple dot) as documented on belt transect survey for reef health impacts, is included where available. 11 | P a g e
Inner Moreton Bay Regional Summary of Coral Trends and Bleaching
Hard coral coverage has remained reasonably consistent at the majority of sites in Inner Moreton Bay, with
most sites that are surveyed twice a year reporting higher levels of hard coral in winter compared to
summer. Levels of bleaching remain low at all sites.

Figure 3: Percent cover of hard coral (blue), soft coral (light blue) and bleached coral (orange) for current survey year at
Inner Moreton Bay Reef Check Australia reef health monitoring locations, as per point-intercept substrate surveys for
benthic composition. Percentage of the coral population exhibiting bleaching (purple dot) as documented on belt transect
survey for reef health impacts, is included where available.

12 | P a g e
Outer Moreton Bay Regional Summary of Coral Trends and Bleaching
Hard coral coverage has remained relatively constant over the years in Outer Moreton Bay. However, there
were slight increases on the previous survey at Flat rock-Shark Gulley and Shag Rock East. Shag Rock West
exhibited the highest percentage of coral bleaching, with 27.5% of the population affected.

Figure 4: Percent cover of hard coral (blue), soft coral (light blue) and bleached coral (orange) for current survey year at
Outer Moreton Bay Reef Check Australia reef health monitoring locations, as per point-intercept substrate surveys for
benthic composition. Percentage of the coral population exhibiting bleaching (purple dot) as documented on belt transect
survey for reef health impacts, is included where available.

13 | P a g e
Gold Coast Regional Summary of Coral Trends and Bleaching
Hard coral coverage was only found in noticeable quantities at Palm Beach S1 & S2 and Cook Island.
There was a slight decrease in hard coral recorded at Palm Beach and Cook Island, with increases in
bleached coral colonies noted at Palm Beach, although the percentage of the population bleached
remains low.

Figure 5: Percent cover of hard coral (blue), soft coral (light blue) and bleached coral (orange) for current survey year at
Gold Coast Reef Check Australia reef health monitoring locations, as per point-intercept substrate surveys for benthic
composition. Percentage of the coral population exhibiting bleaching (purple dot) as documented on belt transect survey
for reef health impacts, is included where available.

14 | P a g e
1.2.3 IMPACTS: CORAL DAMAGE
Coral damage (due to unknown causes) was recorded on 15 of the
32 survey sites. The highest recordings for coral damage was at
Mudjimba Island The Ledge S3 with a count of 27 incidences,
followed by Flat Rock – The Nursery at 21 incidences. Inner
Gneerings – The Caves S1 recorded 19 incidences. A total of 132
incidences of coral damage were recorded this season, which is
slightly lower than last season.
1.2.4 IMPACTS: CORAL DISEASE
A total of 75 incidences of coral disease were recorded during the Image 1.2.3 Coral damage
season. Of these, the highest recording (17) was at Mud Island,
Rubble Patch during the summer surveys.
1.2.5 IMPACTS: MARINE DEBRIS
There were 454 incidences of marine debris recorded this season,
primarily fishing debris. The highest recordings of marine debris
was 161 and this was found at Bulcock Beach. Gold Coast Seaway
reefs recorded 64 and 53 and Mooloolah River 44 incidences.
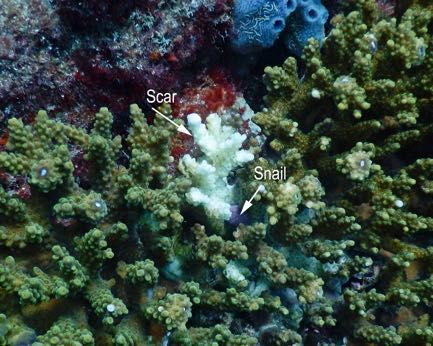
1.2.6 IMPACTS: CORAL SCARRING
Only 135 scars were recorded this season, slightly down from 141 Image 1.2.4 Coral disease
last season. Unknown scars accounted for 90 of the scars and
Drupella accounted for the remaining 45. The highest recording of
unknown scars (27) and Drupella scars (15) was at Mudjimba Island
The Ledge S3.
Tables 3 and 4 on the subsequent pages display these key findings by
survey name and sub-region.
Image 1.2.5 Trash
Image 1.2.6 Drupella scar
15 | P a g eTable 3: Summary table of RCA monitoring findings for surveys conducted on the Sunshine Coast and Inner Moreton Bay
in 2020-2021 season. Information includes a basic site summary of average hard and soft coral cover (%), total macroalgae
(MA) abundance, nutrient indicator algae (NIA) cover (%), and silt levels (N=none, L=low, M=medium, H=high), as well as a
summary of the impacts at each site: average coral bleaching of the population (%) and abundance of reef impacts (coral
disease, marine debris, coral damage, and scars). All figures showing a count, rather than a percentage, are a total across
all 4 transects at the site (i.e. a total across 80m).
Basic site summary Presence of Impacts
Hard Coral Coverage (%)
Marine Debris (General)
Nutrient Indicator Algae
Macroalgae (#) per 80m
Soft Coral Coverage (%)
Anchor Damage (#)
(Unknown Causes)
Unknown Scar (#)
Coral Damage (#)
Coral Disease (#)
Coral Population
Drupella Scar (#)
Fishing Line (#)
Bleaching (%)
Silt Loading
transect
(%)
(#)
SUNSHINE COAST
Bulcock Beach 0.0 0.0 2 22.5 M 0 0 131 20 0 0 0 0
Currimundi S1 25.6 23.8 0 0 N 1 0 1 0 0 0 0 0
Currimundi S2 33.7 15.6 0 0 N 1 0 0 0 0 0 1 1
Currimundi S3 32.5 33.8 0 0 N 0.50 2 0 1 0 2 0 4
Inner Gneerings S1 32.5 11.3 17 10.6 M 0.75 9 1 0 0 19 1 4
Inner Gneerings S2 36 6 34 21.3 N 0.50 1 7 0 0 1 2 7
Kings Beach 2.5 0.6 16 37.5 M 0 0 2 0 0 0 0 0
Mooloolah River 0.0 0 47 30 M 0 0 24 20 0 0 0 0
Mudjimba Island,
46.3 18.1 0 0 N 0.50 0 3 0 0 12 0 7
North West S1
Mudjimba Island, The
35 6.2 0 19 N 2.50 1 3 0 0 8 0 4
Ledge S1
Mudjimba Island, The
21.9 26.3 2 1.25 L 2.25 0 0 1 0 1 4 1
Ledge S2
Mudjimba Island, The
33.8 15.6 0 31.8 N 1 3 5 0 0 27 15 27
Ledge S3
INNER MORETON BAY
Amity S1 0.6 0.0 0 0 M 0 0 17 2 0 0 0 0
Amity S2 6.3 1.3 0 0 M 0 0 32 6 0 0 0 0
Green Island, North,
1.9 10.6 65 59.4 M 3.75 0 0 1 0 0 0 0
Site 1 (Summer)
Green Island, North,
3.8 13.1 2 19.4 L 1 0 0 1 0 0 0 0
Site 1 (Winter)
Green Island, West
4.4 18.1 52 50 H 1.25 1 0 2 0 0 0 0
(Summer)
Green Island, West
7.5 13.1 13 13.8 M 0.75 0 0 3 0 3 0 1
(Winter)
Mud Island, Coral
0.6 12.5 40 25 L 5 12 0 0 0 0 0 0
Galore (Summer)
Mud Island, Coral
1.9 9.4 5 24.4 L 0.5 0 2 0 0 0 0 0
Galore (Winter)
Mud Island, Rubble
0 0 69 43.1 M 18.8 17 3 1 0 18 0 0
Patch (Summer)
Mud Island, Rubble
1.2 5.6 14 35.6 N 0 0 2 2 0 0 0 0
Patch (Winter)
St Helena, Palindrome
0.6 3.1 43 26.9 M 2.5 2 0 3 0 0 0 0
(Summer)
St Helena, Palindrome
2.5 0 3 12.5 M 0.5 0 1 9 0 0 0 0
(Winter)
St Helena, Ray of
6.9 11.9 54 53.8 M 0.5 6 0 0 0 0 0 0
Sunshine (Summer)
St Helena, Ray of
1.9 9.4 7 23.1 L 0.75 0 0 0 0 0 0 0
Sunshine (Winter)
16 | P a g eTable 4: Summary table of RCA monitoring findings for surveys conducted in Outer Moreton Bay and Gold Coast in 2020-
2021 season. Information includes a basic site summary of average hard and soft coral cover (%), total macroalgae (MA)
abundance, nutrient indicator algae (NIA) cover (%), and silt levels (N=none, L=low, M=medium, H=high), as well as a
summary of the impacts at each site: average coral bleaching of the population (%) and abundance of reef impacts (coral
disease, marine debris, coral damage, and scars). All figures showing a count, rather than a percentage, are a total across
all 4 transects at the site (i.e. a total across 80m).
Basic site summary Presence of Impacts
Hard Coral Coverage (%)
Marine Debris (General)
Nutrient Indicator Algae
Macroalgae (#) per 80m
Soft Coral Coverage (%)
Anchor Damage (#)
(Unknown Causes)
Unknown Scar (#)
Coral Damage (#)
Coral Disease (#)
Coral Population
Drupella Scar (#)
Fishing Line (#)
Bleaching (%)
Silt Loading
transect
(%)
(#)
OUTER MORETON BAY
Shag Rock, East 16.3 3.1 0 1.2 L 8.8 4 1 0 0 3 9 3
Shag Rock, West 8.8 0 3 1.2 L 27.5 6 0 0 0 2 0 0
Flat Rock, Shark Gulley 29.4 1.9 13 18.8 L 15.8 3 0 0 0 5 1 3
Flat Rock, The Nursery 21.3 1.9 3 3.1 N 5 1 0 2 0 21 7 13
GOLD COAST
GC Seaway, SW Wall 0 0 0 0 H 0 0 47 6 0 0 0 0
GC Seaway, The Pipe 0 0 0 0 M 0 0 62 2 0 0 0 0
Palm Beach S1 3.1 1.3 0 1.2 N 0.25 1 0 3 0 0 2 2
Palm Beach S2 2.5 0.6 0 0.6 N 0.25 0 2 0 0 3 2 3
Narrowneck Reef 0 0 32 20.6 N 0 0 0 0 0 0 0 0
Wavebreak Island 0 0 0 0 N 0 0 5 3 0 0 0 0
Kirra Reef 0 3.1 56 39 L 0 0 0 0 0 0 0 0
Cook Island 19.4 0.6 0 0 L 0.25 5 0 0 0 7 1 10
1.2.7 INVERTEBRATE ABUNDANCE
Invertebrate surveys were carried out at all locations visited. The
most abundant indicator invertebrate were urchins, with 457
individuals recorded in the 2020-2021 season. The vast majority of
these were recorded at Cook Island (106), Palm Beach S1 (95), Palm
Beach S2 (83) and Shag Rock West (43) and included long-spine
(Diadema spp.) urchins, pencil urchins and collector urchins.
Drupella snails were the second most abundant invertebrate with Image 1.2.7A Collector urchin
a total of 382 recorded. The highest numbers recorded were at
Kings Beach (64) and Palm Beach S1 (41). Anemones totalled 365,
with 152 recorded at Palm Beach S1 and 90 at Palm Beach S2.
Across the 32 survey sites, seven banded coral shrimp, 11 lobsters,
17 giant clams and two Trochus snails were recorded. No Crown of
Thorns Starfish (COTS), target sea cucumbers or tritons were
recorded on transect during the 2020-2021 survey season.
Image 1.2.7B Anemone
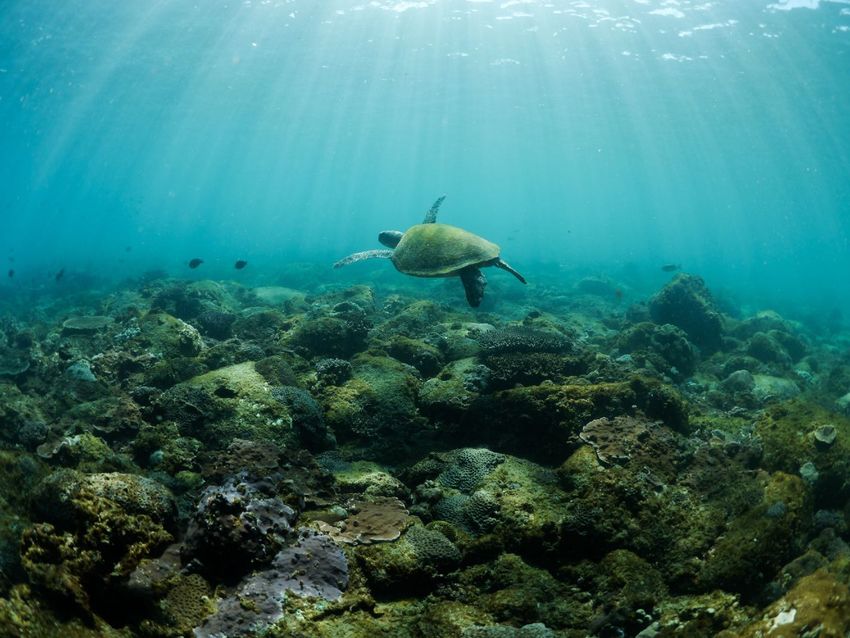
17 | P a g e1.2.8 FISH ABUNDANCE Fish surveys were carried out on all surveys. Again, butterflyfish were the most abundant target fish species with a total of 240 sightings across all surveys. The highest number recorded was 25 at Amity Point S2. Also recorded were 34 sweetlips, 31 parrotfish, 16 snapper, 15 moray eels and four grouper. 1.2.9 RARE ANIMALS Many rare animals were sighted during the surveys this season, some of which include wobbegong sharks, stingrays, turtles, seahorses, bamboo shark and octopuses. Image 1.2.9 Whale spotted off Mooloolaba on the way to our survey site. 18 | P a g e
2.0 SUNSHINE COAST SITE                                  This included a metal plate, lots of bottles, an
REPORTS                                                  iphone, broken pieces of fishing rods and an
                                                         entire fishing rod. This is a significant increase on
                                                         items recorded in the previous season (29).
2.1 BULCOCK BEACH, THE BOARDWALK
                                                         Two collector urchins and a small lobster were
Bulcock Beach, The Boardwalk, Site 1, was
                                                         recorded on the invertebrate survey. During the
surveyed for the first time in 2018. Bulcock Beach
                                                         fish survey, 13 butterfly fish, one grouper, one
is a popular coastal recreational area located in
                                                         moray eel and two snapper were recorded.
Caloundra. The boardwalk is a popular fishing
spot. This site sits along a rock wall slope in
approximately 4m depth. The site is a nursery for
a variety of fish species in the area.

Rock (50%) was the dominant substrate recorded
at this site (Figure 2.1.1), double last year but less
than 2019. This survey also saw a significant
increase in the sponge category with 26%
compared to 9% in 2019. Nutrient indicator
algae attributed 21% to the substrate, whilst
sand attributed less than 1%, down from the 27%
in the previous survey. A low level of silt was
recorded on the transect. There were no                  Image 2.1A Site photograph
ascidians recorded on transect in contrast to the
last survey.

                                                         Image 2.6C: Bleached soft coral

                                                         Image 2.1B Discarded fishing net

Figure 2.1.1 Benthic type and percentage cover,
Bulcock Beach, The Boardwalk, Site 1, 2018-2020

One hundred and sixty-one items of marine
debris were recorded; primarily fishing debris.
General rubbish items were also recorded.
                                                         Image 2.1C Octocoral

19 | P a g e
2.2 CURRIMUNDI REEF, SITE 1 One anemone (without fish), one giant clam, one
lobster and five Drupella snails were observed on
Currimundi Reef, Site 1, was surveyed for the first the invertebrate survey. A fish survey was
time in 2009. It is situated on the reef flat at nine conducted and 14 butterflyfish and two snapper
metres on an exposed rocky outcrop. The reef in were recorded.
this area is reasonably flat although there are
walls and rock pinnacles at various depths within
the general area. This subtropical reef is not
frequented by divers, however sections of
Currimundi Reef are utilised by fishers.
Rock made up 44% of the substrate (including
rock with turf algae and rock with coralline
algae). Hard coral made up 26% of the total
substrate, slightly lower than the 2020 survey
(Figure 2.2.1). Soft coral attributed 24% to the
substrate composition (up 10% from 2020), with
the balance being other (4%), sponge (1%) and
sand (1%). Turf algae was the dominant algae,
with silt not recorded. Image 2.2A Site photograph
Image 2.2B Giant clam
Figure 2.2.1 Benthic type and percentage cover,
Currimundi Reef, Site 1, 2009-2021
Bleaching affected less than 1% of the total coral
population with an average of 9% of any
individual colony being bleached. Coral disease
and coral damage were not recorded on the
impact survey. Only one item of marine debris
(fishing lure) was recorded.
Image 2.2C Bleached hard coral
20 | P a g e2.3 CURRIMUNDI REEF, SITE 2 A fish survey was conducted and three butterfly
fish were recorded on transect.
Currimundi Reef, Site 2, is located adjacent to
Site 1 and has a similar topography.
Rock made up 41% of the substrate (including
rock with turf algae and rock with coralline
algae), however hard coral made up 34% of the
total substrate, which is higher than the 2020
survey (Figure 2.3.1). Soft coral attributed 16% to
the substrate composition (12% more than
2020), with the balance being sponge (4%), other
(2%), recently killed coral (2%) and rubble and
sand at less than 1% each. Turf algae was the
dominant algae.
Image 2.3A Site photograph
Image 2.3B Unknown scar
Figure 2.3.1 Benthic type and percentage cover,
Currimundi Reef, Site 2, 2009-2021
Bleaching affected less than 1% of the total coral
population with an average of 17% of any
individual colony being bleached. One unknown
scars and one Drupella scar were recorded on the
impact survey. Items of marine debris were not
recorded.
One anemone with fish, and two without and Image 2.3C Anemone and fish
three Drupella snails were observed on the
invertebrate survey.
21 | P a g e2.4 CURRIMUNDI REEF, SITE 3 A fish survey was conducted and 12 butterfly fish
(a reduction from 28 in 2020) and one sweetlip
Currimundi Reef, Site 3, is located approximately were recorded.
2km north of Currimundi Sites 1 and 2. This site
has a similar topography to the other 2 sites but
is slightly shallower at around 7 metres.
Hard coral made up 32% of the substrate at this
site, whilst soft coral made up 34% of the
substrate, an increase from 2020 (Figure 2.4.1).
Rock attributed 27% to the substrate
composition, with the balance being sponge
(4%), sand (2%) and other (anemones)(1%). Turf
algae and Rhodophyta were the dominant algae.
Image 2.4A Site Photo
Image 2.4B Anchor removal – photo: Rachel McVeigh
Figure 2.4.1 Benthic type and percentage cover,
Currimundi Reef, Site 3, 2019-2021.
Bleaching affected less than 1% of the total coral
population with an average of 16% of any
individual colony being bleached. Two incidences
of coral disease were observed, whilst four
unknown scars, and two incidences of unknown
damage were recorded on the impact survey.
Only one item of marine debris (anchor) was
observed on transect.
Although lower than 2020, seven anemones with
fish, and 22 without, were recorded. One small Image 2.4B Giant Clam
giant clam and four Drupella snails were also
observed on the invertebrate survey.
22 | P a g e2.5 INNER GNEERINGS, THE CAVES; SITE 1 Four scars of unknown origin, nine instances of
coral disease, one Drupella scar, 19 instances of
Inner Gneerings, the caves, is situated directly coral damage and four pieces of fishing line
offshore from Mooloolaba and covers a wide debris were recorded.
range of depths from 10 to 25 m. It is a popular
site for recreational fishing and diving. Site 1 is A fish survey was conducted and 11 butterfly fish,
located at a depth of 10 m on the reef floor and were recorded.
is characterised by scattered rocky outcrops
surrounded by coral, sponges and a collapsed
cave structure. This site has been surveyed
annually since 2009.
Rock (50%) was the dominant substrate but hard
coral increased from 2019 to 32%. Soft coral
(11%) was lower than the previous survey.
Sponge attributed 2% to the substrate, sand; 4%
and rubble 1% (Figure 2.5.1). Macroalgae was
recorded on three of the four transects,
predominately Asparagopsis sp.
Image 2.5A Dominant algae – Asparagopsis sp.
Image 2.5B Black Butterflyfish
Figure 2.5.1 Benthic type and percentage cover, Inner
Gneerings: The Caves, Site 1, 2009-2021
Seven Drupella snails and two anemones (one
with fish) were recorded during the invertebrate
survey.
Coral bleaching affected 1% of the total coral
population, with an average of 17% of each
colony showing surface bleaching. Except for
unknown scars, impacts recorded increased from
the previous survey. Image 2.5C Damaged coral
23 | P a g e2.6 INNER GNEERINGS, THE CAVES; SITE 2 Three Drupella snails and one giant clam were
observed on the invertebrate survey.
Inner Gneerings, Site 2, was surveyed for the first
time in 2013. It is situated on the reef flat at eight A targeted fish survey was conducted, and two
metres on an exposed rocky outcrop. The butterfly fish were recorded.
topography of the reef in this area is slightly
varied with low walls and occasional large rocks.
This subtropical reef is frequented by divers and
fishers.
Rock made up 52% of the substrate (including
rock with turf algae and rock with coralline
algae). Hard coral made up 36% of the total
substrate, with soft coral at 6% (Figure 2.6.1).
Sponge (3%), sand (1%) and other (1%) made up
the balance of the substrate composition. Turf
algae and Asparagopsis were the dominant
algae, with Asparagopsis returning to previous
levels. Image 2.6A Site photo
Image 2.6B Drupella snail and scar
Figure 2.6.1 Benthic type and percentage cover, Inner
Gneerings: The Caves, Site 2, 2013-2021.
Bleaching affected less than 1% of the total coral
population with an average of 30% of any
individual colony being bleached. Coral disease
was observed on one coral colony, whilst two
Drupella scars and seven unknown scars were
recorded on the impact survey. Marine debris
was limited to seven incidences of fishing line.
Image 2.6C Dominant algae - Asparagopsis
24 | P a g e2.7 KINGS BEACH Sixty-four Drupella snails and two small trochus
shells were recorded during the invertebrate
Kings Beach Reef is located approximately 100m survey. A fish survey was conducted and two
offshore, close to a boat ramp and regular boat sweetlips were recorded, although other non-
traffic, and near to Caloundra’s popular beach target fish were also observed.
front area. It is dominated by rock and sand and
is often covered in macroalgae (particularly
Asparagopsis). The 2011 SEQ floods greatly
impacted this site, however monitoring efforts
have shown signs of recovery of the site over
time. Continued monitoring is required to
document potential changes in the future.
Rock (44%) was the dominant substrate followed
by nutrient indicator algae (27%). Other
(ascidians and halimeda) made up 11% of the
benthos (Figure 2.7.1). Several hard and soft
corals were seen during the survey, however
they attributed just 3% and 1% of the total Image 2.7A Cowrie laying eggs
substrate respectively, due to the patchy nature
of their occurence. Sand made up 14%. Sixteen
counts of macroalgae were recorded, however
levels of Asparagopsis were lower than in
previous years.
Image 2.7B Hard coral with Drupella snail
Figure 2.7.1 Benthic type and percentage cover, Kings
Beach, 2009-2021
Coral bleaching was not observed, nor were
other impacts to the corals. Only two items of
marine debris were recorded on transect. Image 2.7C Umbraculum umbraculum – uncommon
species of sea slug.
25 | P a g e2.8 MOOLOOLABA RIVER, LA BALSA NORTH survey. A fish survey was conducted, and five
butterfly fish and one snapper were recorded.
The Mooloolah River, La Balsa north, Site 1 was Numerous Bream and one stick pipefish were
set up in 2018 due to growing interest in the area. observed during the survey.
The site runs parallel to the shore, at a depth of
5m. It has become a popular diving location for
locals and visitors alike due to its easy access and
protection from the wind. It is dominated by rock
and sand, but levels of hard and soft corals have
noticeably decreased with none recorded on
transect this survey.
Levels of silt have increased to 55%, up from 23%.
Rock at 32% and sand at 11% made up the other
major substrate groups with nutrient indicator
algae recorded at just under 1% (Figure 2.8.1).
Several foliose and encrusting hard corals were
seen on the transect, however were not captured Image 2.8A Stick Pipefish
within the substrate survey. Sponges and soft
corals were not recorded during this survey.
Forty seven counts of macroalgae were recorded
(Padina and Sargassum), an increase from 2019.
Image 2.8B Small hard coral and dominant algae
Figure 2.8.1 Benthic type and percentage cover,
Mooloolah River, La Balsa North, 2018-2020.
Impacts to coral were not recorded due to the
absence of coral. However, 254 pieces of fishing
line debris and 20 pieces of general trash
Image 2.8C Juvenile painted crayfish
(including one anchor) were recorded.
One banded coral shrimp, and three juvenile
lobster were recorded during the invertebrate
26 | P a g e2.9 MUDJIMBA ISLAND, NORTHWEST One anemone without fish, six Drupella snails
and one long-spined urchin were recorded.
Mudjimba Island is located just off the mainland, Additional anemones with fish were observed
close to both the Maroochy and Mooloolah River off-transect.
Mouths on the Sunshine Coast. Mudjimba Island
is a popular location for in-water activities A fish survey was conducted and 15 butterfly fish,
including fishing, diving and surfing. were recorded.
The Northwest Reef site was established in 2013
to gather more information about this highly
utilised area. Site 1 faces the Northwest side of
the island and is situated at a depth of 8m. The
site is a relatively flat terrain dominated by hard
corals.
Hard coral was the dominant substrate (46%),
followed by rock (28%) (Figure 2.9.1). Soft coral
attributed 18% to the substrate, and increase
from previous years, with sand (5%), other (1%),
sponge (1%) and bleached coral (1%) making up
the rest. Turf algae was the dominant algae.
Image 2.9A Site photo
Image 2.9B Coral damage.
Figure 2.9.1 Benthic type and percentage cover,
Mudjimba Island, Northwest Reef, Site 1, 2013-2020.
Coral bleaching was estimated to affect less than
1% of the total coral population, with an average
of 9% per individual colony. Unknown coral
damage was lower with 12 incidences recorded.
Only seven unknown scars, two items of fishing
line and one of general debris were recorded.
Image 2.9C Coral disease
27 | P a g e2.10 MUDJIMBA ISLAND, THE LEDGE; S1 Only one anemone without fish was recorded on
the invertebrate survey. This is down from 35 in
Mudjimba Island, The Ledge Site 1 was 2020, although that year appeared to be an
established in 2007 and is the shallowest site, anomaly. Drupella snails were lower than 2020
located on the top of the reef flat. The other sites with 14 recorded. A fish survey was conducted
run parallel to this site on the southern side of and six butterflyfish were recorded. Several
Mudjimba Island. It is characterised by rock, and turtles and wobbegong sharks were also
a variety of encrusting corals, soft corals and observed.
zoanthids. The location is a frequently used dive
and snorkel site due to the availability of shallow
reef and diversity of corals and fish.
Hard coral (35%) was the dominant substrate;
followed by rock (34%) and nutrient indicator
algae (19%). Soft coral (6%), other (corallimorphs
and ascidians) (3%), sand (2%) and sponge (1%)
made up the balance of the substrate (Figure
2.10.1).
Image 2.10A Site photo
Image 2.10B Nutrient indicator algae
Figure 2.10.1. Benthic type and percent cover:
Mudjimba Island, The Ledge, Site 1, 2007- 2021.
Coral bleaching affected 2% of the total coral
population, with an average of 16% of each
colony showing surface bleaching.
Eight incidences of damage of unknown origin,
one of disease and four incidences of scars of
unknown origin were recorded, along with three
observations of fishing line and no general trash.
Image 2.10C Turtle
28 | P a g e2.11 MUDJIMBA ISLAND, THE LEDGE; S2 One anemone, 2 banded coral shrimp and 15
Drupella snails were recorded on the
Mudjimba Island, The Ledge Site 2 was invertebrate survey. A Triton shell was also
established in 2013 and is on the deepest section observed off-transect. A fish survey was
of the steep reef slope. This site sits parallel to conducted and nine butterfly fish and two moray
Site 1 on the southern side of Mudjimba Island. eels were recorded. Turtles were also observed.
This deeper location represents a different
habitat type to the long-established research Site
1, and Site 3. It is characterised by rock, and a
variety of encrusting corals and corallimorphs.
The location is well known as a site inhabited by
a variety of nudibranch species and turtles.
Rock (48%) was the dominant substrate; a
significant increase from the previous survey
(17%) followed by soft coral (26%) and hard coral
(22%) (Figure 2.11.1). Sponge attributed 2% to
the substrate and bleached coral 1%. Two
instances of macroalgae were recorded on the
transect. Image 2.11A Triton shell
Image 2.11B Turtle
Figure 2.11.1 Benthic type and percentage cover,
Mudjimba Island, The Ledge, Site 2, 2013-2021.
Coral bleaching affected 2% of the total coral
population, with an average of 47% of each
colony showing surface bleaching, an increase
from the last survey.
Only one incidence of damage of unknown origin,
one scar of unknown origin, four Drupella scars
one piece of general trash and two pieces of Image 2.11C Bleached coral
fishing line were recorded.
29 | P a g e2.12 MUDJIMBA ISLAND, THE LEDGE; S3 On the invertebrate survey, three anemones
with fish and 29 Drupella snails were recorded. A
The Ledge Site 3 was established in 2013, to fish survey was carried out and two butterflyfish,
gather more information about this highly and one parrotfish were recorded. However
utilised area. Site 3 is situated on the reef slope large numbers of eastern pomfred, bullseyes and
and sits in between the shallower Site 1 and the yellow tail pike were present..
deeper Site 2 on the southern side of the island.
This additional location represents a different
habitat type to Sites 1 and 2, despite their
proximity to each other.
Hard corals accounted for 34% of the benthos,
with nutrient indicator algae (NIA) making up
32%. This is a significant increase in NIA on
previous years, with no or low levels recorded
since 2016 when it made up 46% of the substrate.
The remaining benthic cover constituents
recorded were soft coral (16%), rock (14%), other
(4%), and recently killed coral (3.0 INSHORE MORETON BAY During the fish survey, six butterfly fish and two
moray eels were recorded, with numerous
SITE REPORTS: wobbegong sharks observed.
3.1 AMITY POINT, SITE 1
This is a relatively sheltered site located on the
south-west end of North Stradbroke Island and is
frequented by vast numbers of fishers, boaters
and divers all year round. The site sits on the
sandy slope parallel to the rock wall. Whilst the
site contains large patches of sand, the limited
structure available at this site provides habitat
for a large number of species.
Sand (76%) dominated the substrate followed by
rock (15%). Silt increased to 8% and hard coral Image 3.1A Small branching hard corals
remained at 1% of the substrate (Figure 3.1.1).
Image 3.1B Moray eel and urchin
Figure 3.1.1. Benthic type and percent cover: Amity
Point, Site 1, 2016- 2021.
Twenty-five urchins and three anemones were
recorded during the invertebrate survey. The
additional mostly small and mostly bleached
anemones, some with fish, were observed in the
same location as last survey, just off transect.
Coral bleaching was not observed on transect. Image 3.1C Anemone with fish (off transect)
Impacts observed during this survey were 17
counts of fishing line and two of general trash.
31 | P a g e3.2 AMITY POINT, SITE 2 During the fish survey, one snapper, 25 butterfly
fish and two moray eels were recorded, with
This relatively sheltered site is located on the wobbegong sharks and cuttlefish also observed.
south-west end of North Stradbroke Island and is
frequented by vast numbers of fishers, boaters
and divers all year round. The relatively shallow
site runs along the rock wall, commencing near
the public boat ramp. The site is subject to strong
tidal currents and the amount of growth on the
rocks varies throughout the site.
Rock (42%) and silt (26%) were the dominant
substrate followed by sand (15%). The balance of
the substrate was made up from hard coral (6%),
rubble (9%), soft coral (1%) and bleached coral
(1%) (Figure 3.2.1).
Image 3.2A Hard coral
Image 3.2B Trash, urchins and hard coral
Figure 3.2.1. Benthic type and percent cover: Amity
Point, Site 2, 2016- 2021.
Bleached coral was observed to be less than 1%
the coral population. Thirty-nine urchins were
recorded on the invertebrate survey, a decrease
from previous surveys. The majority of urchins
were recorded close to the boat ramp; within the
first 20m of the transect. This area appears to
provide the preferred habitat for this species at
this location.
Image 3.2C Cuttlefish
Thirty-two items of fishing line and six items of
general trash were recorded. Other impacts were
not observed during the impacts survey.
32 | P a g e3.3 GREEN ISLAND NORTH, SITE 1 Fish surveys were conducted with no target fish
recorded in March 2021, however in July 2021
This site is located on the northern side of Green one butterflyfish and one parrotfish were
Island. The site was established in 2015 and sits recorded. However non-target fish were
at a depth of 5m. This site hosts patchy hard and observed utilising the habitat.
soft coral on a soft sediment benthos.
Rubble (25%) was the dominant substrate
followed by rock (19%) and nutrient indicator
algae (19%). Silt (15%), soft coral (11%), sand
(9%) and hard coral (2%) made up the balance of
substrate during the March 2021 (summer)
survey. During the winter survey in July 2021, silt
had reduced to 0%, with sand the dominant
substrate at 42%. Rock was recorded at 20%, soft
coral had increased slightly to 13%, with rubble
down to 2%. Nutrient indicator algae was still at
18% whilst hard coral increased to 4% (Figure
3.3.1). Image 3.3A Site photo
Image 3.3B Massive hard coral
Figure 3.3.1. Benthic type and percent cover: Green
Island North, Site 1, 2015 - 2021
In March 2021, 3.75% of the coral population was
recorded as bleached, but this decreased to 1%
in July 2021.
Coral damage was not recorded on either survey
and only one item of marine debris was recorded
on each survey. One Drupella snail recorded in Image 3.3C Surveyor in action
the March survey and 14 Drupella snails recorded
in the July survey were the only invertebrates
observed.
33 | P a g e3.4 GREEN ISLAND WEST, SITE 1 unknown scar and three items of general trash
were recorded in winter. One butterflyfish and
This site is located on the western side of green one parrotfish were recorded during the summer
island on the edge of the reef flat. The site was survey, and two butterflyfish, one parrotfish and
established in 2017 and site at a depth of 5m. three snapper were observed in winter.
This site hosts patchy hard and soft coral on a soft
sediment benthos.
Rock (19%) was the dominant substrate followed
by soft coral (18%), nutrient indicator algae (18%)
and sand (16%). Rubble (13%), hard coral (4%),
sponge (4%) and silt at 8% made up the balance
of substrate during the March 2021 survey. Sand
(51%) dominated the substrate in July 2021. Rock
(21%) and soft coral (13%) were the next
dominant categories. Hard coral at 8% was an
increase from the summer survey and a decrease
in rubble to 2% made up the balance (Figure
3.4.1). Image 3.4A Site photo
Image 3.4B Massive hard coral
Figure 3.4.1. Benthic type and percent cover: Green
Island West, Site 1, 2017 - 2021
Coral bleaching averaged 11% of each colony
observed as bleached, with an average of 1% of
the coral population bleached in March 2021.
This increased to an average of 37% of each
colony in July 2021 but remained at 1% of the
coral population.
Image 3.4C Soft coral
One count of coral disease and two counts of
marine debris were recorded during the summer
survey, whilst three counts of damage, one
34 | P a g e3.5 MUD ISLAND, CORAL GALORE Twenty-eight Drupella snails were recorded in
summer, with four recorded in winter.
Mud Island is situated between the Port of
Brisbane and Moreton Island and was historically Fish surveys were conducted and 19 butterfly
used as anchorage for ships that were unable to fish, one grouper, one moral eel and one
access the shallow Brisbane River. This site is parrotfish were recorded in summer. Only three
situated on a rocky slope and supports a butterflyfish were recorded in winter.
population of corals, in contrast to the
neighbouring survey site called Rubble Patch
(See Section 3.6).
Surprisingly rubble made up 48% of the substrate
in February 2021 (an increase from previous
surveys). Sand attributed 22% of the total
substrate followed by rock (16%) and soft coral
(13%), with hard coral and silt at3.6 MUD ISLAND, RUBBLE PATCH Fish surveys were conducted and four
butterflyfish and two snapper were recorded in
This site at Mud Island consists primarily of summer, with three butterflyfish recorded in
unconsolidated coral rubble, sparse soft coral winter.
and algae fields. This site was first surveyed in
2017 after it was identified by Roelfsema et al
(2017) as an area of interest.
Hard and soft coral were not detected on
substrate transect during the summer survey,
but were observed within the impacts transect
belt. Rubble made up 85% of the substrate, with
sand making up 13%. Rock at 2% made up the
balance in summer. During the winter survey,
rock dominated at 31%, followed by nutrient
indicator algae (27%). Rubble made up 21%, sand
11%, with soft coral at 6%, other at 3% and hard
coral just over 1%. (Figure 3.6.1). Image 3.6A Dominant algae
Image 3.6B Hard coral
Figure 3.6.1. Benthic type and percent cover: Mud Island,
Rubble Patch, 2017 - 2021
Bleaching averaged 15% of each colony and 18%
of the population in summer. Eighteen
incidences of unknown coral damage and 17 of
disease were recorded on the impact survey and
four items of marine debris. The only impacts
recorded in winter were two items of fishing line
and two of general debris. Bleaching was not
observed. Two Drupella snails were observed in
summer and seven in winter during the Image 3.6C Marine debris - rope
invertebrate survey.
36 | P a g eYou can also read