Structural and functional insights into the mechanism of action of plant borate transporters
←
→
Page content transcription
If your browser does not render page correctly, please read the page content below

www.nature.com/scientificreports
OPEN Structural and functional insights
into the mechanism of action
of plant borate transporters
Savvas Saouros1,4, Thotegowdanapalya C. Mohan2,3,4, Cristina Cecchetti1, Silke Lehmann2,
Joseph D. Barrit1, Nicola J. Scull1, Paul Simpson1, Yilmaz Alguel1, Alexander D. Cameron2,
Alexandra M. E. Jones2* & Bernadette Byrne1*
Boron has essential roles in plant growth and development. BOR proteins are key in the active
uptake and distribution of boron, and regulation of intracellular boron concentrations. However,
their mechanism of action remains poorly studied. BOR proteins are homologues of the human SLC4
family of transporters, which includes well studied mammalian transporters such as the human Anion
Exchanger 1 (hAE1). Here we generated Arabidopsis thaliana BOR1 (AtBOR1) variants based (i) on
known disease causing mutations of hAE1 (S466R, A500R) and (ii) a loss of function mutation (D311A)
identified in the yeast BOR protein, ScBOR1p. The AtBOR1 variants express in yeast and localise
to the plasma membrane, although both S466R and A500R exhibit lower expression than the WT
AtBOR1 and D311A. The D311A, S466R and A500R mutations result in a loss of borate efflux activity
in a yeast bor1p knockout strain. A. thaliana plants containing these three individual mutations exhibit
substantially decreased growth phenotypes in soil under conditions of low boron. These data confirm
an important role for D311 in the function of the protein and show that mutations equivalent to
disease-causing mutations in hAE1 have major effects in AtBOR1. We also obtained a low resolution
cryo-EM structure of a BOR protein from Oryza sativa, OsBOR3, lacking the 30 C-terminal amino
acid residues. This structure confirms the gate and core domain organisation previously observed for
related proteins, and is strongly suggestive of an inward facing conformation.
Boron (B) is a chemical element key for plant growth and development, playing essential roles in formation and
stability of the plant cell wall and is crucial for normal leaf expansion, through the cross-linking of the polysac-
charide rhamnogalacturonan II (RG-II)1. Borate-diol diester bridges form between the apiosyl residues of two
monomers of RG-II2. Boron deficiency or excess causes a range of plant growth defects3–5 and is a major issue for
crop growth6. The optimal B concentration is narrow in many plants; in wheat it is between 10 and 100 µg/g tissue
concentration7. B is highly soluble and thus is readily leached from the soil in areas with high rainfall including
parts of the USA and China8. The resulting B deficiency limits plant growth, root elongation, fruit ripening and
seed production9. Conversely excess B is often the result of low rainfall in areas of, for example, Australia, Turkey
and South America and the Middle East and reduces root cell division and chlorophyll content, which in turn
limits growth of shoots and r oots10.
Plants have a complex system of channels and transporters involved in the uptake and distribution of b oron11.
Boron is taken up from the soil in the form of boric acid, B(OH3), via a passive process, through a combination
of direct diffusion across the membrane and facilitated diffusion through the nodulin 26-like intrinsic proteins
(NIPs)12. Borate transporters (BORs) are responsible for active efflux of boron from cells, most likely in the
charged borate [B(OH4)]− form8. The BORs are thus suggested to be borate antiporters coupling efflux of the
substrate to the co-transport of a H+13. The first identified and best characterised BOR protein, BOR1 from
Arabidopsis thaliana (AtBOR1), is responsible for active export of B from the root cells to the xylem for further
distribution around the plant14. Overexpression of AtBOR1 leads to more efficient uptake of B and resistance to B
deficiency15. BOR proteins are also key in preventing toxic accumulation of B in cells. Increased levels of AtBOR4
from A. thaliana16 and the homologue Bot1 from b arley17 confer increased tolerance of high B concentrations by
1
Department of Life Sciences, Imperial College London, Exhibition Road, London SW7 2AZ, UK. 2School of Life
Sciences, University of Warwick, Gibbet Hill Road, Coventry CV4 7AL, UK. 3Present address: Department of
Biotechnology and Bioinformatics, Faculty of Life Sciences, JSS Academy of Higher Education and Research,
Mysore, Karnataka 570015, India. 4These authors contributed equally: Savvas Saouros and Thotegowdanapalya
C. Mohan. *email: alex.jones@warwick.ac.uk; b.byrne@imperial.ac.uk
Scientific Reports | (2021) 11:12328 | https://doi.org/10.1038/s41598-021-91763-6 1
Vol.:(0123456789)
www.nature.com/scientificreports/
exporting the excess B back into the soil. AtBOR1 is regulated at least in part by cellular B concentration, with
low B concentration resulting in increased levels of the transporter at the membrane and high B concentrations
resulting in the transporter being targeted for d egradation18.
Plants have been shown to exhibit differences in their sensitivities to B deficiency and in the patterns of
expression of BOR proteins. A. thaliana has previously been reported to succumb to B deficiency at levels less
than 0.5 μM B, whereas rice (Oryza sativa) is only sensitive at levels lower than 0.2 μM B indicating that O. sativa
is more tolerant to B d eficiency19. In A. thaliana, BOR1 is expressed in the root endodermis. Whereas BOR1
from Oryza sativa (rice), OsBOR1, is expressed in both the endodermis/stele (for xylem loading) and in the
exodermis under conditions of B deficiency. However, under conditions of B sufficiency OsBOR1 expression is
only detectable in the stele20. In both species BOR1 allows passage of B though the Casparian strips thus enabling
active efflux of B from the root cells to the xylem20.
BOR proteins share homology with the Solute Carrier (SLC) 4 family of secondary active transporters, that
includes proteins which function as either symporters or exchangers21. Four structures of proteins from the
SLC4 family, and homologues, are available: the human Anion Exchanger 1 (hAE1)22, the acid–base transporter
NBCe123, Saccharomyces mikatae Bor1p24 and Arabidopsis thaliana BOR1 (AtBOR1)25. The structures revealed a
protomer arrangement of 7 + 7 transmembrane (TM) segments in an inverted repeat architecture. Each protomer
is comprised of two different domains, the core and the gate, responsible for substrate transport and dimerization
respectively. The SLC4 proteins are structurally related to the SLC26 family including the structurally charac-
terised SLC26Dg26,27 and B icA28, as well as the SLC23 family including structurally characterised UapA29 and
UraA30. All of these proteins are dimeric and suggested to function via an elevator mechanism where substrate
binds into a site formed by two half helices, TMs3 and 10, within the core domain and this domain then moves
relative to the gate domain pulling the substrate across the membrane31,32. In the case of UapA and UraA it is
clear that the dimer is critical for function whereas the role of the dimer in the other proteins is less defined.
Research on the S. cerevisiae homologue, ScBOR1p, supported the dimer as the oligomeric form of the protein
and found that dimer formation was dependent upon the presence of membrane lipids, but also showed that the
protein could function as a monomer33.
Despite progress in understanding of the structure and function of the BOR proteins, many questions remain.
Here we used a combined structural and functional approach including plant phenotypes to explore the AtBOR1
and OsBOR3 proteins. Our research shows that the equivalent of disease-causing mutations from hAE1 also
have highly detrimental effects on BOR protein function and plant growth. Specifically mutations G796R34) and
S762R35 in hAE1 abolish anion exchange and cause stomatocytosis. The equivalent mutations in AtBOR1, A500R
and S466R respectively, cause reduced borate efflux leading to boron deficiency symptoms in plants including
reduced plant weight. The same results are seen for a mutant of D311, a possible proton binding residue. A low
resolution cryo-EM structure of OsBOR3 provides the first glimpse of the molecular details of a rice borate
transporter.
Results
Mutations on AtBOR1 were selected based on homology with hAE1. D311 (Fig. 1) is a possible
candidate H+ binding residue and mutation of the equivalent residue (D347) in S. cerevisiae has previously been
shown to inhibit borate efflux function in a yeast based functional complementation assay25. As described above,
S466R (equivalent to S762R35) and A500R (equivalent to G796R34) are equivalent to disease causing mutations
in hAE1. In the context of the hAE1 structure, these mutations cannot be accommodated without modification
to the overall fold22. The mutant P362G, which was generated as part of another study, had no effect on AtBOR1
transporter function (see “Results” section) and is included here as a control for the generation of the plant vari-
ants.
The AtBOR1 variants localise to the plasma membrane in yeast but exhibit varying stability
in detergent based solution. All variants had similar expression levels in yeast to WT AtBOR1 (range
1.7–3 mg/L) with the exception of the A500R mutant protein which exhibited markedly lower expression
(0.7 mg/L, Supplementary Table S2). All proteins traffic to the plasma membrane in yeast (Fig. 2), however in all
cases there is a high level of fluorescent material clearly visible within the cells. It is likely that this is incorrectly
folded material that is retained within the ER and ultimately targeted for d egradation36. In order to determine
the stability of the AtBOR1 variants we used fluorescent size exclusion chromatography (FSEC) and heated FSEC
(hFSEC). All proteins solubilised into detergent (DDM)-based solution with similar solubilisation efficiencies
(50–80%, Supplementary Table S2), although the amount of monodispersed protein differs as a result of vari-
ations in the protein expression level, particularly with respect to S466R (Fig. 3; Supplementary Table S2). The
exception was A500R where the amounts of protein extracted into detergent (29%, Supplementary Table S2)
were too low to be detectable following separation on the SEC column. In order to further characterise the
individual proteins we also submitted them to hFSEC, heating the solubilised proteins to 46 °C (higher than the
apparent Tm for WT AtBOR1 fused with G FP37) for 10 min prior to separation on the SEC column. Following
heating the WT monodispersed protein peak height is substantially reduced with a concomitant increase in the
size of the aggregation peak. There was no detectable monodisperse S466R protein after heating, indicating that
this protein is much less stable than the WT AtBOR1. In contrast, the D311A and P362G proteins gave very
similar results to the WT protein following heating (Fig. 3).
Borate efflux was disrupted by mutations D311A, S466R and A500R. The borate efflux activity
of all the proteins was assessed by expression in a ∆bor1p strain. Yeast cells expressing both WT AtBOR1 and
P362G exhibit reduced levels of intracellular boron compared to cells containing a vector only control (Fig. 4).
Scientific Reports | (2021) 11:12328 | https://doi.org/10.1038/s41598-021-91763-6 2
Vol:.(1234567890)
www.nature.com/scientificreports/

                                  Figure 1.  Protein sequence alignment of SLC4 family members. AtBOR1 (Acc. Code: OAP07993.1), OsBOR3
                                  (Acc. Code: AK072421), hAE1 (Acc. Code: NP_000333.1), hNBCe1 (Acc Code: NP_003750.1). Only the TM
                                  domains of hAE1 and hNBCe1 are aligned with the full length plant BOR proteins. The approximate positions
                                  of the TM domains based on the X-ray crystal structure of AtBOR1 (PDB 5L25) are indicated in the cylinders
                                  above the sequence. The TM domains are coloured with the helices comprising the core domain in red and the
                                  helices comprising the gate domain in blue. The positions of the single point mutations introduced in AtBOR1
                                  are indicated in magenta.

Scientific Reports |   (2021) 11:12328 |              https://doi.org/10.1038/s41598-021-91763-6                                                 3

                                                                                                                                         Vol.:(0123456789)
www.nature.com/scientificreports/
Figure 2. Localisation of AtBOR1-GFP variants in yeast strain FGY217. The proteins were visualised using
both confocal fluorescence microscopy for detection of GFP (upper panel) and corresponding bright field
images (lower panel). Data shown is representative of at least n = 2 independent experiments. Scale bar = 10 μm.
Figure 3. FSEC and hFSEC analysis of AtBOR1 proteins. FSEC analysis is carried out on protein solubilised at
4 °C prior to separation on the SEC column and hFSEC analysis is carried out on protein initially prepared in
the same way then heated at 46 °C for 10 min, prior to separation on the SEC column. In each case, aggregated
material elutes at roughly fraction 8, with monodispersed protein eluting at roughly fraction 35, labelled A and
M respectively on (A). (A–C) Show the results obtained for D311A, P362G and S466R variants compared to
WT AtBOR1 analysed at the same time, respectively. In each case the elution trace obtained for unheated sample
is shown in the solid line while the elution trace obtained for heated sample is shown in the same coloured
dashed line. Data is representative of at least n = 2 independent experiments.
D311A in contrast exhibits a similar level of intracellular boron to the vector only control indicating no dis-
cernable borate efflux activity and in agreement with the results obtained for the ScBOR1p equivalent mutant
(D34725). Yeast cells expressing the S466R and A500R are also unable to export excess boron with similar levels
of intracellular boron to the vector only control.
AtBOR1 variants affect plant growth. When expressed as C-terminal GFP fusion proteins in bor1-3,
only P362G restores shoot fresh weight and rescues B-deficiency symptoms, similar to WT BOR1 in soil-grown
plants. In agreement with the results of the yeast B efflux assays D311A, S466R and A500R-expressing plants
exhibit reduced shoot fresh weight and typical B-deficiency symptoms comparable to the uncomplemented
bor1-3 KO (Fig. 5).
Variability of B deficiency phenotypes in planta. We observed that the B deficiency phenotype of
D311A in soil grown plants appeared to be variable (possibly due to watering regime, humidity or soil batches).
To better control boron concentration, we grew A. thaliana seedlings on agar plates supplemented with boric
acid. When grown axenically on medium with low boron concentration (300 nM), seedlings of bor1-3 plants
expressing S466R and A500R exhibit reduced shoot weight similar to uncomplemented bor1-3 plants, while
P362G and WT BOR1 can restore normal shoot development under B-deficiency conditions (Fig. 6). Unexpect-
edly, compared to the soil growth assay, shoot fresh weight of seedlings expressing D311A were not significantly
different to WT AtBOR1 at 300 nM boron, whereas in the previous soil assay plants expressing D311A showed
Scientific Reports | (2021) 11:12328 | https://doi.org/10.1038/s41598-021-91763-6 4
Vol:.(1234567890)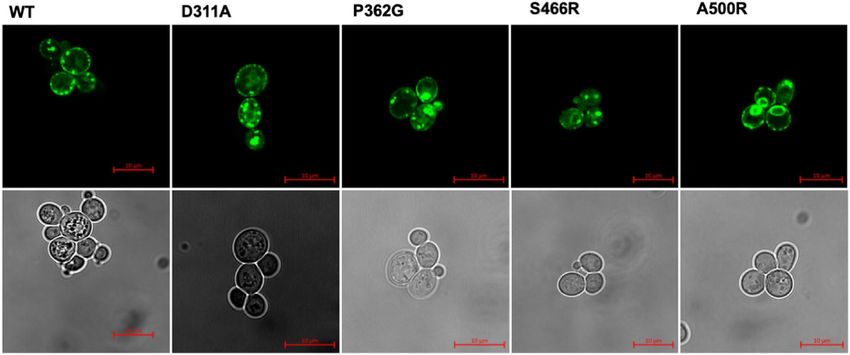
www.nature.com/scientificreports/

                                  Figure 4.  Borate efflux activity of the AtBOR1 variants in yeast. FGY217 Δbor1p cells expressing each of the
                                  AtBOR1 proteins were assessed for their ability to export boron relative to control cells transformed with vector
                                  only. −  = vector only control. Intracellular B content (nmol/10 mg FW) after 60 min incubation of cells in 1 mM
                                  boric acid. Values have been normalised to GFP concentration. Data shown is mean ± S.D. of n = 3 independent
                                  experiments.

                                  Figure 5.  Phenotypes of different AtBOR1 variant plants grown in soil. The negative (−) control is the bor1-3
                                  KO plant. (A) Images of the different plants grown in soil without addition of boron. (B) Comparison of the
                                  fresh weight of the shoots of the different AtBOR1 variant plants, a, p < 0.01 compared to the negative control of
                                  the bor1-3 KO plants, b, p < 0.01 compared to WT AtBOR1 (ANOVA followed by Tukey’s test). Data is expressed
                                  relative to WT AtBOR1 and is mean ± S.E. of n ≥ 9 independent plants. (C) Overall % of plants exhibiting
                                  either no B deficiency (white) or B deficiency (grey) for each of the tested variants. Data is representative of 3
                                  independent experiments.

Scientific Reports |   (2021) 11:12328 |               https://doi.org/10.1038/s41598-021-91763-6                                                 5

                                                                                                                                             Vol.:(0123456789)
www.nature.com/scientificreports/
Figure 6. Phenotypes of AtBOR1 variant plants grown in vitro. (A) Comparison of the fresh weight of the
different AtBOR1 variant plants grown on plates containing 300 nM boron, a, p < 0.01 compared to the negative
control of the bor1-3 KO plants, b, p < 0.01 compared to WT AtBOR1 (ANOVA followed by Tukey’s test). Data
is expressed relative to WT AtBOR1 and is mean ± S.E. of n = 12 plants. (B) Images of AtBOR1 variant plants
grown on plants on 300 nM boron (upper panels) or 30 μM boron (lower panels). Data is representative of n = 2
independent experiments.
deficiency symptoms similar to bor1-3. These unexpected D311A phenotypes were consistent over three inde-
pendent lines and several replicate experiments (of both assays). We consider that physiological parameters such
as transpiration and photosynthesis rates as well as nutrient transport will differ in soil and in plate assays as a
result of plant growth conditions and plant age and this might influence the development of B deficiency symp-
toms. The observed shoot phenotypes for the S466R and A500R variants are a result of low B supply, since all
tested mutants develop similar to control plants when grown on sufficient B levels (30 µM).
OsBOR3 is a dimer, with each protomer organised into two discrete domains. There is a rel-
atively low resolution (4.2 Å) X-ray crystallographic structure of a C-terminally truncated A tBOR125 in the
occluded conformation (closed to both sides of the membrane). In an effort to obtain additional information
about the structure and mechanism of the BOR proteins we expressed and isolated a rice homologue, OsBOR3,
which shares 56% sequence identity with AtBOR1 and OsBOR1 (Fig. 1). We did attempt to express and purify
other rice BOR proteins, including OsBOR1, however OsBOR3 was by far the most suitable protein in terms of
expression yield and stability in detergent based solution. The protein was engineered to remove the 30 C-termi-
nal residues in order to increase stability and introduce a Q228T mutation to remove a naturally occurring TEV
cleavage site to yield O
sBOR3∆1–642. Functional complementation in yeast confirmed that this engineered version
of the protein is functional (Supplementary Fig. S1A). As reported previously we were able to obtain high qual-
ity OsBOR3∆1–642 protein suitable for structural analysis38 (Supplementary Fig. S1B). The protein yielded high
quality negative stain (Supplementary Fig. S1C) and cryo-EM grids (Supplementary Fig. S2A). 2D class averages
were obtained of various views of the protein from a total of 116,140 particles (Supplementary Fig. S2B–D).
These were used to reconstruct a 3D model with a local resolution ranging from 5 to 6 Å (Fig. 7A). As expected
from our previous analysis the protein is a dimer in LMNG m icelles38. The density map for the dimer is shown
in Fig. 7A with the crystal structure of AtBOR1 fitted. We carried out separate fitting of the gate and core domain
structures of outward facing hNBCe1, outward facing hAE1 and inward occluded AtBOR1 (Fig. 7B). As can be
seen, despite the different conformational states, the domain structures of the different proteins converge on the
OsBOR3 density confirming the organisation of the individual TMs into gate and core domains.
Scientific Reports | (2021) 11:12328 | https://doi.org/10.1038/s41598-021-91763-6 6
Vol:.(1234567890)www.nature.com/scientificreports/
Figure 7. Cryo-EM structure of OsBOR3. (A) CryoEM density map for OsBOR3 shown from the extracellular
side of the membrane and the side view looking through the membrane. The dimeric structure of AtBOR1
(individual protomers shown in yellow and red) has been fitted into the OsBOR3 EM density. The additional
density around the TM domains corresponds to the LMNG detergent micelle. (B) The respective core and gate
domains of the AtBOR1, hNBCe1 and hAE1 monomers fitted into the EM density of OsBOR3 based on the
correlation coefficient in Chimera48. A single subunit of each protein was first fitted into the density and then
the automatic fitting algorithm in Chimera was used to optimise the fit of the core and gate domains into the
density separately. Each protein has been coloured in the same way with blue at the N-terminus through to
red at the C-terminus. This image reveals the relative positions of the core and gate domains in the OsBOR3.
Superposition of the monomeric AtBOR1 (pink, (C)), hNBCe1 (beige, (D)) and hAE1 (purple, (E)) onto
the composite image shown in (B) revealing the OsBOR3 has a conformation most similar to the inward
occluded AtBOR1. The images are shown from the side of the protein, looking through the membrane with the
extracellular regions of the proteins at the top. The arrows highlight the more open nature of the OsBOR3 on the
intracellular side of the membrane compared to hNBCe1 and hAE1.
The core domain is less well resolved than the gate domain, probably as a result of the inherent flexibility of
this region of the protein, associated with its elevator motion through the membrane. The gate domain forms
the dimerization interface and as a result is much more static (Supplementary Fig. S3).
The overall conformation of the protein after fitting the core and gate domains separately is more similar to
the inward-occluded AtBOR1 (Fig. 7C), rather than the outward-facing hNBCe1 or hAE1 (Fig. 7D,E), indicating
that OsBOR3 is in the inward facing conformation. Indeed it is possible that the OsBOR3 is in a slightly more
inward open conformation than AtBOR1 although at this low resolution it is difficult to be confident.
Discussion
The BOR proteins, and their BOT1 homologue from barley17, are crucial for efficient uptake and distribution of
boron, as well as regulation of intracellular boron concentrations in plants. Here we used a combined approach
incorporating mutagenesis in both yeast and plants, together with structural analysis in order to explore in more
detail the mechanism of action of these important proteins. A series of AtBOR1 variants were generated based on
(i) a known loss of function mutant identified in the ScBOR1p (D311A) and (ii) disease causing mutations in the
related SLC4 protein, hAE1 (S466R and A500R). We also included a mutation, P362G, which had no significant
effect on the expression, trafficking or function of the transporter.
The mutagenesis studies in yeast and plants were carried out using the AtBOR1 protein while the structural
analysis was carried out on the OsBOR3 protein. Use of Arabidopsis thaliana for mutagenesis allowed us to gen-
erate plant variants on a reasonable timescale, something that would not have been possible using the OsBOR3
protein and rice plants. However, it is clearly important that we study the rice variants of these proteins given
the importance of rice as a staple food for large swathes of the world’s population. In our hands, we found the
C-terminally truncated OsBOR3∆1–642 protein to be an extremely stable BOR v ariant38.
The AtBOR1 D311A is equivalent to the ScBOR1p D347A mutant. In the paper describing the AtBOR1
structure, the authors used the yeast ScBOR1p as a substitute for exploring the potential role of specific residues
in substrate binding and transport in a functional complementation assay using a yeast ∆bor1 strain25. They
Scientific Reports | (2021) 11:12328 | https://doi.org/10.1038/s41598-021-91763-6 7
Vol.:(0123456789)www.nature.com/scientificreports/
reported that transformation with AtBOR1 failed to functionally complement the ScBOR1p borate efflux activ-
ity, as had an earlier study16. However in our hands we consistently saw that WT AtBOR1 was able to effectively
complement ScBOR1p activity, in agreement with a recent study39, thus allowing us to directly assess the effects
of mutations in the plant transporter. In agreement with the earlier study on the ScBOR1p, here we report that
mutation of AtBOR1 Asp311 to Ala results in a loss of borate efflux activity. Importantly however we also show
for the first time what effect this mutant has on plant growth under boron restricted conditions. It is clear that the
D311A plant variant exhibits very poor growth in soil, as poor as the bor1-3 KO plants. Importantly, this variant
expresses to a similar level to WT, traffics to the membrane and can be solubilised effectively into detergent based
solution indicating that this loss of function is not due to reduced expression or the expression of incorrectly
folded protein. These data confirm that this Asp residue which is conserved among BOR proteins is crucial for
function. D311A is located in the TM8 which forms part of the core domain. Comparison with the structures of
other SLC4 proteins, hAE1 and hNBCe1, reveals that this residue lies in close proximity to the likely substrate
binding site between the two half helices, TM3 and TM10. Thus, this residue may have a role in direct substrate
binding or may be the proton binding residue critical for energising the transport process. It is also possible that
this residue has key roles in both substrate and proton binding.
hAE1 is by far the best characterised of the SLC4 transporters. This protein is expressed in large quantities
naturally in erythrocytes and functions as a bicarbonate/Cl− exchanger increasing the CO2 carrying capacity
of the blood40. Mutations in this protein are associated with a wide range of blood diseases41. These include
the S762R (S466R in AtBOR1) and G796R (A500R in AtBOR1) individual mutants characterised by a loss of
anion exchange activity and leakage of monovalent cations through hAE1, responsible for hereditary forms of
stomatocytosis34,35. Mapping of these mutations onto the structure of hAE1 indicated that the S762R mutation,
located at the N-terminal end of TM11, reduces the interactions between TM10 and TM11, TM11 and TM1,
and TM11 with a loop connecting to T M322. The G796R mutation located in the middle of TM12 is suggested
to alter helix packing. Thus, both mutations are likely to affect the overall structural stability of the protein,
although this has not been definitely demonstrated. We assessed what effects the equivalent mutations have on
the expression, localisation and activity of AtBOR1. The S466R and A500R AtBOR1 variants express in yeast
although both exhibit markedly lower expression than the WT transporter. Importantly, both variants do localise
at the plasma membrane, suggesting that at least some of the protein is correctly folded and trafficked. FSEC and
hFSEC analysis were not possible for the A500R mutant. This is most likely due to the low expression level of
this protein, however we cannot rule out that low stability of this protein means that it doesn’t got into detergent
based solution but rather aggregates upon extraction from the m embrane42. In contrast, the S466R mutant was
extracted into DDM-based solution effectively, although from the hFSEC analysis is less stable than the WT pro-
tein. Borate efflux analysis revealed that both mutants exhibit a loss of transporter activity similar to the D311A
mutant and this is further clearly illustrated by the poor growth of the S466R and A500R plant mutants grown
in both soil and on media under boron restricted conditions. It is possible that some of the loss of function for
these mutants, and particularly the A500R, is due to low expression of these proteins. In the case of the hAE1
mutants it is clear that fundamental changes within the protein abolish bicarbonate/Cl-exchange and induce
cation leak34,35. Given the structural similarity of the BOR proteins and hAE1 it is likely that the mutations have
similar effects at the molecular level.
Our structure confirms findings from earlier studies on other homologous proteins that OsBOR3 is dimeric
with each protomer organised into core and gate domains. In our case the core domain was slightly less well
resolved compared to the gate domain, most likely as a result of the elevator motion carried out by this domain
as part of the transport cycle. We did not lock our protein through the introduction of mutations or the use of
a conformation specific antibody, but either of these approaches might facilitate obtaining a higher resolution
structure.
In summary we have demonstrated that AtBOR1 mutations, equivalent to disease causing mutations in hAE1,
result in markedly reduced plant growth phenotypes.
Materials and methods
Expression, purification and cryo‑EM grid preparation. The proteins were expressed and purified
as previously described33,38. In brief, for cryo-EM analysis a protein lacking amino acid residues 643–672 and
incorporating a Q228T mutation was introduced to remove a naturally occurring TEV cleavage site (using oli-
gomers: O_SB3_Q-T_F 5′-tctgagccaccccgtaccatacacccatgaccttgccc-3′ and O_SB3_Q-T_R 5′-gggcaaggtcatgggtg-
tatggtacggggtggctcaga-3′) was used. The protein, referred to as OsBOR3∆1–64238, was expressed as a fusion pro-
tein with C-terminal yeast enhanced GFP and 8 His tags and incorporating a TEV cleavage s ite43. The protein
was expressed in FGY217 Saccharomyces cerevisiae cells44 in a typical culture volume of 12 L -URA medium
supplemented with 0.1% (w/v) glucose incubated at 30 °C. The -URA media was prepared with 6.7 g/L Yeast
Nitrogen Base without amino acids (Sigma-Aldrich, Y0626-1 kg) and 2 g/L of amino acid mix [prepared in
house by mixing: 18 mg/L Adenine Hemisulfate (A9126), 76 mg/L Alanine (A7627), 76 mg/L Arginine hydro-
chloride (A5131), 76 mg/L Asparagine monohydrate (A8381), 76 mg/L Aspartic acid (A8949), 76 mg/L Cysteine
hydrochloride monohydrate (C7880), 76 mg/L Glutamic acid monosodium salt (G1626), 76 mg/L Glutamine
(G3126), 76 mg/L Glycine (G7126), 76 mg/L Histidine (H8000), 76 mg/L myo-Inositol (I5125), 76 mg/L Iso-
leucine (I2752), 380 mg/L Leucine (L8000), 76 mg/L Lysine monohydrochloride (L5626), 76 mg/L Methionine
(M9625), 8 mg/L p-Aminobenzoic acid potassium salt (A0254), 76 mg/L Phenylalanine (P2126), 76 mg/L Proline
(P0380), 76 mg/L Serine (S4500), 76 mg/L Threonine (T8625), 76 mg/L Tryptophan (T0254), 76 mg/L Tyrosine
disodium salt (T2269), 76 mg/L Valine (V0500). All the products were purchased by Sigma-Aldrich. Addition of
galactose, to a final concentration of 2% (w/v), was used to induce protein expression once the culture reached
an OD600 = 0.6. Protein expression was induced for 22 h and the cells harvested by centrifugation (5000×g for
Scientific Reports | (2021) 11:12328 | https://doi.org/10.1038/s41598-021-91763-6 8
Vol:.(1234567890)www.nature.com/scientificreports/
10 min at 4 °C) followed by storage at − 80 °C until further use. A 2 day protocol was used for preparation of cryo-
EM grids including membrane preparation, protein isolation and grid preparation and freezing. The cells (from
4 L of culture) containing O sBOR3∆1–642 were thawed and then resuspended on ice in 50 mM Tris (pH 7.5),
1 mM EDTA, 0.6 M sorbitol) supplemented with cOmplete™ EDTA free protease inhibitor tablets (Roche). The
cells were lysed using a Constant Systems Cell Disrupter and membranes harvested by differential centrifugation
(10,000×g for 10 min followed by 100,000×g for 1 h at 4 °C). The membranes were immediately resuspended into
solubilisation buffer (1 × PBS (pH 7.5), 100 mM NaCl, 10% glycerol (v/v), 1% LMNG (w/v)) supplemented with
protease inhibitor tablets (Roche), followed by incubation at 4 °C for 1 h. Insoluble material was removed by
ultracentrifugation (100,000×g for 1 h at 4 °C) and the OsBOR3∆1–642 in the soluble extract was purified using a
three step process using LMNG at a concentration of 1× CMC; His-trap at a flow rate of 1 mL/min, TEV cleavage
followed by reverse His-trap and size exclusion chromatography at a flow rate of 0.5 mL/min. The protein was
eluted from the SEC column in 20 mM Tris (pH 7.5), 150 mM NaCl, 0.75× CMC LMNG. The single SEC fraction
containing the highest concentration was used to prepare the grids directly with no further buffer exchanges or
concentration steps. The protein was also analysed by Coomassie stain SDS-PAGE.
Negative stain TEM. Protein preparations were screened by negative-stain EM to assess for monodisper-
sity and overall quality of the protein preparation prior to cryo-EM analyses. For negative strain EM analysis,
0.01 mg/mL OsBOR3Δ1–642 in a total volume of 3 μL was applied onto freshly glow-discharged carbon coated
400 mesh grids (Agar scientific), excess solution removed by blotting from the side and stained with 2% (w/v)
uranyl acetate. Negative stain EM micrographs were recorded on a Tecnai T12 microscope at 120 kV using an
FEI 2 K eagle camera.
CryoEM grid preparation and data collection. 300 mesh Cu Quantifoil R2/2 grids (Agar Scientific)
were glow discharged for 90 s prior sample deposition. 3 µL OsBOR3 (1 mg/mL) was applied to the grid, blotted
and then plunged into liquid ethane using a Vitribot mark IV (Thermo Fisher Scientific) at 4 °C, 100% humidity,
3 s blot time and -2 blot force. Plunge frozen grids were stored under liquid nitrogen until use.
EPU automated imaging software (Thermo Fisher Scientific) was used to collect electron micrograph movies
on a 300 keV Titan Krios (Thermo Fisher Scientific) fitted with a K3 direct detection camera (Gatan) in super
resolution mode. All collection parameters are shown in Supplementary Table S3.
CryoEM data processing and density reconstruction. The collected micrograph movie frames were
aligned using MotionCor245 and subsequently the CTF parameters were estimated with CTFFind446. All the
micrographs were then assessed by eye for quality using the FFT spectra to discard micrographs with exces-
sive image drift or crystalline ice. Unless otherwise stated all the following data processing was carried out in
RELION47. Particles were picked manually and with the RELION auto-picking function and then sorted by
their similarity to the reference 2D classes (Z-score). Several rounds of 2D classification were used to select a
range of orientations before generating an initial model low pass filtered to 15 Å. A three class 3D classification
was performed with the initial model to select a homogenous particle set for refinement. The class with the
highest particle occupancy and resolution was taken forward for refinement. 3D refinement with C2 symmetry
imposed, followed by post-processing yielded a reconstructed density of between 5 and 6 Å estimated global
resolution with a B-factor of − 220 Å2. Details of the mask used are available from the Electron Microscopy Data-
Bank (EMDB) under the accession code EMDB-11996. All maps were visualised in 3D using UCSF C himera48.
Mutagenesis. AtBOR1 point mutants were created with the QuikChange Lightning Site-DirectedMutagen-
esis Kit (Agilent Technologies), using as template DNA, wild-type or AtBOR1 in the pDDGFP2 vector. The
oligonucleotides used are shown in Supplementary Table S1.
Functional complementation analysis. pDDGFP2 vectors containing the genes encoding WT AtBOR1,
WT OsBOR3 and OsBOR3∆1–642 were transformed into a S. cerevisiae ∆bor1p strain for functional complemen-
tation analysis as previously described33. As a negative control empty pDDGFP2 vector was also transformed
into the S. cerevisiae ∆bor1p strain. Transformants were incubated in 10 mL -URA with 2% (w/v) glucose at 30
°C and 300 rpm shaking overnight. A fivefold serial dilution was carried out with cells starting at O D600 0.5 in
-URA media. 10 μL of each dilution was spotted on -URA plates with 2% (w/v) galactose and supplemented
with the following concentrations of boric acid: 0, 5, 7.5 mM. Plates were incubated for 30 °C for 5 or 7 days and
imaged using a ChemiDoc MP Imaging System (Bio-Rad).
FSEC and hFSEC. AtBOR1 proteins were expressed as described above and membranes containing the
different AtBOR1 proteins were diluted in solubilisation buffer (PBS (pH 7.4), 1% (w/v) DDM, supplemented
with 1 tablet of protease inhibitor) to give a final total protein concentration of 50 μg/mL and incubated with
gentle rocking at 4 °C for 1 h. Insoluble material was removed by centrifugation at 14,000×g for 1 h at 4 °C. The
solubilisation efficiency of each protein was calculated as the proportion of the initial GFP fluorescence that
remained after solubilisation. 500 μL supernatant was injected onto a Superose 6 10/300 column equilibrated
with 20 mM Tris (pH 7.5), 150 mM NaCl and 0.03% (w/v) DDM. The elution was collected, from 6.4 mL elu-
tion volume (void), in 200 μL fractions in a clear bottomed 96-well plate. The GFP fluorescence of each fraction
was measured using a SpectraMax M2e with an excitation wavelength of 488 nm and an emission wavelength
of 512 nm. For heated FSEC experiments, the solubilised protein was incubated at 46 °C for 10 min and any
Scientific Reports | (2021) 11:12328 | https://doi.org/10.1038/s41598-021-91763-6 9
Vol.:(0123456789)www.nature.com/scientificreports/
insoluble aggregates removed by a 10 min centrifugation (14,000×g at 4 °C) prior to loading onto a Superose 6
10/300 column. The samples were collected and analysed as described above.
Plant genotypes. Using Agrobacterium tumefaciens-mediated transformation, the pBOR1::BOR1-GFP
proteins containing the respective point mutations were introduced into the bor1-3 Arabidopsis thaliana back-
ground, which carries a T-DNA insertion in the AtBOR1 gene (SALK_03731249). To select for plants carrying
the desired transgene, T1 seeds were grown on half strength Murashige and Skoog (MS) medium containing
50 mg/L kanamycin. The presence of the respective BOR1 mutation in each individual line was verified by PCR
on genomic DNA (primers 5′-ATGCTTGATGTTCCAATCGTC-3′ and 5′ AGCTCCTCGCCCTTGCTCAC-3′)
followed by sequencing. The resulting T2 seeds were analysed for their segregation on kanamycin to avoid lines
containing multiple insertions of the construct. At least two independent insertion lines were isolated per con-
struct to minimize the risk of positional effects. The T2 seeds were used for phenotyping experiments.
Plant growth conditions. For analysis of shoot fresh weight of seedlings grown in axenic culture, plants
were grown in square petri dishes (12 × 12 cm) for 3 weeks. Seeds were surface-sterilized and stratified for
2–3 days at 4 °C. Half strength MS basal medium (corresponding to Sigma M5524) was prepared by adding all
ingredients except boric acid. The MS medium contained 5 g/L sucrose and 0.5 g/L MES (2-(N-morpholino)
ethanesulfonic acid) and was adjusted to pH 5.7 with KOH. To remove residual boric acid the medium was
treated overnight with B chelator Amberlite IRA-743 (3 g/L, Sigma). Before autoclaving, boric acid (H3BO3,
Sigma-Aldrich, Catalog number 15663) was added to the medium to a concentration of 30 µM (sufficient B) or
300 nM (low B). The medium was solidified using 4.5 g/L Gelrite (Duchefa). The seeds were germinated verti-
cally on medium containing 50 mg/L kanamycin to select T2 seedlings that carry the desired transgene. When
5 days old, resistant seedlings were transferred to fresh medium with either low or sufficient boron but without
kanamycin and grown horizontally thereafter. When the plants were 3 weeks old the shoots were separated from
the root system and weighed. Plates were kept in a growth chamber set to 22 °C day/20 °C night temperature
under 12 h of light.
To determine plant phenotypes in soil culture, seedlings were initially grown vertically on half strength MS
medium containing 30 µM boron and 50 mg/L kanamycin as described above. After 1 week, 10–12 resistant
seedlings per genotype were transferred to soil into individual pots (5 cm). After transfer to soil, the plants were
moved to an Aralab growth room set to 22 °C day/20 °C night temperature under 12 h of light at 60% relative
humidity. The plants were watered moderately and the rosette fresh weight was analysed at 5 weeks of age.
Boron transport assay. Synthetic genes of AtBOR1 mutants in pDONR221 were synthesized by Gene-
script (https://www.genscript.com/). The synthetic genes were subcloned into yeast expression vector pDDGFP2
and transformed in to FGY217 (Δbor1) yeast strain as described b y33. Borate efflux assay in yeast cells was per-
14
formed as described in Takano et al. with some modifications. Briefly, yeast cells harvested at mid-exponential
phase (OD600 ~ 0.6). were transferred to the synthetic medium (pH 5.5) containing 1 mM of boric acid and incu-
bated for 1 h. After 1 h cells were washed with ice cold distilled water and harvested by centrifugation at 3000×g
for 2 min at 4 °C. To release the intracellular boron the harvested cells were boiled at 90 °C for 30 min and the
supernatant was used to measure the boron content by using a curcumin based colorimetric protocol based on
absorbance values at 550 nm50. The coumarin efflux assay results were normalised using GFP flourcsence; 100 µL
of each batch of cells were aliquoted into the microplate and absolute fluorescence was quantified using a Fluo-
rescence Microplate reader with excitation max 488 nm and emission max 509 nm. The absolute fluorescence
was normalized to WT to obtain the fold GFP expression.
Confocal microscopy. Yeast cells expressing AtBOR1-GFP were harvested at mid-log phase (OD600 ~ 0.6).
100 µL of these cells were aliquoted in microplate and absolute fluorescence was quantified using Fluorescence
Microplate reader with excitation max 488 nm and emission max 509 nm. To assess the localization of AtBOR1-
GFP, yeast cells expressing the AtBOR1 proteins were harvested at mid-log phase and analysed using Leica SP5
confocal fluorescence microscope with the excitation and detection wavelengths of 488 nm and 500–540 nm,
respectively.
Plant research compliance statement. We obtained our seeds, with permission, from colleagues Japan
in compliance with the Nayoga protocols. No seeds were collected from the wild and no licences were required.
Code availability
The final cryoEM density map of OsBOR3 has been deposited to the Electron Microscopy DataBank (EMDB)
under the accession code EMD-11996.
Received: 24 February 2021; Accepted: 28 May 2021
References
1. Hu, H. & Brown, P. H. Localization of boron in cell walls of squash and tobacco and its association with pectin (evidence for a
structural role of boron in the cell wall). Plant Physiol. 105, 681–689 (1994).
2. Chormova, D. & Fry, S. C. Boron bridging of rhamnogalacturonan-II is promoted in vitroby cationic chaperones, including
polyhistidine and wall glycoproteins. New Phytol. 209, 241–251 (2015).
3. Dell, B. & Huang, L. Physiological response of plants to low boron—Springer. Plant Soil 193, 103–120 (1997).
Scientific Reports | (2021) 11:12328 | https://doi.org/10.1038/s41598-021-91763-6 10
Vol:.(1234567890)www.nature.com/scientificreports/
4. Camacho-Cristóbal, J. J. et al. Boron deficiency inhibits root cell elongation via an ethylene/auxin/ROS-dependent pathway in
Arabidopsis seedlings. J. Exp. Bot. 66, 3831–3840 (2015).
5. Li, C., Pfeffer, H., Dannel, F., Romheld, V. & Bangerth, F. Effects of boron starvation on boron compartmentation, and possibly
hormone-mediated elongation growth and apical dominance of pea (Pisum sativum) plants. Physiol. Plant 111, 212–219 (2001).
6. Tanaka, M. & Fujiwara, T. Physiological roles and transport mechanisms of boron: Perspectives from plants. Pflugers Arch. 456,
671–677 (2008).
7. Shorrocks, V. M. The occurrence and correction of boron deficiency. Plant Soil 198, 121–148 (1997).
8. Miwa, K. & Fujiwara, T. Boron transport in plants: Co-ordinated regulation of transporters. Ann. Bot. 105, 1103–1108 (2010).
9. Goldbach, H. E. et al. Rapid response reactions of roots to boron deprivation. J. Plant Nutr. Soil Sci. 164, 173–181 (2001).
10. Pallotta, M. et al. Molecular basis of adaptation to high soil boron in wheat landraces and elite cultivars. Nature 514, 88–91 (2014).
11. Hrmova, M., Gilliham, M. & Tyerman, S. D. Plant transporters involved in combating boron toxicity: Beyond 3D structures.
Biochem. Soc. Trans. 37, 629–714 (2020).
12. Takano, J. et al. The Arabidopsis major intrinsic protein NIP5;1 is essential for efficient boron uptake and plant development under
boron limitation. Plant Cell 18, 1498–1509 (2006).
13. Jennings, M. L., Howren, T. R., Cui, J., Winters, M. & Hannigan, R. Transport and regulatory characteristics of the yeast bicarbonate
transporter homolog Bor1p. AJP Cell Physiol. 293, C468–C476 (2007).
14. Takano, J. et al. Arabidopsis boron transporter for xylem loading. Nature 420, 337–340 (2002).
15. Uragachi, S., Kaya, Y., Hanaoka, H. & Fujiwara, T. Generation of boron-deficiency-tolerant tomato by overexpressing an Arabidopsis
thaliana borate transporter AtBOR1. Front. Plant Sci. 5, 1–7 (2014).
16. Miwa, K. et al. Plants tolerant of high boron levels. Science 318, 1417–1417 (2007).
17. Sutton, T. et al. Boron-toxicity tolerance in barley arising from efflux transporter amplification. Science 318, 1446–1449 (2007).
18. Takano, J., Miwa, K., Yuan, L., von Wirén, N. & Fujiwara, T. Endocytosis and degradation of BOR1, a boron transporter of Arabi-
dopsis thaliana, regulated by boron availability. PNAS 102, 12276–12281 (2005).
19. Miwa, K., Takano, J. & Fujiwara, T. Improvement of seed yields under boron-limiting conditions through overexpression of BOR1,
a boron transporter for xylem loading, Arabidopsis thaliana. Plant J. 46, 1084–1091 (2006).
20. Nakagawa, Y. et al. Cell-type specificity of the expression of Os BOR1, a rice efflux boron transporter gene, is regulated in response
to boron availability for efficient boron uptake and xylem loading. Plant Cell Online 19, 2624–2635 (2007).
21. Bai, X., Moraes, T. F. & Reithmeier, R. A. F. Structural biology of solute carrier (SLC) membrane transport proteins. Mol. Membr.
Biol. 34, 1–32 (2017).
22. Arakawa, T. et al. Crystal structure of the anion exchanger domain of human erythrocyte band 3. Science 350, 680–684 (2015).
23. Huynh, K. W. et al. CryoEM structure of the human SLC4A4 sodium-coupled acid-base transporter NBCe1. Nat. Commun. 9,
900 (2018).
24. Coudray, N. et al. Structure of the SLC4 transporter Bor1p in an inward-facing conformation. Protein Sci. 26, 130–145 (2017).
25. Thurtle-Schmidt, B. H. & Stroud, R. M. Structure of Bor1 supports an elevator transport mechanism for SLC4 anion exchangers.
Proc. Natl. Acad. Sci. U.S.A. 113, 10542–10546 (2016).
26. Geertsma, E. R. et al. Structure of a prokaryotic fumarate transporter reveals the architecture of the SLC26 family. Nat. Struct. Mol.
Biol. 22, 803–808 (2015).
27. Chang, Y.-N. et al. Structural basis for functional interactions in dimers of SLC26 transporters. Nat. Commun. 10, 1–10 (2019).
28. Wang, C. et al. Structural mechanism of the active bicarbonate transporter from cyanobacteria. Nat. Plants 5, 1184–1193 (2019).
29. Alguel, Y. et al. Structure of eukaryotic purine/H(+) symporter UapA suggests a role for homodimerization in transport activity.
Nat. Commun. 7, 11336–11339 (2016).
30. Yu, X. et al. Dimeric structure of the uracil:proton symporter UraA provides mechanistic insights into the SLC4/23/26 transporters.
Cell Res. 27, 1020–1033 (2017).
31. Boudker, O., Ryan, R. M., Yernool, D., Shimamoto, K. & Gouaux, E. Coupling substrate and ion binding to extracellular gate of a
sodium-dependent aspartate transporter. Nature 445, 387–393 (2007).
32. Drew, D. & Boudker, O. Shared molecular mechanisms of membrane transporters. Annu. Rev. Biochem. 85, 543–572 (2016).
33. Pyle, E. et al. Protein-lipid interactions stabilize the oligomeric state of BOR1p from Saccharomyces cerevisiae. Anal. Chem. 91,
13071–13079 (2019).
34. Iolascon, A. et al. A novel erythroid anion exchange variant (Gly796Arg) of hereditary stomatocytosis associated with dyseryth-
ropoiesis. Haematologica 94, 1049–1059 (2009).
35. Guizouarn, H. et al. South-east Asian ovalocytosis and the cryohydrocytosis form of hereditary stomatocytosis show virtually
indistinguishable cation permeability defects. Br. J. Haematol. 152, 655–664 (2011).
36. Phillips, B. P., Gomez-Navarro, N. & Miller, E. A. Protein quality control in the endoplasmic reticulum. Curr. Opin. Cell Biol. 65,
96–102 (2020).
37. Cecchetti, C. et al. Transfer of stabilising mutations between different secondary active transporter families. FEBS Open Bio https://
doi.org/10.1002/2211-5463.13168 (2021).
38. Saouros, S., Cecchetti, C., Jones, A., Cameron, A. D. & Byrne, B. Strategies for successful isolation of a eukaryotic transporter.
Protein Expr. Purif. 166, 105522 (2020).
39. Yoshinari, A. et al. Transport-coupled ubiquitination of the borate transporter BOR1 for its boron-dependent degradation. Plant
Cell 33, 420–438 (2021).
40. Ho, M. K. & Guidotti, G. A membrane protein from human erythrocytes involved in anion exchange. J. Biol. Chem. 250, 675–683
(1975).
41. Bruce, L. J. et al. Monovalent cation leaks in human red cells caused by single amino-acid substitutions in the transport domain
of the band 3 chloride-bicarbonate exchanger, AE1. Nat. Genet. 37, 1258–1263 (2005).
42. Sadaf, A., Cho, K. H., Byrne, B. & Chae, P. S. Amphipathic agents for membrane protein study. Method Enzymol. 557, 57–94 (2015).
43. Drew, D. et al. GFP-based optimization scheme for the overexpression and purification of eukaryotic membrane proteins in Sac-
charomyces cerevisiae. Nat. Protoc. 3, 784–798 (2008).
44. Woolford, C. A. et al. The PEP4 gene encodes an aspartyl protease implicated in the posttranslational regulation of Saccharomyces
cerevisiae vacuolar hydrolases. Mol. Cell. Biol. 6, 2500–2510 (2010).
45. Zheng, S. Q. et al. MotionCor2: Anisotropic correction of beam-induced motion for improved cryo-electron microscopy. Nat.
Methods 14, 1–2 (2017).
46. Rohou, A. & Grigorieff, N. CTFFIND4: Fast and accurate defocus estimation from electron micrographs. J. Struct. Biol. 192,
216–221 (2015).
47. Zivanov, J. et al. New tools for automated high-resolution cryo-EM structure determination in RELION-3. Elife 7, e42166 (2018).
48. Pettersen, E. F. et al. UCSF Chimera—A visualization system for exploratory research and analysis. J. Comput. Chem. 25, 1605–1612
(2004).
49. Miwa, K. et al. Roles of BOR2, a boron exporter, in cross linking of rhamnogalacturonan II and root elongation under boron
limitation in Arabidopsis. Plant Physiol. 163, 1699–1709 (2013).
50. Mohan, T. C. & Jones, A. M. E. Determination of boron content using a simple and rapid miniaturized curcumin assay. Bio Protoc.
8, e2703 (2018).
Scientific Reports | (2021) 11:12328 | https://doi.org/10.1038/s41598-021-91763-6 11
Vol.:(0123456789)www.nature.com/scientificreports/
Acknowledgements
This work was supported by Biotechnology and Biological Sciences Research Council (BBSRC) Grant BB/
N016467/1 awarded to BB, AC and AJ. This project also received funding from the European Union’s Horizon
2020 research and innovation programme, RAMP-ITN: Rationalising Membrane Protein Crystallisation Inno-
vative Training Network, under the Marie Sklodowska-Curie Grant Agreement No 722687 (CC). The authors
wish to thank Nora Cronin, facility manager of LonCEM at the Francis Crick Institute for assistance with data
collection. The Electron Microscopy Facility, Centre for Structural Biology, Imperial College London was used
for grid preparation, optimisation and initial Cryo-EM screening. We would like to thank Dr Kyoko Miwa for
Arabidopsis thaliana bor1-3 seeds.
Author contributions
B.B., A.M.E.J. and A.D.C. conceived and oversaw the research. T.C.M., S.L., C.C. and N.S. generated and char-
acterised the AtBOR1 variants. Y.A. and S.S. generated expression constructs and purified the OsBOR3 protein.
S.S. characterised the OsBOR3 and generated the EM grids. S.S., J.D.B., P.S. and A.D.C. carried out cryo-EM
data collection and analysis. B.B. wrote the manuscript with help from all other authors.
Competing interests
The authors declare no competing interests.
Additional information
Supplementary Information The online version contains supplementary material available at https://doi.org/
10.1038/s41598-021-91763-6.
Correspondence and requests for materials should be addressed to A.M.E.J. or B.B.
Reprints and permissions information is available at www.nature.com/reprints.
Publisher’s note Springer Nature remains neutral with regard to jurisdictional claims in published maps and
institutional affiliations.
Open Access This article is licensed under a Creative Commons Attribution 4.0 International
License, which permits use, sharing, adaptation, distribution and reproduction in any medium or
format, as long as you give appropriate credit to the original author(s) and the source, provide a link to the
Creative Commons licence, and indicate if changes were made. The images or other third party material in this
article are included in the article’s Creative Commons licence, unless indicated otherwise in a credit line to the
material. If material is not included in the article’s Creative Commons licence and your intended use is not
permitted by statutory regulation or exceeds the permitted use, you will need to obtain permission directly from
the copyright holder. To view a copy of this licence, visit http://creativecommons.org/licenses/by/4.0/.
© The Author(s) 2021
Scientific Reports | (2021) 11:12328 | https://doi.org/10.1038/s41598-021-91763-6 12
Vol:.(1234567890)You can also read