Sustainable energy systems Achieving 100% renewables Energy systems in Cook Islands
←
→
Page content transcription
If your browser does not render page correctly, please read the page content below
University Flensburg
Energy & Environmental Management
in Developing Countries (M. Eng.)
Lecturer: Prof. Dr. Hohmeyer

 Sustainable energy systems
 Achieving 100% renewables Energy systems in
 Cook Islands

 Name Matriculation Chapters
 number
 Ammar Ul Hassan (551782) 3.1,5, user manual
 Diana Arteta (551779) 3.4,4.3,6.1
 Maryam Yousif (551775) 3.5,4.4,7
 Precious Afolabi (551787) 3.3,4.2,6.2
 Sarah Moustafa (551784) 1,2,3.2,4.1

 0
Sustainable Energy Systems: Coursework, 2019

Table of Contents
List of Figures ............................................................................................................................................................ 4
List of Tables ............................................................................................................................................................. 6
 Chapter one (Sarah)........................................................................................................................................... 7
 Abstract: ..................................................................................................................................................... 7
 Overview of Cooks Island: ........................................................................................................................... 7
 The problem: .............................................................................................................................................. 7
 Rarotonga present power supply: ................................................................................................................ 8
 Aim of the report: ....................................................................................................................................... 9
 Chapter two (Sarah) ........................................................................................................................................ 10
 Load Curve: .............................................................................................................................................. 10
 Load curve calculation methodology ......................................................................................................... 10
 Results:..................................................................................................................................................... 18
 Demand projection and forecast: .............................................................................................................. 21
 Chapter Three: Resource assessment .............................................................................................................. 25
 Wind Resource Assessment (Ammar) ....................................................................................................... 25
 Temperature ..................................................................................................................................... 25
 3.1.2 Wind Speed ...................................................................................................................................... 25
 3.1.3 Energy Yield Estimations ................................................................................................................... 28
 3.1.4 Power Curve ..................................................................................................................................... 29
 3.2 Hydro Resource Assessment (Sarah) ......................................................................................................... 33
 3.2.1 Methodology .................................................................................................................................... 33
 3.2.2 Calculations: ..................................................................................................................................... 36
 3.2.3 Results: ............................................................................................................................................. 36
 3.3 Solar Resource assessment (Precious)....................................................................................................... 37
 3.3.1 Methodology .................................................................................................................................... 38
 3.4 Biomass (Diana) ........................................................................................................................................ 48
 3.4.1 Waste to Energy................................................................................................................................ 48
 3.4.2 Waste to Energy in Rarotonga ........................................................................................................... 48
 3.4.3 Incineration ...................................................................................................................................... 48
 3.4.4 Cost Analysis ..................................................................................................................................... 49
 3.4.5 Conclusion ........................................................................................................................................ 50
 3.4.6 Biogas ............................................................................................................................................... 50
 3.4.7 Conclusion ........................................................................................................................................ 51

 1
Sustainable Energy Systems: Coursework, 2019
 3.4.8 Biodiesel ........................................................................................................................................... 52
 3.4.9 Conclusion ........................................................................................................................................ 52
 3.5 Hydro Pump Storage (Maryam) ................................................................................................................ 54
 3.5.1 Rarotonga Load Shape: ..................................................................................................................... 54
 3.5.2 Storage Technologies options in Rarotonga: ...................................................................................... 55
 3.5.3 Pumped hydropower storage (PHS): ................................................................................................. 57
 3.5.4 Methodology of the location selection: ............................................................................................. 57
 3.5.5 Calculations ...................................................................................................................................... 60
 3.5.6 Precipitation: .................................................................................................................................... 60
 3.5.7 Storage Optimization: ....................................................................................................................... 61
4 Chapter 4: Cost Analysis .................................................................................................................................. 62
 4.1 Wind (Sarah)............................................................................................................................................. 62
 4.2 Solar (Precious)......................................................................................................................................... 63
 4.3 Biodiesel (Diana)....................................................................................................................................... 64
 4.4 Storage (Maryam)..................................................................................................................................... 64
5 Chapter Five: Modelling (Ammar).................................................................................................................... 65
 5.1 Inputs of the simulation ............................................................................................................................ 65
 5.2 Calculations .............................................................................................................................................. 66
 5.3 Outputs .................................................................................................................................................... 67
6 Chapter 6: Scenarios ........................................................................................................................................ 75
 6.1 Transport (Diana)...................................................................................................................................... 75
 6.1.1 Transport Sector in Rarotonga .............................................................................................................. 75
 6.1.2 Demand Assessment............................................................................................................................. 76
 6.1.3 Techno-Commercial Feasibility ............................................................................................................. 77
 6.1.4 Performance comparison ...................................................................................................................... 78
 6.1.5 Fuel Economy and Electric Load ............................................................................................................ 78
 6.1.6 Charging Infrastructure ......................................................................................................................... 80
 6.1.7 100% E-mobility Scenario...................................................................................................................... 80
 6.1.8 Calculations for comparison of fuel cost ................................................................................................ 81
 6.2 PV Roof Top (Precious) ............................................................................................................................. 83
 6.2.1: Methodology .......................................................................................................................................... 83
 6.2.1.3: Solar Energy Potential on Rooftops ...................................................................................................... 84
 6.2.1.4 Aggregated Solar PV Technology Potential ............................................................................................ 87
7. Chapter 7: Road Map (Maryam) .......................................................................................................................... 88

 2
Sustainable Energy Systems: Coursework, 2019
 7.1 Roadmap: ................................................................................................................................................. 88
 7.1.1 First Phase: Planning Phase ............................................................................................................... 88
 7.1.2 Second Phase: Implementation phase (Time line) ................................................................................. 89
 7.2 Risks and Challenges: ............................................................................................................................... 90
 7.3 Policies and Recommendation .................................................................................................................. 91
8 References ....................................................................................................................................................... 92

 3
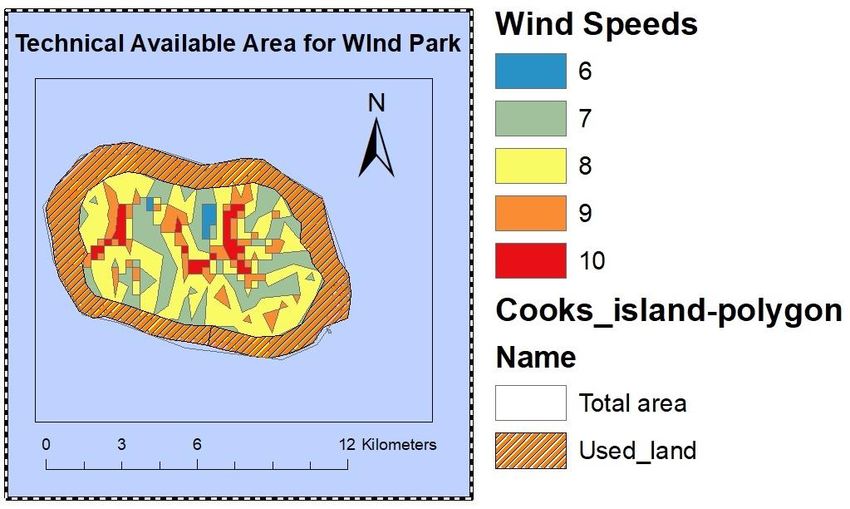
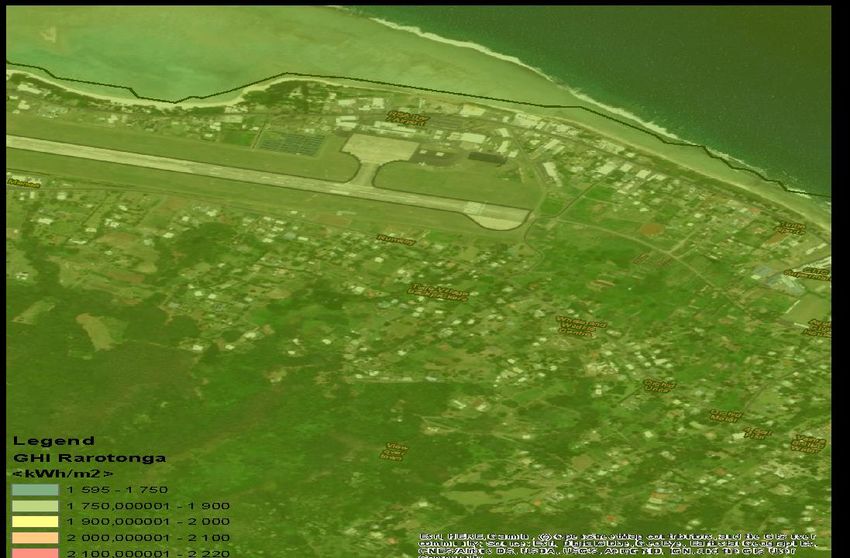
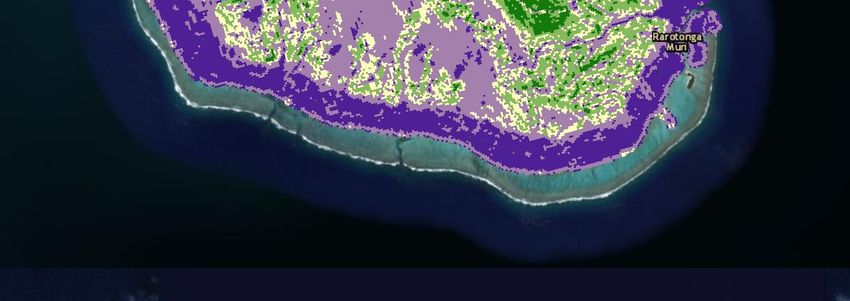
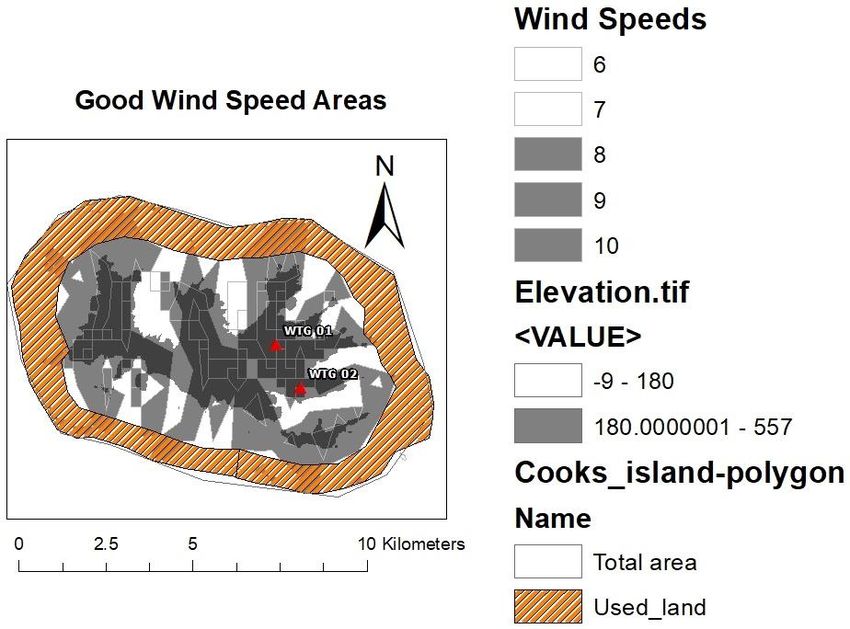
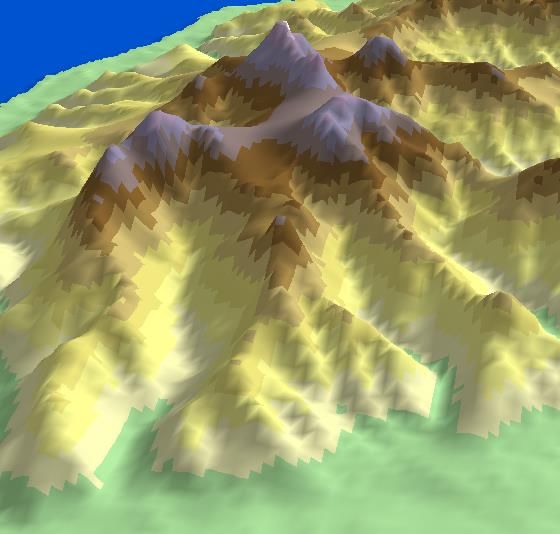
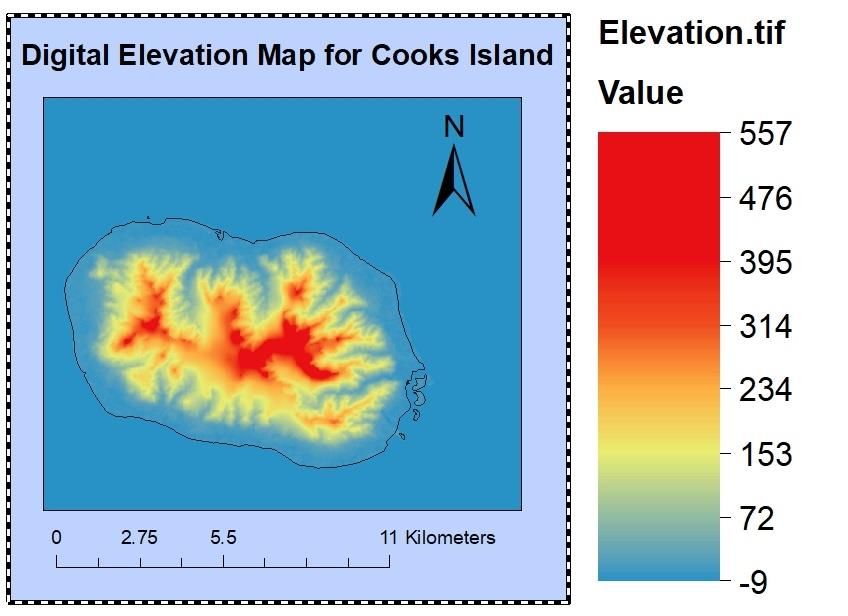
University Flensburg
Energy & Environmental Management
in Developing Countries (M. Eng.)
Lecturer: Prof. Dr. Hohmeyer

List of Figures
Figure 2.2-1: Rarotonga Load profile for a typical day as per CI renewable energy implementation plan. ................. 10
Figure 2.2-2: Rarotonga extracted load profile for S&S Season ................................................................................. 11
Figure 2.2-3: Rarotonga extracted load profile for WD Season ................................................................................. 11
Figure 2.3-1: Demand for a typical weekday of a month ........................................................................................... 19
Figure 2.3-2: Demand for a typical Saturday of a month .......................................................................................... 19
Figure 2.3-3: Demand for a Typical Sunday and holiday of a month .......................................................................... 20
Figure 2.3-4: Demand for a typical month of a year .................................................................................................. 20
Figure 3.1-1: Annual Mean Temperature .................................................................................................................. 25
Figure 3.1-2: Correlation of Wind Speed by Different Sources .................................................................................. 26
Figure 3.1-3: Annual mean wind speed in m/s .......................................................................................................... 26
Figure 3.1-4: Wind speed frequency in 1m/s bins ..................................................................................................... 27
Figure 3.1-5: Wind Resource map and Available Area............................................................................................... 27
Figure 3.1-6: Digital Elevation Model of Island.......................................................................................................... 28
Figure 3.1-7: Power Curve and Cp of G114-2.0 ......................................................................................................... 30
Figure 3.1-8: Places with high elevations .................................................................................................................. 31
Figure 3.1-9: High Wind speed Areas ........................................................................................................................ 31
Figure 3.1-10: Best possible locations of wind turbines ............................................................................................ 32
Figure 3.2-1: three catchment areas defined by ARCGIS ........................................................................................... 33
Figure 3.2-2 :Head difference for catchment area 1 ................................................................................................. 34
Figure 3.2-3 Head difference for catchment area 2 .................................................................................................. 34
Figure 3.2-4:Head difference for catchment area 3 .................................................................................................. 34
Figure 3.2-5: location of catchment area 1 ............................................................................................................... 35
Figure 3.2-6: Location of catchment area 2 .............................................................................................................. 35
Figure 3.2-7: Location of catchment area 3 .............................................................................................................. 35
Figure 3.3-1: Daily Irradiation Curve (MeteoBlue, 2019) ........................................................................................... 37
Figure 3.3-2: Sun Path in Cartesian Coordinates (Oregon) ........................................................................................ 37
Figure 3.3-3: Solar PV potential in the Cook Island (Global Solar Atlas, 2016) ........................................................... 38
Figure 3.3-4: Population Density map of Rarotonga ................................................................................................. 40
Figure 3.3-5:Population Density with defined Threshold .......................................................................................... 41
Figure 3.3-6:Slope map of Rarotonga ....................................................................................................................... 42
Figure 3.3-7:Slope map with slope Threshold ........................................................................................................... 43
Figure 3.3-8:Potential Sites selected based on all the Threshold criteria ................................................................... 43
Figure 3.3-9: Annual Solar Energy in Rarotonga ........................................................................................................ 46
Figure 3.3-10: Summary of Solar Power Potential for Ground Mounted PV .............................................................. 47
Figure 3.3-11: Summary of the solar energy potential for Ground mounted PV ........................................................ 47
Figure 3.4-1: Energy recovery potential formula (Alzate Arias, 2018) ........................................................................ 49
Figure 3.4-2: Composition of Dry Coconut by weight (Raghavan, 2010) .................................................................... 51
Figure 3.5-1 The intermittent in RE generation and the unmet load in some time during the year (January) ............ 54
Figure 3.5-2 Different Energy Storage Techniques – Energy Stored and Power Output (Ibrahim, 2007) ................... 56

 4
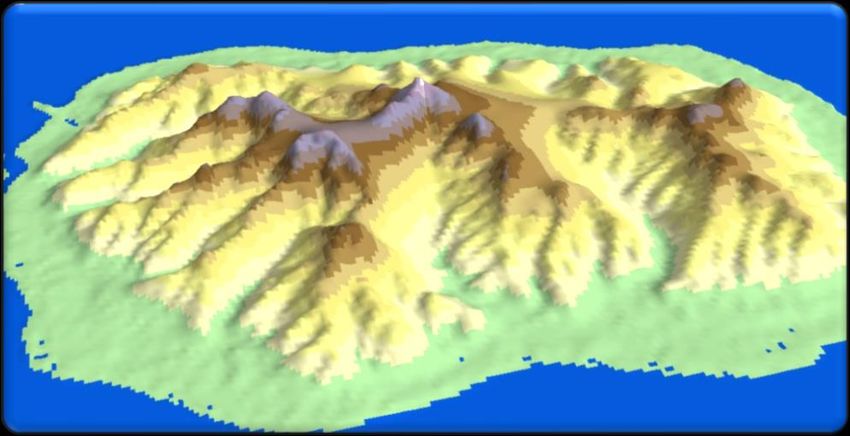
Sustainable Energy Systems: Coursework, 2019
Figure 3.5-3 Comparison of different storage technologies regarding to the investment costs for power and capacity
................................................................................................................................................................................ 56
Figure 3.5-4 Pumped Hydro Storage (wikipedia) ...................................................................................................... 57
Figure 3.5-5 3D Elevation for Rarotonga, ‘Source =own design’............................................................................... 58
Figure 3.5-6: Possible location for the reservoirs ‘source=own design’ ..................................................................... 58
Figure 3.5-7 lower reservoir size calculation using google map Figure 3.5-8 upper reservoir size calculation
using google map ..................................................................................................................................................... 59
Figure 3.5-9 Location of lower and upper reservoirs using google earth .................................................................... 59
Figure 3.5-10average precipitation per day from 1981 to 2017 ................................................................................ 60
Figure 3.5-11 load curve after the storage ................................................................................................................ 61
Figure 5.3-1: Wind Generation Output in complete year .......................................................................................... 67
Figure 5.3-2: Solar Generation Output ..................................................................................................................... 69
Figure 5.3-3: Storage content ................................................................................................................................... 71
Figure 5.3-4: Deficit covered by hydro ...................................................................................................................... 71
Figure 5.3-5: Excess to hydro storage ....................................................................................................................... 73
Figure 5.3-6: Biomass generation ............................................................................................................................. 73
Figure 6.1.1-1: Main bus stops in Rarotonga (Jarvy Web) ......................................................................................... 75
Figure 6.1.7-1: Load in kW for one day with E-Mobility scenario .............................................................................. 81
Figure 6.2-1: Types of roofing materials on the island .............................................................................................. 84
Figure 6.2-2: Global Horizontal Irradiation on Rarotonga Rooftops ........................................................................... 85
Figure 6.2-3: Hourly generation from solar PV rooftops............................................................................................ 86
Figure 6.2-4: Hourly generation of 6MW PV on rooftops .......................................................................................... 87
Figure 7.1.2-1 Time line for achieving 100% renewable energy by 2030 and 100% E mobility by 2045 ..................... 90

 5
University Flensburg
Energy & Environmental Management
in Developing Countries (M. Eng.)
Lecturer: Prof. Dr. Hohmeyer

List of Tables
Table 1.4-1: Rarotonga electricity production and demand ........................................................................................ 9
Table 2.2-1: MWH per each hour of Day .................................................................................................................. 12
Table 2.2-2 Rarotonga Calendar for the year 2011 ................................................................................................... 13
Table 2.2-3: Rarotonga Generation per month ........................................................................................................ 14
Table 2.2-4: Demand per typical type of days for each month .................................................................................. 14
Table 2.2-5: Relationship between total demand per each hour to the total demand per year ................................. 15
Table 2.2-6: Sample of the hourly generation for the three different type of days .................................................... 16
Table 2.4-1: Gross Domestic Product at Constant 2016 Prices($million) ................................................................... 21
Table 2.4-2: annual Growth rate .............................................................................................................................. 22
Table 2.4-3: Demand forecast till 2040 ..................................................................................................................... 23
Table 3.1-1: Power Curve G114-2.0 .......................................................................................................................... 29
Table 3.1-2: Energy Generation from different turbines ........................................................................................... 30
Table 3.2-1: Flow & Power calculations .................................................................................................................... 36
Table 3.3-1:Basic formula for the calculation of theoretical solar PV potential ......................................................... 39
Table 3.3-2:Sum of Land Area Available for PV ......................................................................................................... 44
Table 3.3-3: Geographic Solar PV potential for the chosen sites ............................................................................... 45
Table 3.5-1 area and height of the upper and lower reservoirs ................................................................................... 59
Table 3.5-2 Time needed to fill the reservoir ............................................................................................................ 60
Table 3.5-3 Energy stored ........................................................................................................................................ 61
Table 4.1-1: LCOE for wind ....................................................................................................................................... 63
Table 4.2-1: LCOE for solar PV .................................................................................................................................. 64
Table 5.3-1: Wind Generation during Hours of day ................................................................................................... 68
Table 5.3-2: Generation from Solar during different hours ....................................................................................... 70
Table 5.3-3: Generation from pump Hydro ............................................................................................................... 72
Table 5.3-4: Production of Biomass .......................................................................................................................... 74
Table 6.1.2-1: No. of Vehicles registered in Cook Islands, 2016 (Own calculations) ................................................... 76
Table 6.1.2-2: Estimated No. of Vehicles in Rarotonga, 2016 (Own calculations) ...................................................... 76
Table 6.1.2-3 : Estimated No. of Vehicles in Rarotonga, 2040 (Own calculations)...................................................... 77
Table 6.1.5-1 : Fuel Economy Estimates for Electric Vehicles .................................................................................... 78
Table 6.1.5-2: Electric Annual Load Estimated for Electric Cars ................................................................................. 79
Table 6.1.5-3 : Electric Annual Load Estimated for Electric Motorcycles .................................................................... 79
Table 6.1.8-1 : Cost comparison of Electric car vs Conventional car .......................................................................... 81
Table 6.1.8-2: Cost comparison of Electric Motorcycle vs Conventional Motorcycle ................................................. 81
Table 6.2-1: Aggregated Sum of Solar PV potential ................................................................................................... 87

 6

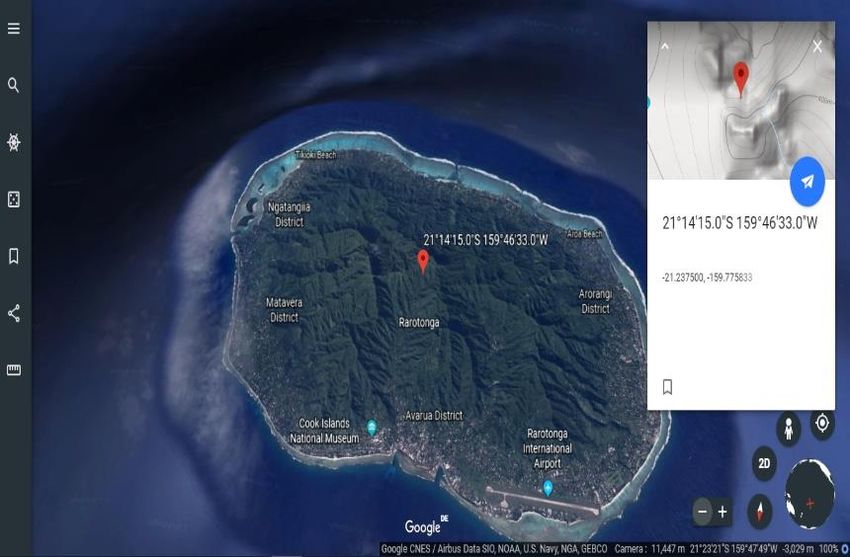
University Flensburg
Energy & Environmental Management
in Developing Countries (M. Eng.)
Lecturer: Prof. Dr. Hohmeyer

 Chapter one (Sarah)
 Abstract:
This study presents the method for reaching 100% sustainable energy systems in cooks islands. It covers
the possibility of fulfilling this objective from technical, commercial and environmental aspects. This is
based on a model simulation taking into consideration the available resources. This study also focuses on
the main Island of Rarotonga. The reason for this is that Rarotonga is the largest populated island and
represents 75% of Cook’s Island population. (Etches, 2019)

 Overview of Cooks Island:
The total area of Cooks Island is 240 Km² and Rarotonga is 67.39 Km2 with a total population of 17,434
located in Rarotonga according to the latest census of 2016 (Office, 2018). Cooks Islands is made up of a
total of 15 islands divided into the southern and northern Islands. It’s located on the Pacific Ocean
between New Zealand and Australia (Office, 2018). Tourism is the main industry in Cooks Island and
especially Rarotonga with the highest number of visitors between July and September. The main use of
energy in the Cook Islands are transport (43%), aviation (30%) and (27%) for electricity. (Cooksislands
economic and development strategy handbook volume 1, 2013)

Until recently, the Cook Islands was mainly dependent on imported refined petroleum fuels, which
accounts for 90% of gross energy supply. Biomass provided most of the remaining 10% and is mainly
used for cooking (Mirei Isaka, 2013 ). The energy access in cooks’ islands is around 99% (Mirei Isaka,
2013 ). The share of fossil fuels in 2019 has currently dropped to 79 % with 21% being generated from
Renewables and especially solar (World Data.info, n.d.), as the government of Cooks islands has
introduced the renewables energy plan. However fossil fuels still represent a very high share of the
electricity generation with the current share of renewables only amounting to 15% ( New Zealand
Ministry of Foreign Affairs & Trade 2016, 2016).

 The problem:
The main dependency in Rarotonga for electricity generation is on fossil fuels (Division, 2012). Which
the country imports mainly from New Zealand (Division, 2012). The consumption rate per day for fuel is
22,000 liters (Division, 2012). The current available storage capacity for fuels is three tanks with a
capacity per tank of 52,000 liters (Division, 2012). Fuel is delivered by Truck to TAU with a capacity per
truck ranging from 4000 Litres to 7000 Litres per truck (Division, 2012). This dependency presents a very

 7
Sustainable Energy Systems: Coursework, 2019
economic and environmental burdens and subjects the islands to the fluctuating prices of fuels in addition
to the availability (Division, 2012). Additionally, the price of diesel on Cooks islands is higher compared
to other pacific islands. The price of diesel on the island of Rarotonga is at $2.52 (Cooksislands economic
and development strategy handbook volume 1, 2013). Additionally, the import of fuels amount to 25% of
the country’s total imports and this represents 9% of the country’s gross domestic product (Asian
development bank , October 2014 ). 56% of the imported fuel is used in power generation (Asian
development bank , October 2014 ).

Due to the dependency of the electricity generation on diesel, the electricity rates in Cooks’ islands are
higher than that of Australia. Accordingly, the residential rates in Rarotonga ranged from $0.53 to
$0.79/kWh (Andrews, 2018), (Division, Cook Islands Renewable Energy Chart Implementation Plan,
2012).

In 2011 it announced a plan to achieve 100% renewable energy by 2020 (Olly Norojono, 2017).
However, in 2016 the current share of renewable energy systems is only 15% ( New Zealand Ministry of
Foreign Affairs & Trade 2016, 2016). Currently the 2020 goal has not been fulfilled (Vila times , 2018).
In addition, the country is currently facing the huge issue related to the storage due to the dependency on
batteries (Vila times , 2018), (Andrews, 2018). This issue has postponed any further plans regarding
generation from renewables due to the area limitations of the Rarotonga (Andrews, 2018), (Vila times ,
2018). This presents a huge obstacle in further development and postponed the government from
achieving their goal set in 2020, due to the current network which can’t handle the excess generation
from solar (Vila times , 2018). Additionally, the government has announced that they have reached a
point where it’s not possible to take on more renewable into the current grid (RNZ, 2016). The solution
to this as mentioned by the government is the expansion of the grid (RNZ, 2016).

 Rarotonga present power supply:
In the main Island of Rarotonga, power supply is provided by the government authority TAU (TE
Aponga Uira) through a single power plant Avatiu Valley Power Station. The most recent data regarding
the power status on Cooks islands and especially on Rarotonga is dated 2012 regarding the diesel
generators and 2016 for renewables. As such these data are used in this report

In Rarotonga, the installed capacity is 9.5MW connected to six feeders to cover the island (Division,
2012). This installed capacity has dated from 12MW to 9.5 MW due to the depreciation of the nine
generators used to generate electricity (Division, 2012). The maximum demand is 5 MW (Division,
2012).

 8
Sustainable Energy Systems: Coursework, 2019
The share of Renewables and especially solar is 3MW (Division, The cooksisalnds renweable energy
chart , June, 2016 ). As shown in table 1, which represents 13% of the total energy share (Division, The
cooksisalnds renweable energy chart , June, 2016 ). This still represents a very low percentage in
comparison with the government goal of achieving 100% renewables by 2020 (Vila times , 2018). The
electricity tariff in Rarotonga ranges from $053/Kwh for the residential sector to $0.79/Kwh for the
commercial, with fuel representing 90% of the tariff cost (Division, Cook Islands Renewable Energy
Chart Implementation Plan, 2012).

 Table 1.4-1: Rarotonga electricity production and demand

 Diesel installed capacity 9.5MW
 Peak demand 5MW
 Renewables installed capacity 3MW
 Renewables share 13%
 Annual energy generation 33 MWH
 Electricity Tariff $0.53 to $0.79/kWh.
 Kwh/person 2201
 Kwh/household 9581

 Aim of the report:
The aim of this study is to present a possible and feasible solution towards the transition of the energy
system to 100% sustainable energy systems. This has been done by analyzing different renewable energy
technologies such as solar, wind, hydro and Biomass. Also, this study presents storage options to
overcome the current issue impending further development of renewable technology especially on the
main island of Rarotonga which is the main focus of the is study. The study also covers the commercial
aspect of the proposed solution in addition to the environmental and social aspects and analysis of the
current policies. Additionally, this study will provide recommendations for implementing this study.

 9
Sustainable Energy Systems: Coursework, 2019

 Chapter two (Sarah)
 Load Curve:
For the building of the model, it is necessary to define the demand per hour for a complete year. This is
important for ensuring that the demand can be met and for defining the needed generation per hour from
each renewable resource. This chapter illustrates the load curve calculation methodology in addition it
provides an estimate to the load projection and forecast till 2040.

 Load curve calculation methodology
The load profile for each hour of the year was calculation methodology was based on several steps. To
begin with, a reliable source for the load profile for a typical day had to be found. This information was
retrieved from “Cooks Island Renewable energy chart implementation plant “ (Division, Cook Islands
Renewable Energy Chart Implementation Plan, 2012). This report is published by Renewable development
division by the prime minister’s office. This is shown in figure 2.2-1. Its assumed based on the date of the
report that the load curve is for the year 2011.

 Figure 2.2-1: Rarotonga Load profile for a typical day as per CI renewable energy implementation plan.

From this figure, the load profiles were extracted using excel for S&S season (shoulder seasons) and WD
(winter dry) season as shown in figures 2.2-2 and 2.2-3.

 10
Sustainable Energy Systems: Coursework, 2019

 LOAD PROFILE S&S
 5

 4

 3
 MW

 2

 1

 0
 0 5 10 15 20
 HOUR OF THE DAY

 Figure 2.2-2: Rarotonga extracted load profile for S&S Season

 LOAD PROFILE W&D
 5
 4
 3
 MW

 2
 1
 0
 0 5 10 15 20
 HOUR OF THE DAY

 Figure 2.2-3: Rarotonga extracted load profile for WD Season

The extracted data show the same trend as the original trend shown in Figure 2-1. Following that, the
number of days and thus the number of hours were defined for each season. For S&S season, the number of
days is 153 and thus the number of hours is 3672 in a year. For the WD season, the number of days is 212
and thus the number of hours is 5088 in a year. This was used to convert from MW to MWH for each hour
as shown in Table 2.2-1.

 11
Sustainable Energy Systems: Coursework, 2019

 Table 2.2-1: MWH per each hour of Day

 Demand for SS Demand for WD Demand for whole
 S&S WD
Time of Day (June to October) (Nov. to May) year (365)
 MW MW
 MWH MWH MWH

 1 3 2.8 459 593.6 1052.6

 2 2.9 2.7 443.7 572.4 1016.1

 3 2.7 2.6 413.1 551.2 964.3

 4 2.6 2.6 397.8 551.2 949
 5 2.6 2.6 397.8 551.2 949

 6 2.6 2.6 397.8 551.2 949

 7 2.7 3 413.1 636 1049.1

 8 3.1 3.4 474.3 720.8 1195.1
 9 3.6 4.1 550.8 869.2 1420

 10 3.5 4.2 535.5 890.4 1425.9

 11 3.5 4.2 535.5 890.4 1425.9

 12 3.6 4.1 550.8 869.2 1420

 13 3.4 4.1 520.2 869.2 1389.4

 14 3.4 4.2 520.2 890.4 1410.6

 15 3.4 4.2 520.2 890.4 1410.6

 16 3.3 4.1 504.9 869.2 1374.1

 17 3.4 3.9 520.2 826.8 1347
 18 3.5 3.8 535.5 805.6 1341.1

 19 3.9 4.1 596.7 869.2 1465.9

 20 4 4.2 612 890.4 1502.4

 21 3.9 4.1 596.7 869.2 1465.9
 22 3.7 3.8 566.1 805.6 1371.7

 23 3.4 3.5 520.2 742 1262.2

 24 3.3 3.2 504.9 678.4 1183.3

 Total demand in MWH 30,340.20

 Average demand per hour in MW 3.46

 Average Demand per day in MW 83.12

From table 2.2-1, it is calculated that the total demand for Rarotonga per year is 30,340 MWH and the
average demand for a typical day is 83.12 MW. Based on Barbados ratio of the Saturdays to weekdays
which is 0.89 and Sunday to weekday which is 0.86, the demand for a typical Saturday and Sunday were

 12
Sustainable Energy Systems: Coursework, 2019
calculated. Based on that the average demand per typical Saturday is 73.98 MW and Sunday is 71.48 MW.
For simplicity, it was estimated that the demand for the holidays is equal to that of a typical Sunday.

Following that the calendar for cooks island was obtained (Calendar for Year 2011 (Cook Islands), 2019) to
determine the number of working days, Saturdays, Sundays and holidays per month. Table 2.2-2 shows the
calendar for Rarotonga for the year 2011.

 Table 2.2-2 Rarotonga Calendar for the year 2011

 2011 Days of month Working days Saturdays Sundays Holidays

 January 31 21 4 4 2

 February 28 20 4 4 0

 March 31 21 5 5 0

 April 30 19 4 4 3

 May 31 23 4 4 0

 June 30 19 5 5 1

 July 31 23 4 4 0

 August 31 20 5 4 2

 September 30 21 4 5 0

 October 31 21 4 4 2

 November 30 21 5 4 0

 December 31 20 5 4 2

Following that, the monthly generation had to be estimated. This was done by obtaining the total generated
energy in the year 2011/2012. This information was obtained from the yearly issued report by TAU (Te
Aponga Uira O Tumu TE Varovaro , 2012 ). This value is 28,869 MWH which is close to the calculated
value in table 2.

Then using the total generated energy in a year, the monthly generation was calculated by dividing the total
days per month by 365 and multiplying the total yearly energy generated by this percentage. Table 2.2-3
shows the results of this calculation.

 13
Sustainable Energy Systems: Coursework, 2019

 Table 2.2-3: Rarotonga Generation per month

 Month number of days number of days per Total generation per month
 month/ total number MWH
 of days in a year
 Jan 31 9% 2,458.70
 Feb 28 8% 2,220.76
 Mar 31 9% 2,458.70
 Apr 30 8% 2,379.39
 May 31 9% 2,458.70
 Jun 30 8% 2,379.39
 Jul 31 9% 2,458.70
 Aug 31 9% 2,458.70
 Sep 30 8% 2,379.39
 Oct 31 9% 2,458.70
 Nov 30 8% 2,379.39
 Dec 31 9% 2,458.70

 Based on the calculated values for the average demand of the typical weekday, Saturday and Sunday, and
 based on the values calculated in table 2.2-3, the demand was calculated for each month of the year. For
 simplicity the number of holidays per each month were added to the number of Sundays. Table2.2-5 shows
 the results.

 Table 2.2-4: Demand per typical type of days for each month

 Monthly
 Monthly ratio
 Number of Sundays & demand
 generation in Saturdays Holidays generation/ Saturday Sunday weekday
 weekdays Holidays in
 MWH Demand
 MWH

Jan 2,458.70 21 4 6 2 2,470.33 0.995 73.63 71.147 82.73

Feb 2,220.76 20 4 4 0 2,244.24 0.990 73.20 70.735 82.25

Mar 2,458.70 21 5 5 0 2,472.82 0.994 73.55 71.075 82.65

Apr 2,379.39 19 4 7 3 2,375.57 1.002 74.10 71.598 83.25

May 2,458.70 23 4 4 0 2,493.60 0.986 72.94 70.483 81.96

Jun 2,379.39 20 5 6 1 2,461.18 0.967 71.52 69.108 80.36

Jul 2,458.70 23 4 4 0 2,493.60 0.986 72.94 70.483 81.96

Aug 2,458.70 22 5 5 1 2,555.94 0.962 71.16 68.764 79.96

 14
Sustainable Energy Systems: Coursework, 2019
Sep 2,379.39 21 4 5 0 2,398.84 0.992 73.38 70.903 82.45

Oct 2,458.70 22 4 5 1 2,481.96 0.991 73.28 70.813 82.34

Nov 2,379.39 21 5 4 0 2,401.34 0.991 73.30 70.830 82.36

Dec 2,458.70 20 5 6 2 2,461.18 0.999 73.90 71.411 83.04

 Table 2.2-5 shows the demand for each type of day per month. In order to drive the timely series for the
 year a relationship needed to be defined for each hour of the day. This was defined by dividing the total
 demand for each hour of the day by the total demand per year

 Table 2.2-5: Relationship between total demand per each hour to the total demand per year

 Demand for
 whole Demand per hour for a year in MWH /
 Time of Day
 year for each hour Total demand per year in MWH
 MWH

 1 1052.6 0.0347
 2 1016.1 0.0335
 3 964.3 0.0318
 4 949 0.0313
 5 949 0.0313
 6 949 0.0313
 7 1049.1 0.0346
 8 1195.1 0.0394
 9 1420 0.0468
 10 1425.9 0.0470
 11 1425.9 0.0470
 12 1420 0.0468
 13 1389.4 0.0458
 14 1410.6 0.0465
 15 1410.6 0.0465
 16 1374.1 0.0453
 17 1347 0.0444
 18 1341.1 0.0442
 19 1465.9 0.0483
 20 1502.4 0.0495
 21 1465.9 0.0483
 22 1371.7 0.0452
 23 1262.2 0.0416
 24 1183.3 0.0390

 15
Sustainable Energy Systems: Coursework, 2019
 Total demand in a year MWH 30,340 MWH

Based on this ratio shown in table 2.2-5 and the total demand calculated per each type of a typical day per
month the demand for each was hour was calculated by multiplying the ratio for each hour shown in table
2.2-5 by the total demand for each type of day for each month shown in table2.2- 4. Table 2.2-6 shows a
sample for a typical Sunday, Saturday and Weekday for the month of January.

 Table 2.2-6: Sample of the hourly generation for the three different type of days

 annual demand per Hour in
 Month MWH/Total demand per Hour of a year hour of day day Type day Load in MW
 year in MWH
 January 0.035 241 1 Friday weekday 2.63
 January 0.033 242 2 Friday weekday 2.54
 January 0.032 243 3 Friday weekday 2.41
 January 0.031 244 4 Friday weekday 2.37
 January 0.031 245 5 Friday weekday 2.37
 January 0.031 246 6 Friday weekday 2.37
 January 0.035 247 7 Friday weekday 2.86
 January 0.039 248 8 Friday weekday 3.26
 January 0.047 249 9 Friday weekday 3.87
 January 0.047 250 10 Friday weekday 3.89
 January 0.047 251 11 Friday weekday 3.89
 January 0.047 252 12 Friday weekday 3.87
 January 0.046 253 13 Friday weekday 3.79
 January 0.046 254 14 Friday weekday 3.85
 January 0.046 255 15 Friday weekday 3.85
 January 0.045 256 16 Friday weekday 3.75
 January 0.044 257 17 Friday weekday 3.67
 January 0.044 258 18 Friday weekday 3.66
 January 0.048 259 19 Friday weekday 4.00
 January 0.050 260 20 Friday weekday 4.10
 January 0.048 261 21 Friday weekday 4.00
 January 0.045 262 22 Friday weekday 3.74
 January 0.042 263 23 Friday weekday 3.44
 January 0.039 264 24 Friday weekday 3.23
 January 0.035 265 1 Saturday Saturday 2.63
 January 0.033 266 2 Saturday Saturday 2.54
 January 0.032 267 3 Saturday Saturday 2.41
 January 0.031 268 4 Saturday Saturday 2.37
 January 0.031 269 5 Saturday Saturday 2.37
 January 0.031 270 6 Saturday Saturday 2.37

 16
Sustainable Energy Systems: Coursework, 2019
 January 0.035 271 7 Saturday Saturday 2.55
 January 0.039 272 8 Saturday Saturday 2.90
 January 0.047 273 9 Saturday Saturday 3.45
 January 0.047 274 10 Saturday Saturday 3.46
 January 0.047 275 11 Saturday Saturday 3.46
 January 0.047 276 12 Saturday Saturday 3.45
 January 0.046 277 13 Saturday Saturday 3.37
 January 0.046 278 14 Saturday Saturday 3.42
 January 0.046 279 15 Saturday Saturday 3.42
 January 0.045 280 16 Saturday Saturday 3.33
 January 0.044 281 17 Saturday Saturday 3.27
 January 0.044 282 18 Saturday Saturday 3.25
 January 0.048 283 19 Saturday Saturday 3.56
 January 0.050 284 20 Saturday Saturday 3.65
 January 0.048 285 21 Saturday Saturday 3.56
 January 0.045 286 22 Saturday Saturday 3.33
 January 0.042 287 23 Saturday Saturday 3.06
 January 0.039 288 24 Saturday Saturday 2.87
 January 0.035 289 1 Sunday Sunday 2.63
 January 0.033 290 2 Sunday Sunday 2.54
 January 0.032 291 3 Sunday Sunday 2.41
 January 0.031 292 4 Sunday Sunday 2.37
 January 0.031 293 5 Sunday Sunday 2.37
 January 0.031 294 6 Sunday Sunday 2.37
 January 0.035 295 7 Sunday Sunday 2.46
 January 0.039 296 8 Sunday Sunday 2.80
 January 0.047 297 9 Sunday Sunday 3.33
 January 0.047 298 10 Sunday Sunday 3.34
 January 0.047 299 11 Sunday Sunday 3.34
 January 0.047 300 12 Sunday Sunday 3.33
 January 0.046 301 13 Sunday Sunday 3.26
 January 0.046 302 14 Sunday Sunday 3.31
 January 0.046 303 15 Sunday Sunday 3.31
 January 0.045 304 16 Sunday Sunday 3.22
 January 0.044 305 17 Sunday Sunday 3.16
 January 0.044 306 18 Sunday Sunday 3.14
 January 0.048 307 19 Sunday Sunday 3.44
 January 0.050 308 20 Sunday Sunday 3.52
 January 0.048 309 21 Sunday Sunday 3.44
 January 0.045 310 22 Sunday Sunday 3.22
 January 0.042 311 23 Sunday Sunday 2.96
 January 0.039 312 24 Sunday Sunday 2.77
 January 0.035 313 1 Monday weekday 2.63

 17
Sustainable Energy Systems: Coursework, 2019
 January 0.033 314 2 Monday weekday 2.54
 January 0.032 315 3 Monday weekday 2.41
 January 0.031 316 4 Monday weekday 2.37
 January 0.031 317 5 Monday weekday 2.37
 January 0.031 318 6 Monday weekday 2.37
 January 0.035 319 7 Monday weekday 2.86
 January 0.039 320 8 Monday weekday 3.26
 January 0.047 321 9 Monday weekday 3.87
 January 0.047 322 10 Monday weekday 3.89
 January 0.047 323 11 Monday weekday 3.89
 January 0.047 324 12 Monday weekday 3.87
 January 0.046 325 13 Monday weekday 3.79
 January 0.046 326 14 Monday weekday 3.85
 January 0.046 327 15 Monday weekday 3.85
 January 0.045 328 16 Monday weekday 3.75
 January 0.044 329 17 Monday weekday 3.67
 January 0.044 330 18 Monday weekday 3.66
 January 0.048 331 19 Monday weekday 4.00
 January 0.050 332 20 Monday weekday 4.10
 January 0.048 333 21 Monday weekday 4.00
 January 0.045 334 22 Monday weekday 3.74
 January 0.042 335 23 Monday weekday 3.44
 January 0.039 336 24 Monday weekday 3.23

 Results:
Based on the calculation methodology presented in section 2.2, the following figures were obtained as
follows, figure 2.3-1 shows the demand for a typical weekday of a month. Figure 2.3-2 shows the demand
for a typical Saturday and figure 2.2-3 shows the typical demand for a Sunday and Saturday. From these
figures, the results show the same trend as the original trend shown in figure 2.2-1. In addition, the total
demand for year based on the load profile calculation methodology was found to be 28,480.42 MWH
compared with the stated annual demand in the TAU annual report (Te Aponga Uira O Tumu TE Varovaro ,
2012 ) which is 28,869.90 MWh thus the variance between the two values is of 0.01. This is due to the
calculation’s estimations. However, this variance is of a small value and thus can be accepted.

 18
Sustainable Energy Systems: Coursework, 2019

 Weekday
 4.50
 4.00
 3.50
 3.00
 Load MW

 2.50
 2.00
 1.50
 1.00
 0.50
 -
 0 5 10 15 20 25 30
 Time of Day

 Figure 2.3-1: Demand for a typical weekday of a month

 Saturday
 4.00

 3.50

 3.00

 2.50

 2.00
 Load MW

 1.50

 1.00

 0.50

 -
 0 5 10 15 20 25 30
 Time of day

 Figure 2.3-2: Demand for a typical Saturday of a month

 19
Sustainable Energy Systems: Coursework, 2019

 Sunday and Holiday
 4.00
 3.50
 3.00
 2.50
 Load MW

 2.00
 1.50
 1.00
 0.50
 -
 0 5 10 15 20 25 30
 Time of Day

 Figure 2.3-3: Demand for a Typical Sunday and holiday of a month

Also figures 2.3-4 and 2.3-5 show the demand for a typical month of a year and the demand for a typical
year.

4.50 Load profile for the month of January
4.00

3.50

3.00

2.50

2.00

1.50

1.00

0.50
 Load MW

 -
 0 100 200 300 400 500 600 700 800
 Time of day

 Figure 2.3-4: Demand for a typical month of a year

 20
Sustainable Energy Systems: Coursework, 2019

 Rotatonga Load profile for a year
 4.50

 4.00

 3.50
 Load in MW

 3.00

 2.50

 2.00

 1.50
 0 1000 2000 3000 4000 5000 6000 7000 8000
 Time of day

 Demand projection and forecast:
Since the methodology of the calculation was based on the obtained curve of 2011, thus the demand needed
to be projected to the year of 2019. Additionally, since the duration of the project is estimated till 2040, the
demand needed to be forecasted till the year 2040. In order to reach these estimations, the following
methodology was adapted:

 1) Normal GDP data:
 First, data regarding the real GDP needed to be obtained. This data was obtained from cook’s islands
 annual national accounts tables (Ministry of fianance and economic managment, cooks isalnds ,
 2018 ). The GDP data is published from the year 2006 till 2017, as shown in table 2.4-1.
 Table 2.4-1: Gross Domestic Product at Constant 2016 Prices($million)

 2006 2007 2008 2009 2010 2011 2012 2013 2014 2015 2016 2017

 GDP at Constant 2016
 Prices 391.3 398.4 393.5 392.7 373.3 376.4 379.1 380.7 401.2 424.3 445.2 487.5

 2) Calculation of the GDP annual growth rate:
 Based on these data the annual growth rate of the GDP was calculated. Table 2.4-2 shows the values
 of this calculation.

 21
Sustainable Energy Systems: Coursework, 2019
 Table 2.4-2: annual Growth rate

 Real GDP
 Year GDP growth rate calculated from 2006 to 2017
 Million
 2006 391.30 -
 2007 398.40 1.81%
 2008 393.47 -1.24%
 2009 392.67 -0.20%
 2010 373.30 -4.93%
 2011 376.39 0.83%
 2012 379.06 0.71%
 2013 380.68 0.43%
 2014 401.23 5.40%
 2015 424.30 5.75%
 2016 445.15 4.91%
 2017 487.50 9.51%

 3) Forecasting GDP value and annual growth rate till 2040

 Based on table 2.4-2, the GDP value and the annual growth rate till 2040 could be calculated. This
 was done by taking the average of the annual growth rate form 2006 till 2017. This value is equal to
 2.09%. Based on this average annual growth rate the GDP value was calculated till the year 2040.

 4) Energy gains

 According to the report published by the international institute for energy conservation for the Asian
 development bank (International insitiute for energy conservastion , 2013), starting from the year
 2012 the cooks islands has implemented energy efficiency program to reduce energy use by
 836,271 KWH/ year.
 The implementation for this program has already proceeded as the streetlights have already been
 changed to more efficient bulbs. In addition, awareness sessions have been conducted to consumers.

 5) The total demand of cooks’ islands and Rarotonga:
 Based on (Division, Cook Islands Renewable Energy Chart Implementation Plan, 2012) the total
 demand for Cooks Islands is 33,833 MWH in 2011. Based on (Te Aponga Uira O Tumu TE
 Varovaro , 2012 ) the total demand for Rarotonga in 2011 was 28,828.00 MWH. Thus, the demand
 in Rarotonga represents 87% of the total cooks Islands demand.

 22
Sustainable Energy Systems: Coursework, 2019
 6) Demand forecast till 2040:
 Since the data related to the demand is available for 2011 and since the implementation of the energy
 saving program started in 2013, thus it was assumed that the demand for 2012 is same for that of
 2011.

 Based on the available data regarding the annual growth rate, energy saving % for each year and the
 demand of Cook’s islands in 2011 and that of Rarotonga in 2011, the demand till 2040 could be
 forecasted. This was done by multiplying the annual growth rate and the energy saving from the
 demand of each year to predict the next year starting from the year 2011. Table 2.4-3 shows the
 results of the final calculations.

 According to (Division, Cook Islands Renewable Energy Chart Implementation Plan, 2012), the air
 conditioner penetration has already reached a saturation in 2011. According, it can be inferred that
 there will not be a major in demand in future. In addition, to the current situation in Cooks’ islands
 were most of the young population are immigrating to New Zealand and Australia. Also, according
 to (UNICEF, 2013 ) the population growth rate till 2030 is estimated to be by 0.7%. This makes the
 total population of Rarotonga by 2040 to be 14,228.06 while it was 13, 500 in 2011. Thus, this
 makes the total increase of the population between 2040 and 2011 5%.

 Table 2.4-3: Demand forecast till 2040

 Cook Islands Demand forecast
 GDP growth rate Rarotonga demand based on
 based on 836,271 KWH/ year
 Year calculated from energy saving and GDP
 energy saving
 2006 to 2017 MWH
 and GDP

 2007 1.81%
 2008 -1.24%
 2009 -0.20%

 2010 -4.93%

 2011 0.83% 33,833.80 28,828.00

 2012 0.71% 33,833.80 28,828.00
 2013 0.43% 33,140.49 28,237.26
 2014 5.40% 34,108.82 29,062.33
 2015 5.75% 35,225.21 30,013.54
 2016 4.91% 36,083.55 30,744.89

 23
Sustainable Energy Systems: Coursework, 2019
 2017 9.51% 38,622.40 32,908.11
 2018 2.09% 38,473.02 32,780.84
 2019 2.09% 38,324.22 32,654.05
 2020 2.09% 38,176.00 32,527.75
 2021 2.09% 38,028.34 32,401.95
 2022 2.09% 37,881.26 32,276.63
 2023 2.09% 37,734.75 32,151.79
 2024 2.09% 37,588.80 32,027.44
 2025 2.09% 37,443.42 31,903.57
 2026 2.09% 37,298.60 31,780.17
 2027 2.09% 37,154.34 31,657.26
 2028 2.09% 37,010.64 31,534.82
 2029 2.09% 36,867.50 31,412.85
 2030 2.09% 36,724.91 31,291.36
 2031 2.09% 36,582.87 31,170.33
 2032 2.09% 36,441.38 31,049.78
 2033 2.09% 36,300.43 30,929.69
 2034 2.09% 36,160.03 30,810.06
 2035 2.09% 36,020.18 30,690.90
 2036 2.09% 35,880.86 30,572.19
 2037 2.09% 35,742.09 30,453.95
 2038 2.09% 35,603.85 30,336.16
 2039 2.09% 35,466.15 30,218.83
 2040 2.09% 35,328.97 30,101.96

 24
Sustainable Energy Systems: Coursework, 2019

 Chapter Three: Resource assessment
 Wind Resource Assessment (Ammar)
Assessing the wind resource for any specific area requires deep understanding of the area, its geography,
topology, environment, climate and resource of wind available to harness the energy. All these factors and
in addition to some more effects the total energy predicted to be generated by wind turbines. Starting with
the climate, temperature and humidity directly and air density indirectly effects the performance of turbines.

 Temperature
Temperature effects the production of electrical energy from wind turbines. If the temperature is higher
above than the technical limits of turbine, it cannot generate the required amount of energy even if we have
the wind resource available. So, it is important to analyse temperature of the region. The table below shows
the average temperature of island. It is evident that the temperature is quiet constant over the year and no
considerable variation can be seen among the hottest and the coldest months. The annual mean temperature
is calculated at 21.8 degrees Celsius.

 Temperature (C)
 30

 25
 Temperature (C)

 20

 15

 10

 5

 0

 Months

 Figure 3.1-1: Annual Mean Temperature

We can say that there is no division of seasons like summers and winters, but we can divide the weathers in
rainy and dry seasons.

3.1.2 Wind Speed
Before doing the investment in wind power plant, it is preferable to have on-ground measurements of
various metrological parameters including wind speed, direction, pressure, humidity, precipitation at
different heights. But at the initial stage to get an estimate of available resource, data available through
different remote sources like EMD ERA, MERRA2, or simulation data based on historical data. For the

 25
Sustainable Energy Systems: Coursework, 2019
analysis, we have used simulation data available for hourly resolution and satellite data by EMD ERA
available on 6-hourly resolution. A correlation was built for both data as shown in the graph below.

 Short term-Long term Comparison of Wind Speed
 12
 11
 10
 Wind Speed (m/s)

 9
 8
 7
 6
 5
 4
 3

 331
 1
 11
 21
 31
 41
 51
 61
 71
 81
 91
 101
 111
 121
 131
 141
 151
 161
 171
 181
 191
 201
 211
 221
 231
 241
 251
 261
 271
 281
 291
 301
 311
 321

 341
 351
 Months (From Jan '89 to Dec '18)
 LT WS ST WS

 Figure 3.1-2: Correlation of Wind Speed by Different Sources

From the above graph, we can see the trend of both lines are similar when data is available for both sources.
Based on the correlation, we can use our short-term wind data as long-term wind data and estimate the
energy yield from wind turbines.

Further analysis of wind speed shows the annual mean values of wind speed which are used for resource
assessment and energy yield estimations. Annual mean wind speed in 6.6m/s.

 Wind Speed at 80m
 10
 9
 Wind Speed (m/s)

 8
 7
 6
 5
 4
 3
 2

 Months

 Figure 3.1-3: Annual mean wind speed in m/s

 26
You can also read