TBCOV: Two Billion Multilingual COVID-19 Tweets with Sentiment, Entity, Geo, and Gender Labels
←
→
Page content transcription
If your browser does not render page correctly, please read the page content below
TBCOV: Two Billion Multilingual COVID-19 Tweets
                                        with Sentiment, Entity, Geo, and Gender Labels
                                        Muhammad Imran1 , Umair Qazi1 , and Ferda Ofli1
                                        1 Qatar   Computing Research Institute, Hamad Bin Khalifa University, Doha, 34110, Qatar
                                        * corresponding  author: Muhammad Imran (mimran@hbku.edu.qa)

                                        ABSTRACT

                                        The widespread usage of social networks during mass convergence events, such as health emergencies and disease outbreaks,
arXiv:2110.03664v1 [cs.SI] 4 Oct 2021

                                        provides instant access to citizen-generated data that carry rich information about public opinions, sentiments, urgent needs,
                                        and situational reports. Such information can help authorities understand the emergent situation and react accordingly.
                                        Moreover, social media plays a vital role in tackling misinformation and disinformation. This work presents TBCOV, a large-scale
                                        Twitter dataset comprising more than two billion multilingual tweets related to the COVID-19 pandemic collected worldwide
                                        over a continuous period of more than one year. More importantly, several state-of-the-art deep learning models are used to
                                        enrich the data with important attributes, including sentiment labels, named-entities (e.g., mentions of persons, organizations,
                                        locations), user types, and gender information. Last but not least, a geotagging method is proposed to assign country, state,
                                        county, and city information to tweets, enabling a myriad of data analysis tasks to understand real-world issues. Our sentiment
                                        and trend analyses reveal interesting insights and confirm TBCOV’s broad coverage of important topics.

                                        Background & Summary
                                        Social media use during emergencies such as natural or human-induced disasters has become prevalent among the masses1 .
                                        Twitter—a microblogging site—is increasingly used by affected people and humanitarian organizations to share and seek
                                        information, express opinions, and provide emotional support during disasters2, 3 . Prior studies show that Twitter also provides
                                        timely access to health-related data about chronic diseases, outbreaks, and epidemics4–6 . Hence, the number of Twitter
                                        datasets pertaining to the COVID-19 pandemic has been increasing constantly. The efficacy of these datasets for various
                                        types of analyses can be measured across three fundamental dimensions: Language, Space, and Time (LST). That is, datasets
                                        covering more languages, broader geographical areas, and longer temporal boundaries are preferred for both longitudinal and
                                        cross-sectional studies, especially during a global emergency such as the COVID-19 pandemic. Moreover, training robust
                                        machine learning (ML) and natural language processing (NLP) models as well as building predictive analytical tools require
                                        large-scale datasets for better inference and generalization. However, existing datasets vary in their LST coverage. Many
                                        of them are restricted to a single language, e.g., English7, 8 or Arabic9, 10 , or confined to specific geographies11, 12 . The data
                                        collection period also differs from one dataset to another. Among all, the dataset by Banda and colleagues stands out as one of
                                        the largest, long-running collections with 383 million tweets13 , however, only a handful of English keywords (only 10) were
                                        used for data collection—a common issue with existing datasets.
                                             To bridge these gaps, we present TBCOV, a large-scale Twitter dataset comprising Two Billion multilingual tweets related
                                        to the COVID-19 pandemic. Specifically, TBCOV offers 2,014,792,896 tweets collected using more than 800 multilingual
                                        keywords over a 14-month period from February 1st , 2020 till March 31st , 2021. These tweets span 67 international languages,
                                        posted by 87 million unique users across 218 countries worldwide. More importantly, covering public chatter on various
                                        societal, health, and economic issues caused by the pandemic, TBCOV captures different perspectives and opinions about
                                        governments’ policy decisions ranging from lock downs to aid allocation for individuals and businesses. It also contains
                                        several important implications of the pandemic such as food scarcity, shortage of equipment and supplies, reports of anxiety
                                        and depression symptoms, among others. Besides its broad topical and LST coverage, TBCOV is also enriched with several
                                        attributes derived from tweet text and meta-data using ML techniques. These attributes include sentiment labels, geolocation
                                        information, named-entities as well as user types and gender.
                                        Public sentiment: Distilling tweets to understand people’s opinions, emotions, and attitudes towards an issue (e.g., low
                                        vaccination rate) or a policy decision has paramount importance for various government entities14 . Uncertainties in authorities’
                                        perception of public sentiment during health crises can otherwise result in poor risk communication15 . Computational techniques
                                        such as sentiment analysis can help authorities to understand aggregated public opinion during crises and devise appropriate
                                        strategies16 . To this end, we employ a multilingual transformer-based deep learning model17 to tag each tweet in TBCOV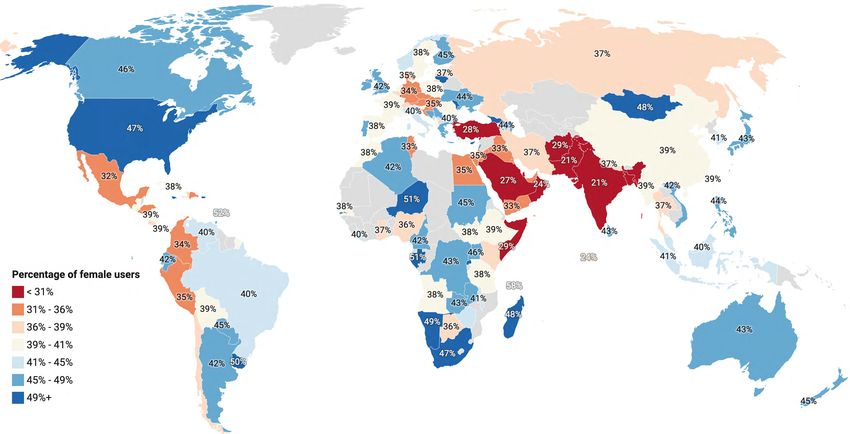
according to its sentiment polarity (i.e., positive, neutral, negative).
Geolocation information: Geotagging18 is indispensable for geographic information systems (GIS) for timely and effective
monitoring of outbreaks, hot-spot prediction, disease spread monitoring, and predictive risk mapping19, 20 . User-generated data
on social media platforms can fuel many of these applications5, 21 . However, low prevalence of geo-referenced information on
social media poses a challenge. To tackle this challenge, we propose a geolocation tagging approach to map each tweet in
TBCOV at country, state, county, or city level.
Named-entities: Mentions of persons, organizations, and locations hold key information in text documents and are crucial for
various NLP tasks such as question answering, online reputation management, and automatic text summarization22 . Named-
entity recognition (NER) is a widely used NLP technique to identify references to entities in text documents23 . Past studies
propose several NER techniques ranging from rule- and ML-based to hybrid methods24, 25 . To identify named-entities in
our multilingual tweets, we use language-specific NER models for the most prevalent five languages in TBCOV and one
multilingual NER model for all other languages.
User types & gender: Understanding gender differences is important for addressing societal challenges such as identifying
knowledge gaps26 , digital divide27 , and health-related issues28, 29 . Tweets in TBCOV are mainly sourced from three types of
users, i.e., individuals, organizations, and bots. We first distinguish the user type by running an NER model on the name field
in a Twitter profile, and then, determine the gender information using an ML classifier if the predicted user type is individuals.
    To the best of our knowledge, TBCOV is the largest Twitter dataset related to COVID-19 with broad LST coverage and rich
information derived from multilingual tweets that can be used for many NLP, data mining, and real-world applications. The
dataset is accessible at: https://crisisnlp.qcri.org/tbcov

Methods
This section summarizes data collection procedures and provides statistics about the dataset. Moreover, it elaborates on the
computational techniques employed to derive various attributes such as sentiment labels from tweets.

Data collection and description
Twitter offers different APIs for data collection. We use the Twitter Streaming API, which allows for collecting tweets based on
hashtags/keywords or geographical bounding boxes. Following the keyword-based strategy, we started our data collection on
February 1st , 2020 using trending hashtags such as #covid19, #coronavirus, #covid_19, and added new trending hashtags and
keywords in the later days. In total, more than 800 multilingual keywords and hashtags encompassing a large set of topics
including social distancing, shortages of masks, personal protective equipment (PPE), food, medicine, and reports of COVID-19
symptoms, deaths, were used. Table 1 lists some of the terms (full list of keywords is provided in the data release). Twitter
offers filtered streams for specific languages; however, we did not filter by any language, and hence, our data is multilingual.
Although the data collection was still running at the time of writing this manuscript, all the statistics and analyses presented in
this study are based on data collected till March 31st , 2021—i.e., 2,014,792,896 tweets. To the best of our knowledge, this is
the largest multilingual Twitter dataset covering a broad spectrum of topics and issues the world has been facing amidst the
COVID-19 pandemic.

 Argentina Coronavirus, Armenia Coronavirus, Australia Coronavirus, Austria Coronavirus, Azerbaijan Coronavirus, Bahamas Coronavirus, Bahrain
 Coronavirus, Bangladesh Coronavirus, Barbados Coronavirus, Belarus Coronavirus, Belgium Coronavirus, Belize Coronavirus, Benin Coronavirus, Bhutan
 Coronavirus, Bolivia Coronavirus, Bosnia Herzegovina Coronavirus, Botswana Coronavirus, Brazil Coronavirus, Brunei Coronavirus, Bulgaria
 Coronavirus, Burkina Coronavirus, Burundi Coronavirus, Cambodia Coronavirus, Cameroon Coronavirus, Canada Coronavirus, COVID-19, Congo
 COVID-19, Congo COVID-19, Costa Rica COVID-19, Croatia COVID-19, Cuba COVID-19, Cyprus COVID-19, Czech Republic COVID-19, Denmark
 COVID-19, Djibouti COVID-19, Dominica COVID-19, Dominican Republic COVID-19, East Timor COVID-19, Ecuador COVID-19, Egypt COVID-19,
 El Salvador COVID-19, Equatorial Guinea COVID-19, Eritrea COVID-19, Estonia COVID-19, Ethiopia COVID-19, Fiji COVID-19, Finland COVID-19,
 France COVID-19, Gabon COVID-19, Gambia COVID-19, Georgia COVID-19, Germany COVID-19, Ghana COVID-19, #socialdistancing us,
 #socialdistancing usa, #socialdistancing Alabama, #socialdistancing Alaska, #socialdistancing Arizona, #socialdistancing Arkansas, #socialdistancing
 California, #socialdistancing Colorado, #socialdistancing Connecticut, #socialdistancing Delaware, #socialdistancing Florida, #socialdistancing Georgia,
 #socialdistancing Hawaii, #socialdistancing Idaho, #socialdistancing Illinois, #socialdistancing Indiana, #socialdistancing Iowa, #socialdistancing Kansas,
 #socialdistancing Kentucky, #socialdistancing Louisiana, #socialdistancing Maine, #socialdistancing Maryland, #socialdistancing Massachusetts,
 #socialdistancing Michigan, económica, quédate en casa Colombia, respiradores Colombia, tapabocas Colombia, UCI disponibles, recuperados covid19
 Colombia, muertes Colombia, Nariño Coronavirus, Nariño Covid19, #coronavirus, #Corona, #COVID19, #WuhanCoronavirus, #ncoV2019, #coronavirus,
 Italia, lombardia, #covid19italia, #COVID19Pandemic, Covid, #CoronavirusAustralia, #pandemic, Covid-19 USA

                                    Table 1. A sample of keywords/hashtags used for data collection

   Figure 1 depicts the volume of tweets ingested across the 61 weeks of the data collection (February 1st , 2020 to March 31st ,
2021). The data does not show any gaps, which is an important factor for many types of analysis. The volume of tweets in the

                                                                                                                                                        2/20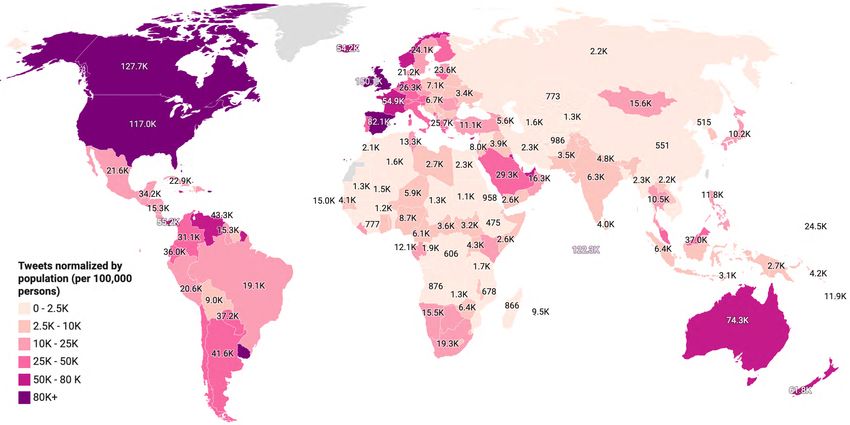
60.0M Maximum (65.2M)
50.0M Average (33.0M)
Minimum (5.2M)
40.0M Tweets (2.0B)
Tweets
30.0M
20.0M
10.0M
0.0
01 15 29 14 28 11 25 09 23 06 20 04 18 01 15 29 12 26 10 24 07 21 05 19 02 16 30 13 27 13 27
Feb Feb Feb Mar Mar Apr Apr May May Jun Jun Jul Jul Aug Aug Aug Sep Sep Oct Oct Nov Nov Dec Dec Jan Jan Jan Feb Feb Mar Mar
Figure 1. Weekly distribution of 2,014,792,896 tweets from February 1st , 2020 to March 31st , 2021.
first three weeks is relatively lower, e.g., ∼5 million daily tweets on average. However, a sudden surge can be noticed starting
from week four, which amounts to an overall average of 33 million tweets per week. The maximum number of tweets recorded
in a week is 65 million.
The tweets in TBCOV dataset are posted by 87,771,834 unique users and among them 268,642 are verified users. In total,
the dataset covers 67 international languages. Figure 2 shows the distribution of languages (with at least 10K tweets) and the
corresponding number of tweets in the log scale. The English language dominates with around 1 billion tweets and the second
and third largest languages are Spanish and Portuguese, respectively. There are around 55 million tweets for which the language
is undetermined—this is an important set of tweets suitable for the language detection task with code-mixing properties30 .
1,000,000,000
100,000,000
10,000,000
1,000,000
100,000
10,000
Polish
English
Hindi
Swedish
Welsh
Divehi
Arabic
Nepali
Czech
Sinhala
Punjabi
Spanish
Dutch
Russian
Haitian
Danish
Bangla
Odia
Pashto
Estonian
Persian
Slovenian
Basque
Chinese
Italian
Urdu
Amharic
Thai
Catalan
Serbian
Hebrew
Icelandic
Tamil
Korean
Greek
Finnish
Ukrainian
Latvian
Vietnames
Bulgarian
Kannada
Gujarati
Burmese
Norwegian
Turkish
Portugues
Romanian
Telugu
Japanese
Marathi
Malayalam
Lithuanian
Hungarian
French
German
Tagalog
Indonesian
Figure 2. Distribution of languages with more than 10K tweets. Number of tweets on y-axis (log-scale).
The TBCOV dataset is a substantial extension of our previous COVID-19 data release named GeoCoV1931 . The TBCOV
dataset is superior in many ways. First, the TBCOV dataset contains 1.4 billion more tweets than the GeoCoV19 dataset that
consists of 524 million tweets. Second, the data collection period of GeoCoV19 was restricted to only four months (Feb 2020
to May 2020), whereas the TBCOV coverage is 14 months (Feb 2020 to March 2021). The third and the most critical extension
represents several derived attributes that TBCOV offers, including sentiment labels, named-entities, user types, and gender
information. None of these attributes were part of the GeoCoV19 data. Furthermore, the geotagging method used in GeoCoV19
has been substantially improved and used in TBCOV, which yields better inference results.
Named-entity recognition
Named entities represent key elements in a text, including names of persons, organizations, locations, brands, and dates,
among others22 . Past studies demonstrate diverse applications of named entities on social media such as finding adverse
drug reactions32 and identifying temporal variations of locations, actors, and concepts from tweets about the Zika outbreak33 .
Moreover, such entities, especially in unstructured social media messages, elicit critical information about an event or a situation
along different dimensions—who, where, when, what—, i.e., people or organizations involved in a situation, their locations,
date or time of the event, their tasks, etc. Named-entity recognition (NER), i.e., the task of identifying and extracting named
entities, serves as the basis of many NLP tasks such as question answering, semantic annotation, information extraction, and
text summarization.
Several classical machine learning, and more recently deep learning, techniques have been proposed to perform NER on
standard web documents as well as social media data34 . NER techniques and models can be either language-specific (i.e.,
trained for a particular language) or multilingual (i.e., trained to operate on multiple languages). Language-specific models
usually outperform multilingual models. Hence, we use five language-specific, deep learning-based NER models targeting the
top five languages in our dataset, i.e., English, Spanish, Portuguese, French, and Italian, and a multilingual deep learning model
to cover the remaining 62 languages. The English NER model can recognize eighteen different types of entities, including
3/20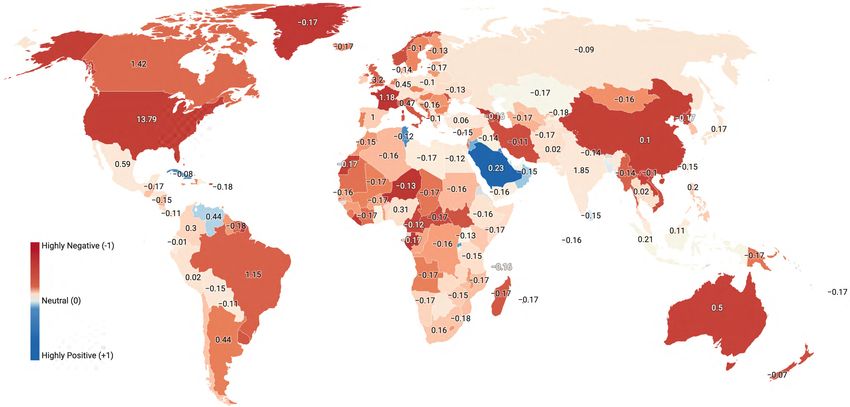
Language                 Person     Organization         Location     Miscellaneous
                      English (U)          14,796,271       18,887,285        2,930,148         10,798,850
                      English (A)         409,794,668      611,669,779      483,680,780      1,690,122,455
                      Spanish (U)           3,777,463        2,230,017        3,265,204         14,968,547
                      Spanish (A)          98,561,105       69,581,078      169,903,131        301,512,355
                      Portuguese (U)        1,439,192          932,504        1,006,396          2,845,321
                      Portuguese (A)       27,577,759       15,896,880       40,090,891         52,440,351
                      French (U)            1,374,884          804,336          719,896          3,894,968
                      French (A)           23,595,420       17,256,551       34,064,424         63,010,283
                      Total (U)            55,721,884       33,324,173       10,336,415         40,767,983
                      Total (A)           803,832,752      814,205,050      805,175,906      2,320,195,791

Table 2. Named-entities extraction results for the top four languages. ‘U’ denotes “unique occurrences” and ‘A’ denotes “all
occurrences” of entities.

persons, organizations, locations, language, product, time, money, etc. However, all other NER models can detect only the
three fundamental entity types, i.e., persons, organizations, and locations, in addition to a miscellaneous type representing
other entities. We introduced an additional entity, named covid19, to represent different COVID-19 related terms (N = 60),
including Coronavirus, SARS-CoV, SARS-COVID-19, Corona, Covid19, etc. All six models and their performance scores are
publicly available1 . Text of all two billion tweets was first preprocessed by removing URLs, usernames, emojis, and other
special characters, and then fed to one of the six NER models depending on the language attribute. Four NVIDIA Tesla P100
GPUs were used to process all the data. The entities recognition and extraction process resulted 4.7 billion entities from all
tweets. Table 2 shows the number of entities extracted of type person, organization, location, and misc (i.e., miscellaneous) for
the top four languages. The selected languages represent 38% of person, 68% of organization, and 76% of location out of all
the extracted entities. The remaining entities represent a long-tail distribution.

Geographic information
Geotagged social media messages with situational or actionable information have a profound impact on decision-making
processes during emergencies35, 36 . For example, recurring tweets showing face mask violations in a shopping mall or a park,
or on a beach, can potentially inform authorities’ decisions regarding stricter measures. Moreover, when governments’ official
helplines are overwhelmed37 , social media reports, e.g., shortages of essential equipment in a remote hospital or patients stuck
in traffic requiring urgent oxygen supply38 , could be life-saving if processed and geotagged timely and effectively. Furthermore,
GIS systems, which heavily rely on geotagged information, are critical for many real-world applications such as mobility
analysis, hot-spot prediction, and disease spread monitoring. Despite these advantages, social media messages are often not
geotagged, thus not suitable for automatic consumption and processing by GIS systems. However, they may still contain
toponyms or place names such as street, road, or city—information useful for geotagging.
Geotagging approach
This work geotags tweets using five meta-data attributes. Three of them, i.e., tweet text, user location, and user profile
description, are free-form text fields potentially containing toponym mentions. The tweet text attribute, which represents the
actual content of a tweet in 280 characters, can have multiple toponym mentions for various reasons. The user location is
an optional field that allows users to add location information such as their country, state, and city whereas the user profile
description field usually carries users’ demographic data39 . The latter two user-related attributes are potential sources for user
location inference40 . The remaining two attributes, i.e., geo-coordinates and place tags carry geo-information in a structured
form that is suitable for the direct consumption by the automatic GIS systems. The geo-coordinates field contains latitude and
longitude, which are directly obtained from the users’ GPS-enabled devices. However, many users refrain from enabling this
feature, thus only 1-2% of tweets contain exact coordinates41 . The place attribute carries a bounding box representing a location
tag that users optionally provide while posting tweets. Although geo-coordinates and place attributes suit GIS consumption, for
the sake of standardization with text-based attributes, we convert them to country, state, county, and city-level information
using a process known as “reverse geocoding” which is described next.
    The pseudo-codes of the proposed geotagging procedures are presented in Algorithms 1, 2, & 3. Two common processes
across three procedures are (i) geocoding and (ii) reverse geocoding. The geocoding process is used to obtain geo-coordinates
from a given place name (e.g., California) while the reverse geocoding process is used to retrieve the place name corresponding
  1 https://spacy.io/

                                                                                                                              4/20
Algorithm 1: Pseudo-code for processing toponyms from text
1 NER_models ← getNERModels(lang) // load all six NER models into a dictionary where the lang
parameter indicates languages, i.e., en, fr, es, pt, it, and ml
2 Function geoLocalizeText(input_text, lang):
3 Initialize address_ob jects[ ] // initializing address objects array to store Nominatim responses
4 Initialize entities[ ] // initializing entities array to store NER model responses
5 processed_text ← preprocessing(input_text) // remove URLs, emoticons, usernames, special characters
6 entities ← NER_models[lang].getEntities(processed_text)
7 for idx, entity in entities do
8 if entity = LOC or FAC or GPE then
9 address ← geocoding(entity) // nominatim server call
10 address_ob jects[idx] ← address
11 end
12 end
13 return address_ob jects
Algorithm 2: Pseudo-code for geotagging place object
1 Function geoLocalizePlace(place_ob ject):
2 if place_ob ject[“place_type00 ] = POI then
3 coordinates ← place_ob ject[“place00 ][“coordinates00 ]
4 address ← reverseGeocoding(coordinates) // Nominatim server call
5 else if place_ob ject[“place_type00 ] = city OR neighborhood OR admin OR country then
6 if place_ob ject[“ f ull_name00 ] is not None then
7 address ← geocoding(“ f ull_name00 ) // Nominatim server call
8 granularity_level = getLowestGranularity(place_ob ject[“place_type00 ])
9 if address[“country_name00 ]! = place_ob ject[“country_name00 ] AND granularity_level ! = “Country00
then
10 bounding_box ← place_ob ject[“place00 ][“coordinates00 ]
11 longitude, latitude ← getMid point(bounding_box) // Get the midpoint (latitude and
longitude) of the bounding box
12 address ← reverseGeocoding(longitude, latitude) // Nominatim server call
13 end
14 end
15 else if place_ob ject[“name00 ] is not None then
16 address ← geocoding(“name00 ) // Nominatim server call
17 granularity_level = getLowestGranularity(place_ob ject[“place_type00 ])
18 if address[“country_name00 ]! = place_ob ject[“country_name00 ] AND granularity_level ! = “Country00
then
19 bounding_box ← place_ob ject[“place00 ][“coordinates00 ]
20 longitude, latitude ← getMid point(bounding_box) // Get the midpoint (latitude and
longitude) of the bounding box
21 address ← reverseGeocoding(longitude, latitude) // Nominatim server call
22 end
23 end
24 return address
to a given geo-coordinates. Multiple geographical databases exist and support these two processes. We use the Nominatim
database2 , which is a search engine of OpenStreetMap3 . The official online Nominatim service restricts 60 calls/minute, and
hence, is not suitable for us to make billions of calls in a reasonable time period. Therefore, we set up a local installation of the
2 https://nominatim.org/
3 https://www.openstreetmap.org/
5/20Algorithm 3: Pseudo-code for the overall processing of all attributes
1 tweets[ ] ← load_tweets_batch()
2 for tweet in tweets do
3 if tweet[“coordinates”] is not None then
4 longitude, latitude ← tweet[“coordinates”][“coordinates”]
5 adrsGeo ← reverseGeocoding(longitude, latitude) // nominatim server call
6 end
7 if tweet[“place”] is not None then
8 adrsPlace ← geoLocalizePlace(tweet[“place”])
9 end
10 if tweet[“text”] is not None then
11 adrsText ← geoLocalizeText(tweet[“ f ull_text”])
12 end
13 if tweet[“user”][“location”] is not None then
14 processed_UserLoc ← preprocessing(tweet[“user”][“location”]) // remove URLs, emoticons,
usernames, special characters
15 adrsUserLoc ← geocoding(processed_UserLoc) // nominatim server call
16 end
17 if tweet[“user_pro f ile_description”] is not None then
18 adrsUserPro f ile ← geoLocalizeText(tweet[“user_pro f ile_description”])
19 end
20 return adrsGeo, adrsPlace, adrsText, adrsUserLoc, adrsUserPro f ile
21 end
Nominatim database. Both Nominatim calls (i.e., geocoding and reverse geocoding) return, among others, a dictionary object
named “address”, which depending on the location granularity, comprising several attributes such as country, state, county,
and city.
The procedure to process toponyms from text fields (except user location) is highlighted in Algorithm 1. The procedure
assumes that all six NER models are already loaded (line 1). After initializing the required arrays, preprocessing of the text (i.e.,
remove all URLs, usernames, emoticons, etc.) is performed (line 3). The lang attribute, which represents the language of a
tweet, determines the NER model to be applied on the processed text for entity extraction. Recall that five language-specific
and one multilingual NER models are used in this study. Since NER models return different types of entities, next we iterate
over all predicted entities (line 7) to retain the ones with the following types: LOC, FAC, or GPE (line 8). The LOC entity type
represents locations, mountain ranges, bodies of water; the FAC corresponds to buildings, airports, highways, bridges, etc., and
GPE represents countries, cities, and states. Finally, a geocoding call per entity is made and responses are stored (line 9 & 10).
Algorithm 2 outlines the procedure for processing the place attribute. The place_type attribute inside the place object helps
determine if a reverse or a simple geocoding call is required (lines 2 & 5). Places of type POI (Point-of-Interest) contain exact
latitude and longitude coordinates, and thus, suitable to perform reverse geocoding calls (line 4). However, non-POI places
(i.e., city, neighborhood, admin or country) are represented with a bounding box spanning a few hundred square feet (e.g., for
buildings) to thousands of square kilometers (e.g., for cities or countries). Moreover, large bounding boxes can potentially
cover multiple geographic areas, e.g., two neighboring countries, and hence, can be ambiguous to resolve. To tackle this issue,
we use full_name attribute to make geocoding calls (lines 7 & 16) and compare the country name of the obtained address with
that of the original place object (lines 9 & 18). In case countries do not match, as a last resort, a midpoint of the bounding box
is obtained (lines 11 & 20) to make reverse geocoding calls (lines 12 & 21).
Algorithm 3 outlines the pseudo-code of the overall geotagging process. It starts with loading a batch of tweets (line 1) and
iterating over them (line 2). Tweets with coordinates are used to make a reverse geocoding call (lines 3–5). For place tweets,
the geoLocalizePlace procedure is called, which is defined in Algorithm 2. And, for the two text-based attributes (i.e., text,
user profile description), the geoLocalizeText procedure is called, which is defined in Algorithm 1. However, the user location
attribute is pre-processed and geo-coded without applying the NER model (lines 13–15). The evaluation results of the proposed
geotagging approach are presented in the next section.
The geotagging approach identified 515,802,081 mentions of valid toponyms from tweet text and 180,508,901 from
user profile description. More importantly, out of all 1,284,668,011 users’ self-declared locations in the user location field,
1,132,595,646 (88%) were successfully geotagged . Moreover, the process yielded 2,799,378 and 51,061,938 locations for
6/20Location attribute Total occurrences Geotagged (yield %) Countries States Counties Cities
Geo coordinates 2,799,378 2,799,378 (100%) 211 1,912 9,037 8,079
Place 51,411,442 51,061,938 (99%) 215 1,906 13,343 9,932
User location 1,284,668,011 1,132,595,646 (88%) 218 2,511 24,806 20,648
User profile description 1,642,116,879 180,508,901 (11%) 218 2,485 18,588 14,600
Tweet text 2,014,792,896 515,802,081 (26%) 218 2,513 24,235 20,549
Table 3. Geotagging results for all five attributes with unique occurrences, geotagging yield, and resolved countries, states,
counties, and cities
United States Spain United Kingdom France Canada India Mexico Brazil Germany Australia New York London Washington Mexico City Chicago Toronto Atlanta New Delhi Mumbai Halifax
Feb-2020 Feb-2020
Mar-2020 Mar-2020
Apr-2020 Apr-2020
May-2020 May-2020
Jun-2020 Jun-2020
Jul-2020 Jul-2020
Aug-2020 Aug-2020
Sep-2020 Sep-2020
Oct-2020 Oct-2020
Nov-2020 Nov-2020
Dec-2020 Dec-2020
Jan-2021 Jan-2021
Feb-2021 Feb-2021
Mar-2021 Mar-2021
0% 25% 50% 75% 100% 0% 25% 50% 75% 100%
(a) Monthly proportion of tweets from top-10 countries (b) Monthly proportion of tweets from top-10 cities
Figure 3. Countries and cities distributions across months sorted by their overall tweets
geo-coordinates and place fields, respectively. Table 3 shows important geotagging results, including total occurrences,
geotagging yield, and resultant resolved locations granularity at country, state, county, and city level. To determine the country,
state, county, and city of a tweet, we mainly rely on three attributes. The first two attributes are users’ self-reported location
in the user location or user profile description fields. GPS coordinates are used (if available) in case a tweet is not resolved
through user location and user profile description fields. Altogether, >1.8 billion locations corresponding to 218 unique
countries, 2,518 sates, 26,605 counties, and 24,424 cities worldwide were resolved. The dataset contains 175 countries and 609
cities around the world having at least 100K tweets. Figure 3 depicts the monthly distribution of top 10 countries and cities
throughout the data collection period.
To allow meaningful comparisons of geotagged tweets across different countries, we normalize tweets from each country
by its population and calculate posts per 100,000 persons. For this purpose, geotagged tweets resolved through user location,
user profile description, and geo coordinates attributes were used. Figure 4 shows the normalized counts of geotagged tweets
for each country on a world map.
Sentiment classification
Understanding public opinion and sentiment is important for governments and authorities to maintain social stability during
health emergencies and disasters42, 43 . Prior studies highlighted social networks as a potential medium for analyzing public
sentiment and attitude towards a topic44 . Opinionated messages on social media can vary from reactions on a policy decision45
or expressions of sentiment about a situation46 to sharing opinions during sociopolitical events such as Arab Spring47 . Sentiment
analysis, which is a computational method to determine text polarity, is a growing field of research in the text mining and NLP
communities48 . There is a vast literature on the algorithms and techniques proposed for sentiment analysis—detailed surveys
can be found in49–51 . Moreover, numerous studies employ sentiment analysis techniques to comprehend public sentiment during
events ranging from elections, sports, to health emergencies46, 52 . We are interested in understanding the public sentiment
perceived from multilingual and multi-topic COVID-19 tweets from worldwide.
Our Twitter data is multilingual and covers dozens of real-world problems and incidents such as lockdowns, travel
bans, food shortages, among others. Thus, sentiment analysis models that focus on specific topics or domains and support
specific languages do not suit our purpose. The NLP community offers a myriad of multilingual architectures ranging from
LSTMs to more famous transformer-based models51 . Most recently, a transformer-based model called XLM-T has been
proposed as a multilingual variant of the XLM-R model53 by fine-tuning it on millions of Twitter general-purpose data in
eight languages17 . Although the original XLM-R model is trained on one hundred languages using more than two terabytes of
filtered CommonCrawl data4 , its Twitter variant XLM-T achieves better performance on a large multilingual benchmark for
sentiment analysis17 . We used the XLM-T model to obtain sentiment labels and confidence scores for all two billion tweets in
our dataset. Next, we highlight important distributions and present our brief analyses of the obtained sentiment labels.
4 https://commoncrawl.org/
7/20Figure 4. Geotagged tweets worldwide normalized by country’s population (per 100,000 persons). Tweets geotagged using
user location, user profile description, and GPS-coordinates are used.
Of all two billion tweets, 1,054,008,922 (52.31%) labeled as negative, 680,300,793 (33.77%) as neutral, and 280,483,181
(13.92%) as positive. Figure 5 presents weekly aggregation of sentiment labels for all tweets in all languages. As anticipated,
the negative sentiment dominates throughout (i.e., all 14 months) the data collection period. A significant surge of negative
sentiment is apparent in the beginning of March, peaking in April (first week), and then averaging down during the later months.
Several hills and valleys appear, but no weeks after April 2020 reaches as high as negative tweets surged in April. The neutral
sentiment worldwide stays always lower than the negative, but follows a similar pattern as in the case of the negative sentiment.
Not surprisingly though, the positive sentiment remains the lowest sentiment expressed in tweets with steady average except a
few weeks in April 2020.
Figure 6 shows countries’ aggregated sentiment on a world map. The sentiment scores for countries represent normalized
weighted averages based on the total number of tweets from a country and model’s confidence scores for positive, negative, and
neutral tweets. Equation 1 shows the computation of weighted average sentiment score for a country:
∑tic ∈{pos,neut} Θci − ∑tic ∈{neg} Θci
Sc = (1)
Nc
where tic represents the sentiment label of tweet i form country c while Θci indicates the model’s confidence score for tic , and Nc
corresponds to the total number of tweets from the country. The normalized scores range from -1 to 1, where -1 represents
high-negative and 1 high-positive, with zero being neutral. The model confidence score represents the model’s trust level
for assigning a sentiment class to a tweet and it ranges between 0 and 1. The numbers on top of each country are z-scores
computed using the representative sentiment tweets normalized by the total tweets from all countries. Overall, the map shows
overwhelming negative sentiment across all except a few countries. Surprisingly, Saudi Arabia and other Gulf countries,
including Qatar, UAE, Kuwait, show a strong positive sentiment. Rest of the world, including the US, Canada, and Australia,
show moderate to strong negative sentiment.
Figure 7 shows the weekly sentiment trends for the top-six countries (by total tweets in our data). Consistent to the
worldwide sentiment trends, the negative sentiment of all six countries dominates throughout. While a few countries (US, UK
and India) reach a couple million negative tweets for a few weeks, the other countries stay lower around half a million in the
remaining weeks.
In Figure 8, we provide additional information about the distribution, skewness through quartiles, and median for positive
and negative sentiments for the top-five countries. We notice that in most cases the earlier months of COVID-19 (i.e., February-
March 2020) show high variations in both positive and negative sentiments, except for UK and India, where the number of both
positive and negative sentiments are comparatively low with high level of agreement with each other. Surprisingly, the February
2020 data for both types of sentiments in the US and especially negative sentiment in other countries is highly positively skewed.
8/20Positive
30.0M Negative
Neutral
25.0M Avg. negative sentiment
20.0M Avg. positive sentiment
Avg. neutral sentiment
Tweets
15.0M
10.0M
5.0M
01 15 29 14 28 11 25 09 23 06 20 04 18 01 15 29 12 26 10 24 07 21 05 19 02 16 30 13 27 13 27
Feb Feb Feb Mar Mar Apr Apr May May Jun Jun Jul Jul Aug Aug Aug Sep Sep Oct Oct Nov Nov Dec Dec Jan Jan Jan Feb Feb Mar Mar
Figure 5. Weekly distribution representing public sentiment based on worldwide tweets in all languages.
Figure 6. Worldwide sentiment based on normalized classifier scores of the representative sentiment in each country.
Numbers on countries are z-scores computed using the representative sentiment tweets normalized by total tweets from all
countries.
Most countries seem to have less dispersion in April 2020 with quite high maximum range of any type of sentiment. These
interesting patterns can reveal many more hidden insights, which could help authorities gain situational awareness leading to
timely planning and actions.
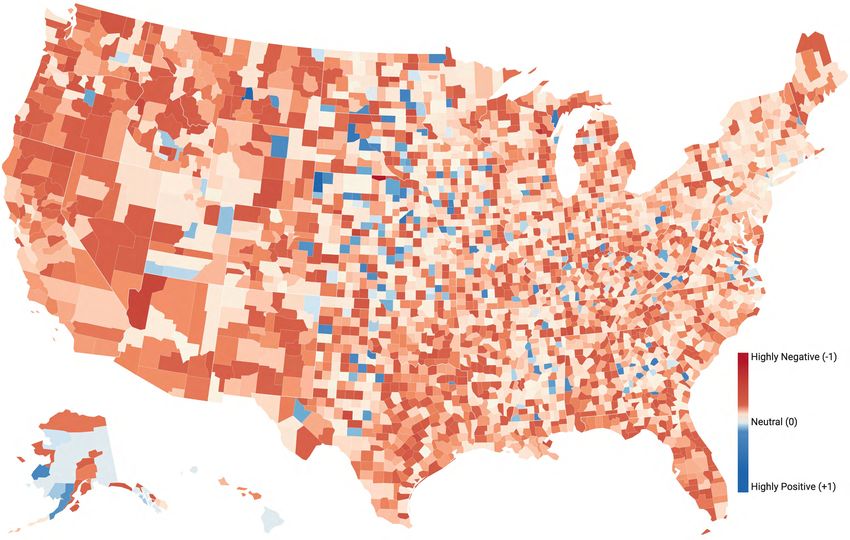
Figure 9 shows the distributions of sentiment scores across the US counties. Similar to the worldwide sentiment map, the
sentiment scores for counties are normalized by the total number of tweets from each county using the weighted average for
positive, negative, and neutral tweets. Overall, the negative sentiment dominates across different states and counties. While
most counties show strong to moderate negative sentiment, a strong positive sentiment can be observed for the Sioux County
in Nebraska, Ziebach County in South Dakota, Highland County in West Virginia, and Golden Valley County in Montana.
California is mostly on the negative side whereas New York appears near neutral or on the negative side. Texas seems to
represent all ends of the spectrum—covering moderate-to-strong negative as well as some positive sentiment. Florida and
Washington are all negative. Overall, the western region is mostly negative, the Midwest is fairly divided but strong in whatever
sentiment it exhibits, the Northeast region shows less negative intensity (more towards neutral), and the Southern region shows
some counties with positive sentiment, but the majority is either negative or neutral.
Figure 10 presents the distributions of sentiment labels for four languages. Interestingly, the Arabic language shows the
domination of the positive sentiment throughout the 14 months except February 2020 and a few weeks in the middle. For the
other three languages, the negative sentiment surpasses the other two sentiment classes. While all show peaks in and around
April and May 2020, the surge of the negative sentiment in February and March 2021 in the case of Portuguese is noticeable
9/207.0M 1.8M Positive Avg. negative sentiment
6.0M 1.5M Negative Avg. positive sentiment
5.0M 1.2M Neutral Avg. neutral sentiment
Tweets
4.0M
Tweets
1.0M
3.0M 750.0K
2.0M 500.0K
1.0M 250.0K
01 15 29 14 28 11 25 09 23 06 20 04 18 01 15 29 12 26 10 24 07 21 05 19 02 16 30 13 27 13 27 01 15 29 14 28 11 25 09 23 06 20 04 18 01 15 29 12 26 10 24 07 21 05 19 02 16 30 13 27 13 27
Feb Feb Feb Mar Mar Apr Apr May May Jun Jun Jul Jul Aug Aug Aug Sep Sep Oct Oct Nov Nov Dec Dec Jan Jan Jan Feb Feb Mar Mar Feb Feb Feb Mar Mar Apr Apr May May Jun Jun Jul Jul Aug Aug Aug Sep Sep Oct Oct Nov Nov Dec Dec Jan Jan Jan Feb Feb Mar Mar
(a) United States (b) United Kingdom
2.0M
700.0K
1.8M
1.5M 600.0K
1.2M 500.0K
Tweets
Tweets
1.0M 400.0K
750.0K 300.0K
500.0K 200.0K
250.0K 100.0K
01 15 29 14 28 11 25 09 23 06 20 04 18 01 15 29 12 26 10 24 07 21 05 19 02 16 30 13 27 13 27 01 15 29 14 28 11 25 09 23 06 20 04 18 01 15 29 12 26 10 24 07 21 05 19 02 16 30 13 27 13 27
Feb Feb Feb Mar Mar Apr Apr May May Jun Jun Jul Jul Aug Aug Aug Sep Sep Oct Oct Nov Nov Dec Dec Jan Jan Jan Feb Feb Mar Mar Feb Feb Feb Mar Mar Apr Apr May May Jun Jun Jul Jul Aug Aug Aug Sep Sep Oct Oct Nov Nov Dec Dec Jan Jan Jan Feb Feb Mar Mar
(c) India (d) Canada
800.0K
700.0K
700.0K
600.0K
600.0K
500.0K 500.0K
Tweets
Tweets
400.0K 400.0K
300.0K 300.0K
200.0K 200.0K
100.0K 100.0K
01 15 29 14 28 11 25 09 23 06 20 04 18 01 15 29 12 26 10 24 07 21 05 19 02 16 30 13 27 13 27 01 15 29 14 28 11 25 09 23 06 20 04 18 01 15 29 12 26 10 24 07 21 05 19 02 16 30 13 27 13 27
Feb Feb Feb Mar Mar Apr Apr May May Jun Jun Jul Jul Aug Aug Aug Sep Sep Oct Oct Nov Nov Dec Dec Jan Jan Jan Feb Feb Mar Mar Feb Feb Feb Mar Mar Apr Apr May May Jun Jun Jul Jul Aug Aug Aug Sep Sep Oct Oct Nov Nov Dec Dec Jan Jan Jan Feb Feb Mar Mar
(e) Brazil (f) Spain
Figure 7. Weekly distribution of sentiment labels for the top six countries
and requires further investigation.
User type and gender classification
Twitter has 186 million daily active users with 70.4% male and 29.7% female users54 . Twitter users represent, among others,
businesses, government agencies, NGOs, bots, and—most importantly—the general public55, 56 . Information about user types
is helpful for many application areas, including customer segmentation and engagement57 , making recommendations58 , users
profiling for content filtering59 , and more. Moreover, users demographic information such as gender is important for addressing
societal challenges such as identifying knowledge gaps26 , health inequities28 , digital divide27 , and other health-related issues29 .
The tweets in TBCOV are from 87.7 million unique users worldwide, which is 47% of the daily active users on Twitter. Our
aim is to determine accounts which belong to the general public, hereinafter personal accounts, and their gender. However,
Twitter neither provides account types nor their gender information. To this end, we observed that user-provided names in
personal accounts can potentially be used to not only distinguish them from other types such as organizational accounts, their
morphological pattern are indicative of gender as well60, 61 . For example, the username “Capital Press” is a media account
whereas the username “Laura Sanchez” is a personal account that likely belongs to a female.
First, we determine users’ type (i.e., personal, organizations, etc.) by applying the English NER model (described
previously) on user-provided names. Usernames are preprocessed (i.e., remove URLs, numerals, emojis, tabs spaces, newlines)
prior to feeding the model, which assigns one of the eighteen entity types to a username, including person. Entity types
of all 87.7 million usernames are obtained according to which there are 46,504,838 (52.98%) person, 11,909,855 (13.57%)
organization, and 29,357,141 (33.45%) miscellaneous user types. More importantly, nearly half (48%) of the tweets in the
dataset are posted by personal accounts, 11% by organizational, and 40% by other user types.
Next, we sought to further disaggregate the identified personal accounts (i.e., 46,504,838) by their gender. Prior studies
demonstrate that morphological features of a person’s given name (also known as a first name or forename) provide gender
cues, such as voiced phonemes are associated with male names and unvoiced phonemes are associated with female names61 .
Hence, the first names of the identified personal accounts are employed for training supervised machine learning classifiers.
Several publicly available name-gender resources were used62–64 as our training datasets. Names in these datasets are written
using the English alphabets. We combined the datasets and removed duplicates. This process yielded 121,335 unique names
with a distribution of female and male as 73,314 (60%) and 48,021 (40%), respectively.
Prior to training classifiers, data was split into train and test sets with a 80:20 ratio, respectively, and phonetic features from
first names are extracted by moving a variable-sized window over them in two directions (i.e., left-to-right and the opposite).
10/207,000,000 800,000
1,750,000
6,000,000 700,000
1,500,000
600,000
1,250,000 5,000,000
500,000
Tweets
Tweets
Tweets
1,000,000 4,000,000
400,000
750,000 3,000,000 300,000
500,000 2,000,000 200,000
250,000 1,000,000 100,000
-20 r-20 r-20 -20 -20 l-20 -20 -20 t-20 -20 -20 -21 -21 r-21 -20 r-20 r-20 -20 -20 l-20 -20 -20 t-20 -20 -20 -21 -21 r-21 -20 r-20 r-20 -20 -20 l-20 -20 -20 t-20 -20 -20 -21 -21 r-21
Feb Ma Ap May Jun Ju Aug Sep Oc Nov Dec Jan Feb Ma Feb Ma Ap May Jun Ju Aug Sep Oc Nov Dec Jan Feb Ma Feb Ma Ap May Jun Ju Aug Sep Oc Nov Dec Jan Feb Ma
Months Months Months
(a) United States positive sentiment (b) United States negative sentiment (c) United Kingdom positive sentiment
1,750,000 2,000,000
800,000 1,750,000
1,500,000
1,500,000
1,250,000 600,000
1,250,000
Tweets
Tweets
Tweets
1,000,000
400,000 1,000,000
750,000 750,000
500,000 500,000
200,000
250,000 250,000
-20 r-20 r-20 -20 -20 l-20 -20 -20 t-20 -20 -20 -21 -21 r-21 -20 r-20 r-20 -20 -20 l-20 -20 -20 t-20 -20 -20 -21 -21 r-21 -20 r-20 r-20 -20 -20 l-20 -20 -20 t-20 -20 -20 -21 -21 r-21
Feb Ma Ap May Jun Ju Aug Sep Oc Nov Dec Jan Feb Ma Feb Ma Ap May Jun Ju Aug Sep Oc Nov Dec Jan Feb Ma Feb Ma Ap May Jun Ju Aug Sep Oc Nov Dec Jan Feb Ma
Months Months Months
(d) United Kingdom negative sentiment (e) India positive sentiment (f) India negative sentiment
700,000 120,000
250,000 100,000
600,000
200,000 500,000 80,000
Tweets
Tweets
Tweets
150,000 400,000 60,000
300,000
100,000 40,000
200,000
50,000 100,000 20,000
-20 r-20 r-20 -20 -20 l-20 -20 -20 t-20 -20 -20 -21 -21 r-21 -20 r-20 r-20 -20 -20 l-20 -20 -20 t-20 -20 -20 -21 -21 r-21 -20 r-20 r-20 -20 -20 l-20 -20 -20 t-20 -20 -20 -21 -21 r-21
Feb Ma Ap May Jun Ju Aug Sep Oc Nov Dec Jan Feb Ma Feb Ma Ap May Jun Ju Aug Sep Oc Nov Dec Jan Feb Ma Feb Ma Ap May Jun Ju Aug Sep Oc Nov Dec Jan Feb Ma
Months Months Months
(g) Canada positive sentiment (h) Canada negative sentiment (i) Brazil positive sentiment
800,000
700,000
600,000
500,000
Tweets
400,000
300,000
200,000
100,000
-20 r-20 r-20 -20 -20 l-20 -20 -20 t-20 -20 -20 -21 -21 r-21
Feb Ma Ap May Jun Ju Aug Sep Oc Nov Dec Jan Feb Ma
Months
(j) Brazil negative sentiment
Figure 8. Monthly distribution summary of positive and negative sentiment tweets for the top five countries
The window of length one moves from its starting point (i.e., either the first or the last character of a name). Subsequent moves
increases window size by one until a threshold value reached. The threshold limits the number of features required in one
direction, which we empirically learned by experimenting several values ranging from 1-to-7 (i.e., 7 is the average length
of names in our dataset). Fewer than four features (in one direction) negatively impact classifiers’ performance, whereas,
larger values yield diminishing effect. Thus, a threshold of four is set, i.e., representing the first four and last four features of a
name. For example, given a name “Michael”, the feature extraction method extracts eight features, four from the start (i.e.,
‘m’, ‘mi’, ‘mic’, ‘mich’) and four from the last (i.e., ‘l’, ‘el’, ‘ael’, ‘hael’). The extracted features are then encoded with their
corresponding positions in names, e.g., the ‘mic’ feature in the earlier example caries its position i.e., first-three-letters. The
extracted positional features are then used to train several well-known machine learning classifiers, including Naive Bayes65 ,
Decision Trees66 , and Random Forests67 . The Random Forests algorithm yields better performance, and thus, used to process
all 87.7 million names. The evaluation of gender classification model is presented in the next section.
The gender classification process identified 19,598,252 (72.84%) female and 26,906,586 (57.86%) male users. Although
the proportion of female users is higher than the male users, the number of tweets posted by the male users is 15% more than
the female users. Specifically, of all 963,681,513 tweets from personal accounts, 558,259,178 (57.93%) are from male and
405,422,335 (42.07%) from female users. We further determine female to male ratios for each country. To choose countries for
computing female to male ratios, we estimated the required sample size for each country. We set our confidence interval at
95% and margin of error to ≤1%. Countries with users (any gender) less than the required sample size are dropped (N = 78).
Figure 11 shows the percentage of female users for countries meeting the representativeness criteria.
11/20Figure 9. Sentiment across US counties. Tweets geotagged using user location, user profile description, and GPS-coordinates
are used after normalizing by the total number tweets from each county.
4.0M Positive Negative Neutral
3.0M
Spanish
2.0M
1.0M
1.5M
1.2M
Portuguese
1.0M
750.0K
500.0K
250.0K
1.5M
1.2M
1.0M
French
750.0K
500.0K
250.0K
500.0K
400.0K
300.0K
Arabic
200.0K
100.0K
01 15 29 14 28 11 25 09 23 06 20 04 18 01 15 29 12 26 10 24 07 21 05 19 02 16 30 13 27 13 27
Feb Feb Feb Mar Mar Apr Apr May May Jun Jun Jul Jul Aug Aug Aug Sep Sep Oct Oct Nov Nov Dec Dec Jan Jan Jan Feb Feb Mar Mar
Figure 10. Weekly distribution of sentiment labels of tweets in four languages (Spanish, Portuguese, French, and Arabic).
Global digital divide
Next, we sought to determine global digital divide by relying on users access to different types of devices used for tweeting.
Out of all more than two billion tweets, we extracted 1,003 unique application types (provided by Twitter) supporting the
tweet posting feature. Dozens of applications support tweeting feature, including both web-, and mobile-based apps. We
manually analyzed all the applications to determine the operating system they are built for (e.g., iOS, Android). Next, based on
the operation system information, we categorized each application into one of the three device types i.e., (i) Apple device—
12/20Figure 11. Percentage of female users for countries meeting representative sampling criteria (confidence interval=95%;
margin of error≤ 1%). Gray color indicates the countries excluded due to under representation (N = 85).
Figure 12. Global digital divide estimated through the type of device used for tweeting. Representative device type
penetration (percentage) is shown on top of each country.
representing all iOS devices such as iPhone, iPad, etc., (ii) Android—representing all types of Android-based devices, and (iii)
Web—representing all the web-based applications for tweeting. Finally, an aggregation is performed on device types for each
county and the most frequent device is selected.
Figure 12 shows the most frequently used device type in each country. The map shows a device type for 217 countries
13/20worldwide. Of all, the Android is the most used device type with N = 103 (48%), Apple with N = 97 (45%), and Web is the
least used with N = 17 (7%). As Apple devices are more expensive than Android, we expect to see Apple’s domination in rich
countries. This assumption stands true except a couple of countries, including Niger and Senegal, among others.
Trends Analysis
The impact of the COVID-19 pandemic on people’s livelihoods, health, families, businesses, and employment is devastating.
To determine whether TBCOV covers information about such unprecedented challenges, next we perform trend analysis of
six important issues. The first two issues are directly related to people’s health, i.e., (i) tweets about anxiety and depression,
and (ii) self-declared COVID-19 symptoms. Next two issues represent severe consequences of COVID-19 that millions of
families worldwide directly faced, i.e., (iii) deaths of family members and relatives, and (iv) food shortages. The last two issues
are about people’s social life and preventive measures, i.e., (v) face mask usage in public areas as well as shortages, and (vi)
willingness to take or already taken vaccine.
For each issue, a set of related terms are curated to form logical expressions. For instance, in the case of the “COVID19
symptoms” issue, we divide it into five sub-groups representing different COVID-19 symptoms listed on the CDC website5 ,
which can also be seen below in Table 4. Several related terms were added to each sub-group to increase the recall. For example,
for COVID deaths of parents, the “parents” group contains two sets of terms: (i) “father OR mother OR dad OR mom”, and (ii)
“deceased OR succumbed OR perished OR lost battle OR killed OR my * passed OR my * died”6 . The logical operator ‘AND’
between these two sets forms the final expression used to retrieve weekly tweets. The full list of terms will be released with the
dataset.
Topics representing different issues Sub-topics related to the main topic
COVID-19 symptoms Fever, cough, shortness of breath, headache, loss of taste and smell
COVID deaths mentions Parents, siblings, grandparents, relatives, and close connections
Food shortages Food availability, food access, food adequacy, and food acceptability
Anxiety & depression Anger, sleepless, fearful, upset, restless, and anxious
Mask usage & importance Mask violation, masks are important, wear masks, masks save lives, masks useless
Willingness to take/taken vaccine Reactions to vaccine, harmful vaccine, got vaccine, covid jab taken, will take vaccine
Table 4. Term groups of four topics for trend analysis
Figure 13 depicts weekly distributions (in log scale) of the retrieved tweets. Figure 13(a) shows sub-groups of the COVID-19
symptoms category. The two most reported symptoms in tweets are fever and cough followed by the shortness of breath and
headache. Interestingly, reports of loss of taste and smell are almost zero until the end of February 2020, which then suddenly
spike from March 8th onward. Figure 13(b) shows trends of different groups for the anxiety and depression topic. The feelings
of sadness and hopelessness seem to dominate throughout the year followed by anger, outburst, and frustration. Surprisingly,
the expressions with suicidal thoughts are captured in the data, as well. These particular trends need an in-depth investigation to
better understand motives behind such extreme thoughts for authorities to intervene and offer counseling.
The weekly trends representing two important and direct consequences of COVID-19 on the general public are shown
in Figure 13(c & d), i.e., tweets mentioning death of parents, siblings, relatives or close connections; and food insecurity in
terms of its availability, accessibility, adequacy, and acceptability. A large number of tweets reporting deaths is observed with
majority about parents. Grandparents and the category representing uncle and aunt are significant as well. Overall, elderly
death reports are significantly higher than younger population.
Similarly, TBCOV shows coverage of the food insecurity topics (i.e., Figure 13(d). Food availability dominates over food
accessibility and adequacy in most weeks. However, food acceptability, other than a few spikes in February and May 2020,
remains less of a concern for the public, thus not discussed on Twitter. Food shortage was one of the critical issues faced by
many countries around the world. This Twitter data might help detect hot-spots with severe food shortages ultimately helping
authorities focus on most vulnerable areas.
Figure 13(e & f) shows trends for mask usage and shortage as well as vaccination. The “Importance of mask” category,
which includes mask usage, importance of mask, etc., leads the discussion throughout. The mask shortage category spikes in
the early months of 2020 and then averages out. Mask violations seem to surge in May and November 2020 and for the rest it
stays steady. Mask shortage tweets worth further analysis to find out areas with severe shortages. The discussion on vaccines is
comparatively lower than all other topics. However, the category on willingness to take or already taken vaccine is hopeful and
spiked for the most months, in particular, late 2020 and early 2021.
5 https://www.cdc.gov/coronavirus/2019-ncov/symptoms-testing/symptoms.html
6 Asterisk (*) allows one term from set (i) to appear in between
14/20106
104
105
Tweets (log scale)
Tweets (log scale)
104 103
103 102
Fever|chills|high temp
102 Cough|coughing Angry, outbursts, frustration
Shortness of breath 101 Feelings of sadness, emptiness or hopelessness
101 Headache Anxiety, agitation or restlessness
Taste|smell loss Thoughts of death, suicidal, suicide attempts
100 100
-20 -20 -20 -20 -20 -20 20 20 20 20 20 20 20 20 20 20 20 20 20 20 20 20 20 20 21 21 -21 -21 -21 -21 -20 -20 -20 -20 -20 -20 20 20 20 20 20 20 20 20 20 20 20 20 20 20 20 20 20 20 21 21 -21 -21 -21 -21
-09 -23 -08 -22 -05 -19 -03- -17- -31- -14- -28- 12- 26- -09- -23- -06- -20- -04- -18- -01- -15- -29- -13- -27- -10- -24- -07 -21 -07 -21 -09 -23 -08 -22 -05 -19 -03- -17- -31- -14- -28- 12- 26- -09- -23- -06- -20- -04- -18- -01- -15- -29- -13- -27- -10- -24- -07 -21 -07 -21
Feb Feb Mar Mar Apr Apr May May May Jun Jun Jul- Jul- Aug Aug Sep Sep Oct Oct Nov Nov Nov Dec Dec Jan Jan Feb Feb Mar Mar Feb Feb Mar Mar Apr Apr May May May Jun Jun Jul- Jul- Aug Aug Sep Sep Oct Oct Nov Nov Nov Dec Dec Jan Jan Feb Feb Mar Mar
(a) COVID-19 symptoms (b) Anxiety, anger, sadness
105
104 104
Tweets (log scale)
Tweets (log scale)
103
Father|mother|mom|dad 103
102 Brother|sister|bro|sis Food accessibility
Uncle|aunt|cousin|relative Food availability
Grand- mother|father|ma|pa Food adequacy
101 Colleague|friend|neighbour 102 Food acceptability
-20 -20 -20 -20 -20 -20 20 20 20 20 20 20 20 20 20 20 20 20 20 20 20 20 20 20 21 21 -21 -21 -21 -21 -20 -20 -20 -20 -20 -20 20 20 20 20 20 20 20 20 20 20 20 20 20 20 20 20 20 20 21 21 -21 -21 -21 -21
-09 -23 -08 -22 -05 -19 -03- -17- -31- -14- -28- 12- 26- -09- -23- -06- -20- -04- -18- -01- -15- -29- -13- -27- -10- -24- -07 -21 -07 -21 -09 -23 -08 -22 -05 -19 -03- -17- -31- -14- -28- 12- 26- -09- -23- -06- -20- -04- -18- -01- -15- -29- -13- -27- -10- -24- -07 -21 -07 -21
Feb Feb Mar Mar Apr Apr May May May Jun Jun Jul- Jul- Aug Aug Sep Sep Oct Oct Nov Nov Nov Dec Dec Jan Jan Feb Feb Mar Mar Feb Feb Mar Mar Apr Apr May May May Jun Jun Jul- Jul- Aug Aug Sep Sep Oct Oct Nov Nov Nov Dec Dec Jan Jan Feb Feb Mar Mar
(c) Parents, siblings, relatives deaths (d) Food insecurity and shortages
105 Shortage of masks Shortage of vaccine
Importance of masks 104 Vaccine skepticism
104 Mask violations Willing/taken vaccine
Tweets (log scale)
Tweets (log scale)
Mask spekticism 103
103
102
102
101 101
100 100
-20 -20 -20 -20 -20 -20 20 20 20 20 20 20 20 20 20 20 20 20 20 20 20 20 20 20 21 21 -21 -21 -21 -21 -20 -20 -20 -20 -20 -20 20 20 20 20 20 20 20 20 20 20 20 20 20 20 20 20 20 20 21 21 -21 -21 -21 -21
-09 -23 -08 -22 -05 -19 -03- -17- -31- -14- -28- 12- 26- -09- -23- -06- -20- -04- -18- -01- -15- -29- -13- -27- -10- -24- -07 -21 -07 -21 -09 -23 -08 -22 -05 -19 -03- -17- -31- -14- -28- 12- 26- -09- -23- -06- -20- -04- -18- -01- -15- -29- -13- -27- -10- -24- -07 -21 -07 -21
Feb Feb Mar Mar Apr Apr May May May Jun Jun Jul- Jul- Aug Aug Sep Sep Oct Oct Nov Nov Nov Dec Dec Jan Jan Feb Feb Mar Mar Feb Feb Mar Mar Apr Apr May May May Jun Jun Jul- Jul- Aug Aug Sep Sep Oct Oct Nov Nov Nov Dec Dec Jan Jan Feb Feb Mar Mar
(e) Mask usage & shortages & importance (f) Willingness to take or taken vaccine
Figure 13. Weekly trends of important issues related to personal and social lives of users linked to COVID-19
Data Records
The TBCOV dataset is shared through the CrisisNLP repository7 . The dataset contains three types of releases covering different
dimensions of the data. Specifically, we offer a base release including a comprehensive set of attributes such as tweet ids, user
ids, sentiment labels, named-entities, geotagging results, user types, and gender labels, among others. The base release contains
tab-separated values (TSV) files representing the data collection months (i.e., February 1st , 2020 to March 31st , 2021). In
addition to the base data, we offer two additional releases consisting of tweet ids for the top 20 languages and top ten countries.
The purpose of id-based releases is to maximize data accessibility for data analysts targeting one or few languages or counties
for their analyses. Additional releases will be provided based on end-user demands. We make the dataset publicly available for
research and non-profit uses. Adhering to Twitter data redistribution policies, we cannot share full tweet content.
Technical Validation
Validation of geotagging approach
To evaluate the proposed geotagging method we first obtain ground-truth data for different attributes. Geotagged tweets with
GPS coordinates, i.e., latitude and longitude, were used as ground truth for the evaluation of the place field. Specifically, tweets
with (i) geo-coordinates and (ii) place fields are sampled and their location granularities such as country, state, county, and city
were obtained. Finally, we compute the precision metric, i.e., the ratio of correctly predicted location granularity to the total
predicted outcomes (i.e., sum of true positives and false positives). Table 5 shows the evaluation results along with the number
of sampled tweets (in parenthesis). All location granularity scores, except county, are promising.
The evaluation of the user location geotagging method is performed on a manually annotated8 random sample of 500 user
locations. Specifically, each user location string was examined to determine its corresponding country, state, county, and city.
Google search, Wikipedia and other sources were allowed to search and disambiguate in case multiple candidates emerge.
Location strings such as “Planet earth”, were annotated as “NA” and used in the evaluation procedure (i.e., the system’s output
for an “NA” case is considered True Positive if blank and False Positive otherwise). Table 6 shows the evaluation results in
terms of precision, recall, and F1-score. Overall, the F1-scores for all location granularities are high. However, fine-grained
location resolution poses more challenges for the method (e.g., the recall at the city level is 0.656 compared to the recall of 1.0
at the country level).
7 https://crisisnlp.qcri.org/tbcov
8 The authors of this paper performed the manual annotation.
15/20You can also read