Temperature, moisture and freeze-thaw controls on CO2 production in soil incubations from northern peatlands
←
→
Page content transcription
If your browser does not render page correctly, please read the page content below
www.nature.com/scientificreports
OPEN Temperature, moisture
and freeze–thaw controls on CO2
production in soil incubations
from northern peatlands
Eunji Byun1*, Fereidoun Rezanezhad1*, Linden Fairbairn1,2, Stephanie Slowinski1,
Nathan Basiliko3, Jonathan S. Price4, William L. Quinton5, Pascale Roy‑Léveillée2,6,
Kara Webster7 & Philippe Van Cappellen1*
Peat accumulation in high latitude wetlands represents a natural long-term carbon sink, resulting from
the cumulative excess of growing season net ecosystem production over non-growing season (NGS)
net mineralization in soils. With high latitudes experiencing warming at a faster pace than the global
average, especially during the NGS, a major concern is that enhanced mineralization of soil organic
carbon will steadily increase CO2 emissions from northern peatlands. In this study, we conducted
laboratory incubations with soils from boreal and temperate peatlands across Canada. Peat soils were
pretreated for different soil moisture levels, and CO2 production rates were measured at 12 sequential
temperatures, covering a range from − 10 to + 35 °C including one freeze–thaw event. On average, the
CO2 production rates in the boreal peat samples increased more sharply with temperature than in the
temperate peat samples. For same temperature, optimum soil moisture levels for CO2 production were
higher in the peat samples from more flooded sites. However, standard reaction kinetics (e.g., Q10
temperature coefficient and Arrhenius equation) failed to account for the apparent lack of temperature
dependence of CO2 production rates measured below 0 °C, and a sudden increase after a freezing
event. Thus, we caution against using the simple kinetic expressions to represent the CO2 emissions
from northern peatlands, especially regarding the long NGS period with multiple soil freeze and thaw
events.
Surface air temperatures in northern high latitude regions are increasing two to six times faster than the global
average1, a trend also observed in Canada2. Climate models project that this rate of warming will continue
through the twenty-first century, with the greatest warming occurring during the fall, winter and spring period,
which is generally non-growing season (hereafter ‘NGS’)3. Given that microbially mediated soil organic car-
bon (SOC) mineralization (or heterotrophic soil respiration) responds positively to increasing temperatures,
warming during the NGS could substantially alter the carbon balance of high latitude soils. For example, arctic
tundra ecosystems might already be shifting from annual carbon sinks to sources due to increasing NGS carbon
emissions4–7. The extent to which such shifts apply to a wider spectrum of cold region soil carbon pools remains
uncertain, however8,9.
In addition to the temperature-dependent slowing down of microbial metabolic activity, soil organic mat-
ter decomposition during the NGS can also be inhibited by soil freezing, which limits the supply of molecular
oxygen (O2) and the availability of liquid water, even if there are sufficient organic substrates remaining from the
growing season. Especially where the soil is poorly drained, a portion of the growing-season plant C O2 fixation is
therefore not mineralized10. This leads to the accumulation of organic peat layers that can be preserved for up to
several millennia11. The resulting northern peatlands have played a substantial role in storing atmospheric C O2
1
Ecohydrology Research Group, Department of Earth and Environmental Sciences and Water Institute,
University of Waterloo, Waterloo, ON, Canada. 2Environment and Climate Change Canada, Toronto, ON,
Canada. 3Department of Biology and Vale Living With Lakes Centre, Laurentian University, Sudbury, ON,
Canada. 4Department of Geography and Environmental Management, University of Waterloo, Waterloo, ON,
Canada. 5Cold Regions Research Centre, Wilfrid Laurier University, Waterloo, ON, Canada. 6Université Laval,
Quebec City, QC, Canada. 7Canadian Forest Service Great Lakes Forestry Centre - Natural Resources Canada, Sault
Ste Marie, ON, Canada. *email: ebyun@uwaterloo.ca; frezanezhad@uwaterloo.ca; pvc@uwaterloo.ca
Scientific Reports | (2021) 11:23219 | https://doi.org/10.1038/s41598-021-02606-3 1
Vol.:(0123456789)
www.nature.com/scientificreports/
since the last d eglaciation12,13. Nevertheless, recent rapid climate warming, as well as direct human encroach-
ment of peatlands, threaten to release this globally important carbon pool into the atmosphere. While Canada
has the second largest areal coverage of peatland14, much of its southern peatlands have already been lost to
agriculture and impacted by other anthropogenic disturbances15. In Canada’s north (i.e., above 50°N), ongoing
ecological and biogeochemical changes driven by climate warming are affecting the carbon storage potential of
remaining natural peatlands.
Recent advances in data synthesis and modeling have highlighted the sensitivity of global soil respiration to
climate change16, with significant implications for NSG soil carbon emissions in cold regions8. Nonetheless, the
parameterization and calibration of process models used to simulate future trajectories of soil carbon-climate
feedbacks remain poorly constrained when it comes to winter season carbon losses8. For example, a new version
of the Canadian Model for Peatlands (CaMP v2.0) has been developed for inclusion into the national carbon
budget estimations17. However, the model integrates soil carbon emissions over annual time steps and, hence,
does not account for seasonal variations in peat decomposition kinetics, which in turn produces unaccountable
uncertainties in model predictions under changing climate c onditions14,18–20.
One way to improve the representation of NGS soil carbon dynamics, is to incorporate variable reaction
parameters that reflect the seasonal changes of key soil environmental variables, in particular soil temperature
and moisture21. For example, the temperature sensitivity coefficient (Q10) has been widely used as a simple
numerical parameter to correct rates of soil carbon mineralization and other microbially-controlled transfor-
mation processes22–25. The Q10 approach assumes an exponential increase in the reaction rate with increasing
temperature, and a typical Q10 value of 2 implies that the rate doubles with every 10 °C increase in the ambient
temperature24. Most land surface and dynamic vegetation models use the constant Q10 values, but recent findings
suggest that the Q10 required to temperature-correct C O2 emissions may be higher (i.e., Q10 > 2) in cold climate
regions26–29, likely because of the interplay of multiple factors affecting soil physiochemical properties (e.g., those
accompanying pore water freeze and thaw) during the NGS20,30.
To date, a considerable amount of soil carbon Q10 values have been reported from field and laboratory studies,
thus enabling global s yntheses22,31. However, a relatively limited number of studies have focused on the warming
response of organic-rich wetland and peatland soils despite their disproportionately large share of the global SOC
stock10,32, and considering the rapid NGS changes in high l atitudes4–8. In addition to the effect on the temperature
regime of northern peatland soils, rapid climate warming is also driving changes in landscape hydrology and,
thus, in the moisture status of the soils21,33. Thus, latitudinal, and seasonal variations in soil temperature and
moisture should be considered when estimating SOC mineralization rates. Without consideration of such vari-
ations, projections of future annual peatland C O2 emissions will be fraught with uncertainty, especially at higher
latitudes where the impacts of climate change are expected to be most pronounced in the winter and shoulder
seasons (fall and spring) compared to summer2.
Because it is challenging to have regular or continuous access to multiple remote peatland locations in win-
tertime to perform in situ flux measurements, laboratory experiments with field samples can help with the
calibration of model parameters (for example, Q10 values as discussed above). The lab environment allows one
to perform measurements of C O2 production rates under simulated NGS conditions by controlling key envi-
ronmental factors, such as temperature, moisture content and freezing-induced changes in the accessibility of
organic substrates20,34–37.
In this study, we conducted laboratory incubations with peat samples of different depth intervals retrieved at
seven Canadian peatland locations in two climate zones (boreal and temperate). We measured C O2 release fluxes
under variable moisture levels across a temperature sequence ranging between − 10 and + 35 °C. The resulting
CO2 production rates were fitted to equations describing the observed moisture and temperature trends. Our
objectives were to (1) delineate systematic differences in the Q10 of CO2 production between sites, and relate
them to the ecoclimate, sample depth and moisture content, (2) identify the optimum moisture levels for CO2
production, and (3) assess the impact of a soil freezing event on the C O2 production during the event and follow-
ing thaw. We also explored the use of the Macromolecular Rate Theory (MMRT; see Alster et al.38 and references
therein) as a general framework to describe the measured C O2 production rates.
Materials and methods
Field peat sampling. Peat samples were collected from three peatland sites in “Eastern Cool Temperate
Forest” (‘temperate’ hereafter) and four sites in “Boreal Forest & Woodland” (‘boreal’ hereafter) biogeoclimatic
vegetation zones (‘ecoclimate’ hereafter), based on the classification of Baldwin et al.39 (Vegetation Zones of
Canada: a Biogeoclimatic Perspective—Level 1; see Table 1 and Fig. 1). We chose this recent land classification
map over the other commonly used national terrestrial ecozones classification14 because it closely parallels the
Köppen-Geiger climate classes40 for the sampling sites (see Supplementary Figure S1). At each field location,
peat samples were collected from depth intervals 0–10, 10–20 and 20–30 cm with a wide-toothed saw. The top
5 cm was removed to minimize large litter debris. All the samples were collected wet, immediately stored in a
cooler and transported to the University of Waterloo. Upon arrival, the samples were placed in an anaerobic
chamber (Mandel Scientific Anaerobic Chamber, AC11-074) and remained uncovered at room temperature
(25 °C) under anoxic atmosphere for two weeks while being hand-mixed at regular daily intervals. Next, the
total porosity, bulk density and moisture content of the peat samples were determined gravimetrically from the
saturated mass, oven-dried mass (2–10 g wet soil at 80 °C for 24 h) and original volume of the sample, following
the methods of Gardner41.
Laboratory incubations and CO2 production rates. After the two weeks of chamber-drying, the peat
samples were homogenized and divided into five subsamples of approximately equal mass and volume. These
Scientific Reports | (2021) 11:23219 | https://doi.org/10.1038/s41598-021-02606-3 2
Vol:.(1234567890)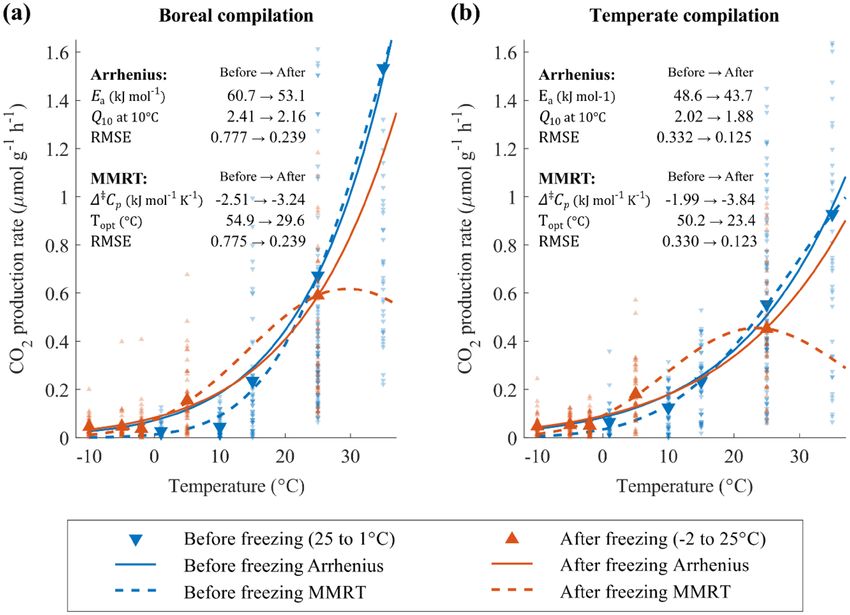
www.nature.com/scientificreports/
Site Latitude (°N) Longitude (°W) Peatland type Ecoclimate* MAT† (°C) Description‡ Depth (cm) BD (g cm−3) OC§ (%)
Open vegetation cover
with Sphagnum moss,
Eriohorum tussocks,
0–10 0.055 46.4
Old Crow Flats, Yukon 68.1148 140.05085 Sphagnum tundra Boreal − 8.27 Ledum decumbens and
10–20 0.098 46.0
Rubus chamaemorus.
Samples were collected
from moss cover
Poorly drained low-
grade terrain with
red Sphagnum moss,
Eriphorum tussocks,
Blackstone Uplands, and some lichen (e.g., 0–10 0.067 46.1
64.91937 138.28308 Tussock tundra Boreal − 4.1
Yukon Flavocetraria nivalis). 10–20 0.088 45.5
Ground is slightly
hummocky, and
sampling was from the
hummock top
Polygonal peat plateau.
Plateau surface forms
slightly raised ground
dissected by ice wedge
0–10 0.111 48.6
troughs. Lichens cover
Churchill, Manitoba 58.72247 93.8477 Lichen tundra Boreal − 6.47 10–20 0.151 49.1
with some sedges,
20–30 0.135 48.8
ericaceous shrubs
(Vaccinium vitis-idea,
Ledum decumbens) and
Rubus chamaemorus
Raised bog, hummocky
with some lawn.
Ground cover domi-
nated by moss, mostly
Sphagnum fuscum, but
in places up to 50%
0–10 0.087 46.1
Cladonia rangiferina,
James Bay Bog, Ontario 52.73733 83.97382 Sphagnum bog Boreal − 0.45 10–20 0.062 45.2
with 5 to 50% vascular
20–30 0.070 47.8
plants mostly Rubus
Chamaemorus and
Chamaedaphne
calyculata, and sparse
tree cover, mostly Picea
mariana
Mixed stands of Fraxi-
nus nigra, Thuja occi-
dentalis, Acer rubrum,
yellow birch and Larix
laricina. Understories
with the seedlings and 0–10 0.143 44.5
Turkey Lakes, Ontario 47.04809 84.40709 Hardwood swamp Temperate 4.73 saplings of the trees, 10–20 0.329 44.5
various ferns, herbs 20–30 0.067 41.4
(e.g., Caltha palustris,
Carex trisperma, and
Impatiens capensis) and
a mix of feather and
Sphagnum mosses
Pronounced
hummock-hollow
microtopography with
continuous Sphagnum
moss understory,
moderately dense
shrub layer (Rhododen-
dron groenlandicum,
Chamaedaphne calycu-
0–10 0.132 46.2
lata), sparse sedges in
Cartier Treed, Ontario 46.3976 81.3123 Treed poor fen Temperate 4.1 10–20 0.118 47.4
hollows, and 5–10 m
20–30 0.061 48.1
tall, well-spaced/open
canopy Picea mariana
trees. Samples were
collected from hum-
mocks. Moss water pH
was ~ 4.4 and water
table 80 cm below
the surface at time of
sampling
Continued
Scientific Reports | (2021) 11:23219 | https://doi.org/10.1038/s41598-021-02606-3 3
Vol.:(0123456789)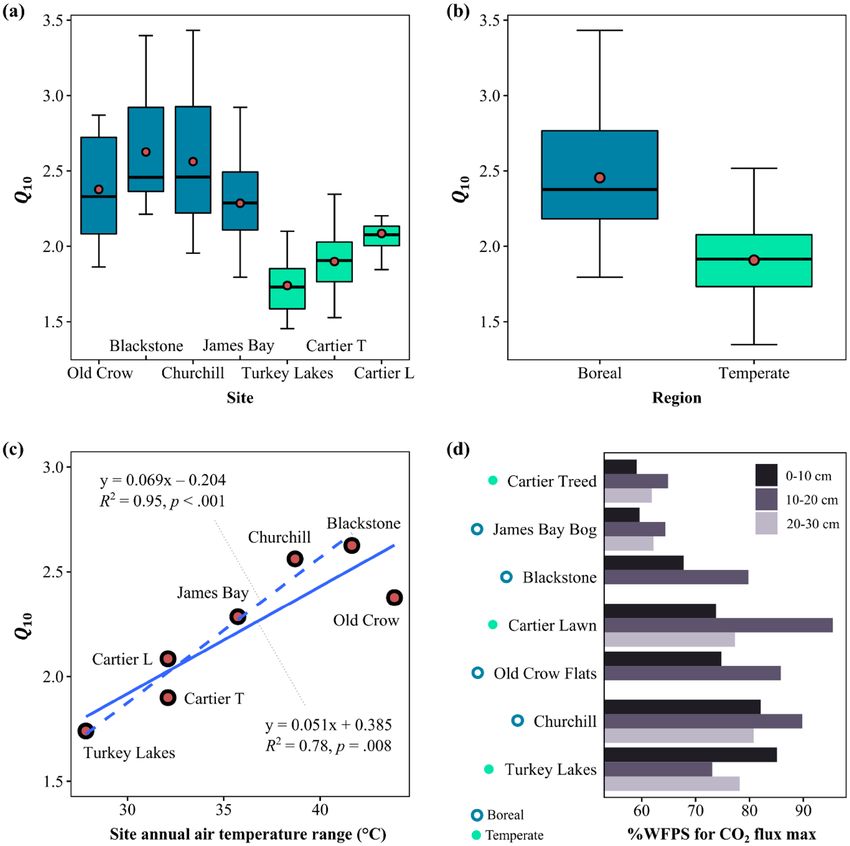
www.nature.com/scientificreports/
Site Latitude (°N) Longitude (°W) Peatland type Ecoclimate* MAT† (°C) Description‡ Depth (cm) BD (g cm−3) OC§ (%)
A thick floating mat
(> 5 m) in a terrestrial-
izing pond adjacent to
the treed fen site with
little microtopography,
continuous Sphagnum
moss cover, and mod-
erately dense (~ 35%
cover) Eriophorum 0–10 0.161 46.2
Cartier Lawn, Ontario 46.3777 81.312 Open poor fen Temperate 4.1 spissum, sparse low 10–20 0.052 46.7
shrubs (Chamae- 20–30 0.100 48.8
daphne calyculata,
Vaccinium oxycoccos),
and small (0.5–1 m)
Larix laricina. Pore
water pH was ~ 4.3 and
water table 5 cm below
the surface at time of
sampling
Table 1. Peatland sampling site information. Peat samples collected from each of the 10-cm depth intervals
were analyzed for dry bulk density (BD, g cm−3) and organic carbon content (OC, %). *According to
Vegetation Zones of Canada: a Biogeoclimatic Perspective—Level 1 39. † Mean annual temperature data from
1981–2010 Climate Normals, Government of Canada (see weather station names in Supplementary Table S2).
‡
Turkey Lakes site description from Webster et al.42. § Samples are combusted at 600 °C in an elemental
analyzer.
Figure 1. The locations of peatland sites across different vegetation (ecoclimate) zones of Canada (Baldwin
et al. 2019) with the nearest weather stations (circles) for which Canadian Climate Normals 1981–2010 data are
available (Environment and Climate Change Canada). The map was created using ArcGIS Pro (Esri). The site
names correspond to the information given in Table 1.
Scientific Reports | (2021) 11:23219 | https://doi.org/10.1038/s41598-021-02606-3 4
Vol:.(1234567890)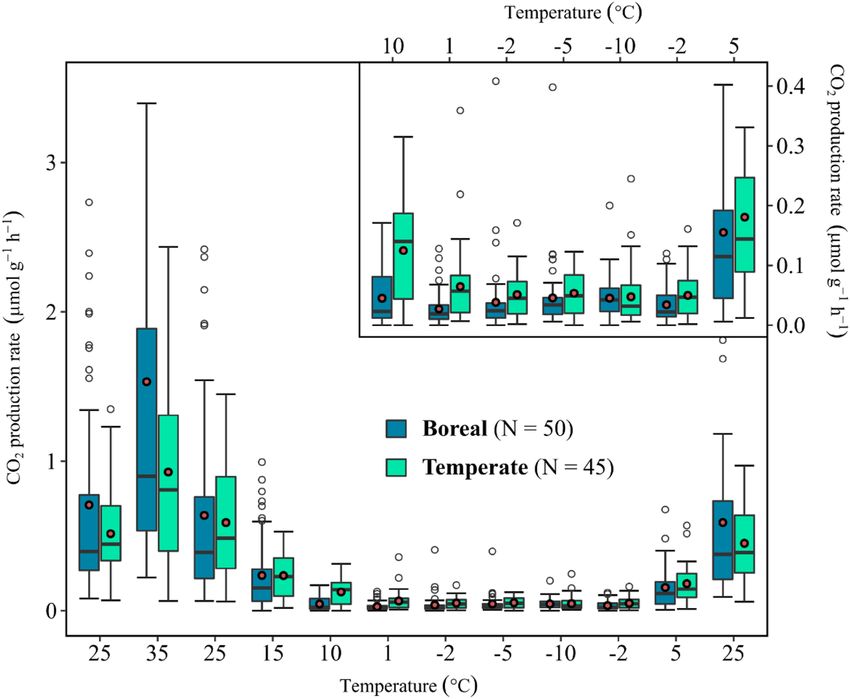
www.nature.com/scientificreports/
subsamples were placed in five 500-mL glass mason jars, filling less than half the space. The initial dry masses
of peat varied by site and depth, from ~ 120 to ~ 600 g (or ~ 24 to ~ 120 g per jar), with lower masses for the drier
and lower density peat samples (e.g., those from the shallowest depth intervals). One in each of the five-jar series
was incubated at the gravimetric moisture content of the peat remaining after the two weeks of chamber-drying.
The moisture contents of the peat in the other four jars were adjusted by adding an artificial water solution pre-
pared based on the chemical composition of the soil water collected at the corresponding site (Supplementary
Table S1). The moisture contents were calculated as water-filled pore space (%WFPS), based on the measured
gravimetric moisture, bulk density and porosity, plus the volume of water solution added to the jar. We aimed
at %WFPS ranging from the gravimetric moisture content of the peat up to 100%. Thus, each jar and the con-
tained peat corresponded to a given site, depth interval, and moisture condition (e.g., Blackstone, 0–10 cm, 100%
WFPS).
The jars were incubated with their lids closed and, therefore, water loss and changes in soil moisture were
assumed to be negligible. The jars were incubated in an environmental chamber (Percival I-41NL XC9) which
was cycled through a series of 12 sequential temperature settings of 25, 35, 25, 15, 10, 1, − 2, − 5, − 10, − 2, 5 and
25 °C. Note that the incubation temperature range was not restricted for a given sample location/depth to the
site-specific in-situ soil temperatures. Rather, we imposed the same temperature range and trajectory (including
one freezing event) for all the samples to assess the temperature effect, separate from other site- and soil-specific
variables. Specifically, the incubation started at room temperature 25 °C, that is, the same temperature under
which the peat samples were dried in the anoxic chamber. Thus, the peat samples adjusted to the aerobic and
variable moisture conditions without experiencing a sudden temperature change when transferred out of the
anoxic chamber. At the high temperature end, 35 °C is usually near the optimum temperature for soil microbial
activity. By extending the temperature to the optimum value, we expected a more robust curve-fitting analysis
than for a smaller temperature r ange38. Then, we purposely included repeated measurements at 25 °C to check
for potential long-term drifts in the rates of CO2 production due, for example, to carbon substrate depletion or
an irreversible shift in the microbial community structure, as commonly observed in long-term incubations.
The temperature in the incubation chamber was lowered up to − 10 °C, considering that soil temperature at
0.1 m depth in northern permafrost peatland have been shown to drop to as low as − 10 °C during the w inter43.
At each setting, the temperature fluctuations were within ± 0.5 °C. The C O2 production rates were determined
after 48 h of incubation at a given temperature using an automated multiplexer C O2-flux system (LI-8100 and
LI-8150, LI-COR Biosciences, Lincoln, NE, USA). The rates of headspace C O2 concentration increase with time
(dCO2/dt, μmol m −2 s−1) were measured following the method of Davidson et al.44, considering the variable
headspace volume of the jars (Note: for more details of the measurement setup and procedure, see Rezanezhad
et al.45). To compare C O2 production among the different peat subsamples, the rates were normalized to the dry
weight of the peat in each jar and expressed in units of µmol g−1 h−1. Overall, our incubation experiment was not
aimed at quantifying the in-situ C O2 emissions from northern peatlands, but to delineate the response of C O2
production rates to variable temperature and moisture, as well as to a freeze–thaw event.
Fitting of CO2 production rates. For each jar experiment (corresponding to a given site, depth interval,
and moisture content), the CO2 production rates measured across a range of temperatures (RT) were fitted to the
following exponential equation 25,46 with temperature (T, °C) as the independent variable:
lnQ10
RT = αe( 10 )T (1)
where α and Q10 are fitting coefficients determined by the method of least squares (‘fitnlm’ function in MATLAB
R2020b), and RT are the C O2 production rates normalized to the dry weight of the peat. Equation (1) is closely
related to the Arrhenius equation, which states that the rate constant, k, of a reaction can be described by:
(2)
Ea
k = Ae− RT
where R is the universal gas constant, Ea is the (empirical) activation energy and A is called the frequency or
pre-exponential factor. Assuming that, for a given jar experiment, the pool of organic matter being mineralized
at the different temperatures remains the same, α should be linearly related to A. From Eqs. (1) and (2) it then
follows that:
10Ea
Q10 = e RT(T+10) (3)
which implies that using Q10 as a measure of the temperature sensitivity is equivalent to assuming the C O2 pro-
duction rate follows the Arrhenius equation. Also, note that Ea may vary with temperature, although for relatively
small temperature ranges, as considered in our experiments, Ea is usually treated as a constant24. Practically,
the Q10 value represents the proportional rate increase in CO2 production for a 10 °C increase of temperature
(i.e., Q10 = RT+10 /RT ) and thus provides a simple metric to express the temperature sensitivity of the soil CO2
production kinetics.
The Arrhenius equation predicts that a reaction rate (here as the C
O2 production rate) always increases with
increasing temperature. Microbially-mediated reaction processes, however, often exhibit a temperature optimum
at which the rate reaches its maximum value. This feature is reproduced by the Macromolecular Rate Theory
(MMRT) (e.g., 47–50) according to which the temperature dependence of enzyme-catalyzed reactions is given by:
Scientific Reports | (2021) 11:23219 | https://doi.org/10.1038/s41598-021-02606-3 5
Vol.:(0123456789)www.nature.com/scientificreports/
[�‡ HT +�‡ Cp (T−T0 )] [�‡ ST +�‡ Cp (lnT−lnT0 )]
0 0
kB T − RT + R
(4)
k= e
h
where the temperature T is now expressed in degrees K (0 °C = 273.15 K), T0 (K) is a reference temperature point
set at a few degrees below the estimated optimum temperature, R is the universal gas constant, kB is Boltzmann’s
constant, and h is Planck’s constant.
Equation (4) has three fitting parameters: the changes in the standard enthalpy ( ‡ HT0 ), entropy ( ‡ ST0 ),
and heat capacity ( ‡ Cp) for the activation reaction (i.e., the formation of the enzyme–substrate transition state),
with the standard Gibbs energy of activation then given by: ‡ G = ‡ H − T ‡ S . Note that for a heat capacity
change of activation equal to zero, ‡ Cp = 0, MMRT predicts an exponential temperature dependence of the
CO2 production rate that is equivalent to that of the Arrhenius equation. Physically plausible deviations from
this exponential dependence should yield values �‡ Cp < 0. For further details on the application of MMRT to
microbial reaction processes, see Alster et al.38 and references therein. In this study, we attempted to find a gen-
eral relationship between the C O2 production rate (k) and temperature (T) using Eq. (2) and (4) with the fitting
parameters determined by the method of least squares (‘fitnlm’ function in MATLAB R2020b).
Using the measurements at 25 °C across the range of experimental moistures, the C O2 production rates
( R25 ◦ C ) were fitted to a second-order polynomial equation (e.g., 20,36,51)
R25 ◦ C = ax 2 + bx + c (5)
where x is the moisture content (% WFPS). Equation (5) was fitted to the measured rates using the ‘polyfit’ func-
tion in MATLAB R2020b. Note that R25 ◦ C reaches its maximum value at x = −b/2a (% WFPS), which therefore
provides a measure of the optimum moisture condition for CO2 production.
Statistical analyses. The statistical analyses were performed in R version 4.0.3 using the ‘rpart,’ ‘ggplot2,’
and ‘stats’ packages. A decision tree learning approach (function ‘rpart’) was used to identify the relative impor-
tance of ecoclimate, peat depth, and soil moisture content in predicting the Q10 values. The Q10 values were
then summarized for each site and ecoclimate in box-and-whisker plots (function ‘ggplot’). One-way ANOVA
(function ‘aov’) was performed to examine whether the Q10 values significantly varied from site to site, as well as
between sites in the boreal versus temperate ecoclimate zone. Statistical differences between any two groups of
samples were evaluated by performing t-tests (function ‘t-test’).
A simple linear regression analysis (function ‘lm’) was conducted to explore the apparent influence of local
site climate conditions on the Q10 variance using the mean site Q10 values and the mean air temperatures recorded
during the 1981–2010 Climate Normals at the nearest weather station (Supplementary Table S2). The annual
mean site air temperature was chosen as a simple local climate proxy. Additionally, the mean annual air tempera-
ture range, calculated as the difference between the July (warmest) and January (coldest) mean temperatures,
was also considered as a possible explanatory variable.
Results
Temperature dependence of CO2 production rates. For all sites, depth intervals and moisture con-
tents, the CO2 production rates increased exponentially with temperature (Fig. 2 and Supplementary Figures S2-
6). The Q10 distributions extracted from the exponential temperature fits to Eq. (1) are summarized in Fig. 3 for
the individual sampling sites (panel a) and grouped according to ecoclimate zone (panel b). Mean Q10 values
differed significantly between the seven sites [F(6, 88) = 14.18, p < 0.001] (Supplementary Table S2), although for
the boreal ecoclimate zone the intra-site variance exceeded the differences in mean Q10 among the four sites [F(3,
46) = 2.01, p = 0.126]. While the differences between the Cartier Lawn (temperate) and James Bay Bog (boreal)
rates were not statistically significant [t(21) = 2.01, p = 0.057], the mean James Bay Bog Q10 value was distinctly
higher than that of Cartier Lawn (Fig. 3a). Thus, when the data from the sites were grouped according to eco-
climate zone (Fig. 3b), the difference between the two ecoclimate zones was significant [t(83) = 7.89, p < 0.001],
with the boreal peat samples having a higher average Q10 value (mean = 2.45, SD = 0.41) than the temperate peat
samples (mean = 1.91, SD = 0.25).
The mean Q10 values of the sites were inversely corelated to air temperature (for temperature records cover-
ing the 1981–2010 period). This was true whether considering monthly or yearly averaged site temperatures
(Supplementary Figure S7). Thus, colder sites yielded higher mean Q10 values than warmer sites. Using simple
linear regressions, the differences in the annual mean air temperature explained 74% of the observed variations
in mean Q10 values [R2 = 0.74, F(1, 5) = 14.12, p = 0.013]. In addition, the site mean Q10 values correlated positively
with the annual temperature range, expressed as the difference between the coldest and the warmest month
[R2 = 0.78, F(1, 5) = 18.01, p = 0.008] (Fig. 3c). Note that, without the Old Crow Flats site, an even stronger linear
trend emerged [R2 = 0.95, F(1, 4) = 82.13, p < 0.001].
Moisture dependence of CO2 production rates. The rates in the 25 °C incubations systematically
exhibited downward concave trends with respect to moisture content (%WFPS) (Fig. 2 and Supplementary Fig-
ures S2-6). The optimum moisture contents fell mostly in the range 60–90% as shown in Fig. 3d. For all the
sites, except the Turkey Lakes swamp, the optimum WFPS increased between the near surface depth interval
(0–10 cm) and the depth interval below (10–20 cm), although this trend did not continue when moving to the
deepest depth interval (20–30 cm). The optimum WFPS in the top layer varied notably from site to site, but
without a systematic differentiation between boreal and temperate sites (Fig. 3d). Overall, the variability in Q10
Scientific Reports | (2021) 11:23219 | https://doi.org/10.1038/s41598-021-02606-3 6
Vol:.(1234567890)www.nature.com/scientificreports/
Figure 2. Examples of CO2 production rates measured for peat samples from one boreal (James Bay Bog, a)
and one temperate site (Cartier Lawn, b) at different moisture contents (%WFPS; see Table 1). The rates are
fitted with Eq. (1) for temperature and Eq. (5) for the moisture dependence. The effect of moisture variation
at a fixed incubation temperature (25 °C) is shown in the first leftmost column; the optimum moisture levels
for maximum CO2 production are indicated on the panels. The effects of temperature variations on the C O2
production at varying peat moisture contents are shown in the next five columns (in increasing order of
%WFPS) with the fitted Q10 values. The results for the other sites are presented in Supplementary Figures S2 to
S6.
Scientific Reports | (2021) 11:23219 | https://doi.org/10.1038/s41598-021-02606-3 7
Vol.:(0123456789)www.nature.com/scientificreports/
Figure 3. Boxplots of Q10 values calculated from incubations at different moisture contents and peat depths
grouped by peatland site (a) and by ecoclimate zone (b). Boxes extend from the first to the third quartile
with the inside horizontal line corresponding to the second quartile (median). Vertical lines extend to the 1.5
interquartile range of each box. The red circles (in panels a and b) indicate mean (i.e., average) Q10 values. The
latter are used in the linear regression analysis against the site air temperatures and the annual temperature
range, i.e., the difference between coldest and warmest month (panel c; for monthly results, see Supplementary
Figure S7). Dashed fitted line in plot (c) represents the linear trend without the Old Crow Flats site data. The bar
graphs (d) compare the optimum moisture levels for CO2 production by sampling depth and site.
values was related in descending order to the variations in the following variables: ecoclimate zone > soil mois-
ture > depth interval (Figure S8).
CO2 production rates at low temperatures (−10 °C ≤ T ≤ 10 °C). Because the ecoclimate site loca-
tion emerged as the variable with the highest explanatory power, the C O2 production rate data from all sites in
each of the ecoclimate zones were binned together. The two resulting ecoclimate datasets are shown in Fig. 4,
arranged from left to right according to the sequence of temperature steps imposed in the incubations. For both
ecoclimate zones, the CO2 production rates at 25 °C measured during the first and third temperature steps (that
is, before the freezing event), as well as the 25 °C rates measured during the last temperature step (that is, after
Scientific Reports | (2021) 11:23219 | https://doi.org/10.1038/s41598-021-02606-3 8
Vol:.(1234567890)www.nature.com/scientificreports/
Figure 4. Boxplots of the peat CO2 production rates for the 12 incubation temperature settings grouped by
ecoclimate (N represents the number of data points). The incubation temperature changed in sequential order
from the first 25 °C to the last 25 °C, from left to right along the x-axis. The inset plot zooms into the results for
the low temperature range (≤ 10 °C).
the freezing event) were not significantly different from one another according to a one-way ANOVA analysis of
temperate [F(2,132) = 2.282, p = 0.106] and boreal [F(2,147) = 0.485, p = 0.617] rates.
The inset of Fig. 4 shows the data for the low temperature range (≤ 10 °C) that encompasses the period of
freezing temperatures (i.e., the sequence of − 2, − 5, − 10 and − 2 °C steps). As can be seen, measurable C
O2 pro-
duction rates were detectable even during the sub-zero conditions. The mean rates were higher for the temperate
than boreal locations, apart from the − 10 °C rates. Interestingly, the expected decreasing trend of the rates with
decreasing temperature was not observed. In fact, for each ecoclimate zone, the mean rates remained relatively
constant over the − 2 to − 10 °C range, with values comprised between 0.047 and 0.053 µmol g−1 h−1 for the tem-
perate and between 0.024 and 0.040 µmol g−1 h−1 for the boreal peat samples. Furthermore, following thaw, the
mean CO2 production rates observed at 5 °C were similar (temperate samples) or even higher (boreal samples)
than those measured at 10 °C before freezing.
CO2 production rates: model fits. The CO2 production rates grouped according to ecoclimate zones
were fitted to both the Arrhenius equation and the MMRT models. Fits were obtained separately for rates meas-
ured before freezing (i.e., for temperatures ranging between 1 and 35 °C) and after the start of freezing (i.e., for
temperatures ranging from − 10 to 25 °C). The fitted curves and the resulting model parameter values can be
found on Fig. 5, together with the observed mean C O2 production rates. Note that the model fitting was done
using all the available rate data, not just the mean rates.
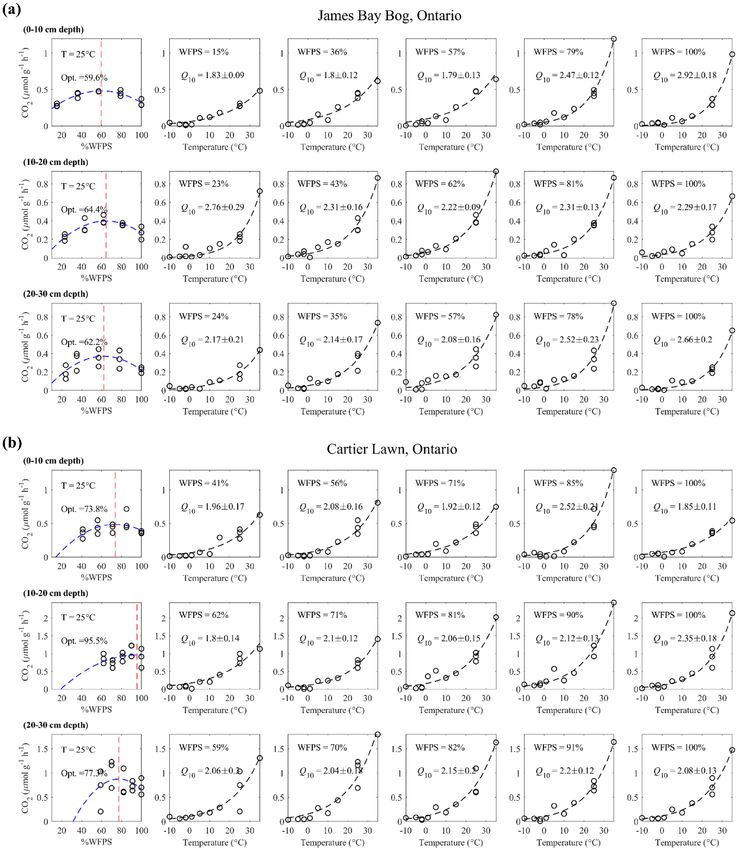
For data above 10 °C, the Arrhenius fitted curves closely matched the mean CO2 production rates, both before
and after the freezing event. For both ecoclimate groups, the Arrhenius fits yielded activation energies (Ea) after
freezing that were 10–12% lower than before freezing. At temperatures ≤ 10 °C, the Arrhenius equation did not
reproduce the temperature trends of the mean CO2 rates. In particular, the Arrhenius equation did not account
for the near-constant rates in the + 1 to − 10 °C range, or for the differences between rates measured before and
after the onset of freezing.
The MMRT model yielded better fits to the average CO2 production rates measured at the lower temperatures
(≤ 10 °C), but only if the before and after freezing data were fitted separately. For both ecoclimates, the fits yielded
lower optimum temperatures and more negative ‡ Cp values for the rate data collected after the onset of freez-
ing. As a result, the shape of the fitted MMRT curves for the data collected during and after the freezing event
deviated significantly from the simple exponential, or Arrhenius-type, temperature dependence.
Discussion
CO2 production kinetics: ecoclimate zones. On average, the boreal sites exhibit higher Q10 values for
CO2 production than their temperate counterparts (Fig. 3a-b) although, within any given site, Q10 values vary
considerably with changes in moisture content and peat depth (Fig. 2). The strong dependence of Q10 on the
Scientific Reports | (2021) 11:23219 | https://doi.org/10.1038/s41598-021-02606-3 9
Vol.:(0123456789)www.nature.com/scientificreports/
Figure 5. The grouped CO2 production rates for boreal (a) and temperate (b) ecoclimate (as in Fig. 4). The data
points and fitted lines correspond to one of the two cases: before or after the start of sub-zero temperatures (i.e.,
‘before freezing’: from the first temperature setting at 25 °C to 1 °C; and “after freezing”: from the − 2 °C to the
last 25 °C setting; see Fig. 4 x-axis for the incubation temperature steps). Data are fitted to both the Arrhenius
and MMRT models (see Methods). The light symbols show all the rate data collected at a given temperature, the
darker symbols are the mean rates.
ecoclimate zone is in line with previous work that reports higher temperature sensitivities of the decomposition
of soil organic matter under colder climate conditions26–28. Some studies have attributed observed regional Q10
variability more to soil types and land use22,31,35. In the present study, we attempted to limit the influence of these
variables by only including soils from undisturbed peatlands.
The annual air temperature range (i.e., the difference between the coldest and the warmest month) explains
most of the spread in the mean Q10 values between the seven sites (Fig. 3c). Possibly, this reflects an adaptive
response of the soil heterotrophic communities to the yearly temperature range. The temperature-dependent
microbial production of different extracellular enzymes can, for instance, modulate the overall temperature
sensitivity of soil respiration50. Soil temperatures, however, may diverge significantly from the air temperature,
especially in the colder, sub-arctic regions due to the insulating effects of snow and vegetation cover52–54. Whether
this may help explain the apparent departure of the mean Q10 value for the Old Crow Flats site from the trend
line in Fig. 3c remains to be seen.
Tropical peat soils have Q10 values (~ 1.3–1.8)55 that generally fall below the mean Q10 values observed here,
thus suggesting a broad latitudinal trend that could help attenuate the response of global peatland C O2 emissions
to ongoing and future climate warming29. According to climate model projections, by the end of the century most
peatlands may have transitioned into a warmer climate zone40 (Supplementary Figure S1). If climate adaptation
reduces the temperature sensitivity of peatland C O2 production (e.g., by lowering current Q10 values of boreal
peat soils to temperate values), peat decomposition rates will still increase but the slope of the increase would
be less steep than anticipated without thermal a daptation56. Further research is required, however, to determine
how long it would take for thermal adaptation to readjust latitudinal gradients of temperature sensitivities under
future climate conditions and, thus, to more realistically account for the feedback to climate of peat soil carbon
cycling57–59.
A complete mechanistic understanding of the thermal adaptation of soil microbes, and hence C O2 production
kinetics, remains e lusive32,60,61. Nonetheless, empirical model parameter values obtained under relevant environ-
mental conditions can still significantly improve regionalized models of carbon emissions from p eatlands56,62.
For example, the most recent version of the Canadian peatland model (CaMP v2.0) incorporates variable SOC
decay rate coefficients for different peatland ecological types but does not explicitly consider differences due to
ecoclimate17. Our results show that the temperature sensitivity of C O2 production may vary significantly and,
possibly, systematically, depending on ecoclimate location. This finding therefore implies that including ecocli-
mate-specific temperature sensitivities of peat mineralization in models such as CaMP could significantly reduce
parameter uncertainties when assessing the contribution of peat decomposition to continental-scale CO2 budgets.
Scientific Reports | (2021) 11:23219 | https://doi.org/10.1038/s41598-021-02606-3 10
Vol:.(1234567890)www.nature.com/scientificreports/
CO2 production kinetics: soil moisture. The effect of soil moisture was evaluated using the C
O2 produc-
tion rates at 25 °C for which we have the most complete set of replicate measurements. The concave down shapes
of the moisture response curves (Fig. 2) are consistent with other studies. However, the optimum WFPS values
obtained here for the peat soils (Fig. 3d) tend to be higher than the ~ 60% moisture levels typically observed for
more upland and mineral soils (e.g., 37,45,63–66).
Optimum moisture levels for soil respiration emerge from complex interactions among physiochemical
(e.g., pore water distribution, oxygen availability, and solute d iffusion67,68) and biological factors (e.g., microbial
enzyme activity r egulation51). The general shift to higher optimum moisture levels in peat soils is likely, at least
in part, due to their high organic matter content and complex (multi-domain) pore structure compared to non-
peat soils36,69,70. Still, the organic carbon concentrations of our peat samples fall in a fairly narrow range (Table 1),
while the optimum WFPS levels at 25 °C vary between 59 and 96% (Fig. 2 and Supplementary Figures S2-6).
The variations in the optimum WFPS for CO2 production appear to be related to in situ water table condi-
tions, as inferred from the peatland type and microtopography at the sampling location (Table 1). For example,
the peat soils from the Blackstone and Cartier Treed sites were collected on hummocks, where the water table
is relatively deep below the surface and the top peat often drier than in sunken areas of the landscape, such as
hollows71. Similarly, prior to our sampling, the James Bay Bog site had been experiencing a lowering of the water
table due to nearby mining operations72. By contrast, the soils in the permafrost tundra with fen type vegetation
(e.g., Eriophorum) covers are characterized by shallow water tables and wet conditions73. While speculative,
the correlation between the water table depth and the measured optimum WFPS may reflect an adaptation of
peatland microbial communities to the prevailing in situ moisture conditions10,59.
Rewetting of peatlands has been proposed as a management strategy to restore their carbon sink function
(e.g., 74,75). The experimental results presented here support a systematic decline of the CO2 production rates
at full saturation (i.e., 100% WFPS). However, the complete evaluation of the effect of peatland rewetting on
carbon emissions must consider the concomitant increases in C H4 release due to the decreased availability of
oxygen76. Our results further indicate that CO2 production rates also decrease when the moisture level drops
below the optimum WFPS. In the field, drier conditions due to a lowering of the water table would shift the
zone of optimum moisture level downwards and, therefore, not necessarily translate in a reduction of the CO2
emissions at the soil surface.
In addition, there is evidence that, given enough time, the microbial decomposer communities may adapt to
drier conditions. Arnold et al.67 for example, showed that in long-term (> 300 days) incubations the simulated
drainage of wetland soils resulted in cumulatively more organic carbon being mineralized. Recent work has also
been exploring the role of moisture on the temperature sensitivity of soil CO2 production (e.g., 37,69). Together,
the results of these studies call for more systematic and data-driven approaches to represent the regulating role
of soil moisture in soil carbon process models67,68,77 that, in turn, would improve the reliability of predicted
responses of peatland carbon budgets to changes in soil moisture regime due to climate and land use changes.
CO2 production kinetics: impact of freezing. The production of CO2 at sub-zero temperatures in both
ecoclimate groups exhibits small but measurable rates through the − 2 to − 10 °C temperature range (Fig. 4).
The rates measured here are similar to sub-zero rates in the same temperature range reported in other low-
temperature incubation experiments (see, for example, the data compiled by Natali et al.8). Most importantly, the
observed trends do not follow the exponential drop of the rates with cooling below 0 °C that is often assumed8.
On average, the sub-zero C O2 production rates are remarkably constant and of comparable magnitude for both
ecoclimates (Fig. 5). The lack of a temperature dependence of the average sub-zero rates is in apparent contradic-
tion with standard reaction rate models.
The higher-than-expected CO2 production rates at temperatures below 0 °C could reflect an enhanced release
of biodegradable organic substrates caused by the freezing of the soil that, in the case of peat soils, may be facili-
tated by the high moisture c ontents34,78–81. Such a release of labile organic substrates is supported by the higher
rates measured at 5 °C after thawing, compared to the rates measured at 10 °C prior to freezing. Thus, a possible
explanation for the near-constant rates in the − 2 to − 10 °C range is that the enhanced supply of labile organic
compounds counterbalances the lowering of temperature below 0 °C. Because more labile compounds have lower
activation energies of degradation, they also result in lower temperature sensitivities. This is consistent with the
lower fitted Ea and Q10 values after the freezing event for both ecoclimate groups (the values are given on Fig. 5).
The divergence of the temperature trends of the CO2 production rates before and after freezing is not captured
by the Arrhenius rate equation, even after adjusting the Ea values (Fig. 5). By contrast, the MMRT model is able
to account for the enhanced rates observed after thawing in the 0 to 10 °C range. For both ecoclimate groups,
the post-thaw MMRT fits yield more negative ‡ Cp values and a lowering of the optimum temperatures (Topt).
These changes are in line with the “Enzyme Rigidity Hypothesis” (see Alster et al.38 for details), according to
which cold-adapted enzymes are more sensitive, or “less rigid,” than enzymes adapted to warmer temperatures.
Thus, in addition to releasing more labile organic substrates, the cooling to sub-zero temperatures could also
have been accompanied by the selective activation of “cold-adapted enzymes” by the microbial communities.
When dynamic enzyme responses modulate the rates of organic matter degradation, the temperature depend-
ence is expected to depart from the Arrhenius equation and exhibit an optimum biological temperature (Topt)37.
However, the predicted post-freezing Topt values, 23.4 and 29.6 °C, would need to be verified by Increasing the
experimental temperature range well above 25 °C (which was the final temperature setting in our experiments),
and including more frequent measurement intervals38,49. Nonetheless, the MMRT provides a more flexible
approach that could be useful in modeling the in-field observed seasonal hysteresis in the temperature trends of
CO2 emissions (e.g., 20,30,58), as well as C
H4 emissions82–84.
Scientific Reports | (2021) 11:23219 | https://doi.org/10.1038/s41598-021-02606-3 11
Vol.:(0123456789)www.nature.com/scientificreports/
Implications for CO2 emissions during the NGS. The failure of the Arrhenius and MMRT models to
reproduce the observed temperature trends of the sub-zero C O2 production rates is not entirely surprising. Both
models only account for the temperature dependence of molecular reaction rates. In addition to increasing the
supply of labile substrates, freezing may have other consequences for the cryogenic soil environment, including
changes in the distribution of unfrozen water and the transport pathways of solutes and g ases33,64,70,85. Together,
these changes modulate the measured rates at which CO2 is released from the soil. Thus, it may be advisable not
to extend the use of reaction rate models to simulate sub-zero CO2 production rates in soils, or those portions
of the soils, that undergo seasonal freezing. To properly represent frozen peat soils, future experimental work
should consider measuring C O2 production over longer time spans than in the present study, weeks to months
rather than the 48 h per temperature step here, and extend the temperature range covered.
The experimental results imply that freezing impacts the rates of CO2 production upon thawing; this is
especially evident from the 5 °C post-thawing data (Figs. 4 and 5). Typically, the increase in CO2 emission fluxes
during spring thaw observed in the field are attributed to a combination of the pulsed release of trapped gas that
accumulated under the snow and ice layer during winter86 and de novo microbial CO2 production due to the
sudden increase in temperature and oxygen supply upon s nowmelt4. Our results suggest that the enhanced access
to relatively labile organic compounds mobilized during freezing may additionally contribute to the observed
post-thaw CO2 pulses.
It will be important to further determine whether the post-thaw CO2 rate enhancement observed in our
experiments is short-lived, and possibly insignificant in the overall NGS CO2 emission budget, or whether it
could help sustain C O2 production throughout the shoulder s eason30. The importance of enhanced carbon loss
from peatlands induced by encroaching permafrost thaw is now well recognized87. However, the role of shallow
freeze–thaw cycles on NGS CO2 emissions need to be better quantified and the responsible mechanisms under-
stood. At higher latitudes, freeze–thaw cycles are expected become more frequent in the springtime, because
trends in snow cover (and its temperature insulating effect) are d ecreasing20,88.
Summary and conclusions
This study highlights the statistically significant variations in the temperature sensitivity of peat soil C
O2 produc-
tion rates between the cold-temperate and boreal ecoclimate zones. Given the higher Q10 values, in combination
with spatial and seasonal patterns of global warming, boreal peatlands may increase future NGS CO2 losses to a
larger degree than temperate peatlands. The variable temperature sensitivities under different climate conditions
need to be accounted for when assessing future global trajectories of peatland carbon pool stability.
Peatland soils tend to support high organic matter mineralization activity at higher moisture levels com-
pared to well-drained mineral soils. Our findings suggest that the optimum moisture level for maximum CO2
production is a function of peatland type (e.g., bog or fen) and microtopography (e.g., samples from hummock
or hollow), which, in turn, are related to the relative position of the water table. The variations in optimum
moisture content may thus reflect an adaptation of the resident microbial communities to the prevailing mois-
ture conditions.
Freezing of the peat samples causes a shift in the temperature response curve for the CO2 production rates.
This shift is captured by the MMRT model, but not by the conventional Arrhenius equation. Furthermore, the
reaction rate models are unable to account for the near-constant CO2 production rates measured across the sub-
zero temperature range (− 2 to − 10 °C). More research is needed to unravel the various processes and structural
properties controlling C O2 production in frozen peat soils and their response to the changes in temperature and
hydrology under climate warming. Only with this improved mechanistic understanding supported by precise
rate data will process models be able to grapple with the implications of climate and land use changes for NGS
carbon budgets of northern peatlands.
Received: 6 July 2021; Accepted: 19 November 2021
References
1. Huang, J. et al. Recently amplified arctic warming has contributed to a continual global warming trend. Nat. Clim. Chang. 7(12),
875–879. https://doi.org/10.1038/s41558-017-0009-5 (2017).
2. Zhang, X. et al. Changes in temperature and precipitation across Canada. In Canada’s Changing Climate Report (eds Bush, E. &
Lemmen, D. S.) 112–193 (Ottawa, 2019).
3. Koenigk, T. et al. Arctic climate change in 21st century CMIP5 simulations with EC-Earth. Clim. Dyn. 40(11–12), 2719–2743.
https://doi.org/10.1007/s00382-012-1505-y (2013).
4. Arndt, K. A., Lipson, D. A., Hashemi, J., Oechel, W. C. & Zona, D. Snow melt stimulates ecosystem respiration in Arctic ecosystems.
Glob. Change Biol. 26(9), 5042–5051. https://doi.org/10.1111/gcb.15193 (2020).
5. Commane, R. et al. Carbon dioxide sources from Alaska driven by increasing early winter respiration from Arctic tundra. Proc.
Natl. Acad. Sci. U.S.A. 114(21), 5361–5366. https://doi.org/10.1073/pnas.1618567114 (2017).
6. Euskirchen, E. S., Bret-Harte, M. S., Shaver, G. R., Edgar, C. W. & Romanovsky, V. E. Long-term release of carbon dioxide from
Arctic Tundra Ecosystems in Alaska. Ecosystems 20(5), 960–974. https://doi.org/10.1007/s10021-016-0085-9 (2017).
7. Webb, E. E. et al. Increased wintertime CO2 loss as a result of sustained tundra warming. J. Geophys. Res. Biogeosci. 121, 249–265.
https://doi.org/10.1002/2014JG002795 (2016).
8. Natali, S. M. et al. Large loss of CO2 in winter observed across the northern permafrost region. Nat. Clim. Chang. 9(11), 852–857.
https://doi.org/10.1038/s41558-019-0592-8 (2019).
9. Rafat, A. et al. Non-growing season carbon emissions in a northern peatland are projected to increase under global warming.
Nature Communications Earth & Enviornment 2(1), 111. https://doi.org/10.1038/s43247-021-00184-w (2021).
10. Yarwood, S. A. The role of wetland microorganisms in plant-litter decomposition and soil organic matter formation: A critical
review. FEMS Microbiol. Ecol. 94(11), 1–17. https://doi.org/10.1093/femsec/fiy175 (2018).
Scientific Reports | (2021) 11:23219 | https://doi.org/10.1038/s41598-021-02606-3 12
Vol:.(1234567890)www.nature.com/scientificreports/
11. Yu, Z. C. Northern peatland carbon stocks and dynamics: A review. Biogeosciences 9(10), 4071–4085. https://doi.org/10.5194/
bg-9-4071-2012 (2012).
12. Keenan, T. F. & Williams, C. A. The terrestrial carbon sink. Annu. Rev. Environ. Resour. 43, 219–243. https://d oi.o
rg/1 0.1 146/a nnur
ev-environ-102017-030204 (2018).
13. Stocker, B. D., Yu, Z., Massa, C. & Joos, F. Holocene peatland and ice-core data constraints on the timing and magnitude of CO2
emissions from past land use. Proc. Natl. Acad. Sci. 114(7), 1492–1497. https://doi.org/10.1073/pnas.1613889114 (2017).
14. Webster, K. L. et al. Spatially-integrated estimates of net ecosystem exchange and methane fluxes from Canadian peatlands. Carbon
Balance Manage. 13(1), 5. https://doi.org/10.1186/s13021-018-0105-5 (2018).
15. Byun, E., Finkelstein, S. A., Cowling, S. A. & Badiou, P. Potential carbon loss associated with post-settlement wetland conversion
in southern Ontario, Canada. Carbon Balance Manag 13(1), 6. https://doi.org/10.1186/s13021-018-0094-4 (2018).
16. Lei, J. et al. Temporal changes in global soil respiration since 1987. Nat. Commun. 12(1), 1–9. https://doi.org/10.1038/s41467-020-
20616-z (2021).
17. Bona, K. A. et al. The Canadian model for peatlands (CaMP): A peatland carbon model for national greenhouse gas reporting.
Ecol. Model. 431, 109164. https://doi.org/10.1016/j.ecolmodel.2020.109164 (2020).
18. Brooks, P. D., McKnight, D. & Elder, K. Carbon limitation of soil respiration under winter snowpacks: Potential feedbacks between
growing season and winter carbon fluxes. Glob. Change Biol. 11(2), 231–238. https://doi.org/10.1111/j.1365-2486.2004.00877.x
(2005).
19. Helbig, M. et al. Direct and indirect climate change effects on carbon dioxide fluxes in a thawing boreal forest–wetland landscape.
Glob. Change Biol. 23(8), 3231–3248. https://doi.org/10.1111/gcb.13638 (2017).
20. Zhang, T., Wang, G., Yang, Y., Mao, T. & Chen, X. Non-growing season soil CO2 flux and its contribution to annual soil CO2
emissions in two typical grasslands in the permafrost region of the Qinghai-Tibet Plateau. Eur. J. Soil Biol. 71, 45–52. https://doi.
org/10.1016/j.ejsobi.2015.10.004 (2015).
21. Grosse, G. et al. Vulnerability of high-latitude soil organic carbon in North America to disturbance. J. Geophys. Res. 116, G00K06.
https://doi.org/10.1029/2010JG001507 (2011).
22. Hamdi, S., Moyano, F., Sall, S., Bernoux, M. & Chevallier, T. Synthesis analysis of the temperature sensitivity of soil respiration
from laboratory studies in relation to incubation methods and soil conditions. Soil Biol. Biochem. 58, 115–126. https://doi.org/10.
1016/j.soilbio.2012.11.012 (2013).
23. Conant, R. T. et al. Temperature and soil organic matter decomposition rates—synthesis of current knowledge and a way forward.
Glob. Change Biol. 17(11), 3392–3404. https://doi.org/10.1111/j.1365-2486.2011.02496.x (2011).
24. Davidson, E. A. & Janssens, I. A. Temperature sensitivity of soil carbon decomposition and feedbacks to climate change. Nature
440(7081), 165–173. https://doi.org/10.1038/nature04514 (2006).
25. Fang, C., Smith, P., Moncrieff, J. B. & Smith, J. U. Similar response of labile and resistant soil organic matter pools to changes in
temperature. Nature 433(7021), 57–59. https://doi.org/10.1038/nature03138 (2005).
26. Koven, C. D., Hugelius, G., Lawrence, D. M. & Wieder, W. R. Higher climatological temperature sensitivity of soil carbon in cold
than warm climates. Nat. Clim. Chang. 7(11), 817–822. https://doi.org/10.1038/nclimate3421 (2017).
27. Li, J. et al. Biogeographic variation in temperature sensitivity of decomposition in forest soils. Glob. Change Biol. 26(3), 1873–1885.
https://doi.org/10.1111/gcb.14838 (2020).
28. Li, J., Pei, J., Pendall, E., Fang, C. & Nie, M. Spatial heterogeneity of temperature sensitivity of soil respiration: A global analysis of
field observations. Soil Biol. Biochem. 141, 107675. https://doi.org/10.1016/j.soilbio.2019.107675 (2020).
29. Niu, B. et al. Warming homogenizes apparent temperature sensitivity of ecosystem respiration. Sci. Adv. 7(15), eabc7358. https://
doi.org/10.1126/sciadv.abc7358 (2021).
30. Wang, J., Wu, Q., Yuan, Z. & Kang, H. Soil respiration of alpine meadow is controlled by freeze-Thaw processes of active layer in
the permafrost region of the Qinghai-Tibet Plateau. Cryosphere 14(9), 2835–2848. https://d oi.o rg/1 0.5 194/t c-1 4-2 835-2 020 (2020).
31. Wang, Q. et al. Global synthesis of temperature sensitivity of soil organic carbon decomposition: Latitudinal patterns and mecha-
nisms. Funct. Ecol. 33(3), 514–523. https://doi.org/10.1111/1365-2435.13256 (2019).
32. Bradford, M. A. et al. Managing uncertainty in soil carbon feedbacks to climate change. Nat. Clim. Chang. 6(8), 751–758. https://
doi.org/10.1038/nclimate3071 (2016).
33. Pi, K. et al. The cold region critical zone in transition: Responses to climate warming and land use change. Annu. Rev. Environ.
Resour. 46(1), 1–24. https://doi.org/10.1146/annurev-environ-012220-125703 (2021).
34. Fuss, C. B. et al. Nitrate and dissolved organic carbon mobilization in response to soil freezing variability. Biogeochemistry 131(1–2),
35–47. https://doi.org/10.1007/s10533-016-0262-0 (2016).
35. Meyer, N., Welp, G. & Amelung, W. The Temperature sensitivity (Q10) of soil respiration: Controlling factors and spatial predic-
tion at regional scale based on environmental soil classes. Glob. Biogeochem. Cycles 32(2), 306–323. https://doi.org/10.1002/2017G
B005644 (2018).
36. Moyano, F. E. et al. The moisture response of soil heterotrophic respiration: Interaction with soil properties. Biogeosciences 9(3),
1173–1182. https://doi.org/10.5194/bg-9-1173-2012 (2012).
37. Schipper, L. A. et al. Shifts in temperature response of soil respiration between adjacent irrigated and non-irrigated grazed pastures.
Agr. Ecosyst. Environ. 285, 106620. https://doi.org/10.1016/j.agee.2019.106620 (2019).
38. Alster, C. J., von Fischer, J. C., Allison, S. D. & Treseder, K. K. Embracing a new paradigm for temperature sensitivity of soil
microbes. Glob. Change Biol. 26(6), 3221–3229. https://doi.org/10.1111/gcb.15053 (2020).
39. Baldwin, K. et al. Vegetation Zones of Canada: a Biogeoclimatic Perspective. Sault Ste. Marie, ON, Canada: Natural Resources
Canada, Canadian Forest Service. Great Lake Forestry Center. https://o pen.c anada.c a/d
ata/e n/d atase t/2 2b016 6b-9 db3-4 6b7-9 baf-
6584a3acc7b1 (2019).
40. Beck, H. E. et al. Present and future köppen-geiger climate classification maps at 1-km resolution. Sci. Data 5, 1–12. https://doi.
org/10.1038/sdata.2018.214 (2018).
41. Gardner, W. H. Water content. In Methods of soil analysis: Physical and mineralogical methods, agronomy series 9 (Part 1) (ed. Klute,
A.) 493–544 (Soil Science Society of America, 1986). https://doi.org/10.2136/sssabookser5.1.2ed.c21.
42. Webster, K. L., Creed, I. F., Bourbonnière, R. A. & Beall, F. D. Controls on the heterogeneity of soil respiration in a tolerant hard-
wood forest. J. Geophys. Res. 113(G3), G03018. https://doi.org/10.1029/2008JG000706 (2008).
43. Quinton, W. L. & Baltzer, J. L. The active-layer hydrology of a peat plateau with thawing permafrost (Scotty Creek, Canada).
Hydrogeol. J. 21(1), 201–220. https://doi.org/10.1007/s10040-012-0935-2 (2013).
44. Davidson, E. A., Savage, K., Verchot, L. V. & Navarro, R. Minimizing artifacts and biases in chamber-based measurements of soil
respiration. Agric. For. Meteorol. 113(1–4), 21–37. https://doi.org/10.1016/S0168-1923(02)00100-4 (2002).
45. Rezanezhad, F., Couture, R. M., Kovac, R., O’Connell, D. & Van Cappellen, P. Water table fluctuations and soil biogeochemistry:
An experimental approach using an automated soil column system. J. Hydrol. 509, 245–256. https://doi.org/10.1016/j.jhydrol.
2013.11.036 (2014).
46. Fang, C. & Moncrieff, J. B. The dependence of soil CO2 efflux on temperature. Soil Biol. Biochem. 33(2), 155–165. https://doi.org/
10.1016/S0038-0717(00)00125-5 (2001).
47. Alster, C. J., Koyama, A., Johnson, N. G., Wallenstein, M. D. & von Fischer, J. C. Temperature sensitivity of soil microbial com-
munities: An application of macromolecular rate theory to microbial respiration. J. Geophys. Res. Biogeosci. 121(6), 1420–1433.
https://doi.org/10.1002/2016JG003343 (2016).
Scientific Reports | (2021) 11:23219 | https://doi.org/10.1038/s41598-021-02606-3 13
Vol.:(0123456789)You can also read