The MOPITT Version 9 CO product: sampling enhancements and validation - Recent
←
→
Page content transcription
If your browser does not render page correctly, please read the page content below
Atmos. Meas. Tech., 15, 2325–2344, 2022
https://doi.org/10.5194/amt-15-2325-2022
© Author(s) 2022. This work is distributed under
the Creative Commons Attribution 4.0 License.

The MOPITT Version 9 CO product: sampling
enhancements and validation
Merritt Deeter1 , Gene Francis1 , John Gille1 , Debbie Mao1 , Sara Martínez-Alonso1 , Helen Worden1 , Dan Ziskin1 ,
James Drummond2,3 , Róisín Commane4 , Glenn Diskin5 , and Kathryn McKain6,7
1 Atmospheric  Chemistry Observations and Modeling Laboratory,
National Center for Atmospheric Research, Boulder, CO, USA
2 Department of Physics, University of Toronto, Toronto, Ontario, Canada
3 Department of Physics and Atmospheric Science, Dalhousie University, Halifax, Nova Scotia, Canada
4 Department of Earth and Environmental Sciences, Lamont–Doherty Earth Observatory,

Columbia University, Palisades, NY, USA
5 Langley Research Center, NASA, Hampton, VA, USA
6 Global Monitoring Laboratory, National Oceanic and Atmospheric Administration, Boulder, CO, USA
7 Cooperative Institute for Research in Environmental Sciences, University of Colorado, Boulder, CO, USA

Correspondence: Merritt Deeter (mnd@ucar.edu)

Received: 2 November 2021 – Discussion started: 15 December 2021
Revised: 28 February 2022 – Accepted: 18 March 2022 – Published: 19 April 2022

Abstract. Characteristics of the Version 9 (V9) MOPITT            1   Introduction
(Measurements of Pollution in the Troposphere) satellite re-
trieval product for tropospheric carbon monoxide (CO) are         MOPITT (Measurements of Pollution in the Troposphere)
described. The new V9 product includes many CO retrievals         is an instrument on the NASA Terra satellite which was
over land which, in previous MOPITT product versions,             launched on 18 December 1999. Measurements made by
would have been discarded by the cloud detection algorithm.       MOPITT’s gas correlation radiometers (Drummond, 1989;
Globally, the number of daytime MOPITT retrievals over            Drummond et al., 2010) operating in both thermal-infrared
land has increased by 30 %–40 % relative to the Version 8         (TIR) and near-infrared (NIR) spectral bands enable re-
product, although the increase in retrieval coverage exhibits     trievals of CO mixing ratio vertical profiles and total col-
significant geographical variability. Areas benefiting from       umn values. The MOPITT instrument has produced a unique
the improved cloud detection performance include (but are         long-term data record well suited for a variety of applica-
not limited to) source regions often characterized by high        tions. MOPITT CO products are used, for example, to fore-
aerosol concentrations. The V9 MOPITT product also in-            cast air quality (Inness et al., 2015), estimate CO emissions
corporates a modified calibration strategy for the MOPITT         (Pechony et al., 2013; Zheng et al., 2018; Nechita-Banda et
near-infrared (NIR) CO channels, resulting in greater tem-        al., 2018; Gaubert et al., 2020), and validate other satellite
poral consistency for the NIR-only and thermal-infrared–          products (Martínez-Alonso et al., 2014, 2020). Over the last
near-infrared (TIR–NIR) retrieval variants. Validation results    two decades, MOPITT retrieval products have improved con-
based on in situ CO profiles acquired from aircraft in a vari-    tinuously as knowledge has improved regarding the instru-
ety of contexts indicate that retrieval biases for V9 are typi-   ment, radiative transfer modeling, and geophysical variables
cally within the range of ±5 % and are generally comparable       (Worden et al., 2014; Deeter et al., 2017).
to results for the V8 product.                                       MOPITT retrievals of CO volume mixing ratio (VMR)
                                                                  are generated with an optimal estimation-based retrieval al-
                                                                  gorithm (Deeter et al., 2003). CO retrievals are based on a
                                                                  log(VMR) state vector (Deeter et al., 2007a) and are per-
                                                                  formed on a retrieval grid with 10 pressure levels (surface,

Published by Copernicus Publications on behalf of the European Geosciences Union.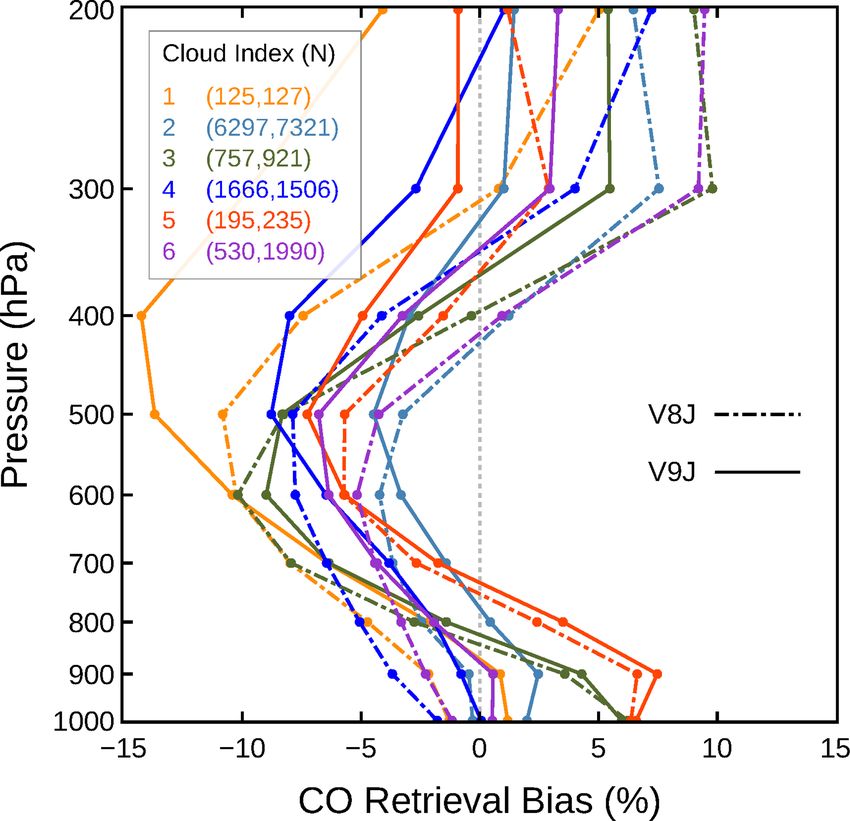
2326                                                                                     M. Deeter et al.: MOPITT Version 9

900, 800, . . . , 100 hPa). Retrieval layers, used internally in   sions to the cloud detection algorithm resulting in signifi-
the MOPITT retrieval algorithm, are defined by the layers          cantly enhanced retrieval coverage were described and an-
between each level in this grid and the next-highest level in      alyzed previously in Deeter et al. (2021). V9 validation re-
the grid (Francis et al., 2017). Thus, for example, the surface-   sults based on in situ measurements acquired from aircraft
level retrieval product actually represents the mean VMR for       are compared with corresponding V8 validation results in
the layer between the surface and 900 hPa. (For the topmost        Sect. 3. Changes in retrieval sampling characteristics due to
MOPITT retrieval level at 100 hPa, the uniform-VMR layer           the revised cloud detection algorithm and their impacts are
extends from 100 to 50 hPa. Assumed VMR values in the              analyzed in Sect. 4. Finally, conclusions are presented and
layer from 50 hPa to the top of the atmosphere (TOA) are           discussed in Sect. 5.
based on the Community Atmosphere Model with Chem-
istry (CAM-chem) model climatology and are fixed.) Re-
trieved CO total column values are calculated directly from        2     Version 9 algorithm revisions
the CO profile and are not retrieved independently. A priori
CO profiles are derived from a model climatology based on          2.1    Calibration
the CAM-chem chemical transport model (Lamarque et al.,
2012) and vary seasonally and geographically; the a priori         Calibration of MOPITT’s NIR radiances (6A and 6D)
climatology used for V9 products is identical to the climatol-     relies on a two-point calibration scheme involving both
ogy used for processing MOPITT Version 6, Version 7, and           cold-calibration (“cold-cal”) and hot-calibration (“hot-cal”)
Version 8 products (Deeter et al., 2014, 2017, 2019). MO-          events. Cold-cals are performed by pointing the scanning
PITT a priori log(VMR) profiles vary by month but do not           mirrors to space and occur many times per day. In contrast,
vary from year to year; this simplifies the interpretation of      hot-cals are typically performed annually as they require the
long-term trends in the data. Model-based climatologies used       execution of special instrument operations during which the
to generate the a priori are gridded at 1◦ (lat/long) horizon-     internal blackbody is heated to ∼ 460 K (Drummond et al.,
tal resolution and monthly temporal resolution. Spatial and        2010). Ideally, NIR-channel radiances are calibrated using
temporal interpolation are used to generate a priori values at     hot-cals occurring both before and after the time of obser-
each specific observation location and day.                        vation. While this method is feasible in retrospective pro-
   All MOPITT CO retrievals are based on a specific subset         cessing mode (i.e., processing previous years of data), it is
of the Average (A) and Difference (D) radiances from MO-           not possible in forward processing mode (i.e., when process-
PITT channels 5, 6, and 7; each channel is associated with         ing recently acquired observations). Thus, in forward pro-
a particular TIR or NIR gas correlation radiometer (Drum-          cessing mode, only information from the most recent hot-
mond et al., 2010). Radiometers on MOPITT corresponding            cal is used to calibrate MOPITT’s NIR radiances. Compar-
to channels 1–4 became inoperative in 2001 due to the failure      isons of NIR-only retrieval products generated in retrospec-
of one of two coolers. TIR-only retrievals are based on the        tive and forward processing modes may exhibit significant
5A, 5D, and 7D radiances in the 4.7 µm band, whereas NIR-          differences (10 % to 20 %) in total column results, with the
only retrievals are based solely on the ratio of the 6D and 6A     retrospectively processed data being more reliable (Deeter
radiances in the 2.3 µm band. MOPITT TIR-only retrievals           et al., 2017). Therefore, because of the degraded quality of
are typically most sensitive to CO in the mid-troposphere and      MOPITT products processed in forward processing mode,
upper troposphere, except in scenes characterized by strong        V8 and V9 products generated in this manner are labeled as
thermal contrast (Deeter et al., 2007b). MOPITT NIR-only           “beta” products to distinguish them from standard archival
retrievals are most useful for retrievals of CO total column       products. Beta products are eventually replaced by standard
(Deeter et al., 2009; Worden et al., 2010). Unique “multi-         archival files following the next hot-cal. Typically, this oc-
spectral” or “joint” TIR–NIR retrievals exploit the 5A, 5D,        curs no more than a year after the time of a particular ob-
7D, 6D, and 6A radiances. This variant offers finer vertical       servation (depending on the date of the most recent hot-cal).
resolution than the TIR-only and NIR-only variants and fea-        Thus, beta products are considered provisional and should
tures the greatest sensitivity to CO in the lower troposphere      not be exploited for quantitative analyses.
(Deeter et al., 2013). However, because NIR measurements              For V9, the NIR calibration methodology for retrospec-
rely on reflected solar radiation, the benefits of the TIR–NIR     tive processing has been significantly revised. Hot-cals are
variant are limited to daytime MOPITT observations over            typically performed annually, usually in March, in conjunc-
land.                                                              tion with a decontamination procedure; the entire series of
   This paper describes features of the new MOPITT V9              instrument operations typically requires 12–13 d. In most
product which will be relevant to a wide spectrum of users.        years, hot-cals are executed both immediately before and af-
Changes to the processing algorithms used to produce the V9        ter the decontamination procedure. For previous MOPITT
CO product are discussed in Sect. 2. These include signifi-        products, including V8, NIR calibration for archival (non-
cant changes to (1) the method used to calibrate MOPITT’s          beta) products relied on the closest bracketing hot-cals such
NIR radiances and (2) the cloud detection algorithm. Revi-         that, usually, NIR radiances for a given date were calibrated

Atmos. Meas. Tech., 15, 2325–2344, 2022                                             https://doi.org/10.5194/amt-15-2325-2022
M. Deeter et al.: MOPITT Version 9                                                                                           2327

using the most recent previous post-decontamination hot-           vision of the L0-L1 Algorithm Theoretical Basis Document
cal and the next pre-decontamination hot-cal. For example,         (ATBD).
for V8, NIR radiances observed between 5 March 2016 and
5 March 2017 were calibrated using information from the            2.2   Radiative transfer modeling
post-decontamination hot-cal on 4 March 2016 and the pre-
decontamination hot-cal on 6 March 2017.                           The operational MOPITT radiative transfer model, known as
   However, it was recently discovered that this NIR cali-         MOPFAS, is updated monthly with information describing
bration strategy often results in a growing retrieval bias in      the mean instrument state for that month, including the pres-
the NIR-only products over the period between the two hot-         sures and temperatures in the gas correlation cells (Edwards
cals used for calibration. As illustrated in Fig. 1, this time-    et al., 1999; Deeter et al., 2013). For V9, operational mod-
dependent bias is most obvious when comparing TIR-only             eling of the MOPITT pressure modulation cell (PMC) radi-
and NIR-only CO products immediately before and after a            ances (7A and 7D) now also includes monthly updated values
particular hot-cal/decontamination cycle. Time series plots        for the cell number density. The optical depth is calculated
of daily-mean CO total column values are shown in the top          as the product of the cross-section, number density, and cell
panel for the V9 TIR-only (V9T), V8 NIR-only (V8N), and            length. Monthly variations in cell pressure (P ) and tempera-
V9 NIR-only (V9N) products for all daytime retrievals over         ture (T ) affect the number density, which is proportional to
land regions between 60◦ S and 60◦ N. Time series are shown        P /T . This dependency is now explicitly represented in V9.
in the bottom panel for 1CO total column values obtained           This correction removes a small but slowly growing bias in
by subtracting daily-mean V9T CO total column values from          the 7D PMC radiance (0 % in 2006, 3 % in 2018) which is
corresponding V8N and V9N daily-mean values. Although              large enough to introduce a non-negligible long-term trend
NIR-only and TIR-only retrievals are characterized by dif-         in CO retrieval bias. The operational radiative transfer model
ferent vertical sensitivities and are therefore not expected to    for V9 is based on HITRAN12 (Rothman et al., 2013), which
agree precisely, V9T total column values are a useful refer-       is the same version of HITRAN used for MOPITT V7 and
ence because they are unaffected by NIR calibration issues.        V8 processing.
Thus, TIR-only and NIR-only CO total column values aver-              The MOPITT retrieval algorithm exploits radiance bias
aged over large spatial scales should be expected to exhibit a     correction factors to compensate for relative biases between
very similar annual cycle.                                         simulated radiances calculated by MOPFAS and actual cali-
   Vertical gray bars shown in the upper and lower pan-            brated Level 1 radiances from the instrument. Radiance bias
els of Fig. 1 indicate periods during which the annual hot-        correction factors compensate for a variety of potential bias
calibration and decontamination procedures were performed.         sources including errors in instrumental specifications, for-
For each of the years shown from 2016 to 2020, the 1CO             ward model errors related to the development of MOPFAS,
total column time series for V8N (plotted in blue) exhibits        errors in assumed spectroscopic data, and geophysical errors
a physically unrealistic discontinuity when comparing dates        (Deeter et al., 2014). Within the retrieval algorithm, these
just before a pre-decontamination hot-cal with dates just af-      correction factors are applied by scaling the simulated radi-
ter the post-decontamination hot-cal several weeks later. For      ances produced by MOPFAS each time it is executed.
example, in 2019, 1CO total column for V8N increased                  As introduced in V8 processing, a radiance bias correction
from about −2 × 10¹⁷ molecules cm−2 just before the pre-           is based on a parameterization involving both (1) the date of
decontamination hot-cal to close to 0 just after the post-         the MOPITT observation and (2) the water vapor total col-
decontamination hot-cal. While the physical source of this         umn at the time and geographic location of the MOPITT ob-
discontinuity is not yet fully understood, it suggests that the    servation, as derived from the MERRA-2 (https://gmao.gsfc.
pre- and post-decontamination hot-cals are not consistent          nasa.gov/reanalysis/MERRA-2/, last access: 11 April 2022)
with each other and are not equally useful for calibration.        water vapor profiles needed to execute MOPFAS (Deeter et
   Experiments were performed to develop an improved NIR           al., 2019). Within the retrieval software, the radiance bias
calibration strategy for V9. It was found that the typical dis-    correction factors for V8 and V9 are calculated using the re-
continuity in 1CO total column values before and after the         lation
hot-cal and decontamination cycle was greatly reduced when         R i = R0i + Rti Ndys + Rw
                                                                                           i
                                                                                             WV,                               (1)
only post-decontamination hot-cals were used for calibra-
tion. The 1CO total column time series using this strategy,        where R i is the multiplicative radiance correction factor to be
which was implemented for V9N operational processing, is           applied to the model-simulated value for radiance i; Ndys is
plotted in purple in the bottom panel of Fig. 1. For each of the   the number of elapsed days since 1 January 2000; WV is the
years shown, the improved stability of the V9N product com-        water vapor total column (or “precipitable water vapor”, ex-
pared to V8N is clearly evident. Additional details regarding      pressed in molecules cm−2 ) determined from the MERRA-2
the specific hot-cals used for NIR calibration in V9 over the      reanalysis (temporally and spatially interpolated to the time
entire MOPITT mission will be reported in a forthcoming re-        and location of the MOPITT observation); and R0 , Rt , and
                                                                   Rw are the empirically determined parameters which effec-

https://doi.org/10.5194/amt-15-2325-2022                                             Atmos. Meas. Tech., 15, 2325–2344, 2022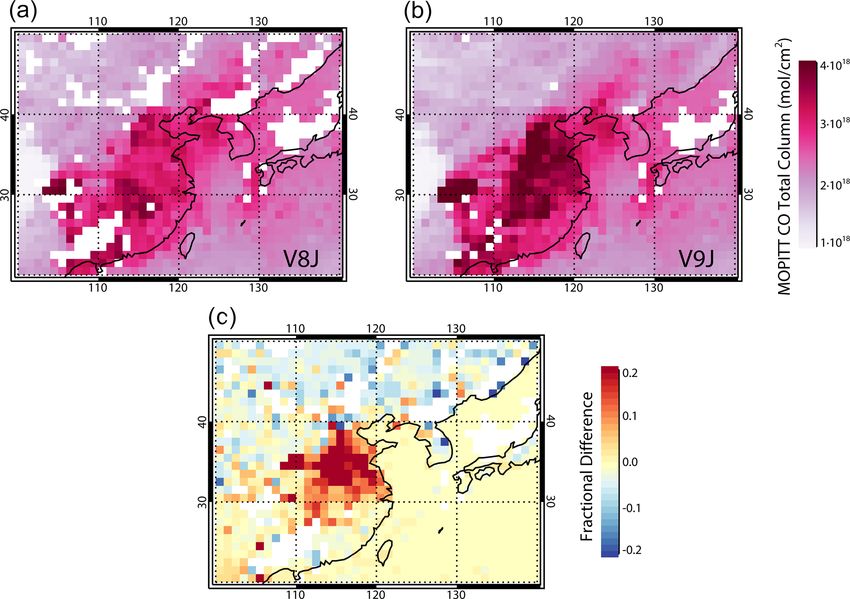
2328                                                                                             M. Deeter et al.: MOPITT Version 9

Figure 1. Time series comparisons of daily-mean CO total column (a) and 1CO total column (b) for daytime/land retrievals between 60◦ S
and 60◦ N (as described in Sect. 2.1) for the V9T, V8N, and V9N variants. 1CO total column time series in panel (b) are obtained by
subtracting the V9T total column time series (plotted in red in panel a) from the V8N (blue) and V9N (purple) time series. Vertical gray
bars indicate periods during which the annual hot-calibration and decontamination procedures were performed. Discontinuities in 1CO total
column for dates just before and after the hot-cal/decontamination events for the V8N variant (blue) are largely resolved for the V9N variant
(purple).

tively minimize overall retrieval bias, bias drift, and bias wa-         2.3   Cloud detection
ter vapor sensitivity.
   Values of R0 , Rt , and Rw for the 5A, 5D, 6D, and 7D ra-             Because the MOPITT radiative transfer model simulates ra-
diances used for V8 and V9 operational processing are listed             diances only in clear-sky conditions, MOPITT observations
in Table 1. (Since the use of MOPITT’s NIR radiances in the              affected by clouds are not used in Level 2 retrieval pro-
retrieval algorithm only involves the ratio of the 6D and 6A             cessing. The clear/cloudy determination is performed by a
radiances, values of R0 , Rt , and Rw for the 6A radiance are            cloud detection algorithm which involves both MOPITT’s
not optimized as they are for the other radiances. Thus, for             thermal-channel radiances and information from the Terra-
6A, R0 is set to 1, while Rt and Rw are both set to 0.) V9 val-          MODIS (Moderate Resolution Imaging Spectroradiometer)
ues are identical to the corresponding values used for V8 pro-           cloud mask product (Warner et al., 2001; Francis et al.,
cessing, except for the R0 and Rt values for 6D and 7D. V9               2017). With respect to the MOPITT thermal-channel test, the
values of R0 and Rt values were re-optimized for 6D because              ratio of the observed MOPITT Channel 7 Average radiance
of the revised calibration scheme described in Sect. 2.1. Val-           and the corresponding model-calculated value is compared
ues of R0 and Rt values were re-optimized for 7D due to                  to a predefined global threshold value. If the radiance ratio
the forward model corrections related to PMC modeling. The               is less than the threshold value, that MOPITT observation is
methods used to optimize the R0 and Rt values for 6D and 7D              flagged as cloudy. For V9, the radiance ratio for each MO-
are described in Deeter et al. (2019). As indicated in Table 1,          PITT retrieval is reported in the new diagnostic “MOPCld
V9 radiance bias correction factors for 7D are smaller than              Rad Ratio”.
the corresponding correction factors for V8, suggesting that                The overall outcome of the MOPITT cloud detection al-
the PMC model revisions in MOPFAS implemented for V9                     gorithm for a particular retrieval is described by the “Cloud
resolved a substantial component of the discrepancy between              Description” diagnostic in the Level 2 files. The Cloud De-
observed and model-calculated radiances for Channel 7.                   scription diagnostic values (1–6) are defined as follows:
                                                                           1. MOPITT clear, MODIS cloud mask unavailable;

Atmos. Meas. Tech., 15, 2325–2344, 2022                                                    https://doi.org/10.5194/amt-15-2325-2022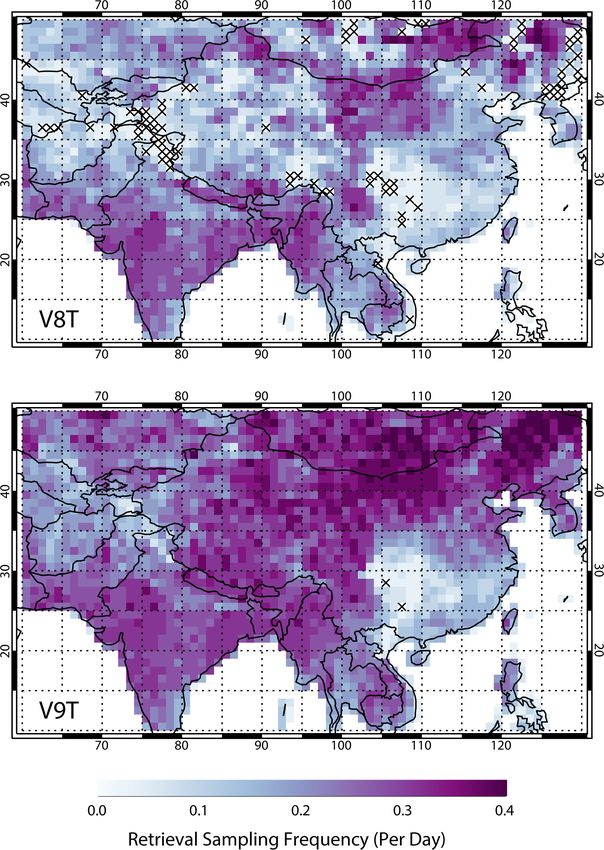
M. Deeter et al.: MOPITT Version 9                                                                                                 2329

Table 1. Radiance bias correction parameters used for processing MOPITT Version 9 retrieval products. See Sect. 2.2. R0 is dimensionless.
Units of Rt and Rw are day−1 and (molecules cm−2 )−1 , respectively. Corresponding V8 values are indicated in parentheses only where they
are different than V9 values.

                           5A                5D         6A                           6D                               7D
               R0     1.05970          1.04522     1.00000            0.99270 (0.99522)               1.00955 (1.04959)
               Rt          0.0              0.0         0.0    7.14 × 10⁻⁷ (9.6 × 10⁻⁷ )    −2.0 × 10⁻⁶ (−1.18 × 10⁻⁵ )
               Rw          0.0   −8.09 × 10⁻²⁷         0.0                          0.0                  −6.00 × 10⁻²⁵

  2. MOPITT clear, MODIS cloud mask clear;                             where the MODIS cloud mask tests indicate clouds (or are
                                                                       ambiguous) while the MOPITT TIR radiances are consistent
  3. MOPITT cloudy, MODIS cloud mask clear;                            with clear-sky conditions. Consequently, this change should
                                                                       allow the retrieval of scenes for which clouds in the MO-
  4. MOPITT clear, MODIS cloud mask indicates low
                                                                       PITT field of view have a negligible effect on the MOPITT
     clouds only;
                                                                       radiances. MOPITT retrievals for which the MODIS cloud
  5. polar regions, MODIS cloud mask clear (no MOPITT                  mask considers the observation to be cloudy while the MO-
     test); and                                                        PITT thermal-channel test passes the observation as clear are
                                                                       assigned the Cloud Description index of 6 and can therefore
  6. MOPITT clear, MODIS cloudy.                                       be analyzed separately from retrievals where MODIS deter-
                                                                       mined the scene to be clear. Prior to V9, this value for the
This last class (6) was first introduced in the V7 product and         Cloud Description index was only allowed for observations
was applied only to ocean scenes as a response to declining            over the ocean.
quality in the MODIS cloud mask (Deeter et al., 2017).                    Finally, a minor change was also made in the revised cloud
   For the V9 product, two significant changes were im-                detection algorithm regarding cloud index 4 (MOPITT clear,
plemented in the revised cloud detection algorithm (Deeter             MODIS indicating low clouds). In the revised algorithm, this
et al., 2021). The first change is related to the interpreta-          index is only applied to observations over the ocean, where
tion of the MODIS cloud mask, whereas the second change                low clouds are more reliably detected. Retrievals over land
concerns the treatment of observations deemed cloudy by                which would have been assigned a cloud index value of 4
the MODIS cloud mask but clear by the MOPITT thermal-                  in the V8 algorithm are assigned a cloud index value of
channel test. Together, these changes significantly increase           6 in V9. Thresholds for the MODIS cloud mask and MO-
MOPITT retrieval coverage over land.                                   PITT thermal-channel tests for V9 are unchanged relative to
   The MODIS cloud mask reports one of four possible out-              the values used for the MOPITT Version 8 product; i.e., the
comes for each MODIS 1 km pixel: Cloudy, Uncertain, Prob-              MODIS clear-sky fraction threshold is set to 0.95, and the
ably Clear, or Clear. An individual MOPITT pixel typi-                 MOPITT radiance ratio threshold is set to 1.00.
cally encloses ∼ 500 MODIS 1 km pixels. Prior to V9, the                  In addition to the Cloud Description diagnostic, a sepa-
MOPITT cloud detection algorithm interpreted the Probably              rate diagnostic is provided for each retrieval in the Level 2
Clear and Clear outcomes as clear and treated the Cloudy               product file to quantify the results of the various cloud tests
and Uncertain outcomes as cloudy. If at least 95 % of the              applied to the set of MODIS Cloud Mask pixels matched to
MODIS cloud mask pixels enclosed within a given MOPITT                 each MOPITT pixel (Francis et al., 2017). This diagnostic,
pixel indicated either Probably Clear or Clear, that MOPITT            which has been revised for V9, may be of use for analyzing
pixel was considered clear according to MODIS. For V9 pro-             potential retrieval biases associated with particular types of
cessing, the MODIS cloud mask test was relaxed to treat Un-            scenes. For V9, elements of the 12-element “MODIS Cloud
certain MODIS pixels as clear in the same manner as Clear              Diagnostics” floating point vector indicate
and Probably Clear MODIS pixels. This change was moti-
vated by the observation that such MODIS pixels can often                1. number of valid MODIS pixels;
be found in apparently cloudless but heavily polluted scenes
(Deeter et al., 2021).                                                   2. percentage of cloudy MODIS pixels;
   For V8 and earlier MOPITT products, observations over
land were typically discarded if the MODIS cloud mask in-                3. percentage of clear MODIS pixels, test 1;
dicated clouds. In V9, however, observations over land are               4. percentage of clear MODIS pixels, test 2;
only discarded if both the MODIS cloud mask and MOPITT
radiance tests indicate the presence of clouds; this change              5. percentage of clear MODIS pixels, test 3;
was introduced earlier for observations over the ocean, begin-
ning with V7 products. It allows MOPITT retrievals in cases              6. average value of “sun glint” MODIS flag;

https://doi.org/10.5194/amt-15-2325-2022                                                   Atmos. Meas. Tech., 15, 2325–2344, 2022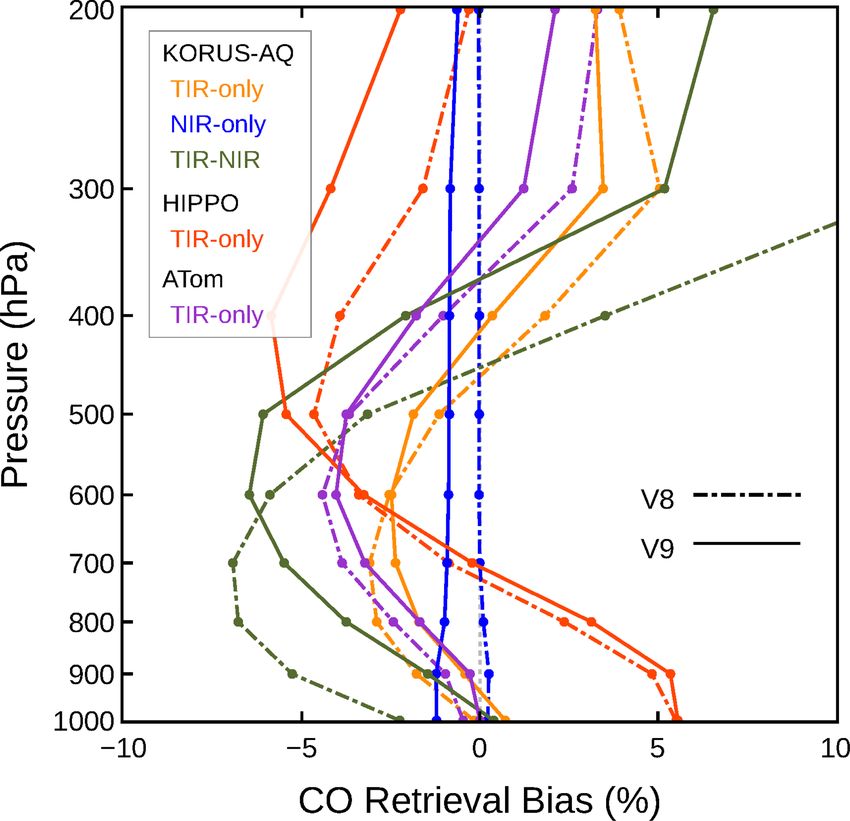
2330                                                                                           M. Deeter et al.: MOPITT Version 9

    7. average value of “snow/ice background” MODIS flag;               where x obs is the observed (retrieved) MOPITT profile cor-
                                                                        responding to x sim .
    8. average value of “non-cloud obstruction” MODIS flag;                Previously reported validation results based on a set of
    9. average value of “IR threshold test” MODIS flag;                 aircraft profiles over the Amazon Basin demonstrated that
                                                                        retrieval biases for the V8 TIR-only product and an exper-
10. average value of “IR temperature difference tests”                  imental product incorporating the cloud detection revisions
    MODIS flag;                                                         described in Sect. 2.3 were within about 3 % at all levels
11. average value of “visible reflectance test” MODIS flag;             (Deeter et al., 2021). However, since the disparities were sim-
    and                                                                 ilar to the estimated accuracy of the in situ measurements,
                                                                        the difference in biases was not considered significant. Be-
12. fraction of valid MODIS pixels.                                     low, we compare V8 and V9 validation results over a much
                                                                        larger set of aircraft profiles drawn from both a long-term
   Elements 3, 4, and 5 of the Cloud Diagnostics vector re-
                                                                        measurement program operated by NOAA and several field
port the percentage of clear-sky MODIS pixels within the
                                                                        campaigns. While the validation results reported below are
MOPITT pixel according to three tests with varying levels
                                                                        useful for estimating the magnitude of expected retrieval bias
of confidence. Test 1 (vector element 3) reports the clear-sky
                                                                        and drift, they should not be used as the basis for applying ad
percentage based solely on Clear outcomes for the MODIS
                                                                        hoc corrections to the MOPITT data.
cloud mask and is therefore the strictest test. Test 2 (ele-
ment 4) reports the clear-sky percentage considering both
                                                                        3.1   NOAA aircraft profiles
Clear and Probably Clear MODIS cloud mask outcomes as
clear and corresponds to the cloud mask test used in prior
                                                                        V8 and V9 validation results reported below are based on
versions of the MOPITT cloud detection algorithm. Finally,
                                                                        a large set of CO vertical profiles measured by the NOAA
test 3 (element 5) reports the clear-sky percentage consid-
                                                                        Global Monitoring Laboratory using an airborne flask-
ering Clear, Probably Clear, and Uncertain MODIS cloud
                                                                        sampling system followed by laboratory analysis (Sweeney
mask outcomes as clear. For V9, this last test actually deter-
                                                                        et al., 2021). Typical in situ profiles are derived from a set of
mines whether MODIS classifies the MOPITT pixel as clear
                                                                        12 flasks acquired as the aircraft descends. Reproducibility
or cloudy. Elements 3 and 5 in the Cloud Diagnostics vec-
                                                                        of the laboratory-measured CO dry-air mole fractions, which
tor represent information not previously included in the MO-
                                                                        are measured by either a vacuum UV–resonance fluores-
PITT product.
                                                                        cence spectrometer or a reduction gas analyzer, is better than
                                                                        1 ppb. Total uncertainty values for the flask measurements in-
3    Validation                                                         crease monotonically with CO mole fraction from ∼ 1.2 ppb
                                                                        at 100 ppb to ∼ 3.5 ppb at 500 ppb (https://gml.noaa.gov/
Retrieval validation results for the V9 product are com-                ccl/ccl_uncertainties.html, last access: 11 April 2022). All
pared with corresponding results for the V8 product be-                 NOAA flask sample profiles were calibrated using the WMO
low. Validation results are based on quantitative comparisons           CO X2014A scale (https://gml.noaa.gov/ccl/co_scale.html,
of MOPITT retrieval products (CO VMR profiles and total                 last access: 11 April 2022). Results reported below are based
columns) with in situ vertical profiles measured from air-              on NOAA vertical profiles obtained from flights at 21 fixed
craft. In situ measurements are assumed to be exact and rep-            sites (mainly over North America) between 2000 and 2020.
resentative of a defined region surrounding the sampling lo-            The consistency, long record, and high accuracy character-
cation. When making quantitative comparisons of MOPITT                  izing this set of profiles is the basis for its use in optimiz-
retrieved CO profiles and in situ profiles, the in situ data must       ing the radiance bias correction factors and for quantifying
be transformed to represent the effects of smoothing error              long-term changes in MOPITT retrieval biases (Deeter et al.,
and inclusion of a priori information (Deeter et al., 2003).            2003, 2019).
Simulated retrievals based on in situ vertical profiles are cal-           For matching MOPITT retrieved profiles with the NOAA
culated using the equation                                              in situ profiles, a maximum separation of 50 km was em-
                                                                        ployed (relative to the center of the MOPITT 22 by 22 km
x sim = x a + A(x true − x a ),                                  (2)    footprint) and a maximum of 12 h was allowed between the
where x sim is the simulated retrieval, A is the retrieval aver-        time of the MOPITT observation and sampling time of the
aging kernel matrix, x a is the a priori profile, and x true is the     in situ data. In order to obtain a complete validation pro-
true (in situ) profile. For consistency with the MOPITT re-             file for comparison with MOPITT retrievals, each in situ
trieval algorithm, the vector quantities x sim , x a , and x true are   profile was extended vertically above the highest-altitude in
expressed in terms of log(VMR) rather than VMR. Retrieval               situ measurement using the CAM-chem chemical transport
error 1x is then calculated as                                          model (Lamarque et al., 2012) and then resampled to the
                                                                        standard pressure grid used for the MOPITT operational ra-
1x = x obs − x sim ,                                             (3)    diative transfer model (Martínez-Alonso et al., 2014). Vali-

Atmos. Meas. Tech., 15, 2325–2344, 2022                                                  https://doi.org/10.5194/amt-15-2325-2022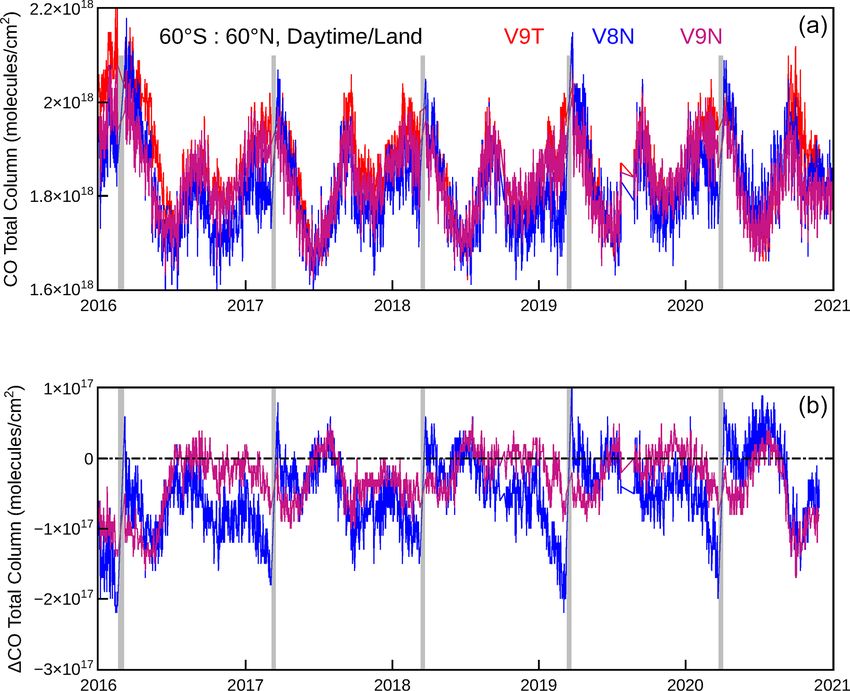
M. Deeter et al.: MOPITT Version 9                                                                                                2331

dation results for the MOPITT 100 hPa retrieval level are not           (200–300 hPa). Total column bias drift for V9 is also
reported below, since in situ data are generally unavailable            larger than for V8 (−3.16 × 10¹⁴ molecules cm−2 yr−1 vs.
from aircraft for the atmospheric layer above this height.              −2.27 × 10¹⁴ molecules cm−2 yr−1 ) but is smaller than total
   Validation results derived from the NOAA aircraft flask              column bias drift values for both the V9 TIR-only and V9
samples for the V8 and V9 TIR-only (V8T and V9T), NIR-                  NIR-only variants.
only (V8N and V9N), and joint TIR–NIR (V8J and V9J)                        Standard deviation values are also listed in Table 2. Al-
variants are compared in Fig. 2. Validation statistics for to-          though this metric is often used to characterize random re-
tal column and alternating retrieval levels (surface, 800, 600,         trieval error, it is also influenced by limitations of the ref-
400, and 200 hPa) are also summarized in Table 2. The left              erence dataset used for validation. For example, the use of
panel in Fig. 2 shows the mean retrieval bias versus pressure           a single set of 12 flask measurements at discrete altitudes
level and is obtained by calculating the mean log(VMR) re-              to fully represent the CO distribution sampled by MOPITT
trieval error over all MOPITT retrievals matched to one of the          likely exaggerates the actual retrieval error for several rea-
NOAA in situ profiles according to the matching criteria de-            sons including (1) fine-scale CO vertical variability not rep-
scribed above. Retrieval error is calculated for each retrieval         resented by the relatively coarse set of in situ measurements,
by subtracting the simulated in situ-based value (as calcu-             (2) horizontal CO variability within the co-location radius,
lated using Eq. 3) from the actual retrieved value. Retrieval           (3) temporal CO variability during the delay between the in
bias values are converted from 1(log(VMR)) to percent as                situ sampling and MOPITT overpass, and (4) the lack of
described in Deeter et al. (2017). The panel on the right side          in situ measurements at high altitudes (e.g., above 10 km).
of Fig. 2 presents the retrieval bias drift at each pressure level      Thus, the standard deviation values listed in Table 2 should
as calculated using a least-squares fit to log(VMR) retrieval           be interpreted only as an upper bound for the actual random
error as a function of time.                                            retrieval error. Alternative methods for analyzing random re-
   Overall retrieval bias values for the V9 TIR-only                    trieval error will be the topic of a future study.
variant based on the NOAA profile set are generally
in the range of a few percent and are comparable                        3.2   Cloud index
to corresponding V8 TIR-only values. The mean to-
tal column bias for V9, listed in Table 2, is slightly                  As described in Sect. 2.3, a cloud index diagnostic (1–6) is
smaller than for V8 (9.69 × 10¹⁵ molecules cm−2 vs.                     included in the MOPITT Level 2 data files for each retrieved
1.33 × 10¹⁶ molecules cm−2 ). Retrieval bias drift for the V9           profile and indicates the manner in which that observation
TIR-only variant is less than 0.2 % yr−1 at all levels and is           passed the cloud detection algorithm. V8 and V9 retrieval bi-
similar in magnitude to values for the V8 TIR-only vari-                ases for each of the six cloud index subsets are analyzed in
ant. However, total column bias drift is somewhat larger                Appendix A. The analysis is based on the same NOAA pro-
for V9 than for V8 (1.52 × 10¹⁵ molecules cm−2 yr−1 vs.                 file set for which the aggregate validation statistics are shown
1.17 × 10¹⁵ molecules cm−2 yr−1 ).                                      in Fig. 2. Except for cloud index 1, which represents only
   As shown in Fig. 2, NOAA validation results for the V9               ∼ 1 % of the analyzed data, results presented in Appendix A
NIR-only variant are slightly worse than for the V8 NIR-only            show that biases for the cloud index subsets are in the range
variant. Nevertheless, for the V9 NIR-only variant, retrieval           of ±5 % for the V9 TIR-only results, ±2 % for the V9 NIR-
bias is still less than 1 % at all levels and retrieval bias drift is   only results, and ±10 % for the V9 TIR–NIR results. Com-
generally less than 0.2 % yr−1 at all levels. Total column bias         pared to the biases for the non-subsetted NOAA validation
and bias drift for the V9 NIR-only variant are 4.60 × 10¹⁵              results (shown in Fig. 2), bias differences associated with the
and 3.27 × 10¹⁵ molecules cm−2 yr−1 , both of which are im-             different cloud index values are generally no more than 2 %–
proved relative to the V8 NIR-only variant.                             3 %. Previous results of an analysis presented in Deeter et
   Retrieval biases for the V9 TIR–NIR variant are                      al. (2021) demonstrated that retrieval errors for the retrievals
generally larger (in magnitude) than for the V9 TIR-                    added because of changes to the cloud detection algorithm
only and NIR-only variants but are similar to values                    were consistent with the retrieval errors for retrievals result-
for the V8 TIR–NIR variant. Retrieval bias for the                      ing from the original cloud detection algorithm.
V9 TIR–NIR variant varies from −5.82 % at 500 hPa
to 1.90 % at the surface. Total column bias is some-                    3.3   Field campaigns
what smaller for the V9 TIR–NIR variant compared
to the V8 TIR–NIR variant (1.60 × 10¹⁶ molecules cm−2                   The new V9 product was also separately validated using
vs. 1.82 × 10¹⁶ molecules cm−2 ). Bias drift for the V9                 CO in situ profiles measured during the HIPPO (HIA-
TIR–NIR variant varies from −0.22 % yr−1 at 700 hPa                     PER Pole-to-Pole Observations), ATom (Atmospheric To-
to 0.37 % yr−1 at 200 hPa. V9 bias drift is smaller (in                 mography Mission, https://espo.nasa.gov/atom, last access:
magnitude) than for the V8 TIR–NIR at the surface                       11 April 2022), and KORUS-AQ (Korea-United States Air
but is larger than V8 bias drift values in both the                     Quality study, https://espo.nasa.gov/korus-aq, last access:
lower troposphere (600–900 hPa) and upper troposphere                   11 April 2022) field campaigns. Both the HIPPO and ATom

https://doi.org/10.5194/amt-15-2325-2022                                                  Atmos. Meas. Tech., 15, 2325–2344, 2022
2332                                                                                             M. Deeter et al.: MOPITT Version 9

Table 2. Summarized validation results for V8 and V9 TIR-only (V8T and V9T), NIR-only (V8N and V9N), and TIR–NIR (V8J and V9J)
variants based on in situ data from NOAA aircraft validation sites. Total number of MOPITT retrievals used for validation is shown in
parentheses in the leftmost column. Bias and standard deviation (SD) statistics for the total column are given in units of molecules cm−2 .
Bias and SD for retrieval levels are expressed in percent (%). Total column drift values are provided in units of molecules cm−2 yr−1 . Drift
for the retrieval levels is expressed in % yr−1 .

                              Total column            Surface            800 hPa            600 hPa            400 hPa            200 hPa
 V8T         bias              1.33 × 10¹⁶              0.36             −0.93              −1.69                1.30               2.85
 (9746)       SD               2.01 × 10¹⁷              8.02               9.70              11.71              19.51              15.33
             drift   (−1.17 ± 0.42) × 1015    −0.022 ± 0.017     −0.030 ± 0.021     −0.059 ± 0.025     −0.102 ± 0.041     −0.079 ± 0.032
 V9T         bias              9.69 × 10¹⁵              1.05               0.05             −1.59              −0.88                 0.61
 (12 393)     SD               2.16 × 10¹⁷              7.79               9.70              12.35              21.22               15.76
             drift   (−1.52 ± 0.41) × 1015    −0.078 ± 0.015     −0.132 ± 0.018     −0.117 ± 0.023     −0.001 ± 0.040       0.075 ± 0.030
 V8N         bias              1.96 × 10¹⁶              0.37                0.29               0.20               0.32             −0.10
 (4540)       SD               2.46 × 10¹⁷             10.97               11.21              10.86              12.12               8.35
             drift    (3.80 ± 0.80) × 1015     0.180 ± 0.036       0.211 ± 0.037      0.220 ± 0.035      0.240 ± 0.039      0.181 ± 0.027
 V9N         bias              4.60 × 10¹⁵            −0.31               −0.48              −0.52              −0.40              −0.59
 (7018)       SD               2.45 × 10¹⁷             10.42               10.72              10.50              12.19               7.92
             drift    (3.27 ± 0.63) × 1015     0.149 ± 0.027       0.175 ± 0.028      0.181 ± 0.027      0.200 ± 0.031      0.143 ± 0.020
 V8J         bias              1.82 × 10¹⁶               0.04            −2.90              −5.47              −0.00                 6.84
 (9570)       SD               2.29 × 10¹⁷              17.16             17.37              14.48              24.99               27.34
             drift   (−2.27 ± 4.88) × 1014      0.097 ± 0.037    −0.002 ± 0.037     −0.084 ± 0.031     −0.108 ± 0.053       0.074 ± 0.058
 V9J         bias              1.60 × 10¹⁶              1.90             −0.35              −4.76               −3.76                1.90
 (12 100)     SD               2.42 × 10¹⁷             17.81              17.37              14.76               27.34              26.67
             drift   (−3.16 ± 4.58) × 1014    −0.028 ± 0.034     −0.204 ± 0.033     −0.186 ± 0.028       0.073 ± 0.052      0.365 ± 0.050

Figure 2. Comparison of V8 and V9 validation results based on the NOAA aircraft profile dataset.

programs produced large sets of CO in situ profiles over                 HIPPO were conducted in five phases in 2009, 2010, and
both the Northern Hemisphere and Southern Hemisphere,                    2011 (Wofsy, 2011). ATom took place in four phases in 2016,
primarily over open ocean. Since MOPITT NIR radiances                    2017, and 2018 (Thompson et al., 2022). The KORUS-AQ
over ocean are not used by the retrieval algorithm, vali-                campaign was conducted over the Korean peninsula (and
dation results presented below for the HIPPO and ATom                    vicinity) from April to June 2016 (Crawford et al., 2021).
campaigns are limited to the TIR-only variant. Flights for               Since MOPITT retrievals over ocean are based solely on TIR

Atmos. Meas. Tech., 15, 2325–2344, 2022                                                    https://doi.org/10.5194/amt-15-2325-2022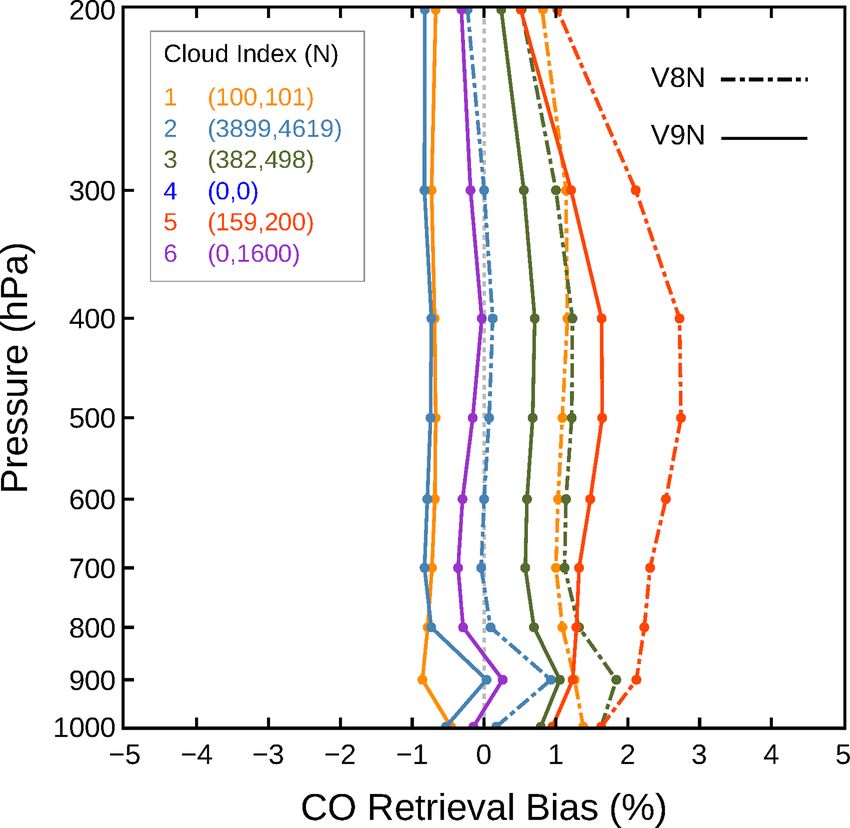
M. Deeter et al.: MOPITT Version 9                                                                                          2333

radiances, validation results presented below for the HIPPO
and ATom campaigns (which mainly produced over-ocean
observations) are limited to the TIR-only variant.
   CO measurements used for validation for both HIPPO
and ATom were performed with the QCLS (Quantum Cas-
cade Laser Spectrometer) instrument (Santoni et al., 2014).
CO measurements for KORUS-AQ were performed with the
DACOM (Differential Absorption Carbon monOxide Mea-
surement) instrument (Sachse et al., 1987). In-flight calibra-
tion for both the QCLS and DACOM instruments involves
the use of compressed gas cylinders from NOAA’s Global
Monitoring Laboratory with known CO concentrations. For
ATom and KORUS-AQ, the calibration of these reference
cylinders from NOAA was based on the WMO CO X2014A
scale, whereas for HIPPO the calibration was based on the
prior X2004 scale. For the HIPPO, ATom, and KORUS-AQ
CO measurements used herein, potential drift in the refer-
ence cylinder CO mole fractions (https://gml.noaa.gov/ccl/
                                                                  Figure 3. Comparison of V8 and V9 validation results based on CO
co_scale.html) was addressed by calibrating the reference         profiles measured during the HIPPO, ATom, and KORUS-AQ field
cylinders at NOAA’s Central Calibration Laboratory both be-       campaigns.
fore and after the field campaign and applying linear inter-
polation. For CO, the estimated precision of the QCLS in-
strument is 0.2 ppb (Santoni et al., 2014). For DACOM, the           V8 and V9 validation results for KORUS-AQ are com-
estimated precision is 1 ppb + 1 % of the measured CO mole        pared in Fig. 3 and Table 5. Differences between V8 and V9
fraction (Sachse et al., 1987). A comparison of CO measure-       retrieval biases for KORUS-AQ are generally similar to dif-
ments obtained by QCLS and NOAA flasks during HIPPO               ferences observed for the NOAA profile set. For example,
indicated a negative bias of 2 ppb for QCLS (Santoni et al.,      in comparison to V8, V9 TIR-only biases in the lower tro-
2014).                                                            posphere are shifted to slightly greater values in the lower
   For matching MOPITT retrieved profiles with in situ            troposphere and shifted to slightly smaller values in the up-
profiles, a maximum collocation radius of 50 km was em-           per troposphere. The range of bias values over the CO pro-
ployed for the KORUS-AQ profiles (like the NOAA pro-              file for V8 and V9 is also similar. Biases for the V8 and V9
files), whereas a value of 200 km was used for the HIPPO          TIR-only, NIR-only, and TIR–NIR variants for KORUS-AQ
and ATom profiles. The larger radius for HIPPO and ATom           fall in the ranges ±4 %, ±2 %, and ±7 % respectively. Total
was chosen since expected horizontal CO gradients are gen-        column biases for the V9 TIR-only, NIR-only, and TIR–NIR
erally much smaller over the open ocean than over continen-       variants listed in Table 5 are somewhat larger than for the cor-
tal regions. The influence of collocation criteria on MOPITT      responding V8 variants (in contrast to the NOAA validation
validation statistics was studied in Tang et al. (2020).          results).
   V8 and V9 TIR-only validation results for HIPPO and
ATom are compared in Fig. 3 and Tables 3 and 4. V9
retrieval biases for HIPPO vary over the range of ±6 %,           4     Sampling characteristics
while V9 retrieval biases for ATom vary from about −4 %
to 2 %. With respect to total column, biases for the V9           Case studies presented in Deeter et al. (2021) illustrated the
TIR-only product for the NOAA, HIPPO, and ATom (listed            increased retrieval yield in selected scenes resulting from the
in Tables 2, 3 and 4) are 9.69 × 10¹⁵ , −2.06 × 10¹⁵ , and        cloud detection revisions described in Sect. 2.3. This previ-
−1.22 × 10¹⁶ molecules cm−2 , respectively. For both HIPPO        ous analysis focused on the performance of the revised cloud
and ATom, the range of observed biases (over the vertical         detection algorithm in heavily polluted regions. Retrievals
profile) is larger than for the NOAA TIR-only profiles. To        added because of the cloud detection revisions were found
some degree, the smaller biases for the NOAA profiles are         to be physically consistent with the retrieved CO in the rest
likely a consequence of using those profiles to obtain opti-      of the scene. Below, we analyze the improved retrieval cov-
mal radiance bias correction factors, as described in Deeter      erage in V9 products at global and regional spatial scales.
et al. (2019). Differences in biases for the NOAA, HIPPO,
ATom, and KORUS-AQ datasets could reflect either some             4.1    Zonal means
type of geographically variable retrieval bias in the MOPITT
retrievals or differences in the characteristics of the in situ   Zonal totals of the numbers of daytime retrievals over land
measurements acquired during the field campaigns.                 obtained for the V8 and V9 TIR-only variants for the month

https://doi.org/10.5194/amt-15-2325-2022                                            Atmos. Meas. Tech., 15, 2325–2344, 2022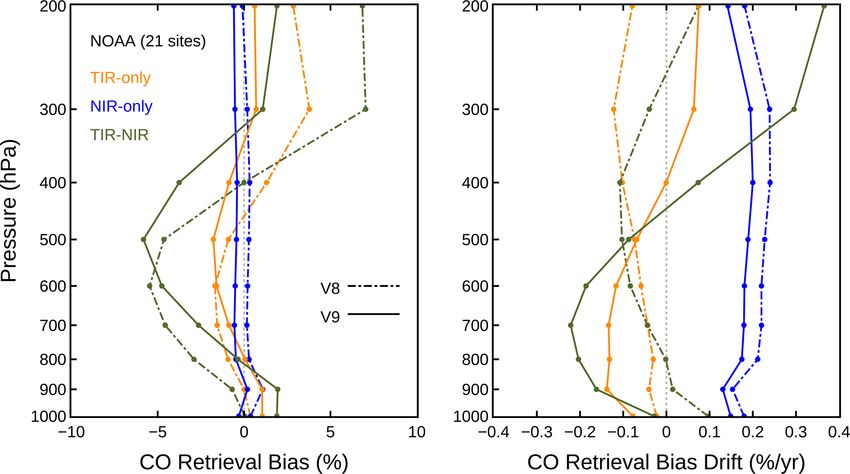
2334 M. Deeter et al.: MOPITT Version 9
Table 3. Summarized validation results for V8 and V9 TIR-only (V8T and V9T) variants based on in situ data from the HIPPO field
campaign. See caption to Table 2.
Total column Surface 800 hPa 600 hPa 400 hPa 200 hPa
V8T bias 4.77 × 10¹⁵ 5.51 2.37 −3.40 −3.93 −0.31
(10 547) SD 1.43 × 10¹⁷ 12.18 11.47 13.77 16.50 13.98
V9T bias −2.06 × 10¹⁵ 5.56 3.13 −3.26 −5.86 −2.23
(11 613) SD 1.53 × 10¹⁷ 11.42 11.74 13.84 17.48 14.61
Table 4. Summarized validation results for V8 and V9 TIR-only (V8T and V9T) variants based on in situ data from the ATom field campaign.
See caption to Table 2.
Total column Surface 800 hPa 600 hPa 400 hPa 200 hPa
V8T bias −1.40 × 10¹⁶ −0.47 −2.43 −4.42 −1.03 3.30
(10 512) SD 1.73 × 10¹⁷ 5.84 8.78 11.68 16.35 14.51
V9T bias −1.22 × 10¹⁶ 0.00 −1.69 −4.04 −1.79 2.11
(11 242) SD 1.87 × 10¹⁷ 5.93 8.77 12.02 17.71 14.97
of July 2017 are presented in the left panel of Fig. 4. Each tions. Thus, for a particular grid cell,
plotted point indicates the total monthly number of daytime
retrievals in a latitude band that is 10◦ wide. The plot illus- νs = τs−1 = (Lobs /Nobs )−1 , (4)
trates a sharp increase in the number of daytime retrievals
over land for V9, especially over the Northern Hemisphere. where νs is the retrieval sampling frequency, τs is the mean
Globally, the total number of daytime retrievals over land in- sampling period, Lobs is the total length of the observation
creased by 41 % from 9.84 × 10⁵ for V8 to 1.36 × 10⁶ for period (in days), and Nobs is the number of days within that
V9. Monthly totals of numbers of retrievals for V9 for other period which contain at least one MOPITT retrieval. In order
months which have been analyzed are typically 30 %–40 % to sample all longitudes equally, sampling frequency should
larger than for V8. be calculated over periods of observations equal to integral
The panel on the right side of Fig. 4 compares V8 and multiples of Terra’s 16 d orbital repeat cycle.
V9 zonal-mean total column values for the same subsets of Maps of daytime retrieval sampling frequency for V8 and
daytime retrievals over land analyzed in the left panel. The V9 retrievals for South America are compared in Fig. 5. Re-
plot shows that the large relative increase in the number of trieval sampling frequency was calculated for the period be-
daytime retrievals over land for V9 has a very weak effect tween 1 September and 2 October 2017, spanning two com-
on the monthly-average total column zonal means. V8T and plete Terra orbital repeat cycles. No filtering was applied
V9T zonal means are within 2 % at most latitude bands. This with respect to cloud index or any other parameter. Sam-
finding suggests that the retrievals added in V9 by virtue of pling frequency over oceanic grid cells, which is not signif-
the cloud detection algorithm changes described in Sect. 2.3 icantly different for the two cloud detection algorithms, is
may not strongly affect large-scale features in the MOPITT not shown. Grid cells for which the sampling frequency is
product. exactly 0 (meaning that no retrievals were acquired over the
entire 32 d observation period) are indicated by a cross cov-
ering the cell.
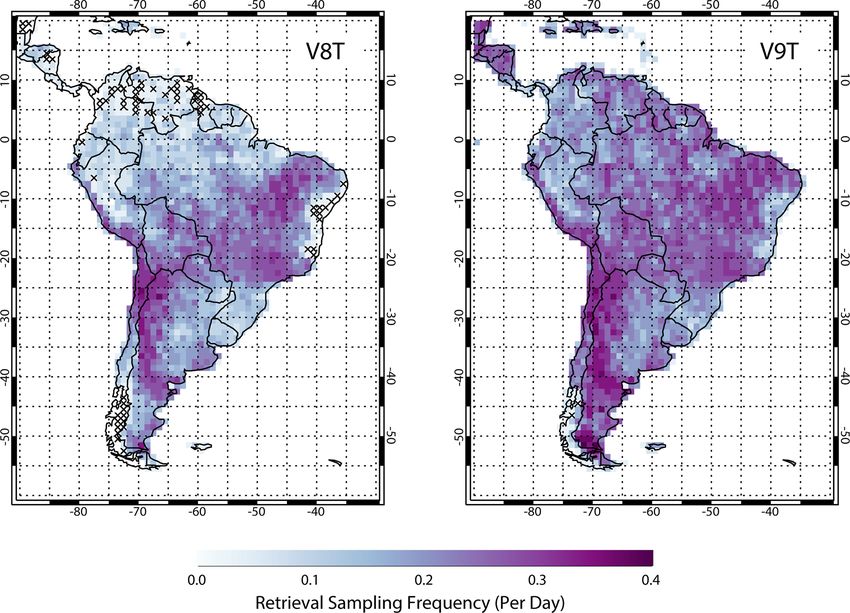
4.2 Sampling frequency As shown in Deeter et al. (2021), increased sampling fre-
quency for V9 results from both of the cloud detection algo-
rithm revisions described in Sect. 2.3. For V8 results shown
The utility of MOPITT data for specific applications often in the left panel, sampling frequency varies widely from zero
depends on the temporal interval between observations. As in much of the extreme northern, easternmost, and south-
illustrated below, a useful metric for this variable is retrieval western regions of South America to ∼ 0.3 d−1 in parts of
sampling frequency (Deeter et al., 2021). We define retrieval eastern South America and an area of western South Amer-
sampling frequency as the reciprocal of the mean sampling ica between 30 and 20◦ S. For the V9 product, shown in the
period, which is itself defined as the average number of days right panel, improved retrieval sampling frequency is indi-
between retrievals acquired within a 1◦ latitude by 1◦ longi- cated over most of the continent but is most obvious in the
tude grid cell, calculated over a specified period of observa- regions where the V8 sampling frequency is the poorest, e.g.,
Atmos. Meas. Tech., 15, 2325–2344, 2022 https://doi.org/10.5194/amt-15-2325-2022M. Deeter et al.: MOPITT Version 9 2335
Table 5. Summarized validation results for V8 and V9 TIR-only (V8T and V9T), NIR-only (V8N and V9N), and TIR–NIR (V8J and V9J)
variants based on in situ data from the KORUS-AQ field campaign. See caption to Table 2.
Total column Surface 800 hPa 600 hPa 400 hPa 200 hPa
V8T bias −1.20 × 10¹⁶ −0.16 −2.90 −2.55 1.83 3.92
(217) SD 2.19 × 10¹⁷ 9.85 8.88 11.14 21.46 17.33
V9T bias 1.91 × 10¹⁶ 0.71 −1.71 −2.48 0.35 3.24
(280) SD 3.44 × 10¹⁷ 9.31 9.47 13.73 27.56 23.88
V8N bias 9.15 × 10¹⁴ 0.22 0.10 −0.02 −0.01 −0.04
(130) SD 2.25 × 10¹⁷ 9.47 7.14 5.76 5.63 3.78
V9N bias −2.96 × 10¹⁶ −1.22 −0.99 −0.88 −0.85 −0.65
(185) SD 2.18 × 10¹⁷ 9.21 7.01 5.78 5.69 3.81
V8J bias −1.80 × 10¹⁶ −2.25 −6.78 −5.89 3.52 11.50
(215) SD 2.23 × 10¹⁷ 20.29 14.17 11.26 27.32 31.31
V9J bias 1.84 × 10¹⁶ 0.39 −3.75 −6.47 −2.08 6.56
(272) SD 3.37 × 10¹⁷ 20.44 15.07 15.28 35.25 36.98
Figure 4. Comparison of zonal-mean values for number of retrievals (a) and mean CO total column (b) for V8 and V9 TIR-only variants
based on daytime/land retrievals for July 2017.
regions north of 5◦ S. Over this region, the mean sampling frequency maps were also calculated for the period from
frequency increases by 127 %, from 0.088 to 0.20 d−1 . Over 1 January to 1 February 2017 and are shown in Fig. 7. In-
the entire continent, the number of grid cells for which the re- creased sampling frequency is apparent over much of the
trieval sampling frequency is exactly zero decreases sharply continent, particularly western China, northeastern China,
from 62 to 2. and Mongolia.
Substantial improvements in sampling frequency for V9
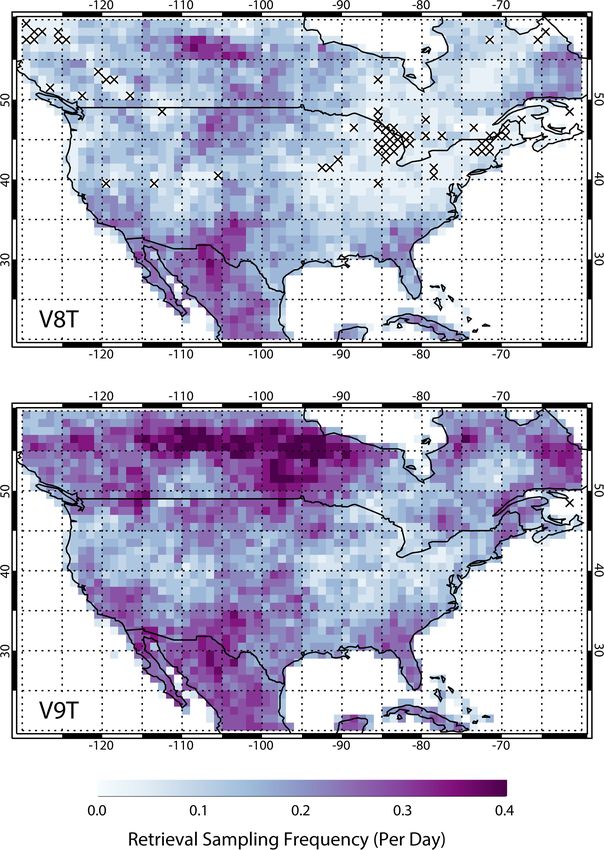
are also observed for North America and Asia. V8 and V9 4.3 Level 3 products
sampling frequency maps for North America were calcu-
lated for the period from 1 January to 1 February 2017 and
The beneficial effects of the cloud detection revisions are also
are shown in Fig. 6. Sharply increased sampling frequency
readily apparent in the gridded MOPITT Level 3 monthly
is evident over much of Canada and over much of the east-
product, as shown in Fig. 8. The top row in this figure com-
ern United States where V8 sampling frequency is near zero.
pares V8 and V9 TIR–NIR gridded monthly-mean daytime
Improved sampling for V9 over Canada was found indepen-
CO total column values for eastern China for January 2010.
dently to be related to added retrievals in scenes with low
Empty grid cell values, indicated in white, are much more
clouds (Marey et al., 2022). For Asia, V8 and V9 sampling
common in the V8 product than in the V9 product. The bot-
https://doi.org/10.5194/amt-15-2325-2022 Atmos. Meas. Tech., 15, 2325–2344, 20222336 M. Deeter et al.: MOPITT Version 9 Figure 5. Comparison of maps of sampling frequency (defined in Sect. 4.2) for South America for V8 and V9 TIR-only variants based on daytime/land retrievals for September 2017. No filtering was applied with respect to cloud index or any other parameter. Grid cells with enclosed crosses indicate a sampling frequency of exactly 0, meaning that no retrievals were obtained during the specified period. Figure 6. Comparison of maps of sampling frequency for North Figure 7. Comparison of maps of sampling frequency for East Asia America for V8 and V9 TIR-only variants based on daytime/land for V8 and V9 TIR-only variants based on daytime/land retrievals retrievals for January 2017. See caption to Fig. 5. for January 2017. See caption to Fig. 5. Atmos. Meas. Tech., 15, 2325–2344, 2022 https://doi.org/10.5194/amt-15-2325-2022
M. Deeter et al.: MOPITT Version 9                                                                                          2337

Figure 8. Comparison of V8 and V9 TIR–NIR maps of Level 3 monthly-mean CO total column (a, b) and corresponding fractional differ-
ence (c) for eastern China based on daytime retrievals for January 2010.

tom panel in the figure presents a map of the fractional dif-      40 % compared to the V8 product. Validation results based
ference derived from the top-row panels. This map demon-           on aircraft in situ profiles indicate that V9 product retrieval
strates that over a heavily polluted region such as the North      biases are typically in the range of ±5 % and are generally
China Plain, monthly-mean total column values in the V9            comparable to results for the V8 product.
product may be larger than corresponding V8 values by 20 %            The improved retrieval coverage and sampling frequency
or more. This effect is due to the tendency of heavy aerosol       for V9 should add value to the MOPITT product in a wide
loading to lead to the Uncertain outcome for the MODIS             variety of applications. For example, more frequent retrievals
cloud mask, resulting in the exclusion of such scenes in           in CO source regions, such as the fire-prone Amazon Basin
the MOPITT V8 product (Deeter et al., 2021). Thus, CO              and heavily industrialized North China Plain, should lead to
monthly means in the V9 product should be more accurate            more accurate emissions estimates using inverse modeling
than for V8 because retrievals are averaged over a wider and       methods. For visualizing CO distributions using monthly-
more complete range of pollution levels.                           mean maps, the new product is more statistically robust and
                                                                   has many fewer gaps due to missing data. Moreover, heav-
                                                                   ily polluted regions should be more accurately represented
5   Conclusions                                                    in such maps since the previous cloud detection algorithm
                                                                   tended to exclude the most heavily polluted scenes. Finally,
Various aspects of the MOPITT calibration methods and re-
                                                                   the increased retrieval coverage should lead to better statis-
trieval algorithm have been revised since the instrument be-
                                                                   tics when validating other satellite products.
came operational in 2000. For the most recently released Ver-
sion 9 products, significant revisions were made to the NIR
calibration scheme and to the cloud detection algorithm. The       Appendix A: Cloud-index-subsetted validation results
new NIR calibration method was shown to reduce an appar-
ent discontinuity in NIR-only retrievals for dates just before     NOAA V8 and V9 TIR-only validation results subsetted by
and just after the annual hot calibration/decontamination pro-     cloud index value (1–6) are shown in Fig. A1 and are listed
cedure. This revision should improve the temporal consis-          in Table A1. The number of V8 and V9 retrievals within each
tency of both the NIR-only and TIR–NIR products. The re-           subset are indicated in the figure legend and in the leftmost
vised cloud detection algorithm allows retrievals in ambigu-       column of the table. Corresponding results for the NIR-only
ous situations (with respect to cloudiness) resulting in an in-    and TIR–NIR products are presented in Figs. A2 and A3
crease in large-scale retrieval coverage over land of ∼ 30 %–      and Tables A2 and A3. Cloud index values are defined in

https://doi.org/10.5194/amt-15-2325-2022                                             Atmos. Meas. Tech., 15, 2325–2344, 2022
2338 M. Deeter et al.: MOPITT Version 9
Figure A1. Cloud-index-subsetted validation results for the V8 and Figure A3. Cloud-index-subsetted validation results for the V8 and
V9 TIR-only variants using the NOAA profile set. Numbers in V9 TIR–NIR variants using the NOAA profile set. Numbers in
parentheses in the legend indicate the number of retrievals within parentheses in the legend indicate the number of retrievals within
the subset for the corresponding cloud index value for the V8 and the subset for the corresponding cloud index value for the V8 and
V9 products. V9 products.
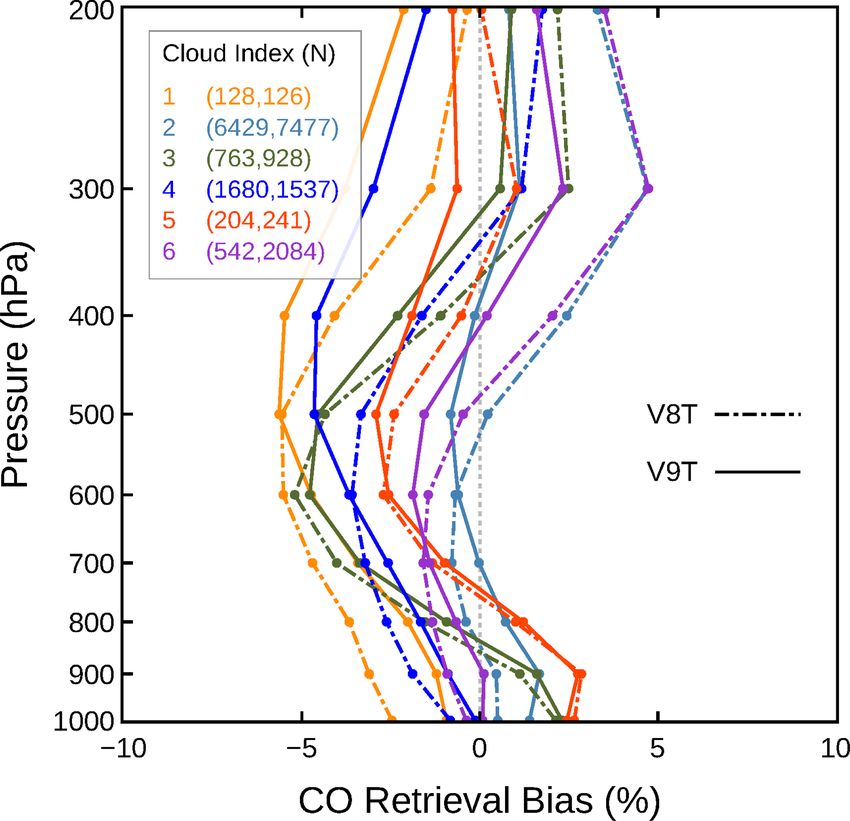
For the V9 TIR-only results, retrieval biases for cloud in-
dex subsets 2–6 fall in the range of ±5 %. (The cloud in-
dex 1 subset, composed of retrievals for which the MODIS
cloud mask was unavailable, represents only about 1 % of the
entire set of retrievals analyzed and may not be statistically
significant.) Corresponding bias ranges for the V9 NIR-only
and TIR–NIR variants are ±2 % and ±10 %, respectively.
In relation to the cloud index 2 subset (MODIS clear, MO-
PITT clear) subset, which represents the retrieval subset most
confidently cloud-free, biases for the cloud index 6 subset
(MODIS cloudy, MOPITT clear) are within 2 % at all levels.
Similarly, differences in the index 2 and index 6 subsets for
the NIR-only and TIR–NIR variants are within 1 % and 3 %,
respectively. Thus, comparing retrieval biases for cloud in-
dex 2 and 6, it appears that the results of the MODIS cloud
mask test are not significant. However, the importance of the
MODIS cloud mask test may be greater in specific contexts
not represented in the validation results, such as nighttime
Figure A2. Cloud-index-subsetted validation results for the V8 and retrievals over land. Since bias differences associated with
V9 NIR-only variants using the NOAA profile set. Numbers in
the different cloud index values are generally similar in mag-
parentheses in the legend indicate the number of retrievals within
the subset for the corresponding cloud index value for the V8 and
nitude to bias variations over the vertical profile, validation
V9 products. results shown in Figs. A1, A2, and A3 do not imply a clear
benefit to filtering based on cloud index.
Sect. 2.3. A comparison of the numbers of V8 and V9 re-
trievals in Tables A1, A2, and A3 indicates that the large ma-
jority of added retrievals in V9 (not present in the V8 prod-
uct) are either assigned cloud index 2 (MODIS clear, MO-
PITT clear) or 6 (MODIS cloudy, MOPITT clear).
Atmos. Meas. Tech., 15, 2325–2344, 2022 https://doi.org/10.5194/amt-15-2325-2022You can also read