Processes controlling the vertical aerosol distribution in marine stratocumulus regions - a sensitivity study using the climate model NorESM1-M ...
←
→
Page content transcription
If your browser does not render page correctly, please read the page content below
Atmos. Chem. Phys., 21, 577–595, 2021
https://doi.org/10.5194/acp-21-577-2021
© Author(s) 2021. This work is distributed under
the Creative Commons Attribution 4.0 License.

Processes controlling the vertical aerosol distribution
in marine stratocumulus regions – a sensitivity
study using the climate model NorESM1-M
Lena Frey1,a , Frida A.-M. Bender1 , and Gunilla Svensson1
1 Department     of Meteorology and Bolin Centre for Climate Research, Stockholm University, Stockholm, Sweden
a now   at: Institute of Meteorology and Climate Research, Karlsruhe Institute of Technology, Karlsruhe, Germany

Correspondence: Lena Frey (lena.frey@kit.edu)

Received: 19 September 2019 – Discussion started: 13 November 2019
Revised: 5 November 2020 – Accepted: 1 December 2020 – Published: 15 January 2021

Abstract. The vertical distribution of aerosols plays an im-       1   Introduction
portant role in determining the effective radiative forcing
from aerosol–radiation and aerosol–cloud interactions. Here,       Aerosol interactions with clouds and radiation constitute a
a number of processes controlling the vertical distribution        major source of uncertainty in estimates of total radiative
of aerosol in five subtropical marine stratocumulus regions        forcing. Aerosol particles can scatter and absorb solar radi-
in the climate model NorESM1-M are investigated, with a            ation, causing a local cooling or heating. The altered tem-
focus on the total aerosol extinction. A comparison with           perature profile may in turn induce changes in cloud cover,
satellite lidar data (CALIOP, Cloud–Aerosol Lidar with Or-         whereby the so-called semi-direct effect describing dissipa-
thogonal Polarization) shows that the model underestimates         tion of clouds in response to local heating is one of several
aerosol extinction throughout the troposphere, especially ele-     possible adjustments (Hansen et al., 1997). The resulting ra-
vated aerosol layers in the two regions where they are seen in     diative forcing, including the cloud adjustments to the altered
observations. It is found that the shape of the vertical aerosol   temperature profile, is referred to as effective radiative forc-
distribution is largely determined by the aerosol emission         ing from aerosol–radiation interactions. Aerosols can fur-
and removal processes in the model, primarily through the          ther modify the cloud albedo since an increase in the num-
injection height, emitted particle size, and wet scavenging.       ber of aerosol particles leads to more numerous and smaller
In addition, the representation of vertical transport related to   cloud droplets for a cloud with a given liquid water con-
shallow convection and entrainment is found to be important,       tent. This enhancement in cloud reflectivity is known as the
whereas alterations in aerosol optical properties and cloud        cloud albedo effect (Twomey, 1977). An increase in cloud
microphysics parameterizations have smaller effects on the         droplet number concentration can further lead to suppres-
vertical aerosol extinction distribution. However, none of the     sion of precipitation since the formation of rain droplets is
alterations made are sufficient for reproducing the observed       less efficient for a higher number concentration of smaller
vertical distribution of aerosol extinction, neither in magni-     cloud droplets, and this rapid adjustment is referred to as
tude nor in shape. Interpolating the vertical levels of CALIOP     the cloud lifetime effect (Albrecht, 1989). The cloud albedo
to the corresponding model levels leads to better agreement        and cloud lifetime effects are part of the effective radiative
in the boundary layer and highlights the importance of the         forcing from aerosol–cloud interactions. The overall effect
vertical resolution.                                               of aerosol–radiation interactions, aerosol–cloud interactions,
                                                                   and the related rapid adjustments is estimated to be negative
                                                                   but with a substantial uncertainty (−0.9 (−1.9 to 0.1) Wm−2 )
                                                                   (Myhre et al., 2013). The vertical distribution of aerosols is
                                                                   one important factor for determining the aerosol effect on
                                                                   the radiative budget for both aerosol interaction with clouds,

Published by Copernicus Publications on behalf of the European Geosciences Union.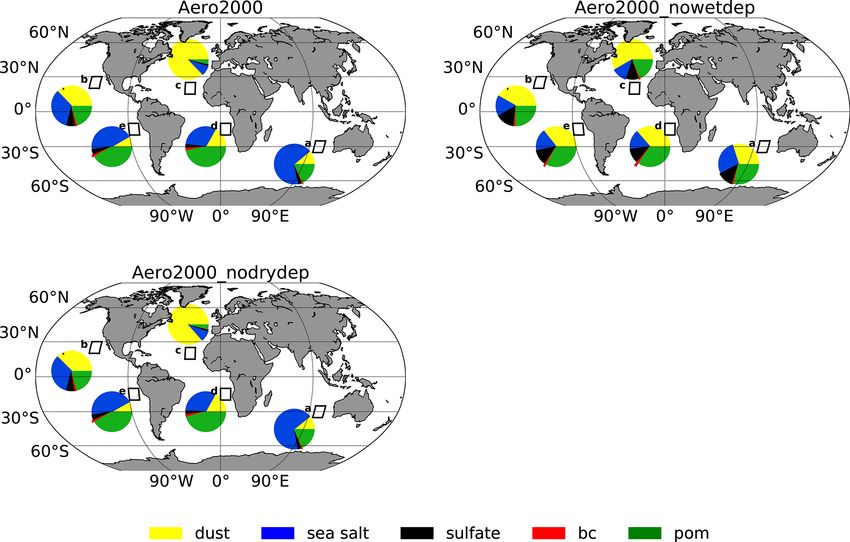
578                                                                 L. Frey et al.: Vertical aerosol distribution in NorESM1-M

which requires vertical colocation, and aerosol interaction          tion, without discriminating between absorbing and reflect-
with radiation.                                                      ing aerosols, to give a full description of the vertical aerosol
   Model intercomparisons and comparisons with observa-              distribution in the model and to facilitate a comparison with
tions have shown large disagreement in the vertical distri-          observational estimates of total extinction.
bution of aerosols in general and absorbing aerosols in par-            While the analysis by Kipling et al. (2016) is on global
ticular, with large regional variation (Yu et al., 2010; Koffi       scale, we focus here on the regional scale and investigate five
et al., 2012, 2016). Model diversity and uncertainty in ra-          subtropical marine stratocumulus regions defined by Klein
diative forcing from aerosol–radiation interactions have been        and Hartmann (1993). The radiative properties of the clouds
found to be largely attributable to the vertical distribution of     in these regions, and their potential alteration by aerosol in-
black carbon (BC), the main absorbing aerosol type (Sam-             fluence, remain a key challenge in climate models (Bony
set and Myhre, 2011; Samset et al., 2013). Schwarz et al.            and Dufresne, 2005; Medeiros et al., 2008; Qu et al., 2014;
(2010, 2013) found that models overestimate BC concen-               Bender et al., 2016). Further, both absorbing and reflecting
trations over the remote Pacific compared to aircraft obser-         aerosols (BC, organics, and dust) located above the cloud
vations, whereas the quantity of biomass burning aerosols            layer have been identified in observations (Waquet et al.,
above clouds has been found to be underestimated in models           2013; Winker et al., 2013; Chand et al., 2008; Devasthale
over the southeast Atlantic and often prescribed as too reflec-      and Thomas, 2011) of these regions, which display a vari-
tive (Peers et al., 2016). This is in agreement with Frey et al.     ety of aerosol signatures in terms of types and column bur-
(2017), who found that aerosols above the cloud layer occur          dens. To evaluate the model performance against observa-
in CMIP5 (Coupled Model Intercomparison Project phase 5)             tions, we use the 5 km aerosol profile product of CALIOP
models without reducing the scene albedo.                            (Cloud–Aerosol Lidar with Orthogonal Polarization) version
   Highlighting the diversity among climate models, Koffi            4.10. A description of the satellite data retrievals can be
et al. (2012) compared vertical profiles of aerosol extinc-          found in Sect. 2, while a description of the climate model
tion of AeroCom (Aerosol Comparisons between Observa-                NorESM1-M and the model simulations performed is pro-
tions and Models) phase I models with satellite observations,        vided in Sect. 3. The results and further discussion are pre-
and Koffi et al. (2016) further investigated whether models          sented in Sects. 4 and 5, respectively. We summarize the most
from AeroCom phase II have improved compared to phase                important processes that control the vertical aerosol distribu-
I models, focusing on regional and seasonal variability. Al-         tion in the climate model NorESM1-M in the given regions
though the models were found able to reproduce the general           in Sect. 6 and thereby give guidance for evaluating and im-
features of the observed aerosol distribution, with a decrease       proving this and other state-of-the-art climate models.
in aerosol extinction from the surface up to 5 km, many mod-
els fail to capture the shape of the aerosol distribution in more
detail.                                                              2   Satellite retrievals and data processing
   The large model diversity and poor agreement with obser-
vations motivate further investigation of which processes are        CALIOP is onboard the CALIPSO (Cloud–Aerosol Lidar
important for determining the vertical distribution of aerosols      and Infrared Pathfinder Satellite Observations) satellite as
in global models. Kipling et al. (2016); Kipling et al. (2013)       part of the A-train constellation. The satellite was launched
accordingly investigated various factors affecting the verti-        in the year 2006, and we used data for the time period 2007
cal aerosol distribution in two models (HadGEM3-UKCA                 to 2016. We used the Level 2, 5 km aerosol profile product,
and ECHAM5-HAM2), pointing at the importance of re-                  version 4.10, of CALIOP lidar data, which has shown better
moval processes, which is also supported by the findings             agreement with the aerosol optical depth (AOD) from ob-
from Vignati et al. (2010), who found a large sensitivity of         servations compared to the previous CALIOP version (Kim
BC lifetime to wet scavenging in a chemical transport model.         et al., 2018).
Studying biomass burning aerosols in particular, Peers et al.           CALIOP measures backscattered radiation at two wave-
(2016) rather point at injection height and vertical transport       lengths and derives the aerosol extinction with an algorithm
as the main reasons for discrepancies between their chemi-           including iterative adjustment of the lidar ratio, i.e., the ra-
cal transport model and satellite observations. In the present       tio between the extinction cross section and 180◦ backscat-
study, we add to the generalizability of these previous re-          ter cross section. We use the 5 km aerosol profile product
sults by testing the sensitivity to several processes that can       (Winker et al., 2013), which provides profiles of the total
control the vertical distribution of aerosol in another climate      aerosol extinction coefficient. A detailed product and data
model, NorESM1-M. The sensitivity experiments performed              processing algorithm description can be found in Winker
are classified into five categories, following Kipling et al.        et al. (2009) and Kim et al. (2018). Only wavelength 532 nm
(2016): emissions, transport, microphysics, deposition, and          is considered here, as these measurements have a better
aerosol optical properties. Although some of the sensitiv-           signal-to-noise ratio than those at wavelength 1064 nm (Yu
ity experiments target specific aerosol types, we focus the          et al., 2010). Due to the higher detection sensitivity for
evaluation on total aerosol extinction and number concentra-         aerosols in the night (Winker et al., 2009, 2010), we use

Atmos. Chem. Phys., 21, 577–595, 2021                                                   https://doi.org/10.5194/acp-21-577-2021
L. Frey et al.: Vertical aerosol distribution in NorESM1-M                                                                     579

only nighttime data, following Yu et al. (2010) and Koffi          ing hybrid sigma–pressure coordinates. Here an AMIP (At-
et al. (2012). We apply several additional data screening cri-     mospheric Model Intercomparison Project) configuration of
teria, following Tackett et al. (2018). The cloud–aerosol dis-     the uncoupled model version, with a prescribed sea surface
crimination (CAD) score distinguishes between clouds and           temperature and sea ice climatology, was used.
aerosols, with a negative CAD score representing aerosol              Aerosol types represented in the model are mineral dust,
and a positive value representing cloud. We use a CAD              sea salt, organic matter (OM), black carbon (BC), and sul-
score greater than −80 for a higher confidence in identifying      fate. Mineral dust emissions are prescribed and inserted at
aerosol (Liu et al., 2009, 2019). We also examine the quality      the surface, while sea salt emissions are prognostic and wind-
of the extinction retrieval, represented by the extinction qual-   driven. Anthropogenic aerosol emissions of sulfate, primary
ity control (QC) filter, which stores information about the        OM, and BC from fossil fuel and biofuel combustion, as well
initial and final state of the lidar ratio at each layer. We use   as biomass burning, are in the default model configuration
only cases in which the initial lidar ratio remains unchanged      based on the IPCC AR5 data set (Lamarque et al., 2010).
during the iterative solution process, referred to as an un-       Biofuel and fossil fuel emissions are injected at the surface,
constrained retrieval (QC = 0), or use constrained retrievals      whereas biomass burning emissions are distributed over the
(QC = 1) for which the initial lidar ratio was adjusted dur-       eight lowest model levels, which reach up to approximately
ing the retrieval process by using measurements of a layer         510 hPa on average. Emission heights follow the recommen-
two-way transmittance, both with a higher confidence in the        dations by Dentener et al. (2006).
algorithm solution. Furthermore, we reject retrievals with a          Nucleation, condensation, coagulation, and aqueous
high extinction uncertainty of 99.9 km−1 , thereby avoiding        chemistry processes are represented, and the emitted par-
high biases in aerosol extinction.                                 ticles are tagged with one of these production mecha-
   Our analysis focuses on five regions of low marine stra-        nisms. The aerosol scheme in NorESM1-M is a sophisticated
tocumulus clouds, following Klein and Hartmann (1993):             aerosol module, whereby all aerosol particles can be inter-
Australian (25–35◦ S, 95–105◦ E), Californian (20–30◦ N,           nally mixed; i.e., absorbing particles can become reflecting
120–130◦ W), Canarian (15–25◦ N, 25–35◦ W), Namibian               and active as cloud condensation nuclei (CCN). All aerosol
(10–20◦ S, 0–10◦ E), and Peruvian (10–20◦ S, 80–90◦ W).            types are mainly reflecting except BC, which is prescribed
The CALIPSO satellite overpasses the Equator twice per day.        as fully absorbing. In terms of aerosol–cloud interactions,
The temporal resolution of the lidar is 5 s, and the snapshots     both the cloud albedo and cloud lifetime effects are repre-
for each given satellite overpass are aggregated to a uniform      sented. The cloud droplet effective radius (reff ) is prognosti-
2◦ latitude by 5◦ longitude grid with a vertical resolution of     cally dependent on the cloud droplet number concentration
60 m so that each provided data file within each region con-       (Nd ), which is dependent on the aerosol number concen-
tains multiple aerosol profiles. We average all profiles in the    tration and vertical velocity through supersaturation, based
latitude and longitude range of each region to obtain a daily      on the parameterization by Abdul-Razzak and Ghan (2000).
mean profile; a minimum number of 10 profiles at each ver-         Suppression of precipitation with increased aerosol number
tical layer is thereby required to avoid high biases in aerosol    concentration (lifetime effect) is triggered by a threshold in
extinction in the upper troposphere. In addition, to allow for     the autoconversion scheme, a critical radius of 14 µm from
a better comparison with the coarser model resolution of 26        which cloud droplets are converted to rain droplets. A sec-
vertical layers, we linearly interpolate the daily mean lidar      ond parameter, which controls the autoconversion process
profiles to the altitudes corresponding to the model levels. By    in the model, is a critical precipitation rate of 5.0 mm d−1 .
choosing linear interpolation rather than averaging the verti-     If the critical threshold is reached, collector drops are as-
cal CALIOP levels, the original shape of the profile is still      sumed to change the drop size and thereby enhance auto-
preserved. The daily mean profiles are further averaged over       conversion. The autoconversion scheme is based on Tripoli
the whole 10-year period to obtain a climatological annual         and Cotton (1979) and modified by Rasch and Kristjánsson
mean.                                                              (1998). Mean aerosol size distributions and optical properties
                                                                   are calculated a posteriori using lookup tables. The aerosol
                                                                   mass concentration is tagged with one of the different pro-
3     Model and model simulations                                  duction mechanisms and also calculated offline.
                                                                      All aerosol particles can be removed by dry and wet depo-
3.1    Model NorESM1-M                                             sition. For convective clouds an in-plume approach is used,
                                                                   which allows aerosols to be vertically transported, mixed be-
The atmospheric part of the climate model NorESM1-M                tween updrafts and downdrafts, and removed directly with
(Kirkevåg et al., 2013) is based on the Community Atmo-            wet scavenging (Kirkevåg et al., 2013). Mass fluxes for the
sphere Model version 4 (CAM4; Gent et al., 2011) and cou-          updrafts and downdrafts are based on Zhang and McFarlane
pled to the aerosol module CAM4-Oslo. The horizontal res-          (1995). The boundary layer scheme is based on Holtslag and
olution is 1.9◦ for latitudes and 2.5◦ for longitudes, and the     Boville (1993) using an updated representation of the bound-
vertical is resolved with 26 levels from 1000 up to 0.1 hPa us-    ary layer height; see Vogelezang and Holtslag (1996).

https://doi.org/10.5194/acp-21-577-2021                                                Atmos. Chem. Phys., 21, 577–595, 2021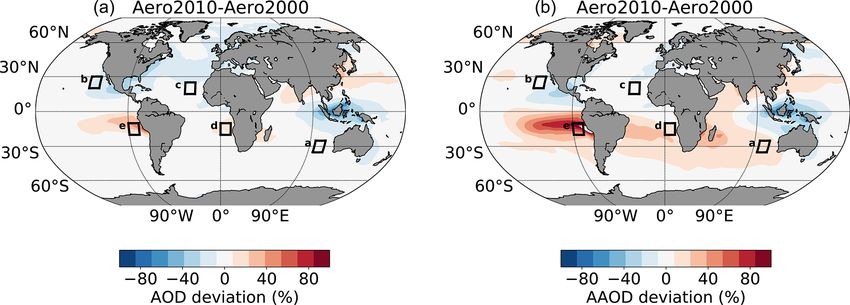
580                                                                 L. Frey et al.: Vertical aerosol distribution in NorESM1-M

  Further information on the model can be found in                   size. For all cases except the altered emission data set, the
Kirkevåg et al. (2013).                                              total emitted aerosol mass is kept constant.
                                                                        For the default model configuration, the IPCC AR5 emis-
3.2     Model setup and sensitivity experiments                      sion data set (Lamarque et al., 2010) was used. Fire emis-
                                                                     sions in the default data set are based on the Global Fire
                                                                     Emissions Database (GFED) version 2, and aviation emis-
All model simulations are run in an AMIP-type configura-
                                                                     sions are not included. An additional aerosol emission
tion; i.e., the model is constrained by a prescribed sea sur-
                                                                     data set, combining emissions from the Evaluating the Cli-
face temperature and sea ice climatology representative of
                                                                     mate and Air Quality Impacts of Short-Lived Pollutants
preindustrial conditions. Only anthropogenic aerosol emis-
                                                                     (ECLIPSE) project (Stohl et al., 2015) version 3 and updated
sions are increased to the present-day level, corresponding
                                                                     fire emissions from the GFED version 3.1 (van der Werf
to the year 2000. Following Kipling et al. (2016) we use an
                                                                     et al., 2010) as well as aviation emissions, representative of
on–off approach for analyzing the sensitivity to several pro-
                                                                     the year 2010 is implemented in the experiment Aero2010.
cesses, and in other cases use an observationally motivated
                                                                     As the altered emission data set represents a later emission
parameter range. Sensitivity simulations with changes in pro-
                                                                     year, differences between the default and alternative emis-
cesses influencing the vertical distribution of aerosol were
                                                                     sion data set can encompass interannual variability besides
performed, and a control simulation serves as a reference.
                                                                     differences in the data set construction. With this experiment,
This experiment setup isolates changes in aerosol distribution
                                                                     the model sensitivity to more recent aerosol emissions can be
driven by the selected processes. We note here that changes
                                                                     tested.
in the sensitivity experiments are applied globally so that ef-
                                                                        In NorESM1-M, biomass burning aerosols (consisting of
fects in the focus regions may also be driven by changes on
                                                                     BC and OM) are emitted at eight model levels. The sen-
the larger scale. The single-process approach taken here dif-
                                                                     sitivity to the emission height of biomass burning aerosols
fers from methods of statistical sampling of a broad param-
                                                                     is tested here using four experiments with varying emission
eter space to identify key drivers of uncertainty, which has
                                                                     height. For the first experiment all biomass burning emis-
been demonstrated by, e.g., Lee et al. (2011, 2012, 2013) to
                                                                     sions were inserted at the lowest predefined emission level
be useful for investigating sources of uncertainty in model
                                                                     (Aero2000_surface_inj), and in the second one all biomass
representation of CCN.
                                                                     burning emissions were inserted above the cloud layer at the
   Our methods target specific processes relevant for the ver-
                                                                     highest predefined emission level at approximately 510 hPa
tical aerosol distribution, and in combination with the limited
                                                                     on average (Aero2000_high_inj). The third experiment in-
geographical distribution and dynamical similarity of the fo-
                                                                     serts biomass burning aerosols uniformly over all eight emis-
cus regions, we can isolate factors for which there are phys-
                                                                     sion levels (Aero2000_uniform_inj), ranging from the sur-
ical reasons to expect an effect on the vertical distribution
                                                                     face up to approximately 510 hPa. Finally, all biomass burn-
in the given areas. The on–off approach (see Kipling et al.,
                                                                     ing aerosols were injected at the three lowest emission lev-
2016), rather than mimicking realistic variations, helps to
                                                                     els, which are within the boundary layer in these regions
identify processes controlling the vertical aerosol distribution
                                                                     (Aero2000_PBL_inj), ranging from the surface to 930 hPa.
and highlights the importance of basic physical processes and
                                                                        The size of primary emitted particles can influence the
their representation in the model for the vertical distribution
                                                                     vertical distribution through changes in removal and trans-
of aerosol. We note that the results of the sensitivity study are
                                                                     port processes. Due to the large variability in the control
limited to the individual parameters and ranges chosen, and
                                                                     simulation (SD up to 76 %), we test the sensitivity to par-
potential effects of interaction between processes and param-
                                                                     ticle size by increasing and decreasing the radii of primary
eters cannot be uncovered; see Lee et al. (2011).
                                                                     emitted particles by as much as ±50 % in two experiments
   All model simulations were run for a simulation time of
                                                                     (Aero2000_aero_small_50 and Aero200_aero_large_50, re-
10 years, following a 1-year spin-up period. A summary of
                                                                     spectively).
all experiments can be found in Table 1, and a more detailed
description of all experiments, divided into the categories of
                                                                     3.2.2   Deposition
emissions, deposition, vertical transport, microphysics, and
aerosol optical properties following Kipling et al. (2016), is
                                                                     Deposition constitutes the main aerosol sink and is hence
presented in the following.
                                                                     also of direct relevance to the aerosol distribution in the
                                                                     model. All aerosol types are affected by wet and dry depo-
3.2.1    Emissions                                                   sition in the model, and here an on–off approach was used
                                                                     to study the sensitivity to these two main removal processes
The magnitude, altitude, and type of emissions, or anthro-           (Aero2000_nowetdep and Aero2000_nodrydep). Dry depo-
pogenic aerosol sources, directly affect the distribution of         sition takes the particle size into account and has an addi-
aerosol. In this category of sensitivity experiments we vary         tional gravitational settling for coarse particles. Wet deposi-
the emission data set, emission height, and emitted particle         tion represents in-cloud and below-cloud scavenging, whose

Atmos. Chem. Phys., 21, 577–595, 2021                                                   https://doi.org/10.5194/acp-21-577-2021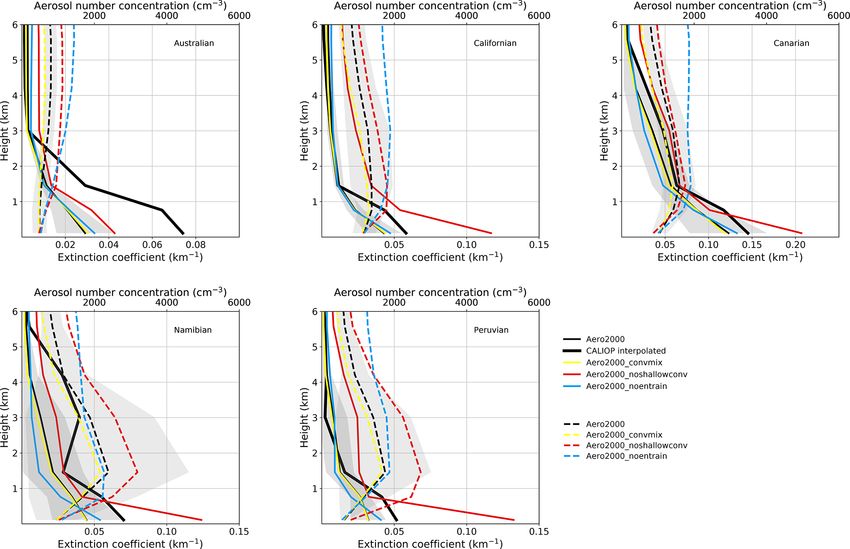
L. Frey et al.: Vertical aerosol distribution in NorESM1-M 581
Table 1. Summary and short description of control and sensitivity experiments.
Experiment name Experiment description
Aero2000 Control experiment
Emissions Aero2010 ECLIPSE aerosol emissions from 2010
Aero2000_surface_inj BC aerosol emissions inserted at the lowest model emission level
Aero2000_uniform_inj BC aerosol emissions inserted uniformly in height
Aero2000_high_inj BC aerosol emissions inserted at the highest model emission level
Aero2000_PBL_inj BC aerosol emissions inserted at the three lowest model emission levels
Aero2000_aero_small_50 emitted particle size decreased by 50 %
Aero2000_aero_large_50 emitted particle size increased by 50 %
Transport Aero2000_noshallowconv no aerosol transport by shallow convection
Aero2000_convmix improved convective mixing of aerosols
Aero2000_noentrain no entrainment for convective clouds
Deposition Aero2000_nodrydep no dry deposition
Aero2000_nowetdep no wet deposition
Aero2000_noscav_belowcloud no scavenging
Aero2000_noscav_incloud no scavenging in cloud
Microphysics Aero2000_noautoconv no autoconversion for warm clouds
Aero2000_precip_autoconv_1 lower critical precipitation rate for autoconversion
Aero2000_rcrit_autoconv_5 critical radius of cloud droplets changed to 5 µm
Aero2000_omegamin_30 maximum subgrid vertical velocity set to 30 ms−1
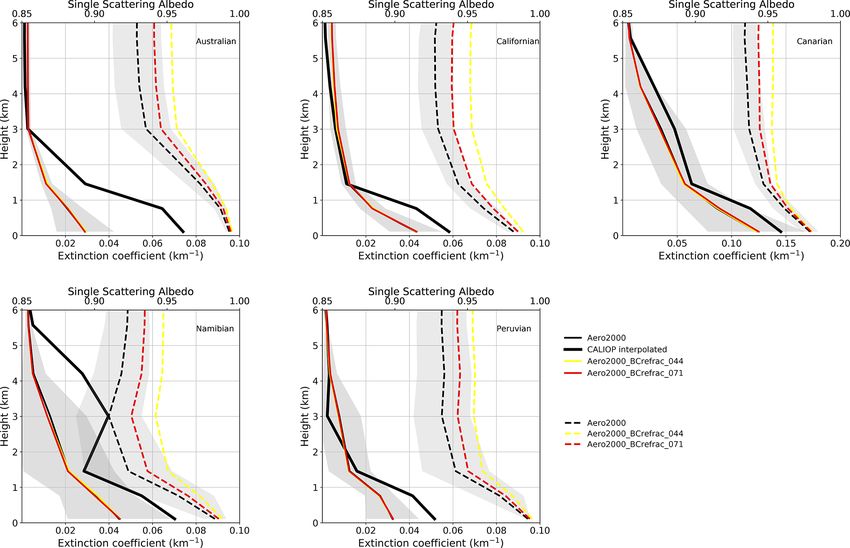
Properties Aero2000_BCrefrac_044 BC refractive index changed to 0.44
Aero2000_BCrefrac_071 BC refractive index changed to 0.71
impact was broken down into two separate experiments al- ment of dry air into the moist cloud layer. The sensitivity
lowing only below-cloud (Aero2000_noscav_incloud) and to entrainment was studied, again using an on–off approach
only in-cloud scavenging (Aero2000_noscav_belowcloud). (Aero2000_noentrain) and turning off entrainment for con-
In-cloud scavenging refers to nucleation and impaction by vective clouds.
cloud droplets, through which aerosols can enter cloud
droplets, whereas below-cloud scavenging refers to aerosol 3.2.4 Cloud microphysics
removal by impaction of falling rain droplets. Aerosols can
be liberated by evaporation of cloud droplets. Activation of aerosols to form cloud droplets and conver-
sion of cloud droplets to rain drops are microphysical pro-
3.2.3 Vertical transport cesses that can affect the vertical distribution and properties
of aerosols. In this category of experiments, we target micro-
For given sources and sinks, transport can further af- physical parameterizations in the model.
fect the vertical aerosol distribution in the model, and the We first vary the efficiency of the autoconversion, i.e., the
vertical transport of aerosols is primarily controlled by transformation of cloud water into rainwater, which in turn
convection. To test the sensitivity of the aerosol extinc- controls removal of aerosol particles through wet deposition.
tion profile to convective transport, the original convec- In addition to the extreme scenario to switch off autoconver-
tion scheme was replaced with a modified version that as- sion in warm clouds (Aero2000_noautoconv), two more pa-
sumes full mixing of aerosols between updrafts and down- rameters that control the autoconversion rate in NorESM1-
drafts in convective clouds (Aero2000_convmix); see Seland M were changed; the critical droplet radius for the on-
et al. (2008). Furthermore, in one experiment the shallow set of autoconversion was decreased from the default value
convection parameterization was switched off completely of 14 to 5 µm (Aero2000_rcrit_autoconv_5), and the crit-
(Aero2000_noshallowconv), affecting not only the convec- ical precipitation rate for an amplification of autoconver-
tive transport of aerosols, but also of heat, moisture, and mo- sion was decreased from the default of 5.0 to 1.0 mm d−1
mentum. As the model resolution is too coarse to resolve (Aero2000_precip_autoconv_1).
convection, it is an extreme scenario to turn off the shal- The activation of cloud droplets depends on the vertical
low convection scheme, but it emphasizes the importance of velocity on the cloud scale. NorESM1-M uses a characteris-
shallow convective transport for the vertical distribution of tic subgrid vertical velocity, which is parameterized through
aerosols. Aerosols are also vertically displaced by entrain- the turbulent diffusion coefficient and a constant character-
https://doi.org/10.5194/acp-21-577-2021 Atmos. Chem. Phys., 21, 577–595, 2021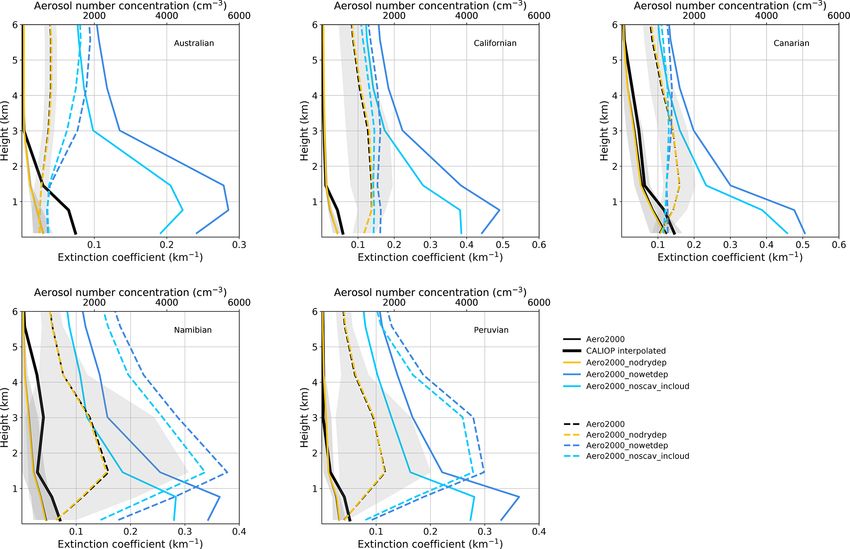
582 L. Frey et al.: Vertical aerosol distribution in NorESM1-M
istic mixing length (see Morrison and Gettelman, 2008); it
represents the variability within one model grid box. Due to
a high variability of the control simulation, the default value
of 10 ms−1 , based on Morrison and Gettelman (2008), was
increased to an extreme value of 30 ms−1 in the sensitivity
experiment Aero2000_omegamin_30. This is a very high ve-
locity that may produce large supersaturations and activate
smaller aerosols than a more realistic choice for stratocumu-
lus clouds, but this extreme choice is made to illustrate the
impact of vertical velocity on the aerosol distribution.
3.2.5 Aerosol optical properties
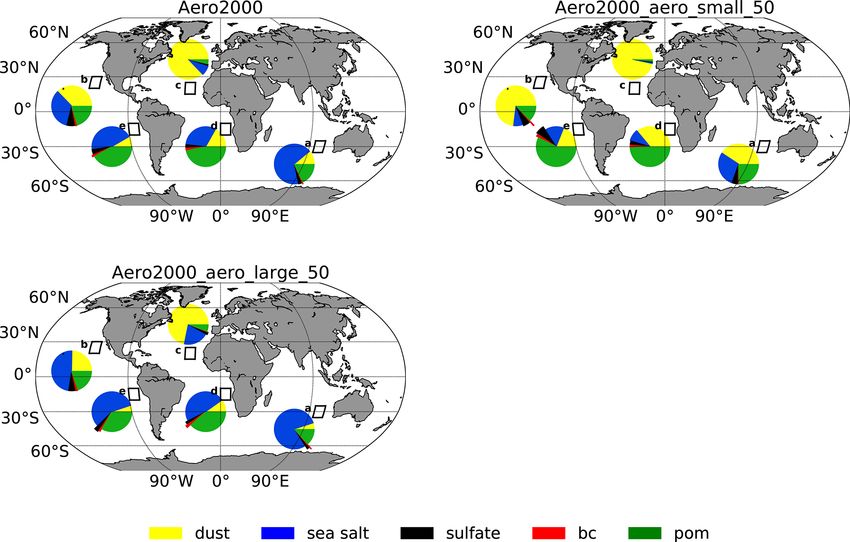
To address the fact that aerosols above clouds tend to Figure 1. The relative columnar burden contribution of each aerosol
be insufficiently absorbing in models (Peers et al., 2016), type to the total column burden in the control simulation in five
we also alter the aerosol optical properties in the model. regions of marine stratocumulus clouds. The boxes indicate the
Peers et al. (2016) found that climate models with a re- five regions of stratocumulus clouds – a: Australian, b: Californian,
fractive index for BC of 0.71 show better agreement with c: Canarian, d: Namibian, e: Peruvian.
satellite observations compared to models with a refrac-
tive index of 0.44. Here, BC is prescribed as fully ab-
4 Results
sorbing with a default imaginary part of the refractive in-
dex of 1.00, but to test the sensitivity to this optical prop- 4.1 Regional characteristics
erty we decreased it to 0.44 (Aero2000_BCrefrac_044) and
0.71 (Aero2000_BCrefrac_071), making the pure BC in the The focus regions are similar in regard to dynamical regime
model more reflecting. but differ in their aerosol signature (e.g., Frey et al., 2017).
These subtropical marine stratocumulus regions are located
3.3 Model output and post-processing in the subsiding branch of the Hadley cell, and the capping
inversion limits the vertical cloud extent.
To evaluate the effects of the sensitivity experiments on the
Figure 1 shows the column burden of the five aerosol types
vertical aerosol distribution, monthly mean model output was
represented in the model relative to the total column burden
used, and profiles of the total aerosol extinction coefficient
for the control simulation. In all regions, the largest contri-
and aerosol number concentration were compared. The mean
bution to the total column burden comes from dust and sea
aerosol profiles were obtained by averaging all grid points in
salt aerosols, in agreement with Textor et al. (2006), but in
each of the focus regions at each vertical model level, fol-
the Namibian and Peruvian regions biomass burning aerosols
lowing Koffi et al. (2012, 2016). As shown by Koffi et al.
(including both BC and OM) account for almost 50 % of the
(2012), colocating the model grid to match CALIOP coordi-
total aerosol burden. The Canarian region, located downwind
nates causes only little variation in averaged regional aerosol
of the Sahara, is dust-dominated, and the Californian region
profiles, indicating that the regional coverage by CALIOP is
has a high contribution of sulfate aerosols compared to other
sufficient for the averaging method used here. As the model
regions.
output is represented as monthly means, the output cannot
be extracted along the CALIPSO overpasses at the times of 4.2 Observed vertical aerosol extinction distribution
the overpasses. This lack of spatial and temporal colocation
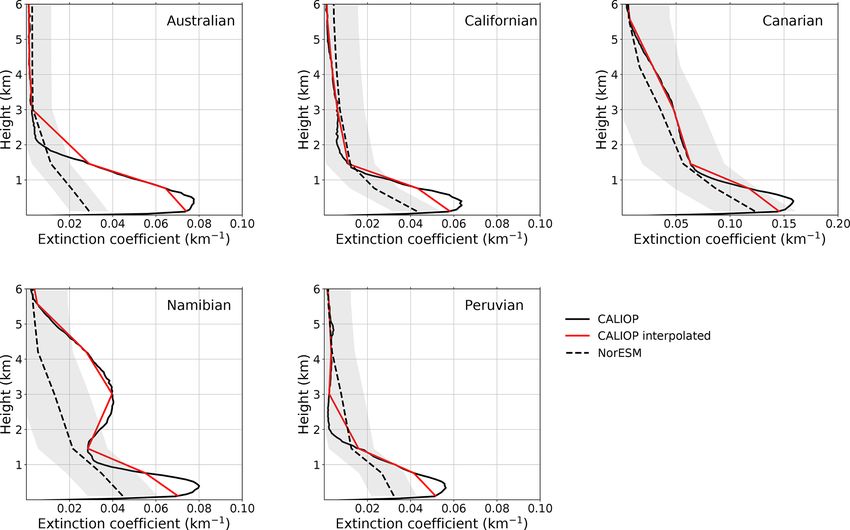
could induce sampling errors (Schutgens et al., 2016, 2017). Figure 2 shows the vertical distribution of the total aerosol
In addition, the aerosol column burden, i.e., a mass measure extinction coefficient retrieved from CALIOP in comparison
of aerosols, is investigated. The monthly model output is av- with the model control simulation for the five focus regions.
eraged over the 10-year simulation period to obtain a cli- The vertical resolution of CALIOP data is higher than the
matological mean. To indicate the variability of the model coarse model resolution, and CALIOP vertical levels were
control simulation, we use a ±1 SD (SD: standard deviation) linearly interpolated to the equivalent model levels to facili-
range of the monthly model output, which is referred to as tate comparison (see Sect. 2). Figure 2 shows both the orig-
the uncertainty range in the subsequent analysis of the sensi- inal and the coarser-resolution versions of the CALIOP pro-
tivity experiments. files.
The variability is greatest in the dust-dominated Canarian
region, which is also the region where the magnitude of the
extinction coefficient is highest for both observations and
model output.
Atmos. Chem. Phys., 21, 577–595, 2021 https://doi.org/10.5194/acp-21-577-2021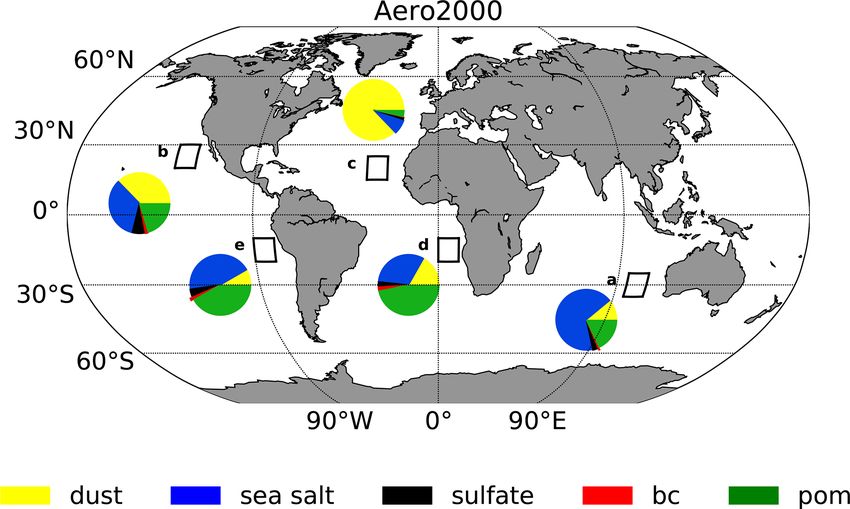
L. Frey et al.: Vertical aerosol distribution in NorESM1-M 583
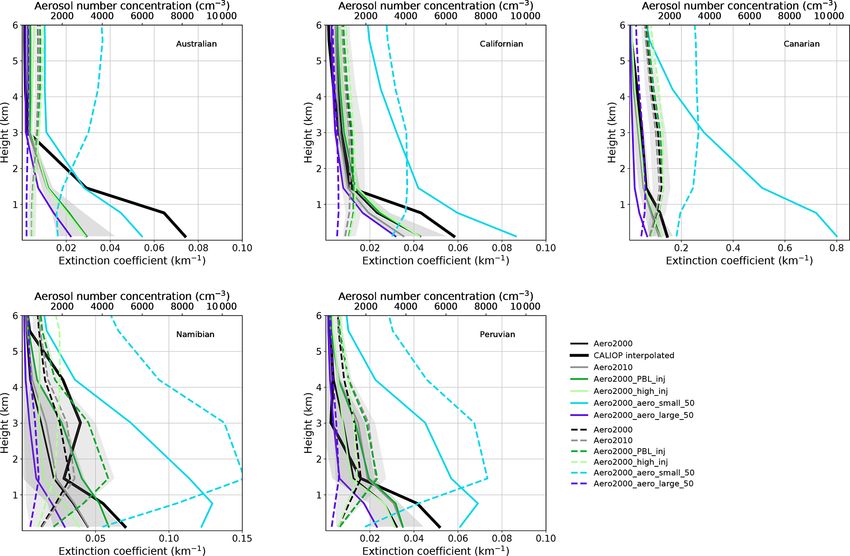
Figure 2. Vertical distribution of the total aerosol extinction coefficient (km−1 ) for CALIOP data from 2007 to 2016 for the Australian,
Californian, Canarian, Namibian, and Peruvian regions (solid black line). The CALIOP vertical levels were interpolated to the corresponding
model levels (solid red line). In addition, the model control simulation averaged over 10 years is shown (dashed line) with the SD (grey
shaded area).
The original CALIOP distribution of aerosol extinction represented with the given resolution, it may be lost to diffu-
shows an increase in magnitude with height in the boundary sion too quickly.
layer and then a decrease throughout the troposphere, except
in the Namibian and Canarian regions, where local maxima 4.3 Sensitivity experiments
in aerosol extinction occur above the boundary layer. The in-
terpolated CALIOP distribution does not show the maximum The large regional variations and discrepancies between
in the boundary layer seen in the original CALIOP distribu- models and observations motivate the wide ranges used in
tion and shows instead a decrease from the surface through- the sensitivity tests, the results of which are shown in the fol-
out the boundary layer. With a few minor exceptions, the lowing. For clarity, only a selected subset of experiments is
model underestimates the magnitude of the aerosol extinc- visualized for each of the five experiment categories.
tion for all regions and levels, and in addition the shape of
the distribution in the vertical differs between the model and 4.3.1 Emissions
observations. If compared to the original CALIOP distribu-
tion, the model has difficulties representing the distinct ob- The choice of an alternative aerosol emission data set
served maximum in aerosol extinction in the boundary layer, (Aero2010) yields an increase in aerosol extinction and
in agreement with the findings of Koffi et al. (2012). If com- aerosol number concentration, mainly in the lower tropo-
pared to the interpolated CALIOP distribution, the model sphere in the biomass burning regions (see Fig. 3), but only
distribution shows better agreement in the boundary layer, in the Peruvian region does the increase in aerosol number
with a decrease in extinction from the surface throughout the concentration fall outside the uncertainty range of the control
boundary layer. This indicates that the model resolution is simulation (±1 SD; based on monthly means for 10 years). A
too coarse to resolve relevant processes in the boundary layer. decrease in both aerosol extinction and number occurs in the
The elevated aerosol layers in the Canarian and Namibian re- other regions. The ECLIPSE emission data set for the year
gions, seen in both the original and the interpolated CALIOP 2010 compared to the model’s default IPCC AR5 data set
distributions, are underestimated and not well represented in for the year 2000 shows a higher total aerosol optical depth
the model. This indicates that resolution is not the limiting (AOD) and absorption aerosol optical depth (AAOD) in the
factor for representing the above-cloud aerosol layer. How- biomass burning regions (see Fig. 4).
ever, even if an aerosol layer or plume can be instantaneously The variation in injection height of biomass burning
aerosols mainly affects, as expected, the two biomass burn-
https://doi.org/10.5194/acp-21-577-2021 Atmos. Chem. Phys., 21, 577–595, 2021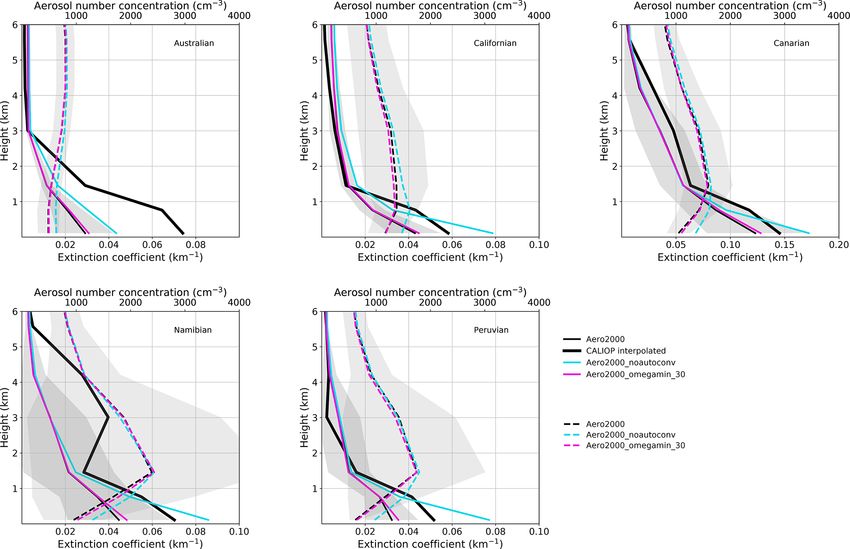
584                                                                     L. Frey et al.: Vertical aerosol distribution in NorESM1-M

Figure 3. Vertical distribution of the aerosol extinction coefficient (km−1 ; solid line) and aerosol number concentration (cm−3 ; dashed line)
for the Australian, Californian, Canarian, Namibian, and Peruvian regions for the model control simulation and sensitivity experiments in
the category emissions. The SD of the model control simulation is indicated as a grey shaded area.

Figure 4. Global distributions of differences in aerosol optical depth (a) and absorption aerosol optical depth (b) between the sensitivity
simulation Aero2010 and the control simulation Aero2000. The boxes indicate the five regions of stratocumulus clouds – a: Australian, b:
Californian, c: Canarian, d: Namibian, e: Peruvian.

ing regions, particularly the Namibian region. Inserting all              and Namibian regions does an increase in aerosol number
biomass burning aerosols higher up in the free troposphere                and extinction occur above the boundary layer (not shown).
(Aero2000_high_inj) leads to a higher aerosol number con-                 Emitting all biomass burning aerosols in the boundary layer
centration and extinction in the upper troposphere and a de-              (Aero2000_PBL_inj) yields a significant increase in extinc-
crease in the lower troposphere (Fig. 3). Shifting the insertion          tion throughout this layer and also above in the Namibian re-
to the surface (Aero2000_surface_inj) leads to a reduction                gion, and it leads to an improved distribution compared to the
in aerosol number and extinction throughout the troposphere               observations. Nevertheless, the observed distribution with a
(not shown). Choosing a uniform insertion over all emission               local maximum extinction in the boundary layer cannot be
levels (Aero2000_uniform_inj) leads to a similar distribu-                reproduced by the model.
tion as in the control simulation, and only in the Canarian

Atmos. Chem. Phys., 21, 577–595, 2021                                                          https://doi.org/10.5194/acp-21-577-2021
L. Frey et al.: Vertical aerosol distribution in NorESM1-M                                                                         585

Figure 5. The relative columnar burden contribution of each aerosol type to the total column burden in the simulations Aero2000,
Aero2000_aero_large_50, and Aero2000_aero_small_50 in five regions of marine stratocumulus clouds. The boxes indicate the five re-
gions of stratocumulus clouds – a: Australian, b: Californian, c: Canarian, d: Namibian, e: Peruvian. A shift in composition can be seen
compared to the control simulation Aero2000.

   All experiments, except the experiment with the use                creasing the size of particles shifts the composition towards
of an alternative emission data set (Aero2010), are mass-             a higher sea salt and lower dust burden in all regions (see
conservative; i.e., the same total aerosol mass was emitted.          Fig. 5).
Hence, changing the size of primary emitted particles also               In the Canarian, Peruvian, and Namibian regions a change
leads to changes in aerosol numbers and the aerosol size              in the shape of the vertical distribution can be noticed in re-
distribution. Increasing the size (Aero2000_aero_large_50)            sponse to the decrease in size, with a more pronounced max-
shifts the distribution to larger but fewer particles and subse-      imum in aerosol extinction in the boundary layer.
quently yields a decrease in aerosol extinction, with a strong
response in the Canarian region. Decreasing the size of all           4.3.2   Deposition
particles (Aero2000_aero_small_50) leads to the opposite ef-
fect, with an increase in aerosol number concentration, es-           Turning off one of the removal processes leads in all cases
pecially in the Namibian and Peruvian regions, and an in-             to an increase in aerosol number concentration (see Fig. 6),
creased aerosol extinction up to 8 times higher than for the          but the effect is greatest when wet deposition is switched
control simulation in the Canarian region (see Fig. 3). The           off (Aero2000_nowetdep). Changes in aerosol extinction and
increase in number concentration is more similar across re-           number due to turning off dry deposition are small and
gions and hence cannot explain the stronger increase in ex-           within the given uncertainty range of the control simulation
tinction in the Canarian region. As a consequence of the              (Aero2000_nodrydep). All aerosol species are affected by
change in size distribution, the aerosol composition changes          dry and wet deposition, but dry deposition is primarily im-
as well, as an effect of changes in the aerosol life cycle (e.g.,     portant for particles in the coarse mode, like dust and sea salt.
removal processes). A comparison of the regional aerosol              When dry deposition is reduced, the wet deposition increases
burden characteristic of the control experiment (Fig. 1) and          in the model, and this shift between deposition mechanisms
the sensitivity experiments Aero2000_aero_small_50 and                can explain the lack of sensitivity to turned-off dry deposi-
Aero2000_aero_large_50 (Fig. 5) shows an increase in the              tion. Reduced wet deposition does not imply increased dry
dust column burden in all regions subsequent to the de-               deposition due to the difference in aerosol sizes affected, and
crease in size, since the smaller dust particles are less af-         hence the sensitivity to turned-off wet deposition is greater.
fected by gravitational settling. This increase in the dust col-         The dominant removal process of aerosols in the
umn burden in turn yields an enhanced absorption and there-           model is wet deposition, and in-cloud wet scaveng-
fore higher extinction in the Canarian region. Furthermore,           ing accounts for most of the total wet deposition
an increase in the column burden of biomass burning aerosols          (Aero2000_noscav_incloud). Hence, the experiments with
occurs in the Namibian and Peruvian regions. Similarly, in-           no wet deposition and in-cloud scavenging give similar ef-

https://doi.org/10.5194/acp-21-577-2021                                                    Atmos. Chem. Phys., 21, 577–595, 2021
586                                                                     L. Frey et al.: Vertical aerosol distribution in NorESM1-M

Figure 6. Vertical distribution of the aerosol extinction coefficient (km−1 ; solid line) and aerosol number concentration (cm−3 ; dashed line)
for the Australian, Californian, Canarian, Namibian, and Peruvian regions for the model control simulation and sensitivity experiments in
the category deposition. The SD of the model control simulation is indicated as a grey shaded area.

fects on the vertical aerosol distribution (see Fig. 6), while            number concentration. Switching off dry deposition gives no
only little effect was found for switching off below-cloud                significant shift in aerosol composition.
scavenging (Aero2000_noscav_belowcloud, not shown). Al-
tering the deposition influences not only the amount of                   4.3.3   Vertical transport
aerosol, but also the shape of the vertical distribution. While
the control simulation shows a steady decrease in aerosol ex-             The modified convective scheme (Aero2000_convmix) re-
tinction with height in the boundary layer, turning off wet               sults in a small decrease in aerosol number concentration and
deposition and in-cloud scavenging leads to an increase with              extinction within the uncertainty throughout the troposphere
height, with a maximum in the boundary layer similar to the               in the focus regions (see Fig. 8).
observed distribution.                                                       When turning off shallow convection, aerosols remain
   In the Californian region, the aerosol number concentra-               closer to the surface, leading to a strong increase in aerosol
tion shows a small increase (within uncertainty) compared to              number and extinction in all regions at all heights compared
the control simulation, and in the Canarian region a decrease             to the control simulation (Aero2000_noshallowconv). Re-
in number in the boundary layer is even seen with no wet de-              sulting changes in aerosol extinction are thereby beyond the
position, while the aerosol extinction shows a strong increase            ±1 SD uncertainty range of the control simulation in all re-
(see Fig. 6). This can be explained by a shift in aerosol com-            gions (see Fig. 8).
position and size resulting from alteration of the deposition                Switching off entrainment for convective clouds
sinks. Figure 7 shows the relative column burden contribu-                (Aero2000_noentrain; see Fig. 8) leads to an increase
tion of the different aerosol types in the focus regions. The             in aerosol number but a decrease or no change in extinction,
aerosol composition is shifted towards a higher burden of sul-            especially in the biomass burning regions.
fate aerosol in all regions in response to switching off wet de-
                                                                          4.3.4   Microphysics
position. Furthermore, in the Australian, Namibian, and Pe-
ruvian regions the dust burden increases, while a decrease                The effect of varying several autoconversion-related
occurs in the Californian and Canarian regions. This shift in             parameters is shown in Fig. 10. The chosen processes
composition affects the extinction more than the changes in               on the microphysical scale have only a weak impact
                                                                          on aerosol extinction and number concentration, with

Atmos. Chem. Phys., 21, 577–595, 2021                                                          https://doi.org/10.5194/acp-21-577-2021
L. Frey et al.: Vertical aerosol distribution in NorESM1-M 587 Figure 7. The relative columnar burden contribution of each aerosol type to the total column burden in the simulations Aero2000, Aero2000_nodrydep, and Aero2000_nowetdep in five regions of marine stratocumulus clouds. The boxes indicate the five regions of stra- tocumulus clouds – a: Australian, b: Californian, c: Canarian, d: Namibian, e: Peruvian. Figure 8. Vertical distribution of the aerosol extinction coefficient (km−1 ; solid line) and aerosol number concentration (cm−3 ; dashed line) for the Australian, Californian, Canarian, Namibian, and Peruvian regions for the model control simulation and sensitivity experiments in the category transport. The SD of the model control simulation is indicated as a grey shaded area. https://doi.org/10.5194/acp-21-577-2021 Atmos. Chem. Phys., 21, 577–595, 2021
588                                                                     L. Frey et al.: Vertical aerosol distribution in NorESM1-M

Figure 9. Vertical distribution of the aerosol extinction coefficient (km−1 ; solid line) and aerosol number concentration (cm−3 ; dashed line)
for the Australian, Californian, Canarian, Namibian, and Peruvian regions for the model control simulation and sensitivity experiments in
the category microphysics. The SD of the model control simulation is indicated as a grey shaded area.

changes within the uncertainties of the control simu-                     in BC reflectivity seems to have the same influence on the
lation (not shown here are Aero2000_rcrit_autoconv_5                      total aerosol extinction as the high BC absorptivity in the
and Aero2000_precip_autoconv_1). Only the ex-                             control simulation.
treme scenario with no autoconversion in warm clouds
(Aero2000_noautoconv), i.e., no precipitating warm clouds,
leads to an increase in aerosol extinction that reaches beyond            5   Discussion
the given uncertainty range in the lower troposphere in all
regions. The increase in extinction is due to a decrease                  Discrepancies between the control simulation and CALIOP
in wet deposition of particles. The shape of the vertical                 satellite data were found in all focus regions with regard to
distribution is not notably affected by the changes in this               the total aerosol extinction and shape of the vertical distri-
subset of microphysical processes (see Fig. 9).                           bution. In particular, the model underestimates the absolute
                                                                          values of aerosol extinction, showing a steady decrease from
4.3.5   Aerosol optical properties                                        the surface, while observations indicate a maximum in the
                                                                          boundary layer. An adaptation of the CALIOP vertical reso-
Decreasing the default value of the imaginary                             lution to the equivalent model resolution gives better agree-
part of the refractive index from 1.0 to val-                             ment. The maximum in the boundary layer is not captured
ues of 0.44 (Aero2000_BCrefrac_044) and 0.71                              with a coarser, model-like vertical resolution for CALIOP.
(Aero2000_BCrefrac_071) makes BC more reflecting.                         This emphasizes the importance of the vertical resolution to
This does not affect the aerosol number concentration, and                resolve mixing and transport processes in the lower tropo-
Fig. 10 shows the single-scattering albedo (SSA; i.e., the                sphere. Also, increased model diffusion at lower model res-
fraction of extinction that is due to scattering) together with           olution might play a role. However, the model also under-
the total extinction to illustrate the effects of the change in           estimates aerosol extinction of elevated aerosol layers seen
BC optical properties. The SSA shows an increase in both                  in two regions in the observations even if compared to the
experiments, i.e., a higher fraction of reflection, as expected.          adapted CALIOP resolution.
The changes in aerosol extinction are, however, small and                    It is also worth noting that while the observations are taken
within the uncertainty of the control experiment. The change              from the period 2007–2016, the emissions used in the model

Atmos. Chem. Phys., 21, 577–595, 2021                                                          https://doi.org/10.5194/acp-21-577-2021
L. Frey et al.: Vertical aerosol distribution in NorESM1-M 589
Figure 10. Vertical distribution of the aerosol extinction coefficient (km−1 ; solid line) and single-scattering albedo (SSA; dashed line) for
the Australian, Californian, Canarian, Namibian, and Peruvian regions for the model control simulation and sensitivity experiments in the
category aerosol optical properties. The SD of the model control simulation is indicated as a grey shaded area.
simulations (except in the Aero2010 experiment) are for the or uniformly in height, has less of an effect on the vertical
year 2000, and year-to-year variability in aerosol emissions profile, in agreement with Kipling et al. (2016).
may contribute to discrepancies between observed and mod- The choice of the aerosol emission inventory was also
eled vertical profiles. found to be important for determining the magnitude of to-
The sensitivity experiments performed suggest that the al- tal vertically integrated aerosol extinction, in agreement with
terations that have the largest impact on the aerosol vertical the findings of Kirkevåg et al. (2013). By choosing aerosol
profiles are found in the categories emissions, deposition, and emissions for the year 2010 a higher extinction and subse-
vertical transport, whereas changes in the categories micro- quently a higher AOD was produced, especially in biomass-
physics and aerosol optical properties have less of an effect. burning-dominated areas. Considering the small interannual
However, none of the chosen alterations of parameters and variability in biomass burning aerosol emissions from the
processes affecting the vertical distribution of aerosol extinc- main burning regions found by Giglio et al. (2010), the dif-
tion in the model are sufficient to reproduce the observed dis- ferences between the two emission data sets are more likely
tribution. For instance, the emission height of biomass burn- related to differences in resolution and data collection than
ing aerosols directly influences the aerosol vertical profile. to interannual variability. As discussed in Giglio et al. (2010)
This is despite the alterations in many cases going beyond and van der Werf et al. (2010), emissions in GFED3 have in-
what might be considered a realistic range, i.e., by turning creased compared to GFED2 due to an improved mapping
processes off completely (e.g., in the case of wet deposi- approach of burned areas using MODIS and a higher reso-
tion and autoconversion) or choosing extreme parameter val- lution of 0.5◦ compared to GFED2 with 1◦ resolution. Pre-
ues (e.g., in the case of vertical velocity). One example of a vious studies have also pointed at the importance of the spa-
modification that does affect the vertical profile towards bet- tial (Possner et al., 2016) and temporal resolution (Dentener
ter agreement with observations in the Namibian region is et al., 2006) of aerosol emissions.
the emission height of biomass burning. Inserting these ab- In terms of the vertical aerosol distribution, the updated
sorbing aerosols above or within the boundary layer leads to emission data set leads to only a small change within
increased aerosol extinction above the boundary layer, as ex- the uncertainty range of the control simulation. Kipling
pected. Biomass burning aerosol injection at the surface only, et al. (2013) similarly showed that using GFED3 instead of
GFED2 biomass burning emissions leads to only a moder-
https://doi.org/10.5194/acp-21-577-2021 Atmos. Chem. Phys., 21, 577–595, 2021590 L. Frey et al.: Vertical aerosol distribution in NorESM1-M ate improvement of the vertical BC distribution compared to and with observations. The in-plume approach, with wet observations, without statistical significance. scavenging directly linked to the convective scheme, imple- Another important factor that can control the vertical mented in NorESM1-M is in line with the recommendations distribution of aerosol is the size of emitted aerosol par- in Kipling et al. (2013). ticles. The sensitivity experiments performed are mass- Turning off either of the convective schemes, shallow or conservative, except the experiment with an alternative emis- deep convection, does not switch off convective transport sion data set, meaning that changes in emission particle sizes of aerosols completely; i.e., switching off shallow convec- lead to a shift in the entire size and number distribution. Here tion still allows deep convection and vice versa. However, we find that the shape of the vertical distribution in the model the complete inhibition of the shallow convective scheme is highly sensitive to the size of emitted particles. Decreas- largely affects the aerosol distribution. Without the shallow ing the size results in more numerous smaller particles and convection scheme, i.e., allowing only deep convection, the produces a maximum in aerosol extinction in the boundary shape of the vertical distribution changes, with a more pro- layer in the Canarian, Namibian, and Peruvian regions. This nounced increase close to the surface. Particles remain closer is not only an effect of changes in aerosol number concen- to the surface as they cannot be lifted higher, leading to an tration and size distribution, but also of the resulting shift in increase in aerosol number concentration and extinction, es- aerosol composition produced by the model in response to pecially in the boundary layer. Hence, shallow convection in the change in size distribution. the model is essential for transporting aerosols to the mid- Large responses were also seen in the sensitivity exper- dle troposphere in the focus regions, consistent with Kipling iments focusing on removal processes, particularly for the et al. (2016), who showed that vertical transport of aerosol cases of altered wet deposition. Dry deposition mainly af- on the global scale is dominated by convective processes on fects larger particles, and cutting this sink off leads to a small unresolved scales. Hoyle et al. (2011) further highlighted the decrease in extinction throughout the vertical column, ex- importance of the parameterization of convective processes cept in the Peruvian region. An additional reason for the for tracers with a short lifetime. Another important transport small effect of reducing dry deposition is that this shifts the process for aerosols is entrainment, and cutting off this mix- aerosol removal to wet deposition, which increases accord- ing for convective clouds results in a decrease in extinction in ingly. Hence, the small sensitivity of aerosol extinction and the boundary layer and an increase in the upper troposphere number to turned-off dry deposition is not necessarily an in the biomass burning regions. However, the entrainment indication that this process is not relevant, but rather that particularly controls the amount of aerosol above the bound- changes are compensated for by other processes. Wet de- ary layer and is crucial for the formation of cloud droplets via position, on the other hand, affects all particles and is the provision of CCN. Entrainment can have a strong effect on major removal process for aerosol particles in the model. the characteristics of parameterized convective clouds (see, Cutting off this removal pathway leads to a large increase e.g., Labbouz et al., 2018). in extinction and a modified shape of the vertical distribu- Microphysical processes, though linked to wet removal tion. In-cloud scavenging contributes more than below-cloud processes, have less of an impact on the vertical aerosol scavenging to the total wet deposition, and hence turning off distribution. Altering the process of autoconversion results in-cloud scavenging has similar effects as turning off wet de- only in small changes in aerosol number and extinction, and position completely, while turning off below-cloud scaveng- only the extreme scenario of switching off autoconversion ing has little effect, in agreement with Kipling et al. (2016) completely in warm clouds leads to a significant increase in and Vignati et al. (2010). Hence, the representation of wet aerosol number and extinction in the boundary layer. How- deposition is important for the vertical aerosol distribution in ever, autoconversion and the subgrid vertical velocity are im- the model, in agreement with the findings of Vignati et al. portant processes in the model regarding cloud properties. (2010), Croft et al. (2009, 2010), and Kipling et al. (2013). Previous studies pointed at the importance of the autoconver- Changes in the removal processes also affect the aerosol sion parameterization for aerosol indirect effects (e.g., Rot- composition in the model. Inhibited wet deposition increases stayn and Liu, 2005; Golaz et al., 2011) and the represen- the amount of sulfate, BC, and OM, as this is the main re- tation of the cloud lifetime effect in models (Michibata and moval process for these aerosol types, but decreases the rel- Takemura, 2015). White et al. (2017) further showed that the ative amount of dust, which is less affected by this removal difference between microphysics schemes (and their auto- process. The smaller portion of wet deposition that is due to conversion in particular) can be greater than the non-albedo below-cloud scavenging also affects composition but is less aerosol indirect effects. Also, the importance of the subgrid efficient for Aitken- and accumulation-mode particles, a size variability of the vertical velocity when estimating aerosol in- range in which, e.g., BC is found. direct effects was highlighted (Golaz et al., 2011), and West Kipling et al. (2013) discussed the coupling between wet et al. (2014) demonstrated the importance of subgrid vertical scavenging and convective transport as well as its impor- velocity variability in another model. tance for the representation of the vertical aerosol distribu- Finally, turning to optical properties, our results indicate tion by comparing HadGEM-UKCA with ECAHM5-HAM2 that they have little impact on the vertical aerosol profile. Atmos. Chem. Phys., 21, 577–595, 2021 https://doi.org/10.5194/acp-21-577-2021
You can also read


