The response of the Amazon ecosystem to the photosynthetically active radiation fields: integrating impacts of biomass burning aerosol and clouds ...
←
→
Page content transcription
If your browser does not render page correctly, please read the page content below
Atmos. Chem. Phys., 21, 14177–14197, 2021
https://doi.org/10.5194/acp-21-14177-2021
© Author(s) 2021. This work is distributed under
the Creative Commons Attribution 4.0 License.

The response of the Amazon ecosystem to the photosynthetically
active radiation fields: integrating impacts of biomass burning
aerosol and clouds in the NASA GEOS Earth system model
Huisheng Bian1,2 , Eunjee Lee3,4 , Randal D. Koster4 , Donifan Barahona4 , Mian Chin2 , Peter R. Colarco2 ,
Anton Darmenov2 , Sarith Mahanama5,4 , Michael Manyin5,4 , Peter Norris3,4 , John Shilling6 , Hongbin Yu2 , and
Fanwei Zeng5,4
1 JointCenter for Environmental Technology UMBC, Baltimore, MD 21250, USA
2 Laboratory for Atmospheres, NASA Goddard Space Flight Center, Greenbelt, MD 20771, USA
3 Goddard Earth Sciences Technology and Research, Universities Space Research Association, Columbia, MD 21046, USA
4 Global Modeling and Assimilation Office, NASA Goddard Space Flight Center, Greenbelt, MD 20771, USA
5 Science Systems and Applications, Inc., Lanham, MD 20706, USA
6 Atmospheric Sciences and Global Change Division, Pacific Northwest National Laboratory, Richland, WA 99352, USA

Correspondence: Huisheng Bian (huisheng.bian@nasa.gov)

Received: 16 February 2021 – Discussion started: 24 March 2021
Revised: 5 August 2021 – Accepted: 11 August 2021 – Published: 24 September 2021

Abstract. The Amazon experiences fires every year, and the        bon lost due to Amazon fires over the 7 years considered.
resulting biomass burning aerosols, together with cloud par-      Clouds, however, strongly regulate the effectiveness of the
ticles, influence the penetration of sunlight through the atmo-   aerosol diffuse radiation fertilization effect. The efficiency of
sphere, increasing the ratio of diffuse to direct photosynthet-   this fertilization effect is the highest in cloud-free conditions
ically active radiation (PAR) reaching the vegetation canopy      and linearly decreases with increasing cloud amount until
and thereby potentially increasing ecosystem productivity. In     the cloud fraction reaches ∼ 0.8, at which point the aerosol-
this study, we use the NASA Goddard Earth Observing Sys-          influenced light changes from being a stimulator to an in-
tem (GEOS) model with coupled aerosol, cloud, radiation,          hibitor of plant growth. Nevertheless, interannual changes in
and ecosystem modules to investigate the impact of Amazon         the overall strength of the aerosol diffuse radiation fertiliza-
biomass burning aerosols on ecosystem productivity, as well       tion effect are primarily controlled by the large interannual
as the role of the Amazon’s clouds in tempering this impact.      changes in biomass burning aerosols rather than by changes
The study focuses on a 7-year period (2010–2016) during           in cloudiness during the studied period.
which the Amazon experienced a variety of dynamic envi-
ronments (e.g., La Niña, normal years, and El Niño). The di-
rect radiative impact of biomass burning aerosols on ecosys-
tem productivity – called here the aerosol diffuse radiation      1   Introduction
fertilization effect – is found to increase Amazonian gross
primary production (GPP) by 2.6 % via a 3.8 % increase in         The Amazon is home to more than 34 million people and
diffuse PAR (DFPAR) despite a 5.4 % decrease in direct PAR        hosts a large variety of plants and animals. The rainfor-
(DRPAR) on multiyear average during burning seasons. On a         est plays a vital role in the global climate, regulating tem-
monthly basis, this increase in GPP can be as large as 9.9 %      peratures and storing vast quantities of carbon (Laurance,
(occurring in August 2010). Consequently, the net primary         1999; Nepstad et al., 2008). It is matter of intense research
production (NPP) in the Amazon is increased by 1.5 %, or          whether light or water is the limiting factor that controls plant
∼ 92 Tg C yr−1 – equivalent to ∼ 37 % of the average car-         growth over Amazonia. Considerable evidence demonstrates
                                                                  that sunlight indeed drives Amazon forest growth (Doughty

Published by Copernicus Publications on behalf of the European Geosciences Union.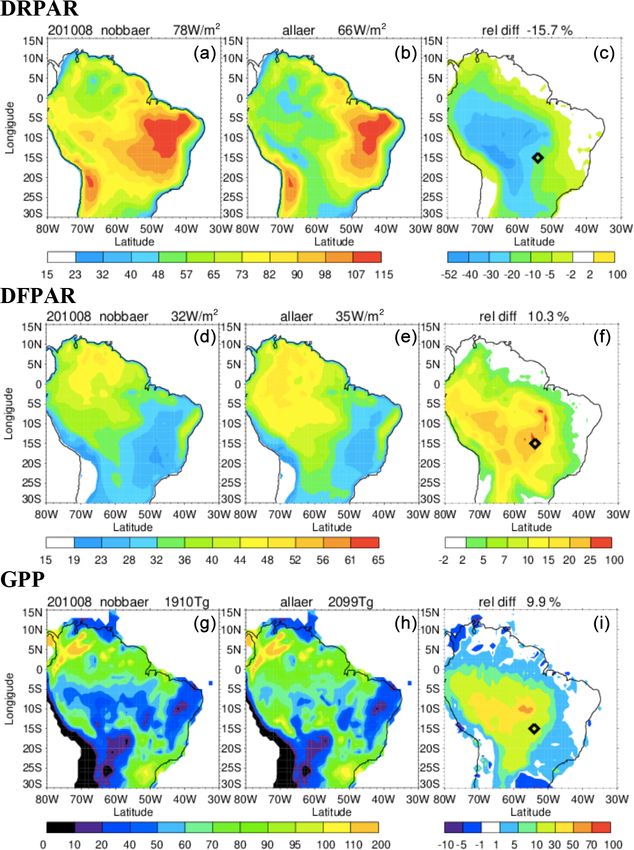
14178                                           H. Bian et al.: Aerosol and cloud radiative effects on the Amazon ecosystem

et al., 2019; Huete et al., 2006; Myneni et al., 2007), although   indicated that biomass burning aerosols lead to increases of
water deficit could be a limiting factor during severe droughts    about 27 % in Amazonian gross primary production (GPP)
(Doughty et al., 2015; Feldpausch et al., 2016; Saatchi et al.,    and 10 % in plant respiration as well as a decline in soil res-
2013). Satellite observations show a clear seasonal cycle with     piration of 3 %. However, their approach assumes cloud-free
a gradual crescendo in both leaf area and incoming surface         conditions through their use of a diffuse irradiance parame-
sunlight beginning at the onset of the dry season (∼ August–       terization based on the multiwavelength aerosol optical depth
November) (Myneni et al., 2007). Vegetation index maps             (AOD) measurement. Malavelle et al. (2019) explored the
also show that a majority of Amazonia is greener in the dry        overall net impact of biomass burning aerosol on the Amazon
season than in the wet season (∼mid-December–mid-May)              ecosystem using an Earth system model (ESM) (HadGEM2-
(Huete et al., 2006). It is in the dry season, when more light     ES, The Hadley Centre Global Environment Model, version
reaches the canopy level, that the Amazon forest thrives.          2 – Earth System). They estimated NPP to increase by 80 to
   Plant photosynthesis requires sunlight to reach the leaves      105 Tg C yr−1 , or 1.9 % to 2.7 %, ascribing this net change to
of the canopy. While aerosols and clouds in the atmosphere         an increase in diffuse light, a reduction in the total amount of
decrease the total amount of light that reaches the canopy,        radiation, and feedback from climate adjustments in response
they also increase scattering, thereby increasing the ratio of     to the aerosol forcing. Their study takes into account the dy-
diffuse radiation to direct radiation. This is important be-       namic feedback of short-lifetime cloud fields. However, the
cause the efficiency of plant photosynthesis increases under       authors have not explicitly quantified the impact of Amazon
diffuse sunlight – a phenomenon both explained theoretically       background clouds and their interannual changes in temper-
(Rap et al., 2015; Roderick et al., 2001; Zhou et al., 2020)       ing the aerosol diffuse radiation fertilization effect (DRFE).
and observed in the field (Cirino et al., 2014; Doughty et al.,       When clouds and aerosol co-exist, the impact from clouds
2010; Ezhova et al., 2018; Gu et al., 2003; Lee et al., 2018;      on the ecosystem typically dominates because clouds are op-
Niyogi et al., 2004; Oliveira et al., 2007). Leaf photosynthe-     tically thicker. The surface sunlight for cloudy versus cloud-
sis increases nonlinearly with solar radiation, becoming sat-      free conditions can differ greatly even if the AOD is the same.
urated on bright days at light levels above which leaves can-      (Note that, unless specified otherwise, solar radiation in this
not take more light (Gu et al., 2003; Mercado et al., 2009).       study refers to the wavelength range of 400–700 nm, i.e.,
Under clear- and clean-sky conditions, particularly around         photosynthetically active radiation, or PAR). Measurements
midday, sunlight is mainly direct, and while this allows the       indicate that the desirable range of clearness index (CI) – the
sunlit leaves on top to be light saturated, the shaded leaves      ratio of total (i.e., direct plus diffuse) light at the surface to
below them receive relatively little sunlight and thus partici-    the total incoming light at the top of atmosphere – is around
pate less in photosynthesis (Rap et al., 2015; Roderick et al.,    0.4–0.7 for some forest ecosystems and above 0.3 for peat-
2001). In contrast, under cloudy conditions or in the pres-        land (Butt et al., 2010; Letts and Lafleur, 2005). Quite of-
ence of aerosols, much of the midday light is diffuse, and         ten a low CI occurs during a cloudy day, but on occasion it
diffuse light can penetrate deeper into the canopy and illumi-     might result from the presence of a very thick aerosol layer.
nate shaded leaves. Li and Yang (2015) conducted a cham-           As suggested above, if the CI is high, the diffuse fraction of
ber experiment to explore diffuse light on light distribution      the total solar radiation is low and the overall productivity
within a canopy and the resulting effects on crop photosyn-        of the canopy is reduced. For example, Cirino et al. (2014)
thesis and plant growth. They concluded that diffusion of the      found that the net ecosystem exchange (NEE) of CO2 is in-
incident light improves spatial light distribution, lessens the    creased by 29 % and 20 % at two Amazon stations – the Jaru
variation in temporal light distribution in the canopy, and al-    Biological Reserve (RBJ) and the Cuieiras Biological Re-
lows more light-stimulated growth of shade-tolerant potted         serve at the K34 Large-Scale Biosphere–Atmosphere Experi-
plants.                                                            ment in Amazonia (LBA) tower, respectively – when AOD is
   The situation is more profound during the Amazon dry            0.1–1.5 at 550 nm under clear conditions. Higher AOD (> 3)
season when intensive seasonal fires release large amounts         leads to a strong reduction in photosynthesis (via reducing
of primary aerosol particles as well as gas precursors that        PAR) up to the point where NEE approaches zero. Oliveira
form secondary organic and inorganic aerosols. Using stand-        et al. (2007) found that Amazon forest productivity was en-
alone radiation and vegetation models, Rap et al. (2015)           hanced under moderately thick smoke loading because of
concluded that fires over the Amazon dry season increase           an increase in diffuse solar radiation, but large aerosol load-
Amazon net primary production (NPP) by 1.4 %–2.8 % by              ing (i.e., AOD > 2.7) results in lower net productivity of the
increasing diffuse radiation. This enhancement of Amazon           Amazon forest.
Basin NPP (78–156 Tg C yr−1 ) is equivalent to 33 %–65 %              Despite its name, the Amazon’s “dry season” (June–
of the annual regional carbon emissions from biomass burn-         November) still features significant cloudiness, and the
ing and accounts for 8 %–16 % of the observed carbon sink          interannual variations in the clouds can be large. Further-
across mature Amazonian forests. Moreira et al. (2017) ad-         more, rain does fall during the dry season – close to 40 % of
vanced this analysis by coupling an ecosystem module and           the total annual precipitation falls therein (Li et al., 2006).
aerosol model within a Eulerian transport model. Their study       Clouds in the dry season are mostly formed by small-scale

Atmos. Chem. Phys., 21, 14177–14197, 2021                                           https://doi.org/10.5194/acp-21-14177-2021
H. Bian et al.: Aerosol and cloud radiative effects on the Amazon ecosystem                                              14179

processes that influence the weather (see an example of            2     Model description, data application, and experiment
a uniform layer of “popcorn” clouds observed by the                      setup
Moderate Resolution Imaging Spectroradiometer (MODIS)
on 19 August 2009 in https://earthobservatory.nasa.gov/            2.1    Model description
images/39936/afternoon-clouds-over-the-amazonrainforest,
15 September 2021). It is during this period, when sunlight        The GEOS modeling system connects state-of-the-art mod-
(particularly diffuse light) shines on the trees due to reduced    els of the various components of the Earth’s climate sys-
rain (and fewer clouds) relative to the wet season, that the       tem together using the Earth System Modeling Framework
forest grows the most. A consideration of the joint effects of     (ESMF) (Molod et al., 2015, 2012; Rienecker et al., 2011;
clouds and biomass burning aerosols on diffuse and direct          https://gmao.gsfc.nasa.gov/, 15 September 2021). We dis-
PAR during the dry season is thus particularly important.          cuss here the components of the system that are particularly
   This study has two objectives. First, we investigate how        relevant to our study, including aerosol, cloud microphysics,
Amazon biomass burning aerosols (BBaer) affect the land            radiative transfer, and land ecosystem modules.
productivity (i.e., GPP and NPP) via their impact on direct           GEOS Goddard Chemistry Aerosol Radiation and Trans-
and diffuse PAR (DRPAR and DFPAR). Second, we inves-               port (GOCART) simulates a number of major atmospheric
tigate the sensitivity of the BBaer DRFE to the presence of        aerosol species and precursor gases from natural and anthro-
the Amazon dry-season cloud fields within the range indi-          pogenic sources, including sulfate, nitrate, ammonium, black
cated by the interannual variation in the clouds. In our analy-    carbon (BC), organic aerosol (OA, including primary and
sis, we use a version of the NASA GEOS ESM that includes           secondary OA), dust, sea salt, dimethyl sulfide (DMS), SO2 ,
coupling between aerosol, cloud, radiation, and ecosystem          and NH3 (Bian et al., 2010, 2013, 2017, 2019; Chin et al.,
processes. To our knowledge, only one other study has used         2009, 2014; Colarco et al., 2010, 2017; Murphy et al., 2019;
an ESM to investigate such fire impacts across Amazonia            Randles et al., 2013). Monthly emissions from shipping, air-
(Malavelle et al., 2019), and as noted above, that study did       craft, and other anthropogenic sources are obtained from
not address the ability of Amazon clouds to temper the BBaer       the recent Coupled Model Intercomparison Project version
impacts. Accordingly, our study is the first ESM-based study       6 (CMIP6) Community Emissions Data System (CEDS).
to investigate the BBaer DRFE within a range of interannual        Daily biomass burning emissions are provided by Global
Amazon cloud levels. Together our objectives provide a full        Fire Emissions Database (GFED4s) (https://daac.ornl.gov/
and comprehensive study of BBaer DRFE in a context of po-          VEGETATION/guides/fire_emissions_v4.html, 15 Septem-
tential Amazon dry-season atmospheric conditions.                  ber 2021). Estimates of degassing and eruptive volcanic
   It is necessary to point out, however, that our study focuses   emissions are derived from the Ozone Monitoring Instrument
only on the impact of Amazon biomass burning aerosol. We           (OMI) satellite (Carn et al., 2017). Emissions of dust, sea
do not consider the radiative impacts of other potentially im-     salt, and DMS are dynamically calculated online as a func-
portant aerosols. These other aerosol types have been ex-          tion of the model-simulated near-surface winds and other
amined in various observational studies (e.g., Cirino et al.,      surface properties. A more recent development of GOCART
2014; Ezhova et al., 2018; Hemes et al., 2020; Wang et al.,        relevant to this study involves the modification of the ab-
2018; Yan et al., 2014) and model investigations that fo-          sorbing properties of “brown carbon” from biomass burning
cus, for example, on anthropogenic aerosol (Keppel et al.,         organic aerosols (Colarco et al., 2017) and the inclusion of
2016; O’Sullivan et al., 2016), dust (Xi et al., 2012), bio-       secondary organic aerosol (SOA) produced via chemical re-
genic aerosol (Rap et al., 2018; Sporre et al., 2019), volcanic    actions of volatile organic compounds (VOCs) emitted from
aerosol (Gu et al., 2003), and the general aerosol field (Feng     anthropogenic and biomass burning sources, following the
et al., 2019).                                                     approach developed by Hodzic and Jimenez (2011) and Kim
   The paper is organized as follows. Section 2 describes the      et al. (2015). In addition, the SOA from biogenic sources
NASA GEOS ESM and its relevant modules (Sect. 2.1), the            has been updated with its precursor gases of isoprene and
observational data used for model evaluation and explana-          monoterpene emissions calculated online as a function of
tion (Sect. 2.2), and the experimental setup (Sect. 2.3). Sec-     light and temperature using the Model of Emissions of Gases
tion 3 provides an evaluation of the model (Sect. 3.1), ba-        and Aerosols from Nature (MEGAN) version 2.1 (Guenther
sic theory regarding the impact of aerosol and cloud on the        et al., 2012), assuming an SOA yield of 3 % from isoprene
surface downward radiation (Sect. 3.2), results regarding the      and 5 % from monoterpene oxidations (Kim et al., 2015).
simulated ecosystem response to BBaer-induced radiation               The GEOS two-moment cloud microphysics module is
changes (Sect. 3.3), and the impacts of Amazon background          used in this study. The module includes the implementa-
clouds on this response (Sect. 3.4). A final summary is pro-       tion of a comprehensive stratiform microphysics module,
vided in Sect. 4.                                                  a new cloud coverage scheme that allows ice supersatura-
                                                                   tion, and a new microphysics module embedded within the
                                                                   moist convection parameterization (Barahona et al., 2014).
                                                                   At present, aerosol number concentrations are derived from

https://doi.org/10.5194/acp-21-14177-2021                                         Atmos. Chem. Phys., 21, 14177–14197, 2021
14180                                           H. Bian et al.: Aerosol and cloud radiative effects on the Amazon ecosystem

the GEOS GOCART-calculated aerosol mass mixing ratio               tion depend nonlinearly on solar radiation. The canopy is as-
and prescribed size distributions and mixing state, which are      sumed to consist of sunlit leaves and shaded leaves, and the
then used for cloud condensation nuclei (CCN) activation           DRPAR and DFPAR absorbed by the vegetation are appor-
(following the approach of Abdul-Razzak and Ghan, 2000)            tioned to the sunlit and shaded leaves as described by Thorn-
and ice nucleation (following the approach of Barahona and         ton and Zimmermann (2007). The prognostic carbon stor-
Nenes, 2009) processes. Aerosol–cloud interactions are thus        ages underlying the phenological variables are computed as
accounted for in our simulation. The model calculates vari-        a matter of course along with values of canopy conductance
ous cloud properties, including cloud fraction, cloud droplet      that reflect an explicit treatment of photosynthesis physics.
and ice crystal number concentrations and effective radii, and     These canopy conductances, along with the LAIs diagnosed
cloud liquid and ice water paths. These fields have been eval-     from the new carbon prognostic variables, are fed into the en-
uated against satellite observations and field measurements;       ergy and water balance calculations in the original catchment
the model shows a realistic simulation of cloud character-         LSM. The output fluxes from the merged system include car-
istics despite a few remaining deficiencies (Barahona et al.,      bon fluxes in addition to traditional fluxes of heat and mois-
2014; Breen et al., 2020).                                         ture. The merger of the two models allows Catchment-CN to
   The current default GEOS solar radiation transfer mod-          follow 19 distinct vegetation types. Koster and Walker (2015)
ule is the shortwave rapid radiation transfer model for            have used Catchment-CN within an atmospheric global cir-
general circulation models (RRTMG_SW), a correlated k-             culation model (AGCM) framework to investigate interac-
distribution model (Iacono et al., 2008). This general cir-        tive feedback among vegetation phenology, soil moisture,
culation model (GCM) version utilizes a reduced comple-            and temperature. In this study, the modeled atmospheric CO2
ment of 112 g points, which is half of the 224 g points            from the AGCM is used to drive the carbon, water, and en-
used in the standard RRTMG_SW, and a two-stream method             ergy dynamics in the Catchment-CN model.
for radiative transfer. Total fluxes are accurate to within 1–        In addition to the GEOS ESM, we use a photolysis
2 W m−2 relative to the standard RRTMG_SW (using dis-              scheme, fast-JX, in its stand-alone mode to explore how in-
crete ordinates radiative transfer, DISORT) with aerosols in       coming solar radiation penetrates the atmosphere in the pres-
clear sky and within 6 W m−2 in overcast sky. RRTMG_SW             ence of aerosols and clouds in order to enhance our basic un-
with DISORT is itself accurate to within 2 W m−2 of                derstanding of the role of atmospheric particles on radiation.
the data-validated multiple scattering model, CHARTS.              Fast-JX is based on the original Fast-J scheme, which was de-
RRTMG_SW specifically calculates the direct and diffuse            veloped for tropospheric photochemistry with an interactive
components of PAR (400–700 nm) separately. The GEOS at-            consideration of aerosol and cloud impacts at 291–850 nm
mospheric radiative transfer calculation is designed in a way      (Wild et al., 2000), and Fast-J2, which extended the scheme
that allows users to examine the impact of various combi-          into the deep UV spectrum range of 177–291 nm (Bian and
nations of atmospheric aerosol and cloud fields on radiation.      Prather, 2002).
In addition to the standard calculation of solar radiation for
ambient atmospheric conditions, diagnostic calculations can        2.2   Observational data
be carried out by repeating the calculation of the radiation
transfer scheme with different combinations of atmospheric         We mostly rely on the GoAmazon (Green Ocean Amazon)
conditions: clean air (no aerosols), clear air (no clouds), and    field campaign (https://www.arm.gov/research/campaigns/
clean plus clear air. Using this architecture, for this study we   amf2014goamazon, 15 September 2021) for in situ aerosol
modify the radiation scheme to allow the additional diagno-        observations to assess the model-simulated OA concentra-
sis of radiation fields under conditions of zero BBaer but re-     tions. GoAmazon is an integrated field campaign conducted
tained non-BBaer and ambient clouds.                               in the central Amazon Basin (Martin et al., 2016). Specifi-
   The catchment land surface model (LSM) with carbon and          cally, the following datasets are used: (a) the surface OA con-
nitrogen physics (Catchment-CN) in GEOS is in essence a            centration measured in 2014 by the Aerosol Chemical Spe-
merger of the C–N physics within the NCAR–DOE Com-                 ciation Monitor (ACSM) operated by the Department of En-
munity Land Model (CLM) (Oleson et al., 2010, 2013;                ergy’s (DOE) Atmospheric Radiation Measurement (ARM)
Lawrence et al., 2019) version 4.0 and the energy and water        mobile facility located 70 km downwind of Manaus, Brazil
balance calculations of the NASA GMAO (Global Model-               (Ng et al., 2011), (b) the surface CO volume mixing ratio
ing and Assimilation Office) catchment LSM (Koster et al.,         in 2014 at Manaus measured by Los Gatos Research (LGR)
2000). The original NASA catchment LSM used a prescribed           N2 O/CO analyzer that uses LGR’s patented off-axis inte-
representation of phenology (leaf area index, or LAI, and          grated cavity output spectroscopy (ICOS) technology, and
greenness fraction) to compute the canopy conductance, the         (c) the vertical profile of OA concentration measured by a
parameter describing the ease with which the plants tran-          time-of-flight aerosol mass spectrometer (ToF-AMS) instru-
spire water. The light interception by vegetation in the GEOS      ment on the ARM Aerial Facility Gulfstream-1 (G-1) air-
Catchment-CN utilizes the same parameterization as that in         craft during the dry season of 2014 (6 September–4 October
CLM version 4 (CLM4). The photosynthesis and transpira-            2014) (Shilling et al., 2018). The G-1 aircraft was based at

Atmos. Chem. Phys., 21, 14177–14197, 2021                                          https://doi.org/10.5194/acp-21-14177-2021

H. Bian et al.: Aerosol and cloud radiative effects on the Amazon ecosystem                                             14181

the Manaus International Airport and flew patterns designed     porates satellite and in situ SST observations and assim-
to intersect the Manaus urban plume at increasing down-         ilates advanced very high-resolution radiometer (AVHRR)
wind distance from the city (e.g., 4–2.5◦ S and 59–61◦ W).      brightness temperatures. The experiments were run in re-
In addition, we evaluate the model with AOD and single-         play mode, which means that the model dynamical vari-
scattering albedo (SSA) measurements taken at a central         ables (winds, pressure, temperature, and humidity) were
Amazon station (Alta Floresta) in the ground-based Aerosol      set, every 6 h, to the values archived by the Modern-Era
Robotic Network (AERONET) sun photometer network                Retrospective Analysis for Research and Applications ver-
(http://aeronet.gsfc.nasa.gov, 15 September 2021). We also      sion 2 (MERRA2) meteorological reanalysis (Gelaro et al.,
use the MODIS collection 6.1 level-3 AOD product (http:         2017); a 6-hourly forecast provided the dynamical and
//modis.gsfc.nasa.gov/data/dataprod/index.php, 15 Septem-       physical fields between the 6 h resets. In effect, the re-
ber 2021), which is characterized by observations with large    play approach forces the atmospheric “weather” simulated
spatial coverage.                                               in the model to agree with the reanalysis. This nudging
   MODIS cloud products (https://modis-atmosphere.gsfc.         of the GEOS dynamic fields toward the MERRA2 reanal-
nasa.gov/data/dataprod/, 15 September 2021), specifically       ysis ensures that the atmospheric conditions of our four
total cloud fraction and cloud optical depth in liquid and      simulations (see below) remain close to each other, al-
ice particles, are used to evaluate the model cloud simu-       lowing a more focused study of radiative impact on the
lation. We use the cloud data from MODIS collection 6.1         ecosystem. All designed experiments were run over 2010–
MYD08_D3, a level-3 1◦ × 1◦ global gridded monthly joint        2016, a period that includes La Niña (2010–2011), El Niño
product derived from the MODIS level-2 pixel-level prod-        (2015–2016), and neutral years as indicated by the Oceanic
ucts. MODIS level-2 cloud fraction is produced by the in-       Niño Index (ONI, https://origin.cpc.ncep.noaa.gov/products/
frared retrieval methods during both day and night at a 5 × 5   analysis_monitoring/ensostuff/ONI_v5.php, 15 September
1 km pixel resolution. Level-2 cloud optical thickness used     2021) (Fig. S1 in the Supplement). Information regarding
in this study is derived using the MODIS visible and near-      long-term biomass burning (BB) OA emissions (i.e., 1997–
infrared channel radiances from the Aqua platform.              2016) and long-term MERRA2 cloud fraction anomalies
   The satellite-derived Clouds and the Earth’s Radiant En-     (i.e., 1995–2018) is shown in Fig. S2. The selected period
ergy System (CERES) product EBAF is used to evaluate            of 2010–2016 represents well the long-term period in terms
the GEOS simulation of radiation fields. CERES-EBAF re-         of the variation in BB emissions and cloud coverage.
trieves surface downward shortwave radiation (RSFC ) using         Our experimental design makes extensive use of GEOS’s
cloud information from more recent satellite data (MODIS,       highly flexible configuration. First, the GEOS GOCART
CERES, CloudSat, and CALIPSO) and aerosol fields from           module includes a tagged aerosol mechanism. Each specific
AERONET MODIS validation-based estimates (Kato et al.,          aerosol component in GOCART is simulated independently
2013). This global product is provided at a 1◦ ×1◦ horizontal   from the others, and the contribution of each emission type
resolution and covers the years 2000–2015 for both all- and     to the total aerosol mass is also not interfered with by that
clear-sky conditions. The multiyear RSFC products provide       of other emission types. Thus, additional aerosol tracers can
both a spatial and temporal view of radiation over Amazo-       easily be “tagged” according to emission source types. This
nia.                                                            makes it possible for GOCART to calculate and transfer
   Two observation-based GPP products (FluxCom and              two sets of aerosol fields (e.g., one with and one without a
FluxSat) are used to evaluate ecosystem productivity in         biomass burning source) to the radiation module. Second, the
the GEOS simulations. The FluxCom GPP product pro-              radiation module can in turn calculate a set of atmospheric
vides globally distributed eddy-covariance-based estimates      radiation fields corresponding to each set of aerosol fields,
of carbon fluxes between the biosphere and the atmosphere       and it can then disseminate both sets of radiation fields to
through upscaling using machine learning methods (Jung          the various components of interest (i.e., cloud module, land
et al., 2020). FluxSat GPP is estimated with models that use    ecosystem module, etc.) according to the needs of our exper-
satellite data (e.g., MODIS reflectances and solar-induced      iments (see below).
fluorescence, SIF) within a simplified light-use efficiency        Table 1 provides a brief summary of the experiments per-
framework (Joiner et al., 2018). We use monthly GPP of          formed for this study. First, we designed a pair of experi-
2010–2015 in this study.                                        ments (allaer and nobbaer, hereafter referred to as “pair1”) to
                                                                explore the BBaer DRFE on the land productivity via PAR
2.3   Experiment setup                                          (objective 1). The allaer and nobbaer experiments are de-
                                                                signed to simulate the same atmospheric dynamics but send
All experiments were run with the coupled atmosphere and        different PAR fluxes into the Catchment-CN model. Specifi-
land components of the NASA GEOS ESM system dis-                cally, both the allaer and nobbaer experiments used all atmo-
cussed above. The sea surface temperature (SST) for the         spheric aerosols including real-time biomass burning emis-
atmospheric dynamic circulation is provided by the GEOS         sions over 2010–2016 to calculate a set of radiation fields
Atmospheric Data Assimilation System (ADAS) that incor-         (R 1 ) to drive atmospheric circulation; however, with the help

https://doi.org/10.5194/acp-21-14177-2021                                     Atmos. Chem. Phys., 21, 14177–14197, 2021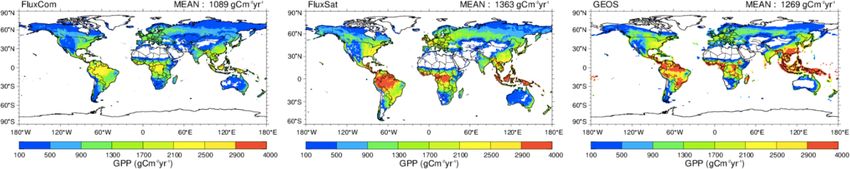
14182                                                           H. Bian et al.: Aerosol and cloud radiative effects on the Amazon ecosystem

Table 1. Designed experiments (2010–2016) with their perturbation on aerosol fields and subsequent impact on radiation and ecosystem.
“dir”: direct; “dif”: diffuse.

               Exp. name               Aerosol               R in RRTMG                      R driving                  R driving      Purpose
                                                                                             Atmosphere                 Catchment-CN
          Pair 1      allaer           Standard all,           1 , R1 , R1
                                                             Rtop                             1 , R1 , R1
                                                                                             Rtop                        1 , R1
                                                                                                                        Rdir           Check atmospheric
                                                                     dir diff                      dir diff                   diff
                                       w/real time           (all aerosol)                                                             BB aerosol impact
                      nobbaer          BBaer                   1 , R1 , R1
                                                             Rtop                             1 , R1 , R1
                                                                                             Rtop                        2 , R2
                                                                                                                        Rdir           on plants via
                                                                     dir diff                      dir diff                   diff
                                       emission              (all aerosol)                                                             radiation fields
                                                               2 , R2 , R2
                                                             Rtop                                                                      during 2010–2016
                                                                     dir diff
                                                             (all non-BB aerosol)
          Pair 2      callaer          Standard all,           1 , R1 , R1
                                                             Rtop                             1 , R1 , R1
                                                                                             Rtop                        1 , R1
                                                                                                                        Rdir           Check how clouds
                                                                     dir diff                      dir diff                   diff
                                       w/BBaer               (all aerosol)                                                             adjust the above
                      cnobbaer         emission                1 , R1 , R1
                                                             Rtop                             1 , R1 , R1
                                                                                             Rtop                        2 , R2
                                                                                                                        Rdir           impact
                                                                     dir diff                      dir diff                   diff
                                       fixed at              (all aerosol)
                                       2010                    2 , R 2 ,R 2
                                                             Rtop    dir diff
                                                             (all non-BB aerosol)

        R : radiation. Rtop : radiation at the top of the atmosphere. Rdir and Rdif : atmospheric direct and diffuse radiation.

of GEOS’s flexible configuration, the nobbaer experiment                                      other potential impacts on the environment. Future study may
also calculated a second set of radiation fields (R 2 ) that used                             focus on these other impacts. Given that the experiment pe-
non-BB aerosols only. R 1 was sent to Catchment-CN in the                                     riod covers strong La Niña and El Niño years, we can exam-
allaer experiment, whereas R 2 was sent to Catchment_CN                                       ine BBaer impacts on ecosystem productivity under the full
in the nobbaer experiment. In this way, the only difference                                   range of Amazon background cloud fields.
between the allaer and nobbaer experiments was the PAR
fluxes used to drive the ecosystem model – only the PAR
fluxes used in allaer reflected the presence of biomass burn-                                 3     Results and discussions
ing aerosols. The atmospheric meteorological fields in the
two experiments, including clouds, skin temperature, and soil                                 3.1     Evaluation of GEOS simulations of aerosol, cloud,
moisture, show only minor differences stemming from land                                              radiation, and ecosystem response
feedback (Figs. S3–S4, Tables 3, S1e, and S2e in the Sup-
plement). A negligible impact on cloud fields has also been                                   The NASA GEOS ESM model, including its aerosol, cloud,
reported in Pedruzo-Bagazgoitia et al. (2017).                                                radiation, and ecosystem modules as used in the baseline
   We also designed a pair of experiments (callaer and cnob-                                  simulation (i.e., experiment allaer), has been evaluated ex-
baer, hereafter referred to as “pair2”) to address the sensi-                                 tensively and utilized in a number of scientific studies. How-
tivity of the BBaer DRFE to the presence of the Amazon                                        ever, very few of the past studies with GEOS concentrated
dry-season cloud fields (objective 2). The pair2 experiments                                  on detailed model evaluation over South America. We pro-
are similar to those in pair1 except that the particular BB                                   vide such an evaluation here.
emissions of the year 2010 were repeated during all 7 years.                                     The simulated tracer fields are compared with measure-
Applying a fixed aerosol emission allows us to attribute the                                  ments over the Amazon in Figs. 1 and 2. Figure 1 shows
interannual variation in the ecosystem solely to the influ-                                   results for surface OA concentration, surface CO concen-
ence of interannual variations in atmospheric meteorologi-                                    tration, and the OA concentration vertical profile. We focus
cal fields, including clouds. In addition, combining the pair1                                primarily on the OA evaluation since it is the major com-
and pair2 experiments provides two biomass burning aerosol                                    ponent of biomass burning aerosols. Figure 1a shows the
emissions for each year except 2010, which allows us to com-                                  comparison of surface daily OA concentration between the
pare the impacts of different emissions under similar meteo-                                  model simulation and the GoAmazon measurements at Man-
rological environments (Figs. S3–S4, Tables 3, S1e and S2e).                                  aus, Brazil, in 2014 (the location is indicated in Fig. 2c with
Please note that the experiments in this study were intention-                                an open diamond). The simulated OA broadly captures the
ally designed to allow the aerosols to affect the vegetation                                  seasonal trend in OA concentrations measured at Manaus,
only through their impact on the direct and diffuse radiation                                 but it is lower than observed OA values by ∼ 24 % during
that enters the ecosystem and not, for example, through their                                 September–October and ∼ 30 % annually. For the period of
                                                                                              interest, the model simulates a large fire signal in August that

Atmos. Chem. Phys., 21, 14177–14197, 2021                                                                             https://doi.org/10.5194/acp-21-14177-2021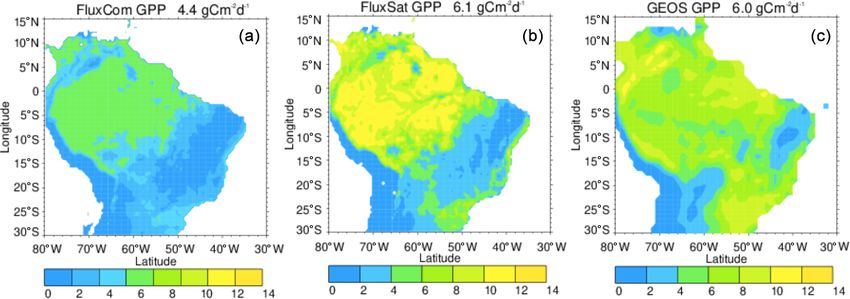
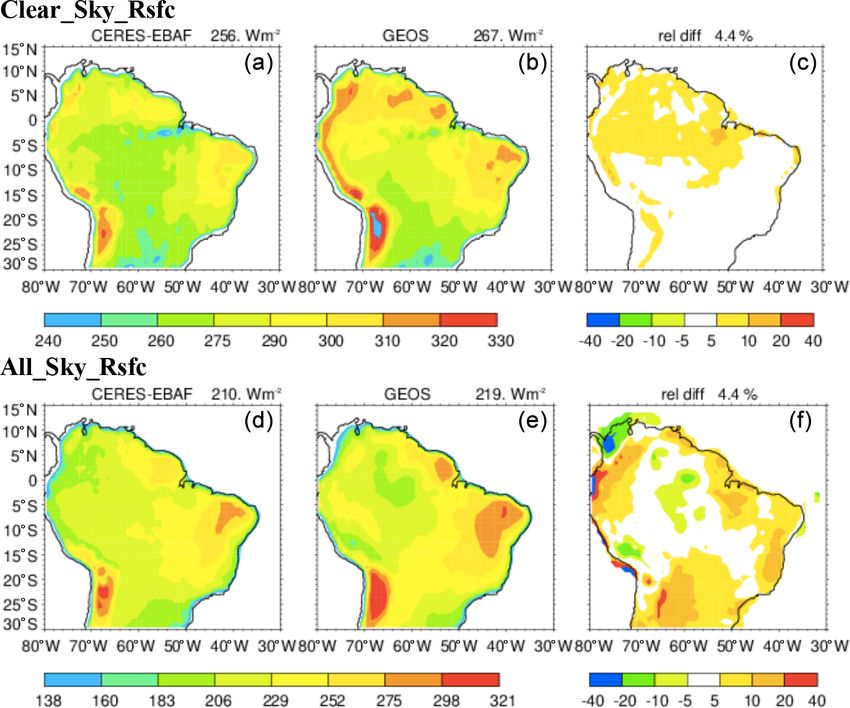
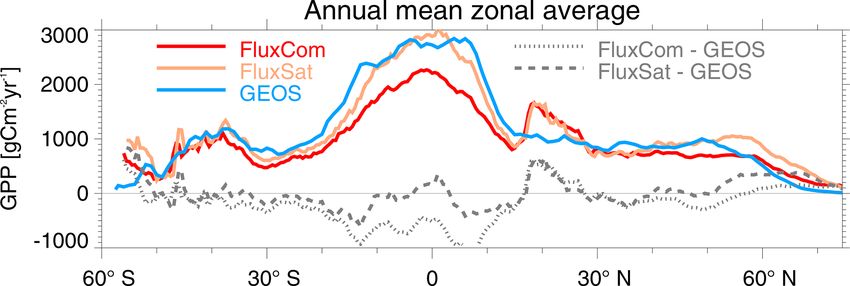
H. Bian et al.: Aerosol and cloud radiative effects on the Amazon ecosystem                                               14183

is not seen in the measurements. However, this strong August       America. The overall difference over the Amazon region be-
biomass burning signal does show up in the CO measure-             tween simulated and MODIS-based estimates is less than 7 %
ments (Fig. 1b), which should also be from biomass burning.        for cloud cover fraction, 10 % for liquid water cloud optical
The reasons for such a discrepancy from observations are not       depth, and 15 % for ice cloud optical depth. The seasonal-
clear.                                                             ity of these cloud quantities is shown in Fig. S5a–c to fur-
   When compared with aircraft G-1 measurements over               ther evaluate the model performance. The model has a bet-
a ∼ 2◦ × 2◦ region around the center of Manaus during              ter cloud simulation during the period of August–October,
the biomass burning season (6 September–4 October 2014)            which is the focus period of this study since Amazon fires
(Fig. 1c), the simulated vertical OA concentrations underesti-     occur periodically every year in this season.
mate the measurements above 1 km altitude but overestimate            Figure 4 shows a comparison between the simulated
them under it, although they overlap within their standard de-     downward shortwave radiation at the surface and CERES-
viations for all altitudes. Here the model data have been sam-     EBAF measurements averaged over August–October, 2010–
pled spatially and temporally along the G-1 flight paths. This     2016 for both clear-sky and all-sky conditions. The compar-
surface OA overestimation by the model seems to contradict         ison of the time series of monthly mean shortwave radia-
the model’s underestimation seen in Fig. 1a, indicating that       tion during 2010–2016 over the Amazon region is shown in
capturing aerosols at the right times and locations is a chal-     Fig. S6. GEOS captures the observed spatial patterns with
lenge.                                                             ∼ 4 % high bias for both clear- and all-sky conditions over
   Figure 2 shows the AOD (550 nm) and SSA (440 nm) com-           the Amazon region.
parison at the AERONET station of Alta Floresta, which                Following the evaluation approach in Malavelle
is located close to the area of the most intensive Amazon          et al. (2019), we evaluate our model’s ability to simu-
fires (location is marked in Fig. 2c as a filled-in circle).       late GPP on the global scale against FluxCom and FluxSat.
The model-simulated, AERONET-measured, and MODIS-                  As mentioned in Sect. 2.2, FluxCom GPP is derived from
retrieved AODs at this site agree within 20 % (Fig. 2a), all       surface measurements of carbon fluxes, whereas FluxSat
showing a peak of AOD during the biomass burning sea-              GPP is derived from satellite data. The comparison of
son. SSA during the burning season generally ranges be-            global distribution of multiyear average GPP (Fig. 5) and
tween 0.85–0.95 (Fig. 2b). The model agrees with the mea-          zonal mean multiyear average GPP (Fig. 6) shows that
surements with an accuracy better than 5 % except during           GEOS captures the GPP global distribution seen in the
the first half of August, when the model aerosols are too          observations, with a GPP peak in tropics. The model does
scattered. However, it is puzzling to observe the extremely        show a second peak in middle latitudes of the Southern
low measured SSA at the beginning of August given that             Hemisphere but misses the observed peak in the Northern
the AOD is still low then, as shown in Fig. 2a. It could be        Hemisphere subtropics.
that the quality of AERONET SSA is not “reliable” at low              Figure 7 shows GPP averaged over August to October of
AOD (Chin et al., 2009). Because of the low sensitivity to         2010–2015 from the two observation-based products and the
the absorption when aerosol loading is low, SSA is retrieved       GEOS simulation. The overall spatial distributions of GEOS
with sufficiently high accuracy only when the total AOD at         GPP (Fig. 7c) over South America show a similar spatial pat-
440 nm is equal or higher than 0.4 and the solar zenith an-        tern to both of the observation-based datasets (Fig. 7a and b)
gle is 50◦ or higher (Dubovik et al., 2000, 2002). Regionally      with higher values over the eastern part of the domain but ly-
over the Amazon region, defined throughout the study as the        ing between the two datasets in other areas. Over the studied
land area within 25◦ S–5◦ N, 80–30◦ W (shaded land area in         period and the Amazon region, the GEOS GPP is compara-
Fig. 2d), the model-simulated AOD (0.22 in Fig. 2d) during         ble to the FluxSat GPP and is about 35 % higher than the
the biomass burning season generally agrees with MODIS             FluxCom GPP.
satellite retrievals (0.21 in Fig. 2c). A simulated high bias is      The seasonality of GPP over the Amazon region from
seen over the east Amazon; however, though this region is in       FluxCom, FluxSat, and GEOS during 2010–2015 is shown
our area of interest, the bias should only have a minor impact     in Fig. S7, and the corresponding time series of monthly
on our study given that the area is relatively bare, with little   means is shown in Fig. S8. During all four seasons, re-
vegetation coverage.                                               gional FluxCom GPP is the lowest and FluxSat GPP is the
   The accurate simulation of cloud fields is also important       highest. All datasets show higher GPP during November–
for our study. In Fig. 3 we evaluate the GEOS-simulated            April than during May–October. GEOS multiyear annual
cloud cover fraction and cloud optical depth with MODIS            average GPP is close to that of FluxSat but is higher
satellite products. Here the GEOS data have been sam-              than that of FluxCom. Although there are few observation
pled with MODIS overpass time and location. GEOS gener-            sites available in FLUXNET 2015 Tier 1 (https://fluxnet.
ally captures the magnitude and main features of the cloud         org/data/fluxnet2015-dataset/, 15 September 2021), Joiner
fields observed in MODIS, though with some differences;            et al. (2018) evaluated FluxSat GPP performance around
the model overestimates the cloud quantities over the cen-         Amazonia using the flux tower measurements, which showed
tral Amazon and underestimates them in northwest South

https://doi.org/10.5194/acp-21-14177-2021                                        Atmos. Chem. Phys., 21, 14177–14197, 2021
14184                                            H. Bian et al.: Aerosol and cloud radiative effects on the Amazon ecosystem

Figure 1. (a) Comparison of the ACMS (aerosol chemical speciation monitor) measured organic aerosol (OA) daily surface mass concentra-
tion at the GoAmazon DOE ARM facility in Manaus, Brazil (location marked in Fig. 2c as an open diamond) in 2014 with GEOS simulated
values. (b) Similar to (a) but for carbon monoxide (CO) volume mixing ratio. (c) GoAmazon G-1 aircraft measurement of vertical OA mass
concentration during 6 September–4 October 2014 in the vicinity of Manaus, compared to GEOS simulations. The error bars in panel (c)
indicate 1 standard deviation of the data within each 1 km vertical layer.

Figure 2. (a) Comparison of GEOS simulated AOD at 550 nm with AERONET and MODIS daily measurements at the Alta Floresta
AERONET site for 2014. (b) Similar comparison for aerosol single-scattering albedo at 440 nm during 2014. (c) Mean MODIS collection
6.1 AOD at 550 nm during the period August–October 2014. (d) GEOS simulated AOD at 550 nm for the same period as in (c) with daily
model data sampled following MODIS measurements. Note that the mean AOD values shown for (c, d) are averaged over the Amazon
region (i.e., the shaded land area within 25◦ S–5◦ N, 80–30◦ W shown in d). Station locations of Alta Floresta (filled-circle) and Manaus
(open diamond) are marked in (c).

that the high GPP values produced by FluxSat were sup-                 creases at high AOD – we ran the column version of a ra-
ported by the flux tower values (Joiner et al., 2018).                 diation model, fast-JX (Wild et al., 2000; Bian and Prather,
   Although the evaluations of global and regional multi-              2002). Fast-JX solves the eight-stream multiple scattering
year average GPP conducted above (Figs. 5–7) are needed                in atmospheric solar radiation transfer for direct and diffuse
for the examination of the model’s fundamental mechanisms              beams, using the exact scattering phase function and optical
including photosynthesis, a more direct evaluation to ad-              depths of atmospheric molecules, aerosols, and clouds, and
dress the model’s accuracy in simulating observed GPP re-              provides photolytic intensities accurate typically to better
sponse to changes in diffuse and direct surface radiation is           than 3 %, with worst case errors of no more than 10 % over a
shown in Fig. 8. Following the evaluation approach of Rap              wide range of atmospheric conditions (Wild et al., 2000). No
et al. (2015), we compared the GPP response to direct and              special approximations are needed to treat strongly forward-
diffuse light at two Amazon sites: Tapajos and Guyaflux. The           peaked phase functions. The model has also been evaluated
figure clearly demonstrates that in the model, as in observa-          against various other models that participated in an inter-
tions, diffuse light is more efficient in stimulating GPP.             national multi-model comparison for solar fluxes and pho-
                                                                       tolysis calculation (PhotoChem-2008 in Chipperfield et al.,
3.2   Principle of aerosol and cloud impact on surface                 2010) and against the measurements from actinic flux spec-
      downward radiation                                               troradiometers during the Atmospheric Tomography (ATom)
                                                                       mission (Hall et al., 2018). In the aforementioned evalua-
Radiative responses to aerosols and cloud fields are nonlin-           tions, the fast-JX model is among the models with good per-
ear. To better explain the phenomenon examined here – that             formance. The model calculations provide three ratios: (i)
plant growth increases at low-to-intermediate AOD but de-              CIdir, the ratio of direct downward solar radiation at the sur-

Atmos. Chem. Phys., 21, 14177–14197, 2021                                               https://doi.org/10.5194/acp-21-14177-2021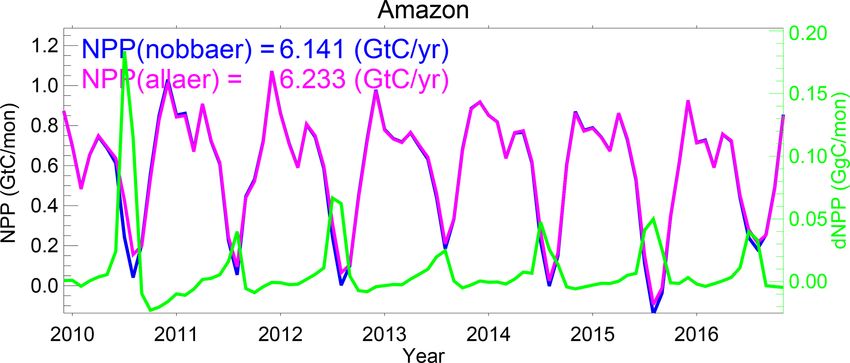
H. Bian et al.: Aerosol and cloud radiative effects on the Amazon ecosystem                                                          14185

                                                                         Figure 4. Comparison of surface downward shortwave radiation
                                                                         Rsfc (W m−2 ) between CERES-EBAF measurement and GEOS
                                                                         simulation averaged over August–October 2010–2016 for clear-sky
                                                                         (a, b) and all-sky (d, e) conditions. The right column (c, f) shows
                                                                         the relative difference between GEOS and CERES-EBAF.

                                                                         polluted (i.e., as BBAOD increases), but for BBAOD lev-
                                                                         els less than ∼ 0.75, the diffuse solar flux increases. The
                                                                         two are equivalent at AOD ∼ 0.5. This light redistribution
                                                                         from direct to diffuse can significantly stimulate plant photo-
                                                                         synthesis given that plants use diffuse light more efficiently.
                                                                         Ecosystems could still respond positively to the increase in
                                                                         BBAOD even if the incident diffuse radiation decreases be-
                                                                         low its peak value, though for some value of BBAOD, the re-
                                                                         duction in total radiation will be large enough to overwhelm
                                                                         the impact of increased diffuse radiation, and plant photosyn-
                                                                         thesis will be lower than that for clean-sky conditions.
Figure 3. Multiyear seasonal (August–October 2010–2016) cloud               The Amazon dry season is characterized by high biomass
field comparison between MODIS retrieved (a, c, e) and GEOS sim-         burning aerosol loading combined with low cloud cover, a
ulated (b, d, f), total cloud cover (a, b), liquid cloud optical depth   good match to obtain more diffuse radiation without the loss
(c, d), and ice cloud optical depth (e, f).                              of too much total radiation. However, as we have pointed
                                                                         out, cloud impacts on radiation typically dominate those of
                                                                         aerosols. To examine this, we repeated the radiation model
face (Rdir@srf) to the incoming total solar radiation flux at            calculations after adding, at the top of the aerosol layer
the top of the atmosphere (Rtot@toa), (ii) CIdiff, the ratio             (∼ 3.5 km), a cloud layer with a cloud fraction of 1.0 and
of the downward diffuse solar radiation flux (Rdiff@srf) to              a cloud optical depth (COD) of 1 (Fig. 9b) and 10 (Fig. 9c).
Rtot@toa, and (iii) CI, the ratio of total solar radiation at            The latter COD is close to the mean liquid cloud COD over
the surface to Rtot@toa. Note that all Rs are for the 400–               the Amazon dry season (Fig. 3). The impact on Rdir@srf
700 nm spectral band. Results for different biomass burning              and Rdiff@srf is quite large even with a very thin over-
AODs (including the clean-air condition, where AOD = 0)                  head cloud (Fig. 9b). Without BBaer, the clouds already pro-
for cloud-free conditions are shown in Fig. 9a. When the                 duce abundant diffuse light that can reach the surface (i.e.,
sky is clear and clean (both cloud-free and without aerosols),           CIdiff > 50 %, as seen in both Fig. 9b and c), while almost
roughly 90 % of the incoming solar radiation at the top of the           shutting down the direct light (i.e., CIdir < 1 % in Fig. 9c).
atmosphere can reach the plant canopy (i.e., CIdir + CIdiff ≈            Accordingly, for full cloud coverage, a clean sky (i.e., no
0.9 at BBAOD = 0; BBAOD – biomass burning AOD). The                      aerosols) would provide the best conditions for plant growth.
direct solar flux decreases rapidly as the atmosphere becomes            When fires start, the diffuse light declines rapidly, reducing

https://doi.org/10.5194/acp-21-14177-2021                                               Atmos. Chem. Phys., 21, 14177–14197, 2021
14186 H. Bian et al.: Aerosol and cloud radiative effects on the Amazon ecosystem
Figure 5. 2010–2015 multiyear average global GPP from FluxCom, FluxSat, and GEOS. The global average value is shown at the top.
results differ significantly: DRPAR for allaer (solid line) lies
below that for nobbaer (dotted line), while DFPAR and GPP
for allaer are generally higher than those for nobbaer. In Oc-
tober, the sky is almost clean (i.e., low BBaer), leading to
very similar results for DRPAR, DFPAR, and GPP between
the two experiments. Looking closer, we see that the changes
in DRPAR, DFPAR, and GPP between allaer and nobbaer are
more prominent when the atmosphere has low cloudiness and
Figure 6. Zonal mean of multiyear (2010–2015) average GPP from high aerosol (e.g., at the end of August), confirming both that
FluxCom, FluxSat, and GEOS. BBaer does transform some of the direct light at the surface
into diffuse light and that plants are more efficient in their
use of diffuse light. When both cloudiness and aerosols are
the potential for plant growth. At BBAOD ∼ 3 the ratios high (e.g., at the end of September), the influence of aerosols
among Fig. 9a–c look similar; that is, essentially very little is overwhelmed by clouds, and the impact of the aerosols on
radiation reaches the surface. radiation and the ecosystem becomes secondary.
The simple examples in Fig. 9 illustrate the complicated We now evaluate BB aerosol impacts on radiation and
responses of direct and diffuse light to the presence of aerosol ecosystem fields over the Amazon during August 2010, when
and cloud. Measurements indicate that plant growth peaks for the aerosol has its largest impact. Figure 11 shows the sim-
a clearness index (CI, which equals CIdir + CIdiff) of about ulated Amazon DRPAR, DFPAR, and GPP fields from the
0.4–0.7 for some forest ecosystems (Butt et al., 2010; Letts two experiments comprising pair1 (nobbaer and allaer). The
and Lafleur, 2005). Based on Fig. 9, this CI range translates distribution of DRPAR shows a clear spatial gradient, with
into a BBAOD range of about 0.3 ∼ 1.5 in clear-sky and 0 ∼ low values in the northwest and high values in the southeast,
0.5 in cloudy-sky conditions. and the spatial pattern of DFPAR shows the reverse pattern.
These features are primarily controlled by the cloud distribu-
3.3 How the ecosystem responds to the BBaer diffuse tion (Fig. 3). Comparing the nobbaer and allaer results by cal-
radiation fertilization effect culating field relative change (i.e., (allaer − nobbaer)/allaer),
we find that BBaer decreases DRPAR by 16 % and increases
We first examine the two experiments in pair1 by taking DFPAR by 10 % over the Amazon region, with maximum
a close look at the time series of aerosol, cloud, radiation, local changes of up to −50 % for DRPAR and 25 % for DF-
and ecosystem responses generated at a selected site (15◦ S, PAR. Interestingly, these maxima are not co-located, though
54◦ W) during August–October 2010 (Fig. 10) (site location the spatial patterns of perturbations do agree with each other.
marked in Fig. 11), with the aim of extending the general The mismatch in the locations of the maxima in the differ-
understanding gained in Sect. 3.2 to a real case study at a ence fields implies a nonlinear response of direct and dif-
single site in the Amazon. This is an interesting site and pe- fuse light to aerosol and cloud particles (see Sect. 3.2). In re-
riod, showing a large DFPAR change (Fig. 11f) and provid- sponse to the inclusion of BBaer, the Amazon GPP increases
ing a wide variety of conditions for study – the sky alter- by 10 %. That is, the increase in GPP stemming from the
nates between clear and cloudy conditions in August, is rel- increase in the diffuse light fraction overwhelms a potential
atively clear in September but relatively cloudy in October, reduction in GPP from a reduction in total PAR. When we
and the biomass burning aerosols increase in August, peak in consider all burning seasons over the 7-year studied period,
September, and diminish greatly in early October (Fig. 10). the biomass burning aerosol increases DFPAR by 3.8 % and
During August–September, when the atmosphere experi- decreases DRPAR by 5.4 %, allowing it to increase Amazon
ences biomass burning pollution, the allaer (with BBAOD GPP by 2.6 %. However, the 7-year averaged GPP increases
light fertilizer) and nobbaer (without BBAOD light fertilizer)
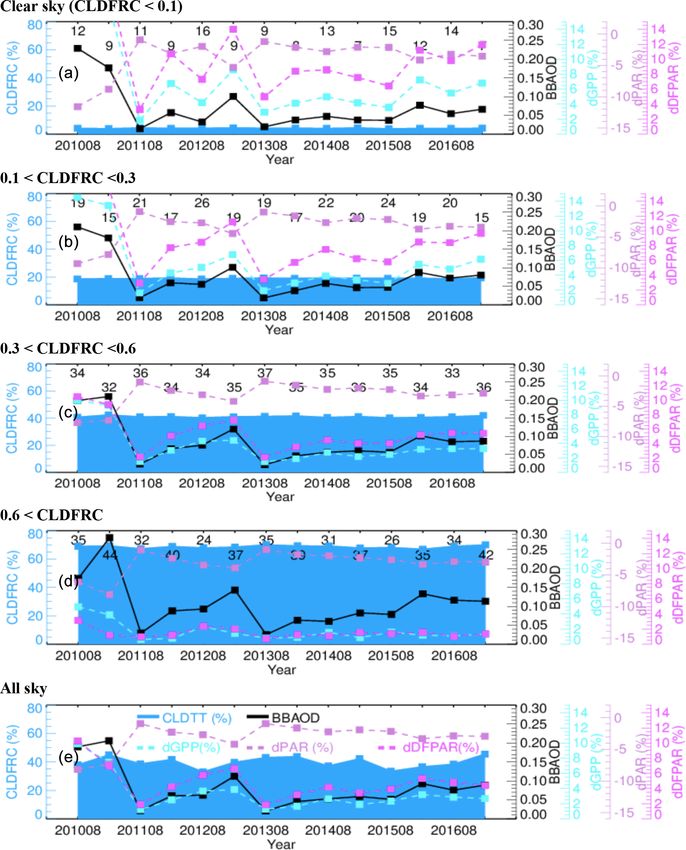
Atmos. Chem. Phys., 21, 14177–14197, 2021 https://doi.org/10.5194/acp-21-14177-2021H. Bian et al.: Aerosol and cloud radiative effects on the Amazon ecosystem 14187 Figure 7. The multiyear (2010–2015) August–October mean Amazon GPP from (a) FluxCom (Jung et al., 2020), (b) FluxSat (Joiner et al., 2018), and (c) the GEOS ecosystem simulation with units of g C m−2 d−1 . The Amazon regional average value is shown at the top. Figure 8. Observed (black) and GEOS modeled (blue) response of GPP to direct (triangles) and diffuse (squares) photosynthetically active radiation (PAR) averaged over bins of 200 µmol quanta m2 s−1 at (a) Tapajos and (b) Guyaflux. Error bars show 1 standard deviation of all values within a bin. The observation data, representing the period 2002–2005 for Tapajos and 2006–2007 for Guyaflux, are taken from Fig. 2 of Rap et al. (2015), whereas the model period is 2010–2016 for both sites. by 0.99 % (Table 2), which is much less than the value during data from the GFED4.1s emission inventory indicate that burning seasons. over this area and time period fires emit ∼ 250 Tg C yr−1 . We also examine the multiyear (2010–2016) BBaer im- The NPP enhancement due to the BBaer-induced diffuse sun- pacts on net primary production (NPP), that is, the rate light fertilization thus compensates for about 37 % of carbon at which carbon is accumulated (GPP) in excess of au- loss by fires. totrophic respiration. In essence, NPP can be considered a To assess how our simulated GPP and NPP response com- proxy for the net plant sink of atmospheric carbon. Fig- pares with other existing model estimates, we summarize ure 12 shows monthly and long-term averaged NPP over the all relevant studies in Table 2. In addition to differences in Amazon Basin from the two experiments comprising pair1. model formulations of fundamental physical mechanisms, The monthly change in NPP (i.e., dNPP = NPP(allaer) − these studies also differ in model simulation configuration NPP(nobbaer)) is shown in the figure as a green line. Each (e.g., online vs. offline, freeGCM vs. Replay – for definitions year, during the August–September period when BBaer is of freeGCM and Reply, see below Table 2), BB emission high and cloudiness is low over the Amazon, BBaer is inventory, and study period. Although our estimates of the seen to enhance NPP. The percentage difference of annu- increases in NPP across the Amazon region have a wide in- ally averaged NPP (dNPP/NPP(nobbaer) × 100) in percent terannual variation (ranging from 0.5 % to 4.2 %), our 7-year is 4.2, 0.06, 1.9, 0.5, 1.3, 1.9, and 1.0 for the 7 studied averaged NPP increase (1.5 %) is close to the value (1.4 %) years. That means the BBaer-induced NPP increases range reported by Rap et al. (2015). Both studies considered only from 5 Tg C yr−1 or 0.06 % (2011) to 278 Tg C yr−1 or 4.2 % aerosol DRFE with cloud presence. The NPP can be in- (2010), with a 7-year average of 92 Tg C yr−1 or 1.5 %. This creased up to 52 % in the burning season under clear-sky con- is equivalent to storing 92 Tg C annually within the Amazon ditions (Moreira et al., 2017). By accounting for the feedback ecosystem during the studied period. The CO2 fire emission from aerosol–climate adjustments, the influence of aerosol https://doi.org/10.5194/acp-21-14177-2021 Atmos. Chem. Phys., 21, 14177–14197, 2021
14188                                              H. Bian et al.: Aerosol and cloud radiative effects on the Amazon ecosystem

Figure 9. The ratio of Rdir@srf to Rtot@toa (blue), which presents the clearness index for the direct radiation portion (CIdir), the ratio
of Rdiff@srf to Rtot@toa (red) for the diffuse radiation portion (CIdiff), and the ratio of Rtot@srf to Rtot@toa (green). Here, Rtot@toa is
incoming total solar flux at the top of atmosphere (TOA), Rdir@srf is surface downward direct solar flux, Rdiff@srf is surface downward
diffuse solar flux, and Rtot@srf is the sum of Rdir@srf and Rdif@srf. All Rs are over 400–700 nm. (a) The change in the radiative flux ratios
in BBAOD = 0–3 under clear-sky condition. (b) Same as (a) but under cloudy conditions (cloud fraction = 1) with COD = 1. (c) Same as
(b) but for COD = 10. Calculations use the fast-JX radiation model column version adopting a standard atmospheric condition of the typical
tropics at ozone column = 260 Dobson units, SZA (solar zenith angle) = 15◦ , and surface albedo = 0.1.

Figure 10. GEOS simulated daily values of total cloud fraction (CLDFRC, %), biomass burning AOD (BBAOD), direct PAR (DRPAR,
W m−2 ), diffuse PAR (DFPAR, W m−2 ), and gross primary growth (GPP, µg m−2 s−1 ) from the two experiments of pair1 at a selected site
(15◦ S, 54◦ W; marked with a diamond in Fig. 11) during August–October 2010. The gray dashed line in the bottom panel shows the absolute
GPP difference (dGPP) between allaer and nobbaer.

on GPP and NPP is further increased (Malavelle et al., 2019;             season still features a considerable amount of cloud, and the
Strada et al., 2016).                                                    cloudiness levels vary significantly from year to year. This
                                                                         raises some questions: how do clouds affect the aerosol im-
3.4   How clouds adjust the BBaer diffuse radiation                      pact on radiation fields during the Amazon biomass burn-
      fertilization effect                                               ing season? Could different levels of background clouds have
                                                                         different impacts on the efficacy of the BBaer DRFE? There
Our second objective in this study is to investigate how the             are two distinctive features in clouds and aerosols that require
presence of clouds modulates the ability of BBaer to affect              us to treat them differently in their impact on the radiation
GPP. We highlight the cloud impact because even at the same              flux to the ecosystem. First, like our distinction between nat-
BBAOD, the surface downward DRPAR and DFPAR can be                       ural and anthropogenic aerosols in their impact on air quality
very different between cloudy and cloud-free conditions (see             and climate, the cloud is a more natural phenomenon, while
Sect. 3.2). As mentioned above, the Amazon’s so-called dry

Atmos. Chem. Phys., 21, 14177–14197, 2021                                                 https://doi.org/10.5194/acp-21-14177-2021
You can also read