Trends, composition, and sources of carbonaceous aerosol at the Birkenes Observatory, northern Europe, 2001-2018 - Recent
←
→
Page content transcription
If your browser does not render page correctly, please read the page content below

Atmos. Chem. Phys., 21, 7149–7170, 2021
https://doi.org/10.5194/acp-21-7149-2021
© Author(s) 2021. This work is distributed under
the Creative Commons Attribution 4.0 License.

Trends, composition, and sources of carbonaceous aerosol at the
Birkenes Observatory, northern Europe, 2001–2018
Karl Espen Yttri1 , Francesco Canonaco2,8 , Sabine Eckhardt1 , Nikolaos Evangeliou1 , Markus Fiebig1 ,
Hans Gundersen1 , Anne-Gunn Hjellbrekke1 , Cathrine Lund Myhre1 , Stephen Matthew Platt1 , André S. H. Prévôt2 ,
David Simpson3,4 , Sverre Solberg1 , Jason Surratt5,6 , Kjetil Tørseth1 , Hilde Uggerud1 , Marit Vadset1 , Xin Wan7 , and
Wenche Aas1
1 NILU-Norwegian     Institute for Air Research, 2027 Kjeller, Norway
2 PaulScherrer Institute (PSI), 5232 Villigen, Switzerland
3 EMEP MSC-W, Norwegian Meteorological Institute, 0371 Oslo, Norway
4 Dept. Space, Earth and Environment, Chalmers University of Technology, 412 96 Gothenburg, Sweden
5 Department of Environmental Sciences and Engineering, Gillings School of Global Public Health, University of North

Carolina at Chapel Hill, Chapel Hill, North Carolina 27599, USA
6 Department of Chemistry, College of Arts and Sciences, University of North Carolina at Chapel Hill, Chapel Hill, North

Carolina 27599, USA
7 Key Laboratory of Tibetan Environment Changes and Land Surface Processes, Institute of Tibetan Plateau Research,

Chinese Academy of Sciences (CAS), Beijing 100101, China
8 Datalystica Ltd., 5234 Villigen, Switzerland

Correspondence: Karl Espen Yttri (key@nilu.no)

Received: 12 November 2020 – Discussion started: 15 December 2020
Revised: 19 March 2021 – Accepted: 24 March – Published: 11 May 2021

Abstract. We present 18 years (2001–2018) of aerosol mea-       a smaller decline in levoglucosan (−2.8 % yr−1 ), suggesting
surements, including organic and elemental carbon (OC and       that OC/EC from traffic and industry is decreasing, whereas
EC), organic tracers (levoglucosan, arabitol, mannitol, tre-    the abatement of OC/EC from biomass burning has been
halose, glucose, and 2-methyltetrols), trace elements, and      slightly less successful. EC abatement with respect to an-
ions, at the Birkenes Observatory (southern Norway) – a site    thropogenic sources is further supported by decreasing EC
representative of the northern European region. The OC/EC       fractions in PM2.5 (−3.9 % yr−1 ) and PM10 (−4.5 % yr−1 ).
(2001–2018) and the levoglucosan (2008–2018) time series        PMF apportioned 72 % of EC to fossil fuel sources; this
are the longest in Europe, with OC/EC available for the         was further supported by PMF applied to absorption pho-
PM10 , PM2.5 (fine), and PM10–2.5 (coarse) size fractions,      tometer data, which yielded a two-factor solution with a
providing the opportunity for a nearly 2-decade-long assess-    low aerosol Ångstrøm exponent (AAE = 0.93) fraction, as-
ment. Using positive matrix factorization (PMF), we identify    sumed to be equivalent black carbon from fossil fuel com-
seven carbonaceous aerosol sources at Birkenes: mineral-        bustion (eBCFF ), contributing 78 % to eBC mass. The higher
dust-dominated aerosol (MIN), traffic/industry-like aerosol     AAE fraction (AAE = 2.04) is likely eBC from BB (eBCBB ).
(TRA/IND), short-range-transported biogenic secondary or-       Source–receptor model calculations (FLEXPART) showed
ganic aerosol (BSOASRT ), primary biological aerosol par-       that continental Europe and western Russia were the main
ticles (PBAP), biomass burning aerosol (BB), ammonium-          source regions of both elevated eBCBB and eBCFF .
nitrate-dominated aerosol (NH4 NO3 ), and (one low carbon          Dominating biogenic sources explain why there was no
fraction) sea salt aerosol (SS).                                downward trend for OC. A relative increase in the OC frac-
   We observed significant (p < 0.05), large decreases in       tion in PM2.5 (+3.2 % yr−1 ) and PM10 (+2.4 % yr−1 ) un-
EC in PM10 (−3.9 % yr−1 ) and PM2.5 (−4.2 % yr−1 ) and          derscores the importance of biogenic sources at Birkenes

Published by Copernicus Publications on behalf of the European Geosciences Union.
7150                                            K. E. Yttri et al.: Trends, composition, and sources of carbonaceous aerosol

(BSOA and PBAP), which were higher in the vegetative               et al., 2002; Donahue et al., 2009; Hallquist et al., 2009;
season and dominated both fine (53 %) and coarse (78 %)            Fröhlich-Nowoisky et al., 2016).
OC. Furthermore, 77 %–91 % of OC in PM2.5 , PM10–2.5 , and            Detailed source apportionment and quantification of car-
PM10 was attributed to biogenic sources in summer vs. 22 %–        bonaceous aerosol is challenging due to it numerous sources,
37 % in winter. The coarse fraction had the highest share of       the complexity of atmospheric formation, and the vast num-
biogenic sources regardless of season and was dominated by         ber of organic compounds associated with carbonaceous
PBAP, except in winter.                                            aerosols. A few studies have addressed carbonaceous aerosol
   Our results show a shift in the aerosol composition at          sources in the European rural background environment using
Birkenes and, thus, also in the relative source contributions.     source-specific organic tracers (Gelencsér et al., 2007; Szi-
The need for diverse offline and online carbonaceous aerosol       dat et al., 2009; Genberg et al., 2011; Gilardoni et al., 2011;
speciation to understand carbonaceous aerosol sources, in-         Yttri et al., 2011a, b). These consistently show that residen-
cluding their seasonal, annual, and long-term variability, has     tial wood burning dominates OC in winter, whereas biogenic
been demonstrated.                                                 secondary organic aerosol (BSOA) is the major source in
                                                                   summer. PBAP makes a significant contribution to PM10 in
                                                                   the vegetative season in the Nordic countries, second only
                                                                   to BSOA (Yttri et al., 2011a, b). Fossil fuel sources typi-
                                                                   cally dominate EC regardless of season, but residential wood
1   Introduction                                                   burning emissions can be equally important and occasion-
                                                                   ally dominate in the heating season (Zotter et al., 2014; Yttri
Carbonaceous aerosol has been studied intensively over the         et al., 2019). Online high-time-resolution measurements by
last 20 years due to its influence on radiative forcing (Bond      aerosol mass spectrometer (AMS) and aerosol chemical spe-
et al., 2013; Myhre and Samset, 2015; Lund et al., 2018),          ciation monitors (ACMS) have become available in recent
both directly by scattering and absorption of sunlight, and        years, complementing offline analysis of organic tracers. In
semi-directly and indirectly by influencing cloud properties       the comprehensive study by Crippa et al. (2014), including
(Boucher et al., 2013; Hodnebrog et al., 2014; Myhre et al.,       15 European rural background sites and 2 urban sites, cov-
2013). It also contributes to the burden of respiratory and car-   ering winter, spring, and autumn, hydrocarbon-like organic
diovascular disease (Janssen et al., 2012; WHO, 2013). Con-        aerosol (OA; 11 ± 5 %) and biomass burning OA (12 ± 5 %)
sequently, carbonaceous aerosol (here elemental carbon, EC,        contributed almost equally to the total OA concentration.
and organic carbon, OC) is measured regularly in major air         The vast majority was, however, attributed to secondary
monitoring networks such as the European Monitoring and            sources such as semi-volatile oxygenated OA (34 ± 11 %)
Evaluation Programme (EMEP) and Interagency Monitoring             and low-volatility oxygenated OA (50 ± 16 %). Secondary
of Protected Visual Environments (IMPROVE) (e.g. Malm et           oxygenated OA (OOA) can be both anthropogenic and bio-
al., 1994; Tørseth and Hov, 2003; Tørseth et al., 2012; UN-        genic; however, Crippa et al. (2014) did not draw any conclu-
ECE, 2019; Hjellbrekke, 2020). Carbonaceous aerosol has an         sions on this. Results presented by Bougiatioti et al. (2014)
atmospheric lifetime of days to a few weeks and is therefore       show how freshly emitted biomass burning OA can be trans-
relevant for atmospheric long-range transport. Accordingly,        formed to more oxidized OOA after just a short time in the
EMEP included OC/EC measurements in 2004 after a pi-               atmosphere when subject to high temperatures and high solar
oneering measurement campaign at 12 European sites from            radiation.
2002 to 2003 (Yttri et al., 2007a; Tørseth et al., 2012), show-       Over the last decades, European anthropogenic emissions
ing that carbonaceous aerosol was a major constituent of the       of secondary inorganic aerosol precursors, such as ammonia
ambient aerosol in the European rural background environ-          (NH3 ) and nitrogen oxides (NOx ), and non-methane volatile
ment, accounting for 9 %–37 % (OM, organic matter) and             organic compounds (NMVOC) have stabilized, and those of
1 %–5 % (EC) of PM10 , and that OM was more abundant               sulfur dioxide (SO2 ) have significantly decreased, follow-
than sulfate (SO2−4 ) at sites reporting both variables (Yttri     ing implementation of the Gothenburg Protocol (Reis et al.,
et al., 2007a). Similar conclusions were reached by another        2012; UNECE, 2013; Matthews et al., 2020). Anthropogenic
long-term campaign, CARBOSOL (Gelencsér et al., 2007;              carbonaceous aerosol is not regulated by any binding inter-
Pio et al., 2007), which monitored atmospheric aerosol and         national protocol, although a related benefit is expected from
its components for 2 years at six sites along a west–east tran-    the regulation of NOx and NMVOC, which act as precur-
sect extending from the Azores, in the mid-Atlantic Ocean,         sors of secondary organic aerosol (Hallquist et al., 2009).
to K-Puszta (Hungary), in central Europe.                          In 2012, PM2.5 was included in the revised version of the
   There are numerous carbonaceous aerosol sources, both           Gothenburg Protocol (UNECE, 2013); specifically, the pro-
anthropogenic (e.g. emissions from the combustion of fossil        tocol states that effort should be directed towards sources that
fuel and biomass) and biogenic (e.g. vegetation-emitted ter-       also emit black carbon (BC), which will inevitably also influ-
pene/isoprene oxidation and primary biological aerosol par-        ence OC.
ticles, PBAP, from sources such as plants and fungi) (Bauer

Atmos. Chem. Phys., 21, 7149–7170, 2021                                              https://doi.org/10.5194/acp-21-7149-2021
K. E. Yttri et al.: Trends, composition, and sources of carbonaceous aerosol                                                   7151

   Residential wood burning is a major source of carbona-             Watch) supersite in southern Norway (Fig. 1), situated 100 m
ceous aerosol in circumpolar countries (e.g. Yttri et al., 2014)      south-east of the old Birkenes site, that initiated measure-
and is even considered the most important source in Norway,           ments in 2009. The observatory is in the Boreo-nemoral zone
accounting for 48 % (2017) of PM2.5 (Grythe et al., 2019).            with mixed coniferous and deciduous trees (65 % of the land
This region also regularly experiences major wild and agri-           use near the site); the remainder of the land use in the region
cultural fires (e.g. Stohl et al., 2006, 2007). A growing num-        is meadows (10 %), low-intensity agricultural areas (10 %),
ber of studies show that residential wood burning is more             and freshwater lakes (15 %). Close to the Skagerrak coast
widespread in continental Europe than previously assumed              (∼ 20 km) and at low altitude, the observatory experiences
and that its contribution to the ambient carbonaceous aerosol         a maritime climate with relatively mild winters and moder-
can be substantial (Sillanpää et al., 2005; Gelencsér et al.,         ately warm summers. The prevailing wind is westerly/south-
2007; Puxbaum et al., 2007; Lanz et al., 2010; Maenhaut et            westerly. Figure S1 in the Supplement shows the ambient
al., 2012; Genberg et al., 2011; Fuller et al., 2014; Yttri et al.,   temperature and precipitation (2001–2018) at Birkenes. The
2019) and even dominating (Szidat et al., 2007; Herich et al.,        nearest city is Kristiansand (population ∼ 61 000), which is
2014). Residential wood burning is a decentralized source in          25 km to the south-south-west.
Europe, and combustion typically takes place in small units
where the emissions are emitted without after-treatment. An           2.2     Measurements and procedures
economic downturn in Greece compelled households to burn
firewood and waste material as fuel costs rose, increasing res-       2.2.1    Offline filter measurements
idential wood burning emissions in urban areas by 30 % (Saf-
fari et al., 2013). Future increases in European wood burning         We collected OC/EC, organic tracers, and PM mass filter
emissions might occur due to climate change mitigation poli-          samples using two low-volume samplers with a PM10 and a
cies supporting the use of renewable and biofuels (van der            PM2.5 inlet. Quartz fibre filters (Whatman QM-A; 47 mm in
Gon et al., 2015). Denier van der Gon et al. (2015) conclude          diameter) were pre-fired (850 ◦ C for 3 h). We conditioned the
that European emissions from residential wood burning are             filters (20 ± 1 ◦ C at 50 ± 5 % RH, relative humidity) for 48 h
significantly underestimated; thus, it appears timely to ad-          before and after exposure and weighed them to obtain PM
dress how ambient carbonaceous aerosol – particularly from            mass. We kept filters in PetriSlides and stored them at 4 ◦ C
biomass burning – has developed over the last 2 decades.              after weighing and before OC/EC analysis. After OC/EC
   Kahnert et al. (2004) and Tørseth et al. (2012) highlight          analysis and prior to organic tracer analysis, the samples
the importance of long-term measurements (> 10 years) of              were stored at −18 ◦ C. Two field blanks were assigned to
carbonaceous aerosol. The Birkenes Observatory in southern            each month of sampling and were treated in exactly the same
Norway holds the longest time series of OC and EC in Eu-              manner regarding preparation, handling, transport, and stor-
rope, dating back to 2001, including measurements in both             age as the exposed filters, except that they were not inserted
the PM10 and PM2.5 fractions. Influenced by major anthro-             in the samplers. We collected one sample per sampler per
pogenic emission regions in Europe, the Birkenes Observa-             week (168 h) except for the period from 14 August 2002 to
tory is well-suited to monitor air pollution from continental         17 September 2008 during which two samples were collected
Europe.                                                               per sampler per week at 24 and 144 h intervals. The sam-
   Here, we apply positive matrix factorization (PMF) to              pling inlets are 2 m above the observatory roof, 5 m above
identify sources of carbonaceous aerosol at the Birkenes Ob-          ground level (∼ 226 m a.s.l.). The OC/EC and PM mass time
servatory. Measurements of complementary species accom-               series date back to February 2001, and the organic tracers
pany OC/EC monitoring, allowing us to understand these                date back to January 2008 (monosaccharide anhydrides) and
sources, their contribution, and their variability at timescales      January 2016 (sugars, sugar-alcohols, and 2-methyltetrols).
from minutes to decades: organic tracers for biomass burn-                We performed thermal–optical analysis (TOA, Sunset
ing (levoglucosan), PBAP (arabitol, mannitol, trehalose, and          Laboratory OC/EC instrument), using transmission for char-
glucose), and BSOA (2-methyltetrols), as well as high-time-           ring correction. We used the Quartz temperature programme
resolution equivalent black carbon resulting from biomass             in 2001–2008 and EUSAAR-2 (Cavalli et al., 2010) from
(eBCBB ) and fossil (eBCFF ) fuel combustion, derived from            2008 onward. We compare the two temperature programmes
multi-wavelength Aethalometer measurements.                           for PM2.5 samples collected in 2014 in Sect. S1 in the Sup-
                                                                      plement. OC/EC instrument performance is regularly inter-
                                                                      compared under the joint EMEP/ACTRIS quality assurance
2     Methodology                                                     and quality control effort (e.g. Cavalli et al., 2013).
                                                                          Until 2014, we determined monosaccharide anhydrides
2.1    Sampling site                                                  (levoglucosan, mannosan, and galactosan) in PM10 using
                                                                      high-performance liquid chromatography high-resolution
The Birkenes Observatory (58◦ 230 N, 8◦ 150 E; 219 m a.s.l.,          time-of-flight mass spectrometry (HPLC-HR-TOFMS) in
above sea level) is an EMEP/GAW (Global Atmospheric                   negative electrospray ionization mode according to the

https://doi.org/10.5194/acp-21-7149-2021                                               Atmos. Chem. Phys., 21, 7149–7170, 2021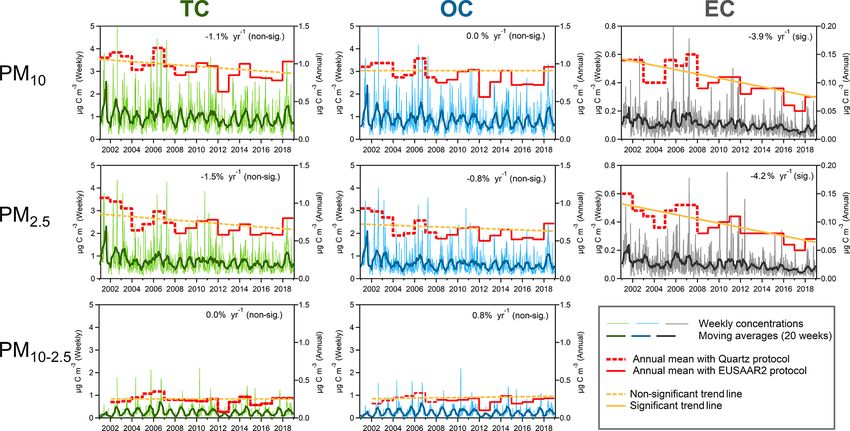
7152                                              K. E. Yttri et al.: Trends, composition, and sources of carbonaceous aerosol

Figure 1. The Birkenes Observatory (58◦ 230 N, 8◦ 150 E; 219 m a.s.l.) lies in the Boreo-nemoral zone, 20 km from the Skagerrak coastline in
southern Norway.

method of Dye and Yttri (2005). After 2014, we use ultra-               AAE or variability of the true AAE. Therefore, we also used
performance liquid chromatography (UPLC), with two Wa-                  a novel PMF application (Platt et al., 2021) and find two fac-
ters columns (2 mm × 2.1 mm × 150 mm HSS T3, 1.8 µm,                    tors: a low AAE factor (0.9) and a higher AAE factor (2.04),
Waters Inc.). Changing the column improved the chromato-                identified as eBCFF and eBCBB respectively. Uncertainties
graphic resolution, allowing for the analysis of sugars, sugar-         were assessed using bootstrapping (n = 2000). The advan-
alcohols, and 2-methyltetrols. We identified the monosaccha-            tages of the PMF are that no a priori knowledge of the factor
ride anhydrides based on retention time and mass spectra                AAEs is required, no periods of negative concentration re-
(accurate mass and isotope pattern) of authentic standards              sult, deviations from a the strict power-law dependence of
(Table S1 in the Supplement). Isotope-labelled standards of             BAbs on wavelength (e.g. due to the degradation of light-
levoglucosan, galactosan, arabitol, mannitol, trehalose, and            absorbing components in the atmosphere or instrument er-
glucose were used as internal recovery standard (Table S1).             rors/bias) are permitted, and poorly fitting data are assigned
   Weekly OC/EC, PM10 , and PM2.5 are publicly available                to a residual. Meanwhile, bootstrapping allows for the esti-
on EBAS (http://ebas.nilu.no, last access: 1 December 2020).            mation of uncertainties; the methodology of the PMF anal-
The mean values (daily/weekly/seasonal/annual) used below,              ysis and Aethalometer data post-processing are detailed in
the merging of data from the old and new Birkenes sites, and            Sect. S3 (Table S2).
the quality assurance of the filter data are detailed in Sect. S1.
We used the Mann–Kendall test (Mann, 1945; Kendall, 1975;               2.3    FLEXPART model simulations
Gilbert, 1987) to identify significant trends in the filter-based
measurements, and we implemented the Theil–Sen slope                    We investigated the origin of the observed eBC with a La-
(Theil, 1950; Sen, 1968; Gilbert, 1987) to quantify the trends          grangian transport model (FLEXPART v10.4, Pisso et al.,
(Sect. S2).                                                             2019). The model, powered by the European Centre for
                                                                        Medium-Range Weather Forecasts with 137 vertical lay-
                                                                        ers and a horizontal resolution of 0.1◦ × 0.1◦ , tracks sim-
2.2.2   Online measurement and source apportionment
                                                                        ulated particles arriving at the receptor 30 d backwards in
        of absorption coefficients
                                                                        time (retro-plume mode) and accounts for gravitational set-
                                                                        tling, dry and wet deposition (Grythe et al., 2017), turbu-
We determined absorption coefficients (BAbs ) using a multi-            lence (Cassiani et al., 2015), unresolved mesoscale motions
wavelength absorption photometer (AE33 Aethalometer,                    (Stohl et al., 2005), and includes a deep convection scheme
Magee Scientific). Here, we performed source apportion-                 (Forster et al., 2007). Output consists of an emission sensitiv-
ment using the Aethalometer model (Sandradewi et al., 2008)             ity (0.5◦ × 0.5◦ resolution), which is a quantitative measure
to determine eBCBB /eBCFF . However, the Aethalometer                   of the particle mass concentration at the receptor resulting
model requires a priori knowledge of the aerosol Ångstrøm               from a unit emission flux at the Earth’s surface. The emis-
exponents (AAEs). As the output of the aethalometer model               sion sensitivity can also be interpreted as a probability dis-
is highly sensitive to the input AAEs, uncertainty in the in-           tribution field of the particle’s origin, which is used in the
put AAEs leads to large uncertainty in the output time se-              present study to identify possible source regions of eBC.
ries. Furthermore, the high sensitivity of the model to the
AAEs typically leads to negative concentrations as outputs
during time periods where the input AAE does not match
the true AAE, whether due to an incorrect choice of input

Atmos. Chem. Phys., 21, 7149–7170, 2021                                                    https://doi.org/10.5194/acp-21-7149-2021
K. E. Yttri et al.: Trends, composition, and sources of carbonaceous aerosol                                                  7153

2.4   Positive matrix factorization analysis on filter data        son and peaks in winter, pointing to residential heating as the
                                                                   major source.
We performed PMF ME-2 (positive matrix factorization                  The TRA/IND factor explained most EC (50 %); the ma-
generalized multilinear engine; Canonaco et al., 2013; see         jority of the trace elements Pb (84 %), Zn (82 %), Cd (81 %),
Sect. S3 of this paper for a description of the analysis prin-     As (78 %), V (70 %), Ni (69 %), Cu (62 %), and Co (42 %);
ciple and Sect. S4 for its application to filter data) for sam-    and a noticeable fraction of SO2−4 (20 %), which suggests the
ples collected in 2016–2018 (151 samples) using the follow-        influence of various anthropogenic emissions. TRA/IND ex-
ing input data: OC (in PM2.5 and PM10–2.5 ); EC (in PM10 );        plained a small fraction of fine OC (10 %) and a negligible
levoglucosan mannosan, galactosan, arabitol, mannitol, tre-        fraction of coarse OC (4 %). The majority of OC (88 %) re-
halose, glucose, 2-methylerythritol, 2-methylthreitol, V, Mn,      sides in the fine fraction, which is in line with its combustion-
Ti, Fe, Co, Ni, Cu, Zn, As, Cd, and Pb (all in PM10 ); and         derived origin. The high EC fraction unambiguously points
SO2−        −      +      2+      2+      +     +
    4 , NO3 , NH4 , Ca , Mg , K , Na , and Cl (from
                                                        −          to combustion processes, and the low OC/EC ratio (1.4 for
open filter face). Table S3 shows the miscellaneous settings       PM2.5 ) points towards a substantial, although not exclusive,
of the PMF analysis of these data, including missing data          influence from vehicular traffic. Cu and Zn result from brake
treatment and an assessment of the PMF performance. The            wear (Fomba et al., 2018), whereas tyre wear is an additional
input data and error estimates were prepared using the pro-        source of Zn (Pacyna et al., 1986), corroborating the influ-
cedure suggested by Polissar et al. (1998) and Norris et           ence of vehicular traffic to the TRA/IND factor. Ni and V
al. (2014); see Sect. S3.                                          are commonly associated with the combustion of heavy oil
   Source apportionment by PMF is based on the tempo-              (Viana et al., 2008); As, Cd, and Pb are associated with the
ral variability of the components. It is expected that signif-     combustion of coal and, to a lesser extent, oil as well as with
icant contributions to carbonaceous aerosol at Birkenes are        metallurgic activity (Pacyna et al., 1986). The TRA/IND fac-
via long-range atmospheric transport (LRT), in addition to         tor has a minimum in summer and shows minor variability
more local sources. Local and LRT sources will have differ-        for the rest of the year. A similar drop in the vehicular traffic
ent temporal variability, and significant mixing of air masses     factor in summer for Helsinki was shown by Saarikoski et
and chemical transformation is expected for the latter, i.e.       al. (2008).
factor profiles at Birkenes are expected to differ somewhat           The PMF analysis confined the majority of coarse OC
from emission profiles at the source, even though the pro-         (53 %) and essentially all (82 %–93 %) of the PBAP trac-
file is distinctive enough for source attribution. Therefore,      ers (arabitol, mannitol, trehalose, and glucose) to one factor
we did not attempt to constrain factor profiles via methods        (PBAP). The PBAP factor has a pronounced seasonal vari-
such as ME-2 (Canonaco et al., 2013) because Birkenes, as          ability, showing increased levels in the vegetative season and
a relatively clean rural background site, is unlikely to re-       being almost absent outside of this season, as previously de-
ceive unprocessed emissions. Furthermore, in some cases,           scribed for coarse OC (Yttri et al., 2007a) and PBAP tracers
mixed contributions to a factor can be resolved a posteriori       (Yttri et al., 2007b) at Birkenes.
for source quantification (i.e. if it is clear where mass should      The 2-methyltetrols (92 %–96 %) are oxidation products
be reassigned), without potentially perturbing the output fac-     of isoprene (Claeys et al., 2004) and are almost exclu-
tor time series.                                                   sively attributed to the BSOASRT (SRT denotes short-range
   Two previous studies have used factor analysis to study         transport) factor, which explains 9 % of fine OC and 13 %
PM sources at Birkenes (Aamundsen et al., 1992; Maenhaut,          of coarse OC. The complete absence of EC and the pres-
2018). The present study focuses on carbonaceous aerosol,          ence of SO2− 4 (17 %) underpins the secondary nature of this
using OC, EC, and highly source-specific organic tracers as        factor, which is present in summer with tail ends in late
input in addition to inorganic species and elements used by        spring and early autumn. The BSOASRT time series increases
Aamundsen et al. (1992) and Maenhaut (2018). This pro-             abruptly in the May–June transition, as leaves unfold, and
vides a different set of factors, based on different input, ham-   subsides equally rapid at the beginning of October when
pering any reliable comparison of these studies.                   trees shed their leaves. The near absence of 2-methyltetrols
                                                                   prior to May–June suggests that the 0.5- to 1.5-month ear-
Identification of PMF factors                                      lier onset of the vegetative season in continental Europe
                                                                   (Rötzer and Chmielewski, 2001) is not reflected by the 2-
The biomass burning (BB) factor appears well confined in           methyltetrols observations at Birkenes, indicating a short at-
the PMF solution (Fig. 2, Table S4), explaining all of the         mospheric lifetime for 2-methyltetrols. Consequently, local
monosaccharide anhydrides (95 %–98 %). OCBB was almost             isoprene emissions likely explain the observed concentra-
exclusively (87 %) in the fine fraction of PM10 . Other key        tions of 2-methyltetrols at Birkenes, which calls the extent
qualifiers derived from the BB factor are the ratios listed in     to which the BSOASRT factor includes a continental BSOA
Table 1, which are highly comparable to the results obtained       contribution into question. Similar sources (deciduous and
by 14 C analysis reported in the comprehensive study by Zot-       coniferous trees), temperature-dependent emissions, and for-
ter et al. (2014). The BB factor is elevated in the heating sea-   mation rates suggest that particulate-phase oxidation prod-

https://doi.org/10.5194/acp-21-7149-2021                                            Atmos. Chem. Phys., 21, 7149–7170, 2021
7154                                                   K. E. Yttri et al.: Trends, composition, and sources of carbonaceous aerosol

Figure 2. Results from PMF for Birkenes for 2016–2018, showing the (a) factor profiles, (b) factor time series, and (c) aggregated monthly
data. The box plots in panels (a) and (c) show statistics from bootstrapped solutions (n = 5000), including the 25th and 75th percentiles
(boxes), the median (horizontal lines), and the 10th and 90th percentiles (whiskers). Black markers are the means. The red markers in
panel (a) show the base factor profiles.

Table 1. Variables describing the biomass burning source derived from the PMF BB factor in the present study, and the comparable variables
obtained by 14 C analysis reported by Zotter et al. (2014).

                         Present study                                    Zotter et al. (2014)∗
                         OC / Levoglucosan (in PM10 ) = 12.7              OCNF / Levoglucosan (in PM10 ) = 12.6 ± 3.1
                         OC / Levoglucosan (in PM2.5 ) = 11.1
                         EC / Levoglucosan (in PM10 ) = 1.96              ECNF / Levoglucosan (in PM10 ) = 1.72 ± 0.59
                         OC / EC (in PM10 ) = 6.5                         OCNF / ECNF (in PM10 ) = 7.7 ± 2.1
                         OC / EC (in PM2.5 ) = 5.7
                       ∗ North of the Alps. OC
                                              NF denotes non-fossil OC, and ECNF denotes non-fossil EC.

ucts of mono- and sesquiterpenes are accounted for by the                        is one possible explanation, but the mixing of air masses is
isoprene-derived BSOASRT factor as well, although with a                         more likely, as 13 % of the EC also resides in this factor.
similar issue concerning local vs. LRT contribution as those                     The high OC/EC ratio in the unweighted MIN factor profile
proposed for the 2-methyltetrols.                                                (18 for PM2.5 ) indicates a minor primary combustion parti-
   The MIN factor is defined by its content of Ti (93 % of                       cle influence, and the absence of levoglucosan shows that the
total), Fe (75 %), Mn (52 %), and Ca2+ (39 %) (Fig. 2, Ta-                       EC content originates from fossil fuel combustion (consis-
ble S4), which are well-known constituents of mineral dust                       tent with some TRA/IND influence). Using Eq. (1), 8 % of
(e.g. Alastuey et al., 2016). It also contains some of the                       the MIN factor’s fine OC content is attributed to the combus-
elements that dominate the TRA/IND factor, including Co                          tion of fossil fuel OC (OCPrimFF ), whereas the correspond-
(43 %), Cu (20 %), Ni (17 %), and V (14 %), indicating an an-                    ing percentage for PM10 OC is 7 %. If all Ca2+ and Mg2+
thropogenic influence. Notably, 31 % of fine OC is attributed                    in the MIN factor were present as either calcite (CaCO3 ) or
to the MIN factor, whereas it explains 13 % of coarse OC.                        dolomite CaMg(CO3 )2 , the CO2−  3 -carbon would account for
This corresponds to the findings reported by Kyllönen et                         no more than 3 % of the factor’s PM10 OC content – or 22 %
al. (2020) for the subarctic Pallas (Finland) site, where 29 %                   if it all resided in the coarse fraction. This shows that the
of the fine OC was apportioned to the mineral dust factor.                       OC content of the MIN factor mostly originates from sources
Waked et al. (2014) found a similar result for Lens (France),                    other than mineral dust and the combustion of fossil fuel. The
where the mineral dust factor explained 15 % of OC. No                           MIN factor is most abundant in spring and early summer, as
information on the size distribution was available in Kyllö-                     seen by Waked et al. (2014), and is associated with southern
nen et al. (2020) and Waked et al. (2014); however, in the                       air masses, as seen for the dry and warm period in the May–
present study, 86 % of OC in the MIN factor resides in the                       June transition in 2018 (Fig. 3) when there was a pronounced
fine fraction of PM10 . As mineral dust typically resides in                     peak in the MIN factor time series (Fig. 2). Indeed, the mean
the coarse fraction of PM10 (Ripoll et al., 2015), one would                     ambient temperature was 4 ◦ C higher for May 2018 than for
expect the same for its carbon content (e.g. as CaCO3 ). More                    May 2001–2018, whereas it was 2.4 ◦ C higher for June 2018
efficient deposition of coarse-mode mineral dust during LRT                      than for June 2001–2018. Thus, we suggest that the clima-

Atmos. Chem. Phys., 21, 7149–7170, 2021                                                                   https://doi.org/10.5194/acp-21-7149-2021
K. E. Yttri et al.: Trends, composition, and sources of carbonaceous aerosol                                               7155

                                                                  3     Results and discussion

                                                                  3.1     Levels and trends of carbonaceous aerosol and
                                                                          organic tracers

                                                                  Annual mean carbonaceous aerosol concentrations at
                                                                  Birkenes (2001–2018) are among the lowest in Europe (Yt-
                                                                  tri et al., 2007a, 2019), with OC from 0.56 to 1.07 µg C m−3
                                                                  for PM10 and from 0.50 to 0.93 µg C m−3 for PM2.5 , and EC
                                                                  from 0.05 to 0.15 µg C m−3 (Fig. 4; Table S4). As it stems
                                                                  from combustion that generates fine PM, EC was almost ex-
                                                                  clusively associated with PM2.5 , whereas OC was also abun-
                                                                  dant in the coarse fraction (PM10–2.5 ), particularly in sum-
                                                                  mer and autumn (Fig. 4). The correlation between OC and
                                                                  EC varied by season (Table S6) and was highest in the heat-
                                                                  ing season, reflecting the contribution of biogenic, non-EC
                                                                  sources, such as BSOA and PBAP in the vegetative sea-
                                                                  son. The higher R 2 values for PM2.5 compared with PM10
                                                                  can partly be attributed to PBAP, which mainly resides in
                                                                  PM10–2.5 .
Figure 3. Footprint emission sensitivities calculated using the
FLEXPART model for the 30 May–6 June 2018 period at the
                                                                     The variability of the annual mean OC (15 %–22 %) and
Birkenes Observatory.                                             EC (27 %) concentrations was comparable to the major sec-
                                                                  ondary inorganic aerosol (SIA; SO2−        −           +
                                                                                                      4 , NO3 , and NH4 ) and
                                                                  sea salt (SS; Na+ , Mg2+ , and Cl− ) aerosol species (25 %–
tological conditions that activate mineral dust sources also      31 %). A difference of > 60 % between consecutive years
favour BSOA formation and that the majority of both the fine      was observed for OC and EC in PM10 and PM2.5 , whereas
(92 %) and coarse fraction (78 %) of OC in the MIN factor is      160 % was seen for OC in PM10–2.5 . It is important to
LRT BSOA (OCBSOA,LRT ).                                           note that, despite decades of SO2 , NH3 , and NOx mitiga-
                                                                tion efforts, SIA dominates PM10 mass (29 %–52 %) most
                                     OC                           years, followed by carbonaceous aerosol (24 %–40 %) and
OCFossil,primary,MIN = [ECMIN ] ×                 ,
                                     EC TRA/IND                   SS aerosol (10 %–28 %) (Fig. 5; Table S7). SIA constituents
                                                                were also the largest PM10 fraction during air pollution
  OC
                  = 1.4                                  (1)      episodes (Table S8), reflecting the fact that Birkenes is af-
  EC TRA/IND                                                      fected by major SIA precursor emission regions in continen-
                                                                  tal Europe.
The majority of NH+                     −
                       4 (77 %) and NO3 (68 %) resides in            Levels of total carbon (TC) and PM fractions are shown in
the NH4 NO3 factor, which points to secondary inorganic           Tables S9 and S10 respectively for completeness. In the fol-
aerosol (SIA) formation during LRT. This is also supported        lowing sections, we discuss the respective OC and EC frac-
by a noticeable contribution of SO2−
                                   4 (35 %) to the NH4 NO3        tions in detail.
factor. The factor’s NO2 (30 %) content points towards a
combustion-derived origin of NO3 , as does EC (13 %). The         3.1.1    Organic carbon
factor’s OC content is comparable to that seen for the BB
factor. The factor is most pronounced in winter and spring.       We found no significant trend for OC in PM10 (OCPM10 ).
   The sea salt (SS) aerosol factor was recognized by its         There was a minor decrease (−0.8 % yr−1 ) for fine OC
high Cl− (96 %), Na+ (87 %), and Mg2+ (79 %) fractions.           in PM2.5 (OCPM2.5 ), whereas there was a minor increase
The K+ /Na+ (0.036), Ca2+ /Na+ (0.034), and SO2−    4 /Na
                                                            +
                                                                  (0.8 % yr−1 ) for coarse OC (OCPM10–2.5 ) (Table S11). The
(0.282) ratios derived from the SS factor closely resemble        anthropogenic fraction of OC observed at Birkenes likely
these ratios in sea water (0.037, 0.038, and 0.252) (Stumm        has a downward trend as found for EC (Sect. 3.1.2), but the
and Morgan, 1996), further demonstrating the successful           substantial influence of natural sources demonstrated in the
separation of this factor.                                        present, as well as in previous, work (Yttri et al., 2011b) ex-
                                                                  plains the general lack of trends for OC.
                                                                     The OC time series are characterized by 2 years where
                                                                  the annual mean was substantially higher (2006) and lower
                                                                  (2012) than the proceeding and the following year (Fig. 4).
                                                                  The increased level in 2006 was most pronounced in the fine

https://doi.org/10.5194/acp-21-7149-2021                                           Atmos. Chem. Phys., 21, 7149–7170, 2021
7156 K. E. Yttri et al.: Trends, composition, and sources of carbonaceous aerosol
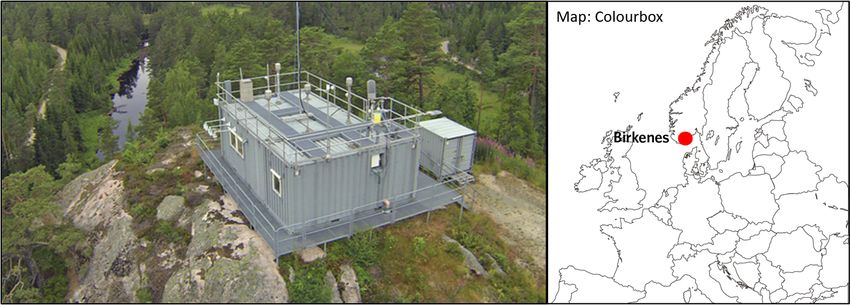
Figure 4. Ambient aerosol concentrations of TC, OC, and EC in PM10 (upper panels); TC, OC, and EC in PM2.5 (middle panels); and
TC and OC in PM10–2.5 (lower panels), presented as weekly (168 h) and annual mean concentrations for the Birkenes Observatory for the
2001–2018 period. The trend lines account for the protocol shift.
Figure 5. Mass closure of PM10 for Birkenes for the 2001–2018 period (unit: %). Sea salt is the sum of Na+ , Mg2+ , and Cl− ; secondary
inorganic aerosol (SIA) is the sum of SO2− − +
4 , NO3 , and NH4 ; CA is carbonaceous aerosol; and OM is organic matter. OM is calculated using
OC : OM = 1.9 (Yttri et al., 2011a).
fraction and in all seasons except spring, whereas the drop Previous studies (Simpson et al., 2007; Yttri et al., 2011a, b)
in 2012 mainly was attributed to the coarse fraction and was showed that BSOA largely dominates the fine carbonaceous
observed in all seasons. The OCPM10–2.5 annual mean time se- aerosol in summer at Birkenes, whereas the present study
ries is characterized by a stepwise increase from 2001 up to, shows that Birkenes regularly experiences major air pollu-
and including, 2006, after which the concentration dropped tion events in spring, as a result of LRT (Tables S4, S7 and
and showed minor annual variability, except for the very low S8). Hence, both biogenic sources and LRT explain the ob-
annual mean of 2012. After 2015, there are indications of a served seasonality of fine OC.
similar stepwise increase as seen for 2001–2006. We attribute elevated OCPM2.5 in winter 2010 to residen-
The OCPM10–2.5 contribution to OCPM10 ranged from 18 % tial wood burning emissions, as discussed in Sect. 3.2.1.
to 35 % on an annual basis (2001 excluded due to data cap- Only on five occasions did the seasonal mean of OCPM2.5
ture < 50 %), and levels were highest in summer and autumn. exceed 1 µg C m−3 , four of those in the first 3 years of the
Atmos. Chem. Phys., 21, 7149–7170, 2021 https://doi.org/10.5194/acp-21-7149-2021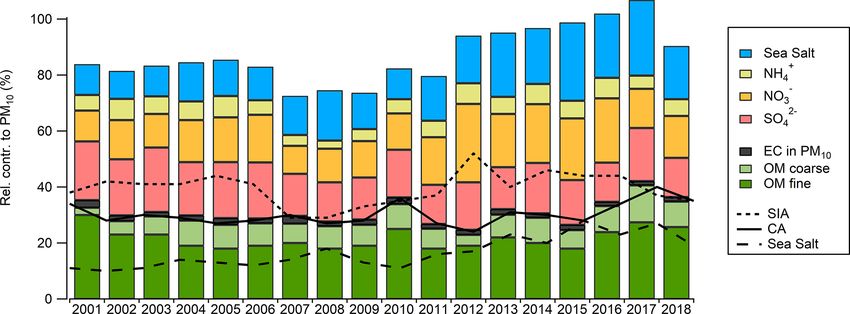
K. E. Yttri et al.: Trends, composition, and sources of carbonaceous aerosol                                                7157

time series. The highest mean was observed in summer 2002         results demonstrate a long-term change in the aerosol chem-
(1.4 µg C m−3 ) when wildfires in eastern Europe influenced       ical composition at Birkenes and, thus, also in the relative
Birkenes (Yttri et al., 2007a). The four other occasions,         source composition of PM.
in spring 2001, 2002, 2003, and 2018, also saw prolonged
episodes of PM air pollution with the hallmark of LRT (i.e.       3.1.3    Levoglucosan
elevated SO2−        −            +
             4 , NO3 , and NH4 ). According to our PMF
analysis (see Sect. 3.2), there are several anthropogenic and     Levels of levoglucosan and other organic tracers are given
biogenic sources likely to contribute to fine OC at Birkenes,     in Table S15, and other organic tracers (arabitol, manni-
whereas the coarse fraction of OC is dominated by a single        tol, trehalose, glucose, and 2-methyltetrols) are discussed in
source, PBAP (Yttri et al., 2007a, b, 2011a, b; Glasius et al.,   Sect. S6.
2018). Hence, it is not surprising that OCPM2.5 was the dom-         The statistically significant decrease in levoglucosan
inant OC fraction, accounting for 70 %–89 % OCPM10 on an          (−2.8 % yr−1 ) at Birkenes for 2008–2018 (Fig. 6; Table S11)
annual basis.                                                     and the fact that biomass burning levels observed at Birkenes
                                                                  are largely explained by continental emissions (Fig. 7) might
3.1.2   Elemental carbon                                          indicate that wood burning emissions in continental Eu-
                                                                  rope are declining. However, surprisingly, we find no signif-
Notably, EC levels dropped from 2007 to 2008, contrast-           icant trend for levoglucosan on a seasonal basis (Table S12).
ing with the annual mean OC time series, (Fig. 4 and Ta-          Furthermore, although one should be careful drawing con-
ble S5). This major downward trend of EC clearly points           clusions from non-significant outcomes, it is worth not-
to changing source contributions to EC at Birkenes. We            ing that the levoglucosan to EC ratio most likely increased
rarely observed seasonal means exceeding 0.15 µg C m−3 :          (+2.8 % yr−1 for PM10 , with a confidence interval (CI) from
only in winter 2006, 2007, and 2010; spring 2001, 2003, and       −3.5 % yr−1 to +6.5 % yr−1 , and +2.3 % yr−1 for PM2.5 ,
2007; and autumn 2005 and 2011. Weekly samples exceeded           with a CI from −2.2 % yr−1 to 5.0 % yr−1 ) for the 2008–
0.5 µg C m−3 for three samples only, which were all associ-       2018 period, whereas it most likely decreased for the levoglu-
ated with LRT.                                                    cosan to OC ratio (−1.8 % yr−1 for PM10 , with a CI from
   A statistically significant reduction was calculated for       −10.6 % yr−1 to +1.8 % yr−1 , and −3.6 % yr−1 for PM2.5 ,
EC in PM10 (−3.9 % yr−1 ) and PM2.5 (−4.2 % yr−1 ) (Ta-           with a CI from −9.8 % yr−1 to +1.3 % yr−1 ) (Table S13). A
ble S11), corresponding well with SO2−     4    (−3.8 % yr−1 )    more efficient abatement of fossil sources than biomass burn-
and PM2.5 (−4.0 % yr−1 ). The trend for EC was most               ing would explain the levoglucosan to EC increase, whereas
pronounced in spring and summer (−4.0 % yr−1 to                   we fail to see a similar trend for the levoglucosan to OC ratio,
−5.9 % yr−1 ) (Table S12), as seen for SO2−  4 (−4.2 % yr
                                                            −1    as prevailing natural sources mask the assumed reduction in
to −6.4 % yr−1 ) and PM2.5 (−3.0 % yr−1 to −4.4 % yr−1 )          fossil OC of anthropogenic origin.
(Table S12). The EMEP model finds a somewhat lower re-               The levoglucosan time series provides a hitherto unprece-
duction for EC (−3.0 % yr−1 ) for 2001–2017 (Colette et           dented opportunity to validate European residential wood
al., 2021) with the largest emission reductions for the road      burning emission inventories on a decadal timescale. Unfor-
transport (83 kt; −3.6 % yr−1 ) and off-road categories (44 kt;   tunately, the inventories suffer from non-harmonized emis-
−3.7 % yr−1 ) (https://www.ceip.at, last access: 2020), which     sion reporting and a lack of condensable organics (van der
are sectors with minor seasonal variability. We suggest that      Gon et al., 2015; Simpson et al., 2019), which hampers any
these sectors explain the downward trend observed for EC at       reliable attempt for such validation. Given the uncertainties
Birkenes and that the seasonality of the EC trend is due to       in the trend calculations (i.e. annual vs. seasonal trends),
the substantial contribution from less abated sources, such       more work is needed to investigate trends in levoglucosan
as domestic heating in winter and autumn. Notably, mod-           and biomass burning, foremost by continuation of the ac-
elled EC emissions are unchanged for the other stationary         tual time series. Such efforts should be initiated immediately
combustion category for 2001–2016 (−1 kt; −0.08 % yr−1 )          given the numerous studies that point to residential wood
(https://www.ceip.at), which includes residential heating and     burning as a major source of air pollution in Europe (e.g.
wood burning in particular.                                       Denier van der Gon et al., 2015; Yttri et al., 2019).
   Effective abatement of SIA precursors and fossil EC,
along with a high natural source contribution to OC, largely      3.2     Sources of carbonaceous aerosol at Birkenes
explains why the OC fraction increased significantly for
PM2.5 (+3.2 % yr−1 ) and PM10 (+2.4 % yr−1 ), whereas it          We used PMF to apportion carbonaceous aerosol at Birkenes
decreased for the EC fraction (−3.9 % yr−1 to −4.5 % yr−1 )       for 2016–2018. The time period was restricted by organic
(Table S13). The largest increase (OC) and decrease (EC)          tracer data availability. Carbonaceous aerosol annual means
were seen in the vegetative season (Table S14) during which       for 2016–2018 were within the long-term annual mean
BSOA and PBAP increase and the influence of poorly abated         (± SD) for OC and were only slightly lower for EC in 2016
sources such as domestic heating is low. Consequently, these      and 2017; thus, they are representative of the longer time

https://doi.org/10.5194/acp-21-7149-2021                                           Atmos. Chem. Phys., 21, 7149–7170, 2021
7158 K. E. Yttri et al.: Trends, composition, and sources of carbonaceous aerosol
Figure 6. Ambient aerosol concentrations of organic tracers in PM10 , showing levoglucosan, 2-methylerythritol, and 2-methylthreitol (up-
per panels); arabitol, mannitol, and trehalose (middle panels); and glucose (bottom panel), presented as weekly (168 h) and annual mean
concentrations for the Birkenes Observatory for the 2008–2018 period.
series. Six out of seven factors identified in contribution- equally large shares (13 %). The 3 % apportioned to PBAP
weighted relative profiles from PMF (Fig. 2; Table S4) is an assumed analytical artefact (see Sect. 3.2.2 for details).
were associated with significant amounts of carbonaceous The BB, NH4 NO3 , and TRA/IND factors are considered
aerosol. This includes factors for mineral-dust-dominated entirely anthropogenic, BSOASRT and PBAP are considered
aerosol (MIN), the OC content of which is mainly as- exclusively natural, and MIN is considered mixed (Fig. 8).
sociated with LRT BSOA (BSOALRT ); traffic/industry-like Natural (54 %) and anthropogenic (46 %) sources contributed
aerosol (TRA/IND); biogenic secondary organic aerosol almost equally to fine OC (Fig. 8) annually, as well as in
(BSOASRT ), which undergoes short-range transport; primary spring and autumn (51 % natural), whereas natural sources
biological aerosol particles (PBAP); biomass burning (BB); prevailed in summer (77 %) and anthropogenic sources pre-
and ammonium-nitrate-dominated aerosol (NH4 NO3 ). The vailed in winter (78 %). Natural sources dominated coarse
sea salt aerosol factor (SS) had a negligible (< 1 %) carbona- OC annually (78 %) and in all seasons (70 %–91 %) except
ceous aerosol content. winter (37%). We consider the minor fraction of coarse OC
The MIN factor (31 %) explained the largest fraction of attributed to CO2−
3 -carbon (3 %) to be of natural origin. The
fine OC, whereas BB (17 %), NH4 NO3 (17 %), and PBAP findings for OC in PM10 are rather like those for PM2.5 , only
(16 %) had almost equally large shares, as did TRA/IND that the natural contribution is somewhat more pronounced
(10 %) and BSOASRT (9 %) (Fig. 8). Coarse OC was by due to the influence of a mostly naturally influenced coarse
far the most abundant in the PBAP factor (53 %), whereas OC fraction.
BSOASRT (13 %), MIN (13 %), and NH4 NO3 (12 %) ex-
plained almost equally large shares. For the other factors, 3.2.1 Anthropogenic carbonaceous aerosol sources
coarse OC was minor. EC was apportioned to only five
factors, and TRA/IND (50 %) dominated by far. BB made
a 21 % contribution, and MIN and NH4 NO3 contributed According to PMF, BB accounted for 14 %–17 % of OC an-
nually, considering both PM2.5 and PM10 vs. only 6 % of
coarse OC. BB was by far the major contributor to OC in
Atmos. Chem. Phys., 21, 7149–7170, 2021 https://doi.org/10.5194/acp-21-7149-2021K. E. Yttri et al.: Trends, composition, and sources of carbonaceous aerosol 7159
ues suggested by Zotter et al. (2017) are only recommended
when no a priori information on the AAEs is available. A sig-
nificant advantage of the PMF approach by Platt et al. (2021)
is that the AAE is an output.
Source regions of elevated (70th percentile) and low (30th
percentile) winter and summertime eBCBB (and eBCFF ) ob-
served at Birkenes for 2018 were studied using the approach
of Hirdman et al. (2010). The results show that Birkenes is
a receptor of LRT exclusively from continental Europe for
elevated eBCBB and eBCFF levels (Fig. 7), both in summer
and winter. This is consistent with a lack of diurnal varia-
tion in either eBCBB or eBCFF , likely because there are few
local sources at Birkenes. The main source regions extend
from the Atlantic coast in the west to the Ural Mountains
in winter, whereas the source regions are confined to eastern
Europe and western Russia (but not as far east as the Urals)
in summer. Notably, the Nordic countries do not contribute
to elevated levels except for the southern parts of Finland in
summer. The footprints are almost identical for eBCBB and
eBCFF for both summer and winter. High similarity in winter
is not a surprise, as the footprint covers such a wide area
and because wood burning for residential heating is com-
Figure 7. The 70th percentiles of eBCFF (a, c) and eBCBB (b, d) mon in several European countries. The summertime foot-
for winter (NDJFM) and summer (MJJAS). The colour code shows print is a subsection of the wintertime footprint that cov-
the ratio of residence times for footprint sensitivities during mea- ers an area well-known for severe wildfires and agricultural
surements exceeding the 70th percentile and the average footprint fires (Stohl et al., 2007; Yttri et al., 2007a); thus, the sum-
sensitivity. mer footprint agrees with previous studies. Further, Sciare
et al. (2008) point to the European countries bordering the
Black Sea as having high carbonaceous aerosol of fossil ori-
winter (35 %–37 %) and by far the most minor contributor gin. Low eBCBB and eBCFF levels at Birkenes are consistent
in summer (2 %–3 %) (not considering SS). Spring and au- with air masses that have an oceanic or terrestrial origin at
tumn are transition seasons where BB still made a substan- high latitudes, mainly from the Arctic. Notably, the highest
tial (14 %–19 %) contribution to OC. BB explained 22 % of 30 % of values explain 74 % of eBCBB at Birkenes for the ac-
EC annually (excluding ECPBAP , which we assume is an an- tual period; hence, LRT is decisive not only for episodes of
alytical artefact; see Sect. 3.2.2); hence, fossil fuel combus- high concentrations but also largely explains the mean con-
tion (78 %) was the major source. Emissions from residen- centration. All eBCBB and eBCFF observations included in
tial wood burning increased in the heating season, but fossil the 70th percentile were made in winter despite the less pro-
fuel sources dominated EC, even in winter (66 %). It can- nounced seasonality of eBCFF compared with eBCBB .
not be excluded that part of levoglucosan originates from To generate a longer BB time series of OCBB and ECBB
wildfires in summer, spring, and autumn, although this itself we combine the levoglucosan time series (2008–2018) with
may be due to anthropogenic activity. However, the levoglu- the levoglucosan / OC and levoglucosan / EC ratios derived
cosan / mannosan (L / M) ratio indicates minor variability in from the BB factor of the PMF analysis (Table 1; see Sect. S5
the source composition throughout the year (see Sect. S5), for details). The depletion of levoglucosan by OH oxidation
suggesting one dominant source. is more likely in summer (Hoffmann et al., 2010; Yttri et
The 78 % : 22 % split of EC into fossil fuel combus- al., 2014), although we still assume that levels mostly reflect
tion and biomass burning derived from PMF is sup- biomass burning emissions in all seasons.
ported by high-time-resolved concentrations of eBCBB ECBB levels were elevated in the heating season (Fig. 9;
and eBCFF derived from multi-wavelength Aethalome- Table S16). A strong temperature influence is illustrated by
ter measurements of the absorption coefficient, following a 9 ◦ C difference in the 25th percentile of wintertime tem-
the PMF approach of Platt et al. (2021). With this ap- peratures in 2015 (−0.3 ◦ C) and 2010 (−9.3 ◦ C) (Fig. S1),
proach, we find eBCBB /eBCTOT = 28 % (Table 2). Mean- which experienced the lowest (19 ng m−3 ) and the highest
while, using the Aethalometer model and AAEFF = 0.9 (84 ng m−3 ) wintertime mean concentration of ECBB respec-
and AAEBB = 1.68 (Zotter et al., 2017) as input, we find tively. Winter 2010 was exceptionally cold due to a negative
eBCBB /eBCTOT = 48 %; however, the Aethalometer model North Atlantic Oscillation and was the only occasion when
is extremely sensitive to the input AAE, and the AAE val- ECBB exceeded ECFF , with an annual mean ECBB > 60 %
https://doi.org/10.5194/acp-21-7149-2021 Atmos. Chem. Phys., 21, 7149–7170, 20217160 K. E. Yttri et al.: Trends, composition, and sources of carbonaceous aerosol
Figure 8. Factor contributions to OC in PM10 (a), PM2.5 (b), PM10–2.5 (c), and EC in PM10 (d) at Birkenes (2016–2018) (upper panels),
and the factor contributions divided into seasons (middle and lower panels), as determined by positive matrix factorization. The factors
enclosed by the full red line represent anthropogenic sources. The OC content of the MIN factor is divided into long-range-transported
BSOA (OCBSOA,LRT ) and primary OC from fossil fuel combustion (OCPrimFF ) following Eq. (1), and carbonate (CO2− 3 ) carbon (see
“Identification of PMF factors” in Sect. 2).
Table 2. Biomass burning fraction derived from PMF and the Aethalometer models. Aethalometer model 1 shows the biomass burning
fraction obtained by the default pair of absorption Ångstrøm exponents (AAE) suggested by Zotter et al. (2014), whereas Aethalometer
model 2 shows the biomass burning fraction obtained using the pair of AAEs derived from PMF.
PMF Aethalometer model 1 Aethalometer model 2
Biomass burning fraction 0.27 0.48 0.28
Fossil AAE 0.93 0.9 (Zotter et al., 2014) 0.93 (from PMF)
Biomass burning AAE 2.04 1.68 (Zotter et al., 2014) 2.04 (from PMF)
higher than the long-term mean. Pronounced interannual 40 % contribution. Levoglucosan cannot be used to differen-
variability was seen for the wood burning contribution in tiate emissions from residential wood burning, wildfires, and
winter (from 21 % to 60 % for EC), with the lowest fractions agricultural fires; the exceptions are major wildfire and agri-
occasionally matched by those in spring and autumn, typi- cultural fire episodes identifiable by unusually high concen-
cally ranging between 20 % and 30 %. ECBB / EC was small trations and traced by source–receptor models/satellite data
in summer (4 %–15 %), considerably less than in other sea- for plumes/burnt areas (Yttri et al., 2007a; Stohl et al., 2007).
sons, except in 2008, where we calculate a substantial 30 %– The influence from major wildfires in eastern Europe caused
Atmos. Chem. Phys., 21, 7149–7170, 2021 https://doi.org/10.5194/acp-21-7149-2021K. E. Yttri et al.: Trends, composition, and sources of carbonaceous aerosol 7161
a summertime peak in fine OC and EC in 2002 at Birkenes which is marginally lower than the factor’s content of coarse
(Yttri et al., 2007a). In June 2008, the largest wildfire in OC (0.113 µg C m−3 ). Combined, this made PBAP the most
Norway since World War II raged 25 km northeast of the abundant contributor to OC in PM10 along with the MIN
Birkenes Observatory, with an area of 30 km2 burnt. The ob- factor (both 26 %). Some PBAP tracers partly reside in the
servatory was downwind of the fire on only 1 d according to fine mode (Carvalho et al., 2003; Yttri et al., 2007b), but the
FLEXPART (Fig. S2). Despite this, the levoglucosan concen- 43 % OCPBAP found in the fine fraction in the present study is
tration for the weekly filter sample was 153 ng m−3 , which higher than what has previously been reported for the actual
was by far the highest in 1 decade of sampling. Notably, PBAP tracers at Birkenes (6 %–7 % for arabitol and man-
the annual mean concentration of levoglucosan for 2008 in- nitol, 20 % for trehalose, and 33 % for glucose; Yttri et al.,
creased by nearly 35 %, and ECBB contributed significantly 2007b). It cannot be excluded that the PBAP factor contains
to EC for summer 2008. some fine OC from other sources (e.g. due to condensation);
The seasonality of OCBB (Fig. 9) was like ECBB . Mean however, although there is a seasonal co-variability with the
wintertime OCBB / OC was 39 %–40 % and > 50 % in 2010 BSOASRT factor, only 2 %–3 % of the 2-methyltetrols were
and 2012 respectively considering both PM10 and PM2.5 . explained by the PBAP factor, and there was a low corre-
The summertime contribution was typically < 5 %, reflect- lation between the PBAP and the BSOASRT . This calls the
ing both low levoglucosan levels and major influences from above-mentioned hypothesis into question.
BSOA and PBAP, which peak in summer. Notably, five of the Arabitol and mannitol are well-known tracers of fungal
seven highest weekly OC concentrations for the PM10 time spores (Bauer et al., 2008), one of the most abundant sources
series were attributed to emissions from major wildfires in of PBAP (Elbert et al., 2007). Applying an OC to mannitol
eastern Europe (i.e. August 2002 and May/September 2006) ratio of 5.2–10.8 for fungal spores (Bauer et al., 2008; Yt-
and, thus, prior to the initiation of the levoglucosan time se- tri et al., 2011a), we estimate that 11 %–22 % of OCPBAP (in
ries. The local wildfire episode in summer 2008 caused a sub- PM10 ) comes from this source. Glucose is one of the primary
stantial increase in OCBB / OC (13 %–18 %), which is within molecular energy sources for plants and animals, a build-
the lower range of that observed for spring (12 %–27 %) and ing block of natural dimers and polymers (e.g. sucrose and
autumn (13 %–39 %). cellulose), and thus ubiquitous in nature; it is considered a
PBAP tracer of general character and is clearly important
3.2.2 Biogenic carbonaceous aerosol sources for the allocation of carbon mass to PBAP. Nevertheless, a
wider range of organic tracers ought to be tested in future
The general lack of PBAP tracers in the MIN (< 1 %) and PMF studies to explore the potential for further separation
SS (< 2 %) factors and no sea salt and Ti in the PBAP factor of the highly heterogenic PBAP source, including cellulose,
implies that soil and sea spray aerosol do not contribute to as well as amino acids. A greater diversity of PBAP tracers
PBAP at Birkenes, although this has been shown elsewhere may also provide a more correct PBAP estimate. The PMF
(O’Dowd et al., 2004; Jia and Fraser, 2011). PBAP repre- approach used in the present study gives a somewhat higher,
sented by glucose, arabitol, and mannitol appears to be asso- although overlapping, estimate of OCPBAP at Birkenes for
ciated with leaves rather than soil material and to be a source August 2016–2018 than Latin hypercube sampling (LHS)
of local origin (Samaké et al., 2019). However, even large for August 2009 (Yttri et al., 2011b) (Table 3). The LHS
PBAP, such as birch pollen (mean diameter of 22 µm), has the approach was based on a priori emission ratios, with uncer-
potential for long-range atmospheric transport of 1000 km tainty ranges estimated in a similar way to a Monte Carlo
due to its low-density, hydrophobic nature; release during analysis (although less computationally extensive), and con-
favourable dispersion conditions; and (often) emission height sidered only the sum of fungal spores and plant debris as
> 10 m (e.g. Sofiev et al., 2006; Skjøth et al., 2007). OCPBAP , based on mannitol (fungal spores) and cellulose
The PBAP factor concentration was nearly 1 order of mag- (plant debris), whereas the PMF approach may pick other
nitude higher in summer and autumn than in winter and was contributing (i.e. co-varying) sources.
the major contributor to coarse OC for all seasons except The 3 % EC in the PBAP factor is substantially less than
winter, particularly in summer (54 %) and autumn (69 %) the 16 % reported by Waked et al. (2014), who stated that
(Fig. 8). These are conservative estimates, as 3 %–9 % of atmospheric mixing, PMF limitations, and artefacts caused
the PBAP tracers reside in the BSOASRT factor, likely due by thermal–optical analysis could be plausible explanations.
to co-variability, as there is no scientific evidence linking bi- In the present study, low levels of coarse-fraction EC occa-
ologically formed sugars and sugar-alcohols to the abiotic sionally appear in summer and autumn (Table S5), follow-
formation of BSOA. Notably, the PBAP factor explained ing the seasonality of PBAP. This finding does not exclude
20 %–26 % of fine OC in summer and autumn, being the the three possibilities proposed by Waked et al. (2014), but
major contributor in autumn. Consequently, PBAP was the it supports the suggestion of Dusek et al. (2017) that PBAP
major contributor to OC, even in PM10 in summer (31 %) (or at least some types of PBAP) chars and evolves as mod-
and autumn (40 %). The PBAP factor even explained 16 % of ern carbon EC during thermal–optical analysis. If ECPBAP
fine OC (Fig. 8) annually, corresponding to 0.084 µg C m−3 , is indeed an analytical artefact, constraining the PBAP fac-
https://doi.org/10.5194/acp-21-7149-2021 Atmos. Chem. Phys., 21, 7149–7170, 2021You can also read