The Use of Cremation Data for Timely Mortality Surveillance During the COVID-19 Pandemic in Ontario, Canada: Validation Study - JMIR Public Health ...
←
→
Page content transcription
If your browser does not render page correctly, please read the page content below
JMIR PUBLIC HEALTH AND SURVEILLANCE                                                                                                             Postill et al

     Original Paper

     The Use of Cremation Data for Timely Mortality Surveillance
     During the COVID-19 Pandemic in Ontario, Canada: Validation
     Study

     Gemma Postill1,2,3, BMScH; Regan Murray2,4, BSc, MPH; Andrew S Wilton5, MSc; Richard A Wells2, MD, DPhil;
     Renee Sirbu2,3, BSc; Mark J Daley1, PhD; Laura Rosella3,5,6,7, HBSc, MHSc, PhD
     1
      Department of Epidemiology and Biostatistics, Western University, London, ON, Canada
     2
      Office of the Chief Coroner for Ontario, Toronto, ON, Canada
     3
      Epidemiology Division, Dalla Lana School of Public Health, Toronto, ON, Canada
     4
      Public Health Agency of Canada, Toronto, ON, Canada
     5
      Population and Public Health Research Program, Institute for Clinical and Evaluative Sciences, Toronto, ON, Canada
     6
      The Vector Institute for Artificial Intelligence, Toronto, ON, Canada
     7
      Institute for Better Health, Trillium Health Partners, Mississauga, ON, Canada

     Corresponding Author:
     Laura Rosella, HBSc, MHSc, PhD
     Epidemiology Division
     Dalla Lana School of Public Health
     155 College Street, Suite 600
     Toronto, ON, M5T 3M7
     Canada
     Phone: 1 416 978 0901
     Email: laura.rosella@utoronto.ca

     Abstract
     Background: Early estimates of excess mortality are crucial for understanding the impact of COVID-19. However, there is a
     lag of several months in the reporting of vital statistics mortality data for many jurisdictions, including across Canada. In Ontario,
     a Canadian province, certification by a coroner is required before cremation can occur, creating real-time mortality data that
     encompasses the majority of deaths within the province.
     Objective: This study aimed to validate the use of cremation data as a timely surveillance tool for all-cause mortality during a
     public health emergency in a jurisdiction with delays in vital statistics data. Specifically, this study aimed to validate this surveillance
     tool by determining the stability, timeliness, and robustness of its real-time estimation of all-cause mortality.
     Methods: Cremation records from January 2020 until April 2021 were compared to the historical records from 2017 to 2019,
     grouped according to week, age, sex, and whether COVID-19 was the cause of death. Cremation data were compared to Ontario’s
     provisional vital statistics mortality data released by Statistics Canada. The 2020 and 2021 records were then compared to previous
     years (2017-2019) to determine whether there was excess mortality within various age groups and whether deaths attributed to
     COVID-19 accounted for the entirety of the excess mortality.
     Results: Between 2017 and 2019, cremations were performed for 67.4% (95% CI 67.3%-67.5%) of deaths. The proportion of
     cremated deaths remained stable throughout 2020, even within age and sex categories. Cremation records are 99% complete
     within 3 weeks of the date of death, which precedes the compilation of vital statistics data by several months. Consequently,
     during the first wave (from April to June 2020), cremation records detected a 16.9% increase (95% CI 14.6%-19.3%) in all-cause
     mortality, a finding that was confirmed several months later with cremation data.
     Conclusions: The percentage of Ontarians cremated and the completion of cremation data several months before vital statistics
     did not change meaningfully during the COVID-19 pandemic period, establishing that the pandemic did not significantly alter
     cremation practices. Cremation data can be used to accurately estimate all-cause mortality in near real-time, particularly when
     real-time mortality estimates are needed to inform policy decisions for public health measures. The accuracy of this excess
     mortality estimation was confirmed by comparing it with official vital statistics data. These findings demonstrate the utility of
     cremation data as a complementary data source for timely mortality information during public health emergencies.

     https://publichealth.jmir.org/2022/2/e32426                                                    JMIR Public Health Surveill 2022 | vol. 8 | iss. 2 | e32426 | p. 1
                                                                                                                         (page number not for citation purposes)
XSL• FO
RenderX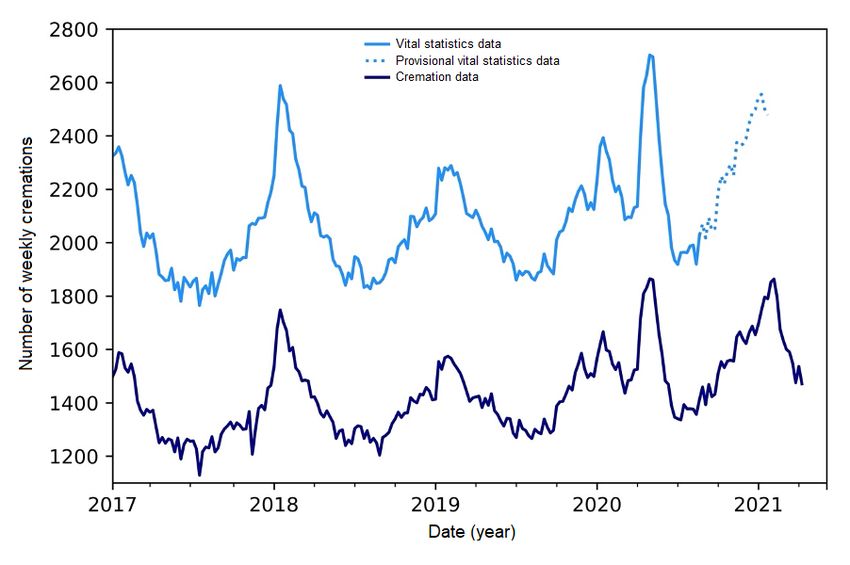
JMIR PUBLIC HEALTH AND SURVEILLANCE                                                                                                         Postill et al

     (JMIR Public Health Surveill 2022;8(2):e32426) doi: 10.2196/32426

     KEYWORDS
     excess deaths; real-time mortality; cremation; COVID-19; SARS-CoV-2; mortality; estimate; impact; public health; validation;
     pattern; trend; utility; Canada; mortality data; pandemic; death; cremation data; cause of death; vital statistics; excess mortality

                                                                             than the 3 operationalized here; however, this paper focuses on
     Introduction                                                            the aforementioned 3 components, given that they were
     Quantifying the impact of COVID-19 on all-cause mortality in            previously unknown and are key to validating the use of
     a timely manner is critical for understanding the full effect of        cremation data as a surveillance tool.
     the COVID-19 pandemic and for enabling evidence-based policy
     responses. While COVID-19 mortality in Ontario has been                 Methods
     routinely tracked and reported through public health databases
                                                                             In Ontario—Canada’s most populous province—a cremation
     in near real-time, the reporting of Canadian vital statistics
                                                                             certificate must be provided by a coroner to authorize the
     all-cause mortality data for Ontario, prior to the COVID-19
                                                                             cremation of a deceased person [13]. A licensed crematorium
     pandemic, was delayed by over a year [1]. Several challenges,
                                                                             operator cannot proceed without a cremation certificate. The
     including the need to centralize data, verify records, and
                                                                             law in Ontario requires that a coroner review the circumstances
     categorize causes of death, impede using vital statistics data for
                                                                             surrounding the death before cremation takes place [2,13]. The
     real-time mortality surveillance [2]. Despite efforts to accelerate
                                                                             certificate’s review and authorization are documented and kept
     mortality reporting in the COVID-19 pandemic, significant data
                                                                             on file at the crematorium [13]. Since 2017, these records have
     lags persist [3].
                                                                             been collected and stored electronically by the Office of the
     Cremation records, however, can be used to provide interim              Chief Coroner for Ontario. This database contains names, dates
     estimates of all-cause mortality [4,5]. This is because, before a       of birth and death, location of death, and cause of death for
     cremation can occur, a coroner’s certification is required. As a        every person cremated in the province.
     result, cremation data are available in real-time, offering a
                                                                             The Canadian Vital Statistics Death database, coordinated by
     consistent data source to examine mortality trends in a timelier
                                                                             Statistics Canada, collects demographic and cause of death
     manner. Early in the first wave (April to June 2020), cremation
                                                                             information from all Canadian provinces and territories [14].
     data detected an increase in all-cause mortality in Ontario,
                                                                             The cause of death is classified using the underlying cause of
     Canada [5]. These findings parallel the increases in mortality
                                                                             death according to the International Classification of Diseases
     observed by several other countries during the first wave of the
                                                                             10th revision (ICD-10) [14]. The deaths captured in the data set
     COVID-19 pandemic [6-10].
                                                                             comprise Canadian residents and nonresidents whose deaths
     Several months later, Statistics Canada published mortality data        occurred in Canada [14]. Routine data processes, including the
     that also demonstrated an increase in mortality in Ontario during       submission and centralization of death certificates, verification
     the first wave (April to June 2020) [11]. Despite the detection         of data, and coding of the cause of death, result in lags in the
     of excess mortality, few studies systematically examine the             publication of mortality information [14].
     performance of cremation data and specifically assess its utility
                                                                             All 323,988 cremations that occurred between January 1, 2017,
     as a real-time mortality surveillance tool. Lacking real-time
                                                                             and May 25, 2021 (with dates of death before April 30, 2021)
     mortality data posed a challenge for policy response since the
                                                                             were deidentified and maintained in an electronic database for
     magnitude of the mortality impact was unknown and thus
                                                                             the purpose of the analysis. The following analysis was done
     influenced mitigation strategies that were implemented. With
                                                                             using Python 3.8.0. A small number of records (n=74) had the
     official mortality statistics available for the first wave of the
                                                                             cause of death specified as “test” or age at death greater than
     COVID-19 pandemic, it is now possible to examine the extent
                                                                             120 years, as they were false data used to set up the data set in
     to which cremation data accurately estimated the increase in
                                                                             2017; these were identified and excluded from the analysis. The
     all-cause mortality. This knowledge will be critical in informing
                                                                             records were categorized according to the month of death and
     whether cremation data can be leveraged as a timelier source
                                                                             subcategorized by age and sex. Age is recorded as a numerical
     of mortality information. Therefore, the objective of this study
                                                                             field, but it was converted into a categorical vector (0-44 years,
     was to validate the use of cremation data as a surveillance tool
                                                                             45-64 years, 65-84 years, and 85+ years) for the purpose of this
     for all-cause mortality during a public health emergency in a
                                                                             analysis.
     jurisdiction with delays in vital statistics data. Specifically, this
     study aimed to validate cremation records by determining (1)            First, the utility of cremation data for surveillance was assessed
     the stability of the percent cremated (ie, whether the percent          by determining the percent cremated for the entire population
     cremated fluctuates by season and/or changes during the                 and then by age and sex (Multimedia Appendix 1). In order to
     pandemic), (2) the timeliness of cremation records, and (3) the         identify any seasonality in the proportion of death cremation,
     robustness/predictive ability of cremation records, measured            the percentage of deaths cremated was calculated for each week
     by their ability to provide accurate estimations of all-cause           and for the annual quarters over the time period of 2017 to 2021.
     mortality. The choice of such a measure aligns with the Centers         Standardized differences were used to assess the effect size of
     for Disease Control and Prevention’s guidelines for evaluating          any variability in the percent cremated, given that they are
     surveillance tools [12]. The framework includes more metrics            independent of sample size [15]. The standardized difference

     https://publichealth.jmir.org/2022/2/e32426                                                JMIR Public Health Surveill 2022 | vol. 8 | iss. 2 | e32426 | p. 2
                                                                                                                     (page number not for citation purposes)
XSL• FO
RenderX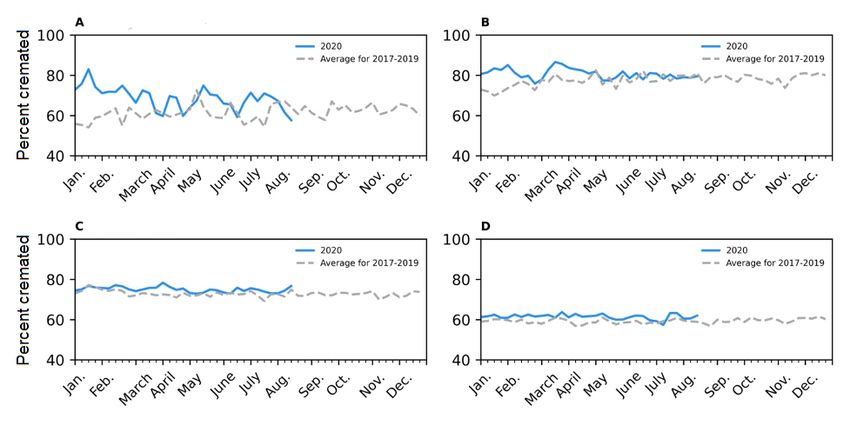
JMIR PUBLIC HEALTH AND SURVEILLANCE                                                                                                        Postill et al

     is the difference in the mean of a variable between 2 groups           the method of smoothing given that the data were demonstrated
     divided by an estimate of the standard deviation of that variable      to be nonstationary with the Augmented Dickey-Fuller test [18].
     [15]; relatively low values of the standardized difference show        The Statsmodel Holt package was used to exponentially smooth
     stability in the percent cremated.                                     the trends of all graphs (and all subsequent graphs created in
                                                                            the analysis), and the default additive model was changed to an
     Second, time lags in the completeness of cremation and vital
                                                                            exponential model with a fixed smoothing slope (=.2) and
     statistics data were assessed to determine the predictive value
                                                                            smoothing level (=.6) [18].
     of cremation data in estimating all-cause mortality. The data
     completion time lags were defined and calculated as the number         To assess whether confirmed COVID-19 deaths accounted for
     of weeks between the date of death and when the data source            the entirety of the increase in deaths, excess mortality was
     contained >95% or >99% of the deaths that occurred in that             calculated, for which COVID-19–classified deaths were
     week. Statistics Canada releases both provisional estimates of         removed from the cremation and vital statistics records. Deaths
     mortality and provisional counts of mortality; the latter was          due to COVID-19 were isolated from the records by the presence
     used in this study so that the analysis equivalents (ie, counts of     of the terms “COVID,” “novel coronavirus,” “Sars-CoV-2,”
     cremation records to counts of vital statistics records) and           and “coved-19” (a spelling typo) in the cause of death,
     findings could be generalizable to moments when there is               antecedent cause, and other causeof death categories of the
     uncertainty in a public health emergency’s effect on the               cremation records. Records that matched the above criteria but
     reporting of vital statistics data. The data lag for Ontario’s vital   also contained the phrases “test results pending,” “possible,”
     statistics death data was assessed by comparing the provincial         “not,” “non,” or “negative” were excluded from the
     mortality reports released monthly by Statistics Canada [11]           classification of death due to COVID-19.
     between July 24, 2020, and May 14, 2021, as seen in Multimedia
                                                                            A database containing cremation certificates is held at the Office
     Appendix 2. The percentage of the weekly mortality captured
                                                                            of Chief Coroner for Ontario. The data-sharing agreement for
     in each release was calculated using the weekly totals in the
                                                                            this study prohibits the data from being publicly available. Data
     May 14, 2021, release as the denominator. The average time
                                                                            requests may be granted provided there is an appropriate
     lags for both 95% and 99% completeness were calculated. The
                                                                            data-sharing agreement in place.
     same method was applied to the weekly totals of the weekly
     data cuts of cremation data between May 1, 2020, and October           Ethics Approval
     23, 2020, which were compared to the total number of deaths            This study was approved by the Research Ethics Board of
     during that time as available in May 2021.                             Western University (project ID: 112478).
     Third, to assess the predictive ability of cremation records,
     deviations from provincial mortality trends were quantified and        Results
     compared both quantitatively and qualitatively to the available
     vital statistics data [3]. Excess mortality was defined and            Since the cremation records became electronic (in 2017) and
     calculated as the population standardized percentage increase          prior to the COVID-19 pandemic, the majority of Ontarians
     in the number of cremations, which was calculated using risk           were cremated upon death, with 67.4% (95% CI 67.3%-67.5%)
     ratios (RRs) (percent increase = RR – 1), where the risk was           of Ontarians being cremated following death (Figure 1). There
     cremation within the population of Ontario. Cremation records          is no seasonality in the percent cremated, with the percent
     during 2020 and the first half of 2021 were compared to                cremated remaining stable throughout the year. Thus, Ontario’s
     historical records from 2017 to 2019, grouped according to the         cremation data can capture patterns in all-cause mortality
     month of death, and the age and sex of the decedent.                   between 2017 and 2019, as evidenced in Figure 1. The percent
                                                                            cremated does not differ by sex (Multimedia Appendix 1).
     Cremation rates, analogous to mortality rates, were calculated         However, there are slight differences by age. The percent
     using Statistics Canada’s quarterly population estimates [3,16].       cremated is the greatest for those aged 45-64 years and 65-84
     Both absolute differences and relative differences (estimated          years, with approximately 75%-80% and 70%-75%,
     using rate ratios), as compared to historical data, were               respectively, being cremated (Figure 2). The percent cremated
     calculated. The quarterly incident rate ratio was calculated to        for those aged 0-44 years and 85 years or over is approximately
     determine whether the cremation rate changed significantly             60%.
     during the COVID-19 pandemic relative to previous years
     [3,16,17]. Following the release of vital statistics data, the same    The percentage of the population cremated remained stable
     methodology of calculating excess mortality in cremation data          during the COVID-19 pandemic, as seen in Table 1 and Figure
     was applied to the data.                                               2. Stability was evident in the standardized difference
                                                                            calculations that compared the COVID-19 period to the
     The weekly number of cremations and vital statistics deaths [3]        historical period and obtained a value less than 10% difference.
     were plotted on side-by-side graphs with 2020-2021 data and            Stability in the percent cremated was also observed within each
     baseline data (2017-2019). While the trends were initially             age group studied (0-44 years, 45-64 years, 65-84 years, and
     congruent, exponential smoothing was used to reduce some of            85 years or over), as seen in Figure 2 and Multimedia Appendix
     the noise (weekly variability) so that the trends were more            1.
     comparable; exponential smoothing was specifically chosen as

     https://publichealth.jmir.org/2022/2/e32426                                               JMIR Public Health Surveill 2022 | vol. 8 | iss. 2 | e32426 | p. 3
                                                                                                                    (page number not for citation purposes)
XSL• FO
RenderX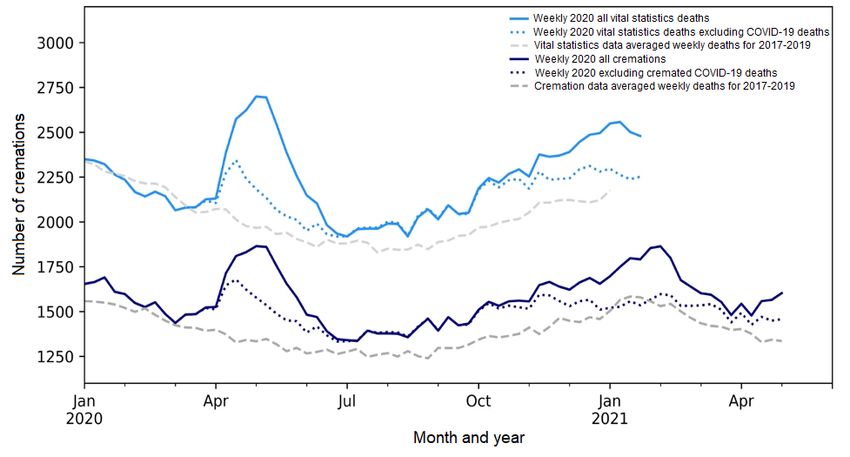
JMIR PUBLIC HEALTH AND SURVEILLANCE                                                                                                                Postill et al

     Figure 1. The weekly number of deaths in Ontario, Canada, as reported in Ontario’s cremation records (January 2017 to April 2021, considered >99%
     complete) and vital statistics records (January 2017 to December 2020, released May 2021). Given that vital statistics records from mid-August (August
     16, 2020) and onwards are
JMIR PUBLIC HEALTH AND SURVEILLANCE Postill et al
Table 1. Stability in the percentage of Ontarians cremated, 2017-2020.
Variable January to Marcha April to Junea July to Septembera October to January to
a December
December
Number of deaths, n
Baseline (2017-2019)b
Cremation records 19,045 17,146 16,884 18,568 71,644
Vital statistics recordsc 28,540 25,443 24,947 27,405 106,335
2020
Cremation records 20,032 20,737 18,776 21,209 80,754
Vital statistics recordsc 28,675 29,750 N/Ad N/A N/A
Percent cremated (%), value (95% CI)e
2017-2019 66.7 (66.4-67.0) 67.4 (67.1-67.7) 67.7 (67.4-68.0) 67.8 (67.5-68.1) 67.4 (67.3-67.5)
2020 69.9 (69.6-70.2) 69.7 (69.4-70.0) N/A N/A N/A
Standardized differences 6.88% 4.96% N/A N/A N/A
a
For 2020, January to March was the prepandemic period, April to June was the first wave of the pandemic, July to September was summer, and October
to December was the second wave of the pandemic.
b
The average number of deaths in 2017, 2018, and 2019 during the same time period.
c
The number of deaths in Ontario as reported by Statistics Canada in May 2021; at this time, Statistics Canada considers these numbers complete up to
the end of July 2020 [3].
d
N/A: not applicable.
e
The 95% CI is calculated using the standard error for population proportions.
In addition, cremation data also provide a timelier source of increase (95% CI −0.3% to 3.7%; n=+987) seen in January to
mortality information, given that cremation records are available March of 2020 (Table 2). Using the provisional vital statics data
much sooner than vital statistics mortality records (Multimedia released by Statistics Canada [11] and the same methodology
Appendix 2). On average, cremation records are >95% complete for calculating excess mortality that was used for cremation
within 1 week of the date of death and >99% complete within data, there was a 13.1% increase (95% CI 11.2%-15.0%;
3 weeks. In contrast, the vital statistics data had an average n=+4307) in mortality during the first wave (April to June 2020).
delay of 27 weeks (range 23-31 weeks) for reporting 95%
Cremation data even captured the trends in excess mortality at
completeness and a 39-week delay for 99% completeness (range
an age-specific level. When broken down by age, excess
34-43) (Multimedia Appendix 2). Thus, the vital statistics data
mortality during the first wave (April to June 2020) was
published by Statistics Canada for August 2020 and onwards
observed among all age groups in both the cremation and vital
isJMIR PUBLIC HEALTH AND SURVEILLANCE Postill et al
Table 2. Magnitude of excess mortality in Ontario, Canada identified with Ontario’s cremation records during the COVID-19 pandemic, January 2020
to March 2021.
Variable January to April to Junea July to Septem- October to Decembera January to December
a a
March ber
Baseline (2017-2019)b
Number of cremations 19,045 17,146 16,884 18,568 71,644
Rate of cremations per 100,000, 134 (132 to 136) 120 (119 to 122) 118 (116 to 120) 129 (127 to 131) 501 (497 to 504)
value (95% CI)c
2020
Number of cremations 20,032 20,737 18,776 21,209 80,754
Absolute change in the number of 987 3591 1892 2641 9110
cremationsd
Population standardized percent- 1.7 (−0.3 to 3.7) 16.9 (14.6 to 8.0 (5.8 to 10.3) 11.6 (9.4 to 13.8) 12.7 (8.4 to 10.6)
age increase (%)e, value (95% CI)f 19.3)
Rate of cremations per 100,000, 136 (134 to 138) 140 (139 to 143) 127 (126 to 129) 144 (142 to 146) 548 (544 to 552)
value (95% CI)c
Incident rate ratiog, value (95% 1.02 (1.00 to 1.17 (1.15 to 1.08 (1.06 to 1.12 (1.09 to 1.14) 1.09 (1.08 to 1.11)
CI) 1.04) 1.19) 1.10)
2021
Number of cremations 21,418 N/Ah N/A N/A N/A
Absolute change in the number of 2373 N/A N/A N/A N/A
cremationsd
Population standardized percent- 8.2 (6.1 to 10.3) N/A N/A N/A N/A
age increase (%)e, value (95% CI)f
Rate of cremations per 100,000, 145 (143 to 147) N/A N/A N/A N/A
value (95% CI)c
Incident rate ratiog, value (95% 1.08 (1.06 to N/A N/A N/A N/A
CI) 1.10)
a
For 2020, January to March was the prepandemic period, April to June was the first wave of the pandemic, July to September was summer, and October
to December was the second wave of the pandemic. For 2021, January to March and April to June involved the third wave.
b
The average of the number of deaths in 2017, 2018, and 2019 during the same time period.
c
Cremation rates, analogous to mortality rates, were calculated as the number of cremations divided by the provincial quarterly population estimates
published by Statistics Canada [16].
d
Absolute change refers to the difference in the number between 2020/2021 and the baseline (2017-2019).
e
The population standardized percentage increase is calculated as risk ratio (RR) − 1, where RR is the incidence of death (measured as the number of
cremation) in the quarterly population estimates. The Q3 population estimate was used for the January-December RR.
f
The 95% CI for the percentage increase is calculated as (RR lower bound − 1) × 100% to (RR upper bound + 1) × 100%. The RR CI is calculated as
=EXP(LN(RR) − (1.96 × SE)), with SE(lm(rr)) = sqrt(1/Ncrem(2017-19) − 1/Npop(2017-19) + 1/Ncrem(2020) − 1/Npop(2020)).
g
The quarterly incident rate ratio was calculated by dividing the rate of cremations in 2020 to that of the baseline. The 95% CI was calculated as =(Events
± 1.96 × SE) / population × 100,000, where SE is the standard error equal to the square root of the number of cremations [17].
h
N/A: not applicable.
https://publichealth.jmir.org/2022/2/e32426 JMIR Public Health Surveill 2022 | vol. 8 | iss. 2 | e32426 | p. 6
(page number not for citation purposes)
XSL• FO
RenderXJMIR PUBLIC HEALTH AND SURVEILLANCE Postill et al
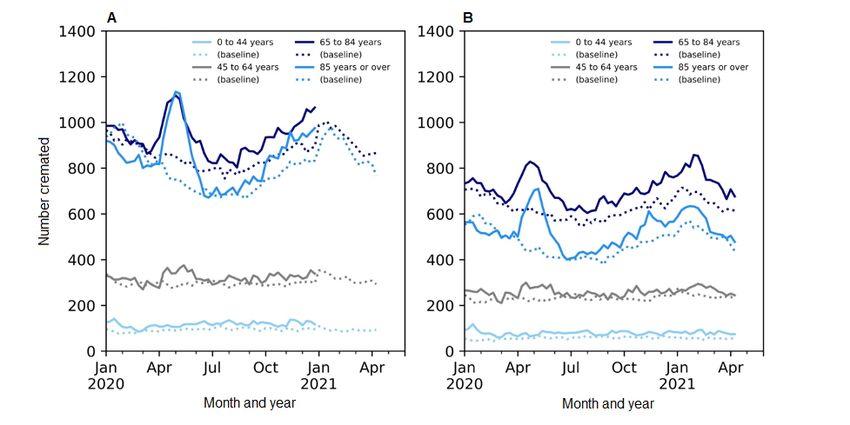
Figure 3. Side-by-side comparison of the weekly number of deaths in Ontario, Canada during the pandemic by age group as reported in (A) vital
statistics data, which contains all provincial deaths and is released by Statistics Canada [3], and (B) Ontario’s cremation data for January 2020 to April
2021, which refers to the baseline data (the average of data in 2017-2019). The annual trends have been smoothed using the Statsmodel Holt package;
the default additive model has been changed to an exponential model with a fixed smoothing slope (β=.2) and smoothing level (α=.6).
Most recently, in the latter half of 2020 (the second wave) and Beyond simply highlighting excess mortality, cremation data
the beginning of 2021 (the third wave), there was still significant demonstrated that, as early as June 2020, deaths due to
excess mortality (Table 2). Specifically, after adjusting for COVID-19 could not explain all of the excess mortality observed
population, there was an 8.0% increase (95% CI 5.8%-10.3%) during the pandemic (Figure 4; Multimedia Appendix 3). With
in mortality in the summer months (July to September 2020), vital statistics data available for the first wave, it is clear that
a 11.6% increase (95% CI 9.4%-13.8%) in the fall (October to cremation data accurately estimated the magnitude of excess
December 2020), and a 9.5% increase (95% CI 8.4%-10.6%) non–COVID-19 mortality (Figure 4).
during January to March 2021, relative to the same period for
During the period from March 23, 2020, to July 5, 2020,
previous years. During this time, the absolute unadjusted excess
cremation data captured 55.6% (1638/2945) of the provincially
mortality among those aged 0-44 years accounted for a greater
reported COVID-19 deaths, which is consistent with the percent
percentage of the overall excess mortality (22%-27% of the
cremated among those aged 85 years or older (the age group
excess) than in the first wave (20% of the absolute unadjusted
with the majority of COVID-19 deaths during this time). When
excess). In fact, unlike any other age group, excess mortality
these COVID-19 deaths were removed, there was still significant
for those aged 0-44 years in the COVID-19 pandemic was the
excess mortality during the last 3 quarters of 2020. Specifically,
greatest in early 2021 (January to March). In contrast, during
there was a 7.9% (95% CI 5.7%-10.1%) increase in April to
this time (January to March 2021), excess mortality for those
June 2020, 7.5% (95% CI 5.3%-7.8%) increase in July to August
aged 85 years or older was lower than at any other time in the
2020, and 5.9% (95% CI 3.9%-8.1%) increase in September to
COVID-19 pandemic (Table 2).
December 2020. Elevated non–COVID-19 mortality was not
detected in the first quarter of 2021 (Multimedia Appendix 3).
https://publichealth.jmir.org/2022/2/e32426 JMIR Public Health Surveill 2022 | vol. 8 | iss. 2 | e32426 | p. 7
(page number not for citation purposes)
XSL• FO
RenderXJMIR PUBLIC HEALTH AND SURVEILLANCE Postill et al
Figure 4. Annual trends of the weekly number of deaths with and without confirmed COVID-19 deaths for the cremation records and vital statistics
data for Ontario, Canada (released May 2021). The pandemic waves in Ontario, Canada captured in this graph are as follows: wave 1 (April 2020 to
June 2020), wave 2 (September 2020 to February 2021), and wave 3 (April 2021 onwards). Both trends have been smoothed using an exponential model
with a fixed smoothing slope (β=.2) and smoothing level (α=.6).
cremations could not account for all of this excess. Excess
Discussion mortality due to COVID-19 has been demonstrated in several
Real-time mortality information is an essential indicator to countries, including the United States [19-21], Portugal [9],
monitor during the COVID-19 pandemic. Many jurisdictions Sweden [22], England [23], and many others [6-8,10,24,25].
experience delays in official vital statistics data due to While overall excess mortality (identified by this study) during
verification processes, and as a result, it can be difficult to obtain the first wave in Canada (April to June 2020) is lower than in
timely mortality information. This study aimed to provide some countries, such as Spain [8] and England [23], it is
evidence of the utility of cremation data as an early indicator substantially higher than in other industrialized countries,
of mortality trends during the COVID-19 pandemic. Within 3 including Germany [26], Sweden [22], and Norway. The age
weeks, cremation data captured approximately 70% of overall structure of excess mortality that we report here is similar to
mortality, anticipating vital statistics mortality records by that found by the European monitoring of excess mortality for
approximately 5 months. Timeliness was of critical value given public health action (EuroMOMO) network, with the majority
that during this time, several public health measures and policies of the excess occurring in older age groups [7]. Other provinces
related to the pandemic response were being decided in the in Canada, such as Alberta and British Colombia, also detected
absence of mortality data in many jurisdictions, including in a similar magnitude of excess mortality in 2020 [11,27].
Canada, where official vital statistics reports lag by several Consequently, cremation data can provide an understanding of
months. the most recent mortality trends (the fourth and fifth waves),
for which vital statistics data are still provisional.
Additionally, this analysis demonstrated that the percentage of
the population cremated remained stable during the COVID-19 In addition, our results confirming that COVID-19 deaths did
pandemic. This was a key finding given that, at the start of the not account for the entirety of the excess mortality in Ontario
pandemic, there was a concern as to whether a shift in burial are supported by similar findings in several other countries [8,9].
practices drove the increase in cremations. This was, in fact, Excess mortality that cannot be accounted for by confirmed
not the case and aligned with the fact that there was no change COVID-19 is attributable to several factors, and these factors
in the guidance of embalming. These findings provide further likely changed throughout the pandemic, reflecting the various
confidence for the use of cremation data to obtain a robust and patterns seen in Figure 4. The initial large increase in
real-time estimate of mortality during public health emergencies non–SARS-CoV-2 mortality during March to April 2020 was
in jurisdictions where the death investigation system is equipped likely due to underdiagnosis and underreporting of COVID-19
with digital reporting tools. on death certificates, delays in care for conditions other than
COVID-19, including cancer and cardiovascular care, worsening
In demonstrating the ability of cremation data to capture mental health and substance use, and hesitancy or fear that
population-level mortality trends, the analysis captured excess deterred patients from seeking emergency care for cardiac
mortality, that is, mortality beyond what is normally anticipated events, all of which have been observed as causes of
relative to the average of the 3 prior years. COVID-19 non–COVID-19 excess in other jurisdictions [28-35]. The
https://publichealth.jmir.org/2022/2/e32426 JMIR Public Health Surveill 2022 | vol. 8 | iss. 2 | e32426 | p. 8
(page number not for citation purposes)
XSL• FO
RenderXJMIR PUBLIC HEALTH AND SURVEILLANCE Postill et al
decline in emergency care-seeking is supported by data showing it is not possible to conclude whether COVID-19 affected the
that Canadian emergency department volumes dropped during likelihood of being cremated. However, we found no evidence
the first wave of the COVID-19 pandemic [17,36]. Subsequent of this, given that there was no relationship between the cause
excess mortality, when COVID-19 testing was more widely of death and the likelihood of cremation. The next steps of this
employed, is likely due to the indirect effects of the pandemic, research include determining the methodology for using
including acute drug toxicity, violence, and the economic and cremation data to assess the effect of the COVID-19 pandemic
social disruptions of the pandemic [30,32,37]. Specifically, in on other specific causes (ie, cardiac events) and manners (ie,
Ontario, opioid-related deaths have increased by 79%, with the suicide) of death. Finally, it is important to note that while
majority of these deaths occurring among those aged 25-44 cremation data represent most deaths in Ontario, they do not
years [37]. These increases in all-cause mortality highlight the represent all deaths. Certain segments of the population may
value and necessity of real-time surveillance of population have an intrinsically higher or lower cremation rate (ie, people
mortality rates, especially during public health emergencies. of Jewish faith). This is an important consideration, and if some
Given their robust and real-time nature, cremation data offer a segments of the population have different rates of cremation
critical source of mortality data that can provide these insights and different rates of mortality, the estimates would be biased.
in the interim period before vital statistics data are available. However, this is not an invalidating limitation for a surveillance
model. Likewise, owing to the structure of the cremation data
An important limitation of the study is the assumption of
set (ie, absence of ethnic data), we were unable to assess whether
minimal growth in the population cremated. The quantifications
the magnitude of excess mortality differed among different
of excess should be interpreted with these limitations in mind,
subgroups of the population. Despite these limitations, the
particularly given that they contribute to the discrepancies in
results compellingly demonstrate the utility of cremation data
the reported values of excess mortality following the release of
as an important surveillance data source when timelier estimates
provisional vital statistics mortality data by Statistics Canada
of mortality are needed, such as during a public health
after several months, using the Farrington method. However,
emergency. The purpose of this analysis was to demonstrate
small discrepancies in the magnitude of excess mortality
cremation data as a robust estimator of all-cause mortality in
reported do not invalidate the use of cremation data, given that
public health emergencies in the interim of vital statistics
the value of a surveillance tool is in its ability to be both timely
reporting, and not as a replacement of vital statistics data or as
and accurate, and cremation data display strong congruency to
a predictor of a pandemic’s effects on subpopulation mortality.
vital statistics data, as seen in Figure 4. Likewise, with other
data sources that can be used to create robust modes, the long In conclusion, the COVID-19 pandemic emphasized the
reporting delays introduce significant biases. Thus, the importance and need for real-time mortality information.
methodology that is employed and able to communicate these Cremation data can be used for monitoring all-cause mortality
results in a timely manner clearly shows the value in using in conjunction with vital statistics data. In addition, other
Ontario’s cremation records to provide the earliest indication jurisdictions with a lack of real-time mortality surveillance and
of excess all-cause mortality in a region with delays in vital high cremation rates will likely benefit from leveraging
statistics reporting. cremation data to estimate the complete impact of a public health
emergency on all-cause mortality. This is an important finding,
There are some additional limitations to this analysis that should
given that the utility of cremation data to estimate all-cause
be considered. First, there was no advice against embalming
mortality in a public health emergency was previously unknown.
during the COVID-19 pandemic; thus, in a public health
This study demonstrates that cremation records can provide
emergency wherein embalming may be advised against, the
robust and timely indicators of all-cause mortality and should
utility of cremation data would need to be further investigated.
be used as interim mortality data during a public health
Second, this study looked at all-cause mortality, and therefore,
emergency where more timely data can support the response.
Acknowledgments
LR receives funding from the Canadian Institutes of Health Research and the Canada Research Chairs Program. MJD is the
SHARCNET Research Chair in biocomputing. The authors acknowledge Dr Dirk Huyer, Chief Coroner for Ontario for the vision
and support to analyze cremation certificates as a timely source of mortality data.
Authors' Contributions
All authors contributed to the conception and design of the work; acquisition, analysis, and interpretation of data; and drafting
the work and revising it critically. RM developed the concept for the study and coordinated the collaboration. GP conducted all
analyses. GP and MJD had access to the data. All authors gave final approval to the version to be published and agreed to be held
accountable for all aspects of the work.
Conflicts of Interest
LR serves on the steering committee of the CDL-Rapid Screening Consortium, a government-funded not-for-profit endeavor to
build a scalable workplace COVID screening system in workplaces. The other authors have no conflicts.
https://publichealth.jmir.org/2022/2/e32426 JMIR Public Health Surveill 2022 | vol. 8 | iss. 2 | e32426 | p. 9
(page number not for citation purposes)
XSL• FO
RenderXJMIR PUBLIC HEALTH AND SURVEILLANCE Postill et al
Multimedia Appendix 1
Further analysis on the percent cremated by age and sex.
[DOCX File , 41 KB-Multimedia Appendix 1]
Multimedia Appendix 2
Maturation of both cremation data and vital statistics data.
[XLSX File (Microsoft Excel File), 46 KB-Multimedia Appendix 2]
Multimedia Appendix 3
Calculations for non–COVID-19 excess.
[DOCX File , 17 KB-Multimedia Appendix 3]
References
1. Mortality rates, by age group. Statistics Canada. URL: https://www150.statcan.gc.ca/t1/tbl1/en/tv.action?pid=1310071001
[accessed 2022-02-01]
2. Vital Statistics Act, R.S.O. 1990. Government of Ontario. URL: https://www.ontario.ca/laws/statute/90v04 [accessed
2022-02-01]
3. Provisional weekly death counts, by age group and sex. Statistics Canada. URL: https://www150.statcan.gc.ca/t1/tbl1/en/
tv.action?pid=1310076801 [accessed 2022-02-01]
4. Postill G, Murray R, Wilton A, Wells R, Sirbu R, Daley M, et al. Excess Mortality in Ontario During the COVID-19
Pandemic. Ontario COVID-19 Science Advisory Table. URL: https://covid19-sciencetable.ca/sciencebrief/
excess-mortality-in-ontario-during-the-covid-19-pandemic/ [accessed 2022-02-01]
5. Postill G, Murray R, Wilton A, Wells R, Sirbu R, Daley M, et al. An analysis of mortality in Ontario using cremation data:
Rise in cremations during the COVID-19 pandemic. medRxiv. URL: https://www.medrxiv.org/content/10.1101/2020.07.
22.20159913v3 [accessed 2022-02-01]
6. Docherty K, Butt J, de Boer R, Dewan P, Køber L, Maggioni A, et al. Excess deaths during the Covid-19 pandemic: An
international comparison. medRxiv. URL: https://www.medrxiv.org/content/10.1101/2020.04.21.20073114v3 [accessed
2022-02-01]
7. Vestergaard L, Nielsen J, Richter L, Schmid D, Bustos N, Braeye T, ECDC Public Health Emergency Team for COVID-19,
et al. Excess all-cause mortality during the COVID-19 pandemic in Europe - preliminary pooled estimates from the
EuroMOMO network, March to April 2020. Euro Surveill 2020 Jul;25(26):2 [FREE Full text] [doi:
10.2807/1560-7917.ES.2020.25.26.2001214] [Medline: 32643601]
8. Measuring the direct and indirect impact of COVID-19. OECD iLibrary. URL: https://www.oecd-ilibrary.org/
social-issues-migration-health/excess-mortality_c5dc0c50-en [accessed 2022-02-01]
9. Vieira A, Peixoto VR, Aguiar P, Abrantes A. Rapid Estimation of Excess Mortality during the COVID-19 Pandemic in
Portugal -Beyond Reported Deaths. J Epidemiol Glob Health 2020 Sep;10(3):209-213 [FREE Full text] [doi:
10.2991/jegh.k.200628.001] [Medline: 32954711]
10. Karlinsky A, Kobak D. The World Mortality Dataset: Tracking excess mortality across countries during the COVID-19
pandemic. medRxiv. URL: https://www.medrxiv.org/content/10.1101/2021.01.27.21250604v3 [accessed 2022-02-01]
11. Previous releases and revisions to provisional weekly death counts. Statistics Canada. URL: https://www150.statcan.gc.ca/
n1/en/catalogue/13100783 [accessed 2022-02-01]
12. German RR, Lee LM, Horan JM, Milstein RL, Pertowski CA, Waller MN, Guidelines Working Group Centers for Disease
ControlPrevention (CDC). Updated guidelines for evaluating public health surveillance systems: recommendations from
the Guidelines Working Group. MMWR Recomm Rep 2001 Jul 27;50(RR-13):1-35; quiz CE1. [Medline: 18634202]
13. Request a certificate to cremate a body or ship a body out of province. Government of Ontario. URL: https://www.ontario.ca/
page/request-certificate-cremate-body-or-ship-body-out-province [accessed 2022-02-01]
14. Statistics Canada, Canadian Vital Statistics - Death database (CVSD). Statistics Canada. URL: https://www23.statcan.gc.ca/
imdb/p2SV.pl?Function=getSurvey&SDDS=3233 [accessed 2022-02-01]
15. Austin PC. Using the Standardized Difference to Compare the Prevalence of a Binary Variable Between Two Groups in
Observational Research. Communications in Statistics - Simulation and Computation 2009 Apr 09;38(6):1228-1234. [doi:
10.1080/03610910902859574]
16. Population estimates, quarterly. Statistics Canada. URL: https://www150.statcan.gc.ca/t1/tbl1/en/tv.action?pid=1710000901
[accessed 2022-02-01]
17. Gomez D, Simpson AN, Sue-Chue-Lam C, de Mestral C, Dossa F, Nantais J, et al. A population-based analysis of the
impact of the COVID-19 pandemic on common abdominal and gynecological emergency department visits. CMAJ 2021
May 25;193(21):E753-E760 [FREE Full text] [doi: 10.1503/cmaj.202821] [Medline: 34035055]
18. Statsmodels. URL: https://www.statsmodels.org/stable/generated/statsmodels.tsa.holtwinters.Holt.html [accessed 2022-02-01]
https://publichealth.jmir.org/2022/2/e32426 JMIR Public Health Surveill 2022 | vol. 8 | iss. 2 | e32426 | p. 10
(page number not for citation purposes)
XSL• FO
RenderXJMIR PUBLIC HEALTH AND SURVEILLANCE Postill et al
19. New York City Department of Health Mental Hygiene (DOHMH) COVID-19 Response Team. Preliminary Estimate of
Excess Mortality During the COVID-19 Outbreak - New York City, March 11-May 2, 2020. MMWR Morb Mortal Wkly
Rep 2020 May 15;69(19):603-605 [FREE Full text] [doi: 10.15585/mmwr.mm6919e5] [Medline: 32407306]
20. Rivera R, Rosenbaum JE, Quispe W. Excess mortality in the United States during the first three months of the COVID-19
pandemic. Epidemiol. Infect 2020 Oct 29;148:e264. [doi: 10.1017/s0950268820002617]
21. Woolf SH, Chapman DA, Sabo RT, Zimmerman EB. Excess Deaths From COVID-19 and Other Causes in the US, March
1, 2020, to January 2, 2021. JAMA 2021 Apr 02;325(17):1786 [FREE Full text] [doi: 10.1001/jama.2021.5199] [Medline:
33797550]
22. Modig K, Ahlbom A, Ebeling M. Excess mortality from COVID-19: weekly excess death rates by age and sex for Sweden
and its most affected region. Eur J Public Health 2021 Feb 01;31(1):17-22 [FREE Full text] [doi: 10.1093/eurpub/ckaa218]
[Medline: 33169145]
23. Sinnathamby M, Whitaker H, Coughlan L, Lopez Bernal J, Ramsay M, Andrews N. All-cause excess mortality observed
by age group and regions in the first wave of the COVID-19 pandemic in England. Euro Surveill 2020 Jul;25(28):16 [FREE
Full text] [doi: 10.2807/1560-7917.ES.2020.25.28.2001239] [Medline: 32700669]
24. Ghislandi S, Muttarak R, Sauerberg M, Scotti B. News from the front: Estimation of excess mortality and life expectancy
in the major epicenters of the COVID-19 pandemic in Italy. medRxiv. URL: https://www.medrxiv.org/content/10.1101/
2020.04.29.20084335v3 [accessed 2022-02-01]
25. Kontis V, Bennett JE, Rashid T, Parks RM, Pearson-Stuttard J, Guillot M, et al. Magnitude, demographics and dynamics
of the effect of the first wave of the COVID-19 pandemic on all-cause mortality in 21 industrialized countries. Nat Med
2020 Dec 14;26(12):1919-1928. [doi: 10.1038/s41591-020-1112-0] [Medline: 33057181]
26. Stang A, Standl F, Kowall B, Brune B, Böttcher J, Brinkmann M, et al. Excess mortality due to COVID-19 in Germany. J
Infect 2020 Nov;81(5):797-801 [FREE Full text] [doi: 10.1016/j.jinf.2020.09.012] [Medline: 32956730]
27. Moriarty T, Boczula A, Thind E, Loreto N, McElhaney J. Excess All-Cause Mortality During the COVID-19 Epidemic in
Canada. Royal Society of Canada. URL: https://rsc-src.ca/sites/default/files/EM%20PB_EN.pdf [accessed 2022-02-01]
28. Dinmohamed AG, Visser O, Verhoeven RHA, Louwman MWJ, van Nederveen FH, Willems SM, et al. Fewer cancer
diagnoses during the COVID-19 epidemic in the Netherlands. The Lancet Oncology 2020 Jun;21(6):750-751 [FREE Full
text] [doi: 10.1016/S1470-2045(20)30265-5] [Medline: 32359403]
29. Rosenbaum L. The Untold Toll — The Pandemic’s Effects on Patients without Covid-19. N Engl J Med 2020 Jun
11;382(24):2368-2371. [doi: 10.1056/nejmms2009984]
30. Baumgartner J, Radley D. The Spike in Drug Overdose Deaths During the COVID-19 Pandemic and Policy Options to
Move Forward. Commonwealth Fund. URL: https://www.commonwealthfund.org/blog/2021/
spike-drug-overdose-deaths-during-covid-19-pandemic-and-policy-options-move-forward [accessed 2022-02-01]
31. Appleby L, Kapur N, Turnbull P, Richards N. Suicide in England since the COVID-19 pandemic - early figures from
real-time surveillance. The University of Manchester. URL: https://documents.manchester.ac.uk/display.aspx?DocID=51861
[accessed 2022-02-01]
32. Gunnell D, Appleby L, Arensman E, Hawton K, John A, Kapur N, et al. Suicide risk and prevention during the COVID-19
pandemic. The Lancet Psychiatry 2020 Jun;7(6):468-471. [doi: 10.1016/s2215-0366(20)30171-1]
33. Hammad TA, Parikh M, Tashtish N, Lowry CM, Gorbey D, Forouzandeh F, et al. Impact of COVID-19 pandemic on
ST-elevation myocardial infarction in a non-COVID-19 epicenter. Catheter Cardiovasc Interv 2021 Feb 01;97(2):208-214
[FREE Full text] [doi: 10.1002/ccd.28997] [Medline: 32478961]
34. Rattka M, Baumhardt M, Dreyhaupt J, Rothenbacher D, Thiessen K, Markovic S, et al. 31 days of COVID-19-cardiac
events during restriction of public life-a comparative study. Clin Res Cardiol 2020 Dec 03;109(12):1476-1482 [FREE Full
text] [doi: 10.1007/s00392-020-01681-2] [Medline: 32494921]
35. Clifford CR, Le May M, Chow A, Boudreau R, Fu AY, Barry Q, et al. Delays in ST-Elevation Myocardial Infarction Care
During the COVID-19 Lockdown: An Observational Study. CJC Open 2020 Dec 15;3(5):565-573 [FREE Full text] [doi:
10.1016/j.cjco.2020.12.009] [Medline: 33521615]
36. COVID-19’s impact on emergency departments. Canadian Institute for Health Information. URL: https://www.cihi.ca/en/
covid-19-resources/impact-of-covid-19-on-canadas-health-care-systems/how-covid-19-affected [accessed 2022-02-01]
37. Gomes T, Murray R, Kolla G, Leece P, Bansal S, Besharah J, et al. Changing Circumstances Surrounding Opioid-Related
Deaths in Ontario during the COVID-19 Pandemic. The Ontario Drug Policy Research Network. URL: https://odprn.ca/
wp-content/uploads/2021/05/Changing-Circumstances-Surrounding-Opioid-Related-Deaths.pdf [accessed 2022-02-01]
Abbreviations
RR: risk ratio
https://publichealth.jmir.org/2022/2/e32426 JMIR Public Health Surveill 2022 | vol. 8 | iss. 2 | e32426 | p. 11
(page number not for citation purposes)
XSL• FO
RenderXJMIR PUBLIC HEALTH AND SURVEILLANCE Postill et al
Edited by T Sanchez, G Eysenbach; submitted 27.07.21; peer-reviewed by T Kosatsky, P Dion; comments to author 14.12.21; revised
version received 02.01.22; accepted 06.01.22; published 21.02.22
Please cite as:
Postill G, Murray R, Wilton AS, Wells RA, Sirbu R, Daley MJ, Rosella L
The Use of Cremation Data for Timely Mortality Surveillance During the COVID-19 Pandemic in Ontario, Canada: Validation Study
JMIR Public Health Surveill 2022;8(2):e32426
URL: https://publichealth.jmir.org/2022/2/e32426
doi: 10.2196/32426
PMID: 35038302
©Gemma Postill, Regan Murray, Andrew S Wilton, Richard A Wells, Renee Sirbu, Mark J Daley, Laura Rosella. Originally
published in JMIR Public Health and Surveillance (https://publichealth.jmir.org), 21.02.2022. This is an open-access article
distributed under the terms of the Creative Commons Attribution License (https://creativecommons.org/licenses/by/4.0/), which
permits unrestricted use, distribution, and reproduction in any medium, provided the original work, first published in JMIR Public
Health and Surveillance, is properly cited. The complete bibliographic information, a link to the original publication on
https://publichealth.jmir.org, as well as this copyright and license information must be included.
https://publichealth.jmir.org/2022/2/e32426 JMIR Public Health Surveill 2022 | vol. 8 | iss. 2 | e32426 | p. 12
(page number not for citation purposes)
XSL• FO
RenderXYou can also read