Tumor stiffening reversion through collagen crosslinking inhibition improves T cell migration and anti-PD-1 treatment
←
→
Page content transcription
If your browser does not render page correctly, please read the page content below
RESEARCH ARTICLE

                                        Tumor stiffening reversion through
                                        collagen crosslinking inhibition improves T
                                        cell migration and anti-PD-1 treatment
                                        Alba Nicolas-Boluda1,2,3, Javier Vaquero4,5,6,7, Lene Vimeux1,2, Thomas Guilbert1,
                                        Sarah Barrin1,2, Chahrazade Kantari-Mimoun1,2, Matteo Ponzo8, Gilles Renault1,
                                        Piotr Deptula9, Katarzyna Pogoda10, Robert Bucki9, Ilaria Cascone8, José Courty8,
                                        Laura Fouassier4, Florence Gazeau3†*, Emmanuel Donnadieu1,2†*
                                        1
                                          Institut Cochin, INSERM U1016/CNRS UMR 8104, Université de Paris, Paris,
                                        France; 2Equipe Labellisée Ligue Contre le Cancer, Paris, France; 3Laboratoire
                                        Matière et Systèmes Complexes (MSC), CNRS, Université de Paris, Paris, France;
                                        4
                                          Sorbonne Université, Inserm, Centre de Recherche Saint-Antoine, CRSA, Paris,
                                        France; 5TGF-b and Cancer Group, Oncobell Program, Bellvitge Biomedical
                                        Research Institute (IDIBELL), Barcelona, Spain; 6LPP (Laboratoire de physique des
                                        plasmas, UMR 7648), Sorbonne Université, Centre national de la recherche
                                        scientifique (CNRS), Ecole Polytechnique, Paris, France; 7Oncology Program,
                                        CIBEREHD, National Biomedical Research Institute on Liver and Gastrointestinal
                                        Diseases, Instituto de Salud Carlos III, Barcelona , Spain ; 8CNRS ERL 9215, CRRET
                                        laboratory, University of Paris-Est Créteil (UPEC), Paris, France; 9Department of
                                        Medical Microbiology and Nanobiomedical Engineering, Medical University of
                                        Białystok, Białystok, Poland; 10Institute of Nuclear Physics, Polish Academy of
*For correspondence:                    Sciences, Kraków, Poland
florence.gazeau@u-paris.fr (FG);
emmanuel.donnadieu@inserm.fr
(ED)
†
 These authors contributed
                                        Abstract Only a fraction of cancer patients benefits from immune checkpoint inhibitors. This
equally to this work
                                        may be partly due to the dense extracellular matrix (ECM) that forms a barrier for T cells.
                                        Comparing five preclinical mouse tumor models with heterogeneous tumor microenvironments, we
Competing interests: The                aimed to relate the rate of tumor stiffening with the remodeling of ECM architecture and to
authors declare that no                 determine how these features affect intratumoral T cell migration. An ECM-targeted strategy,
competing interests exist.
                                        based on the inhibition of lysyl oxidase, was used. In vivo stiffness measurements were found to be
Funding: See page 24                    strongly correlated with tumor growth and ECM crosslinking but negatively correlated with T cell
Received: 07 May 2020                   migration. Interfering with collagen stabilization reduces ECM content and tumor stiffness leading
Accepted: 05 June 2021                  to improved T cell migration and increased efficacy of anti-PD-1 blockade. This study highlights the
Published: 09 June 2021                 rationale of mechanical characterizations in solid tumors to understand resistance to
                                        immunotherapy and of combining treatment strategies targeting the ECM with anti-PD-1 therapy.
Reviewing editor: Bernard
Malissen, Centre d’Immunologie
de Marseille-Luminy, Aix
Marseille Université, France
                                        Introduction
    Copyright Nicolas-Boluda et
                                        In the last decade, significant progress has been made in the development of T-cell-based immuno-
al. This article is distributed under
                                        therapies (Miller and Sadelain, 2015). The two main T-cell-based immunotherapies are adoptive T
the terms of the Creative
Commons Attribution License,            cell therapy and immune checkpoint inhibitors. Monoclonal antibodies blocking the immune check-
which permits unrestricted use          points cytotoxic T lymphocyte-associated antigen 4 (CTLA-4) and programmed death one receptor
and redistribution provided that        (PD-1) have quickly gone from proof of concepts to FDA-approved first- and second-line treatments
the original author and source are      for a significant number of tumors even in late stages (Callahan et al., 2016). However, an elevated
credited.                               percentage of patients with solid tumors fail to respond to these therapies. The mechanisms

Nicolas-Boluda et al. eLife 2021;10:e58688. DOI: https://doi.org/10.7554/eLife.58688                                                  1 of 29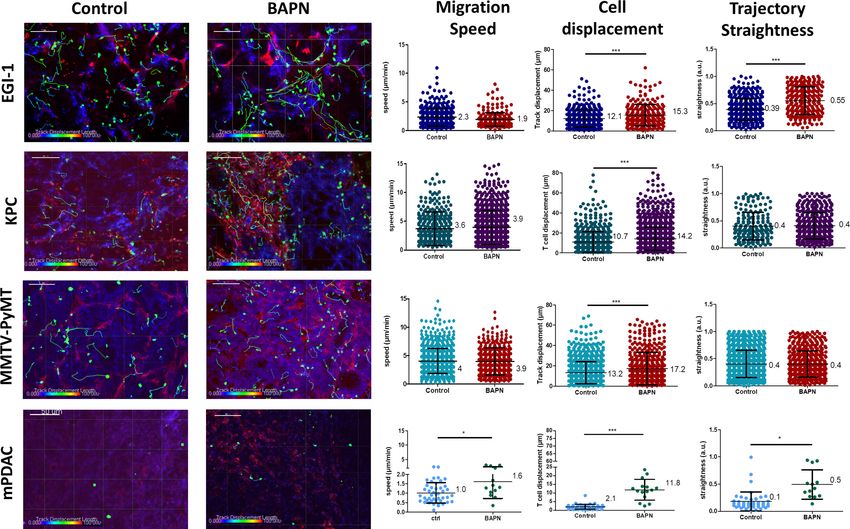
Research article                                                                                                 Cancer Biology

                                   underlying the poor response to immune checkpoint inhibitors are still uncertain; nevertheless,
                                   recent results suggest that T cell function and distribution in the tumor are affected by numerous
                                   immunosuppressive mechanisms (Anderson et al., 2017). It is well established that in progressing
                                   tumors T cells exhibit a particular phenotype unable to normally respond to tumor antigens. In addi-
                                   tion, in a large proportion of tumors, T lymphocytes are excluded from the tumor cell regions in a
                                   so-called ‘excluded-immune profile’ (Hegde et al., 2016; Herbst et al., 2014; Joyce and Fearon,
                                   2015). Ineffective T cell migration and penetration into the tumor mass might represent an impor-
                                   tant obstacle to T cell-based immunotherapies. As a support for this notion, various clinical studies
                                   have shown that tumors enriched in T cells are more susceptible to be controlled by PD-1 blockade.
                                   In contrast, tumors with so-called immune-excluded profiles, in which T cells are present within
                                   tumors but not in contact with malignant cells, are refractory to PD-1 blockade (Herbst et al., 2014;
                                   Mariathasan et al., 2018). Particularly, the fibrotic state of desmoplastic tumors can cause immuno-
                                   suppression through multiple mechanisms (Turley et al., 2015). The hypothesis of physical resistance
                                   to T cell infiltration and migration-related to the heterogeneity and aberrant organization of the
                                   extracellular matrix (ECM) with respect to the tumor nests has emerged recently (Jiang et al., 2017;
                                   Pickup et al., 2014). By using dynamic imaging microscopy, we highlighted the detrimental impact
                                   of collagen fibrils architecture on the migratory behavior of T cells in fresh human tumor explants.
                                   Both a guiding strategy combined with a physical hindrance process has been shown to restrain T
                                   cells from contacting tumor cells, thus leading to the T cell excluded profile (Salmon et al., 2012;
                                   Peranzoni et al., 2013). Hence, a dense fibrotic stroma could raise physical obstacles to immune
                                   cell infiltration similar to the previously established stromal resistance to chemotherapeutics, anti-
                                   bodies, nanoparticles, or virus tumor penetration (Netti et al., 2000; Stylianopoulos et al., 2018).
                                   In addition, cellular components of tumor-associated fibrosis, particularly the cancer-associated
                                   fibroblasts (CAF), can have both direct and indirect effects on T cell infiltration and function
                                   (Turley et al., 2015). Accordingly, one important challenge in the field is to develop strategies tar-
                                   geting tumor fibrosis in order to reverse immune exclusion and to improve T cell-based immunother-
                                   apy. Recent studies have been undertaken with this objective. T cells engineered to express a
                                   chimeric antigen receptor together with heparanase, an ECM-degrading enzyme, show enhanced
                                   infiltration into xenografted tumors as well as anti-tumor efficacy (Caruana et al., 2015). Recently, a
                                   major role for the TGFb signaling pathway in promoting T cell exclusion from tumor cells has been
                                   demonstrated. In breast and colorectal mouse tumor models, neutralizing antibodies against TGFb
                                   were shown to reduce collagen I production, overcoming the T cell excluded profile and increasing
                                   the efficacy of anti-PD-L1 antibodies (Mariathasan et al., 2018; Tauriello et al., 2018). In cholangio-
                                   carcinoma, an immune mesenchymal subtype has been identified, which is associated with TGFb sig-
                                   nature and poor tumor-infiltrating cells (Job et al., 2020). Other axes including the CXCR4/CXCL12
                                   in breast metastasis and the focal adhesion kinase in pancreatic ductal adenocarcinoma (PDAC) have
                                   also been associated with both desmoplasia and absence of cytotoxic T lymphocytes in tumors from
                                   mice (Chen et al., 2019). Consequently, the inhibition of these axes in preclinical mouse cancer
                                   models was shown to reduce fibrosis while significantly increasing T cell infiltration and improving
                                   response to checkpoint inhibitors (Mariathasan et al., 2018; Tauriello et al., 2018; Incio et al.,
                                   2015; Jiang et al., 2016). Clinical trials testing such combination are currently ongoing in advanced
                                   pancreatic cancer, mesothelioma, urothelial carcinoma, and other malignancies (NCT02546531,
                                   NCT02758587, NCT02734160, NCT04064190, and NCT02947165).
                                       However, due to patient and tumor heterogeneity, there is no clear indication of how the T cell
                                   distribution in tumors is related to the fibrosis level and to the different architectures of ECM. Thus,
                                   there is an urgent need to assist in matching combination approaches to patient populations who
                                   could benefit from stromal modulation strategies to improve their response to immunotherapy.
                                   Companion matrix-derived biomarkers and imaging approaches should provide insights into the
                                   contribution of ECM remodeling in shaping the immune milieu of the tumor. Particularly, a critical
                                   determinant of fibrotic tumor progression – the tumor mechanics – has been poorly investigated
                                   through the prism of immune impact. An important feature of fibrotic tumors is their considerable
                                   higher stiffness compared to their neighboring healthy tissues, which are highly correlated with can-
                                   cer progression and metastasis, particularly in breast, colorectal, liver, and pancreatic tumors
                                   (Venkatesh et al., 2008; Samani et al., 2007). The use of non-invasive imaging techniques such as
                                   shear wave elastography (SWE) and magnetic resonance elastography, designed to monitor stiffness
                                   of any given tissue, allows an accurate and non-invasive diagnostic and characterization of malignant

Nicolas-Boluda et al. eLife 2021;10:e58688. DOI: https://doi.org/10.7554/eLife.58688                                                2 of 29
Research article                                                                                                Cancer Biology

                                   lesions in vivo with prognostic significance, for instance in breast cancer (Evans et al., 2012;
                                   Song et al., 2018; Riegler et al., 2018). Indeed, the extensive remodeling of the stromal compo-
                                   nents which increase tumor stiffness can mechanically activate intracellular signaling pathways that
                                   promote tumor progression and at the same time can dampen T cell functions including migration
                                   and infiltration into tumor islets (Datar and Schalper, 2016; Humphrey et al., 2014; Krebs et al.,
                                   2017; Rice et al., 2017). However, there is a lack of studies correlating the mechanical properties of
                                   tumors to their heterogeneous ECM architecture and T cell infiltration capacity. Here we aim at fill-
                                   ing this gap through a comprehensive investigation of stiffness evolution in several preclinical mouse
                                   models of pancreatic, breast, and bile duct carcinomas, presenting different ECM organizations,
                                   coupled with dynamic imaging of fresh tumor slices to monitor T cell motility. In concert with these
                                   imaging biomarkers of both mechanical properties, ECM architecture, and T cell migration, we
                                   explored the consequences of altering the ECM by inhibition of the lysyl oxidase (LOX), a copper-
                                   dependent enzyme responsible for the crosslinking of collagen molecules into fibers that has been
                                   seen to be overexpressed in many metastatic tumors and responsible for malignant progression
                                   (Cox et al., 2016). We highlight that LOX inhibition has different mechanical modulating effects
                                   depending on the ECM architecture, with significant improvement in T cell mobility. Despite minor
                                   effects in primary tumor growth upon LOX inhibition or PD-1 blockade treatment alone, their combi-
                                   nation increases effector CD8 T cell accumulation in tumors and significantly delays tumor progres-
                                   sion in a pancreatic cancer model.

                                   Results
                                   Relationship between tumor structure and tumor mechanical properties
                                   in different preclinical carcinoma mouse models
                                   One key aspect when testing immunotherapeutic agents is the use of relevant preclinical models
                                   that closely mimic the properties of human solid tumors. Human carcinomas derive from epithelial
                                   cells and therefore harbor a typical though heterogeneous structure with tumor cells forming com-
                                   pact islets or nests surrounded by the stroma, enriched in ECM proteins, fibroblasts, blood vessels,
                                   and immune cells. To unravel the relationship between tumor growth, ECM remodeling, stiffening,
                                   and immune infiltration, we characterized the tumor structure and the mechanical properties of five
                                   different preclinical models, recapitulating the structural heterogeneity of different carcinomas
                                   (Supplementary file 1): a subcutaneous model of cholangiocarcinoma (EGI-1), a subcutaneous
                                   (MET-1) and a transgenic model (MMTV-PyMT) of mouse breast carcinoma, and an orthotopic
                                   (mPDAC) and a subcutaneous (KPC) model of mouse PDAC. A multiscale evaluation of the mechani-
                                   cal properties of the tumors was performed. At the macroscale, we measured tumor stiffness during
                                   tumor growth using SWE, a non-invasive imaging technique that allows the quantification and map-
                                   ping of tumor stiffness (Figure 1A, Supplementary file 2). The presence of very stiff regions,
                                   defined as areas with an elastic modulus > 40 kPa (Marangon et al., 2017), in the tumor was quanti-
                                   fied together with the average stiffness of the tumor (Figure 1B, Supplementary file 2). At the
                                   micron-scale, we evaluated tumor organization and fibrosis using hematoxylin–eosin–Safran (HES)
                                   (Figure 1C) and Sirius Red staining (Supplementary file 2). Sirius Red is a highly specific stain for
                                   collagen fibers that combined with polarizing microscopy allows differentiating thin collagen fibrils
                                   from thick and densely packed collagen fibers (Rittié, 2017). Under polarized light, thin fibers show
                                   a greenish-yellow birefringence, whilst thicker and densely packed fibers give an orange-red birefrin-
                                   gence. By separating these two colors, it is possible to quantify the amount of thick and densely
                                   packed fibers present in the tumor (Supplementary file 2). The fibrillar collagen network was deter-
                                   mined using second-harmonic generation (SHG) imaging, which allows to analyze the architecture
                                   and density of fibrillar collagen without having to use detection antibodies (Figure 1D,
                                   Supplementary file 2).
                                       In the EGI-1 cholangiocarcinoma model, tumor stiffening and tumor growth have a strong posi-
                                   tive correlation (Figure 1A). The stiffness distribution is highly heterogeneous, presenting 20% of
                                   stiff regions (>40 kPa) on average that goes up to 50–60% in tumors with higher volume. In terms of
                                   architecture, the tumor and its extensive stroma compartment, occupying around 20% of the tumor,
                                   are well separated. This is a typical trait of desmoplastic tumors and the model accurately reprodu-
                                   ces the architecture of human cholangiocarcinoma. Its collagen network is characterized by long

Nicolas-Boluda et al. eLife 2021;10:e58688. DOI: https://doi.org/10.7554/eLife.58688                                              3 of 29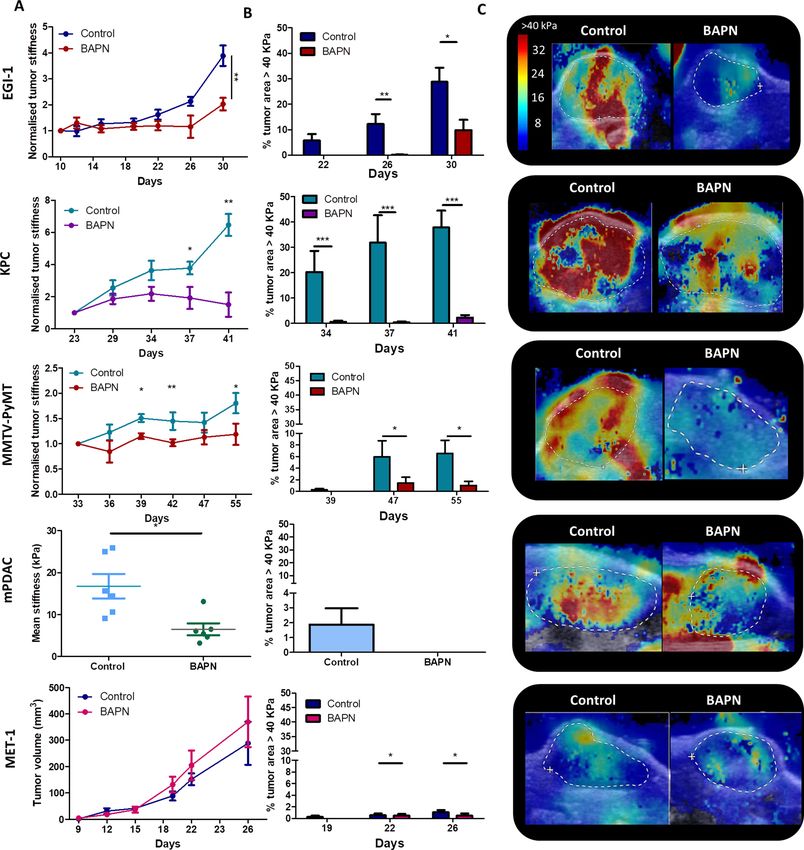
Research article                                                                                                            Cancer Biology

Figure 1. Macroscopic and microscopic characterization of EGI-1, KPC, MMTV-PyMT, mPDAC, and MET-1 tumor models. (A) Tumor volume and tumor
mean stiffness relationship. Tumor volume was measured using a caliper or ultrasound, whilst tumor mean stiffness was measured using SWE. (B) The
percentage of stiff regions in relation to tumor volume. The presence of very stiff regions with an elastic modulus > 40 kPa was quantified using data
from the stiffness map extracted from the SWE images. (C) Comparison of the histological diversity within the tumor models. Representative images of
each tumor model (scale bar = 100 mm). (D) SHG images of the collagen network in each of the models at the end point of the experiment. Scale
bar = 20 mm. EGI-1 (n = 30 mice from three independent experiments); KPC (n = 34 mice from three independent experiments); MMTV-PyMT (n = 5
mice, 10 tumors per mouse from two independent experiments); mPDAC (n = 7 mice from two independent experiments); and MET-1 (n = 12 mice
from two independent experiments).
The online version of this article includes the following source data for figure 1:
Source data 1. Source data file for Figure 1.

                                     (85.9 ± 42.0 mm) and thick (7.4 ± 2.2 mm) collagen fibers that are densely packed (6% of the tumor)
                                     (Figure 1D, Supplementary file 2).
                                        The mouse PDAC KPC model (Hingorani et al., 2005) exhibits similar features to that of EGI-1. A
                                     high positive correlation between tumor stiffness and volume, presenting over 20% of stiff regions at
                                     high tumor volumes, was observed (Figure 1A). KPC tumors present typical segregation of ECM
                                     and tumor nests, with a high proportion of stroma (~20%). However, the extension of the stromal
                                     areas is lower than that of EGI-1 with higher intercalation with tumor islets. Its collagen network is
                                     characterized by shorter (67.1 ± 35 mm) and thinner (4.4 ± 0.9 mm) collagen fibers than that of EGI-1
                                     (Figure 1D, Supplementary file 2).
                                        The spontaneous orthotopic murine breast cancer model MMTV-PyMT, although slower in its
                                     growth as compared to subcutaneous tumors, also stiffens during tumor progression (Figure 1A).
                                     However, there is a lower density of stiff regions (
Research article                                                                                                  Cancer Biology

                                   tumor in a genetic model that develops about 10 tumors limits the maximal tumor volume reached
                                   for this analysis. Hence, we cannot compare this model with the other models at high tumor volumes
                                   for ethical reasons. This spontaneous tumor model also presents a tumor islets-stroma structure, but
                                   with a lower amount of stroma (~13%) as compared to EGI-1 and KPC models. The stroma is more
                                   dispersed and intercalated with the tumor compartment. Collagen fibers are characterized for being
                                   thin (3.6 ± 1.1 mm) and long (83 ± 41 mm), forming densely packed regions taking up to 4.8% of the
                                   tumor.
                                       The orthotopic murine PDAC (mPDAC) model has a very different profile compared to the other
                                   models. The stroma takes up ~40% of the tumor (Figure 1C, Supplementary file 2) but without
                                   clear spatial segregation of stromal and tumor compartments. The mPDAC collagen network is
                                   made up of thin (3.5 ± 0.8 mm) and dispersed collagen fibers, which accounts for the lower presence
                                   of densely packed collagen regions (2.7% of the tumor). The mean tumor stiffness is lower than that
                                   of the other models, partly explained by the limits of the maximal tumor volume reached in this
                                   orthotopic model (for ethical reasons) and partly by the collagen architecture. Tumor stiffness also
                                   increases with tumor volume (Figure 1B) in line with previous studies performed in this model
                                   (Gilles et al., 2016). Unlike the above-mentioned models that exhibit a high correlation between
                                   stiffness and tumor growth, the mouse breast carcinoma MET-1 tumor model is characterized by low
                                   tumor stiffness (Figure 1A), a limited stroma (~6%), the lack of tumor-islet/stroma organization, and
                                   the presence of thin (3.2 ± 0.9 mm) and dispersed collagen fibers (Figure 1D, Supplementary file 2).
                                       In human breast cancer, a significant correlation between tumor stiffness and tumor size was
                                   demonstrated (Evans et al., 2012; Song et al., 2018). Here, our analysis enabled us to confirm such
                                   correlation in different mouse tumor models covering three types of carcinomas. In addition, we
                                   show a correlation between tumor stiffness measured non-invasively with collagen accumulation
                                   associated with a segregated architecture of thick and densely packed collagen fibers (Sirius red
                                   positive) surrounding tumor nests. In contrast, tumors with an entangled and thin mesh of collagen
                                   fibers present lower rigidity despite overall high collagen content. Particularly the appearance of stiff
                                   regions > 40 kPa is seen as a physical biomarker of intratumor heterogeneity and ECM segregation.
                                   This analysis maps out potentially relevant preclinical tumor models, which might reproduce the
                                   diverse fibrotic evolutions of human breast, pancreatic, and bile duct tumors and their architecture
                                   heterogeneity.

                                   LOX modulates tumor stiffness and the ECM organization
                                   The panel of tumor stroma structures reported above allows us to investigate the direct effects of
                                   ECM modulating agents in situations mimicking the heterogeneity observed in human carcinoma.
                                   Thus, we sought to determine whether beta-aminopropionitrile (BAPN), an inhibitor for LOX enzy-
                                   matic activity, could modulate tumors’ mechanical properties in concert with the stroma architecture
                                   (Levental et al., 2009). For these experiments, BAPN was administered in the drinking water of
                                   mice upon tumor cell implantation and until their sacrifice for most models, except for the MMTV-
                                   PyMT model that was treated approximately at the time that tumors start to spontaneously develop.
                                   LOX stabilizes collagen fibers by enzymatic reactions that culminate in the formation of trivalent
                                   mature crosslinks including pyridinoline (PYD) and deoxypyridinoline (DPD) (Yamauchi et al., 2018).
                                   PYD and DPD have an intrinsic fluorescence (Richards-Kortum and Sevick-Muraca, 1996), which
                                   can be measured by two-photon microscopy (Ex 720 nm, Em 400 nm) on tissue sections
                                   (Marturano et al., 2014). Here, we adopted a similar strategy and assessed these two LOX-gener-
                                   ated crosslinks in tumor slices from control and BAPN-treated KPC-bearing mice. Our data indicate
                                   that the average fluorescence signals of PYD and DPD, measured in SHG-positive regions, were sig-
                                   nificantly decreased in BAPN as compared to control conditions (Figure 2—figure supplement 1).
                                   These results suggest that BAPN specifically blocks LOX enzymatic activity. We then examined the
                                   effect of LOX inhibition on tumor stiffness (Figure 2A,C) and on the presence of stiff regions
                                   (Figure 2B). Results show that all models, except for MET-1, undergo a reduction in mean stiffness
                                   when LOX is inhibited. EGI-1 and KPC models both show the most striking differences (Figure 2A,
                                   C). Changes are mainly perceived at late stages of tumor developments since, in these models,
                                   tumor stiffness is positively correlated with tumor growth. In the MMTV-PyMT model, however, sig-
                                   nificant differences were noted throughout the development of the tumor. For the mPDAC model,
                                   tumor stiffness was only evaluated at the end of the BAPN treatment. A significant decrease in mean
                                   tumor stiffness is seen in BAPN-treated mPDAC tumors.

Nicolas-Boluda et al. eLife 2021;10:e58688. DOI: https://doi.org/10.7554/eLife.58688                                                 5 of 29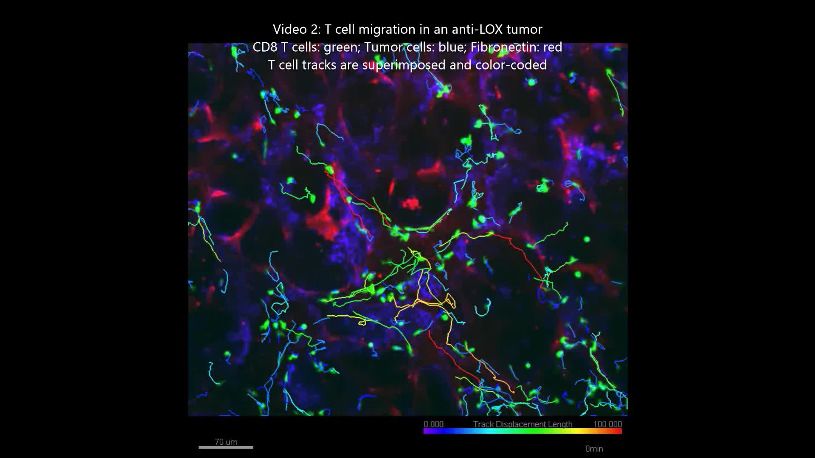
Research article                                                                                                         Cancer Biology

Figure 2. Effect of LOX inhibition on tumor stiffness and tumor stroma organization in EGI-1, KPC, MMTV-PyMT, and mPDAC tumor models. (A) Tumor
stiffness measured by SWE in control and BAPN-treated (LOX inhibitor) tumors in relation to tumor volume for EGI-1, MMTV-PyMT, and KPC tumor
models. For the mPDAC tumor model, stiffness was only measured at the endpoint of the experiment (*p-value

Research article                                                                                                   Cancer Biology

Figure 2 continued
Figure supplement 5—source data 1. Source data file for Figure 2—figure supplement 5.
Figure supplement 6. Effect of LOX inhibition in MET-1 tumor model.
Figure supplement 6—source data 1. Source data file for Figure 2—figure supplement 6.

                                       Notably, BAPN treatment did not affect tumor growth in most models (Figure 2—figure supple-
                                   ments 2A–6A), except for mPDAC (Figure 2—figure supplement 5A). To verify that the variation in
                                   tumor stiffness was not due to a difference in tumor volume, the mean tumor stiffness of control and
                                   treated mice were compared at different tumor volumes (Figure 2—figure supplements 2C–6C). In
                                   both KPC and EGI-1 tumors, a clear difference in mean tumor stiffness can be seen in tumors with a
                                   volume > 400 mm3 (Figure 2—figure supplements 2C–3C).
                                       We also explored whether the presence and proportion of stiff regions was reduced when LOX
                                   was inhibited (Figure 2B). The percentage of control tumor area with a mean stiffness > 40 kPa
                                   increased with time (and with tumor volume) within the non-treated tumor indicating that there is
                                   not only an increase of overall mean stiffness but also an increase of the heterogeneity of stiff
                                   regions. However, this percentage was significantly reduced in BAPN-treated tumors with marked
                                   differences observed in the KPC model and to a lesser extent in EGI-1 and MMTV-PyMT models. In
                                   mPDAC, BAPN-treated tumors did not display stiff regions (Figure 2—figure supplement 5B–D).
                                   The only model that does not respond to LOX inhibition by stiffness reduction is MET-1 (Figure 2—
                                   figure supplement 6B–C), in line with our previous data showing an absence of tumor stiffening dur-
                                   ing tumor growth. Overall, our results clearly illustrate: (1) the heterogeneity of tumor response to
                                   an ECM-targeting agent, (2) the potential of non-invasive SWE elastography to measure a macro-
                                   scopic physical marker – stiffness – that predicts this response.
                                       Given the effects of LOX inhibition at a macro scale, we decided to delve into the changes
                                   induced at the level of the collagen fiber network through an in-depth quantitative evaluation of col-
                                   lagen fiber width (Figure 3A), orientation (Figure 3B,C), curvature (Figure 3D), and the presence of
                                   regions with thick and densely packed fibers (Figure 3E).
                                       A significant reduction of collagen fiber width distribution was observed in EGI-1, KPC, and
                                   mPDAC models, whilst fibers in the MMTV-PyMT tumor model did not display a significant change
                                   in their width (Figure 3A). The most substantial difference was seen in the EGI-1 model, where colla-
                                   gen fiber width was decreased by 9.4% on average (6.7 mm versus 7.4 mm). Changes in mPDAC and
                                   KPC were less pronounced, with a reduction of 4.4% and 5%, respectively (Supplementary file 3).
                                   The inhibition of LOX did not affect collagen fiber length in any of the models (Supplementary file
                                   3).
                                       We next assessed the orientation and linearization of collagen fibers in control and BAPN-treated
                                   animals. In general, the collagen fibers in normal tissues are typically curly and anisotropic in contrast
                                   to the situation observed in progressing tumors in which many of the fibers progressively thicken
                                   and linearize. Collagen fiber orientation was described as the coefficient of variation (CV) of the
                                   angle for all fibers, the smaller the CV is, the more aligned the fibers are. Fibers in non-treated
                                   tumors remained mainly oriented in one dominant direction (Figure 3B, C, and F) with a CV from
                                   1.85 to 0.5 consistent with previous findings (Li et al., 2019). LOX inhibition tends to disrupt the
                                   alignment of collagen fibers, meaning that they were more dispersed and oriented in different direc-
                                   tions with increased CV as compared to control conditions. The most significant effects were seen in
                                   KPC and mPDAC models.
                                       Collagen fibers in tumors are characterized as being linear and reticulated due to the high level
                                   of deposition and posttranslational crosslinking. This physical restructuration of collagen progres-
                                   sively stiffness the ECM (Egeblad et al., 2010). The level of collagen linearization was quantified by
                                   measuring the curvature ratio of the fibers. The curvature ratio of control tumors for all models was
                                   close to one meaning that the collagen fibers were fully linearized. In contrast, LOX inhibition
                                   severely affected fiber curvature, as there was a reversion of the fibers linearization resulting in less
                                   linear and wavier fibers in all models (Figure 3D,F).
                                       Finally, LOX inhibition also significantly decreased the surface covered by thick and densely
                                   packed collagen fibers in EGI-1, KPC, and MMTV-PyMT model (Figure 3E, Figure 3—figure

Nicolas-Boluda et al. eLife 2021;10:e58688. DOI: https://doi.org/10.7554/eLife.58688                                                  7 of 29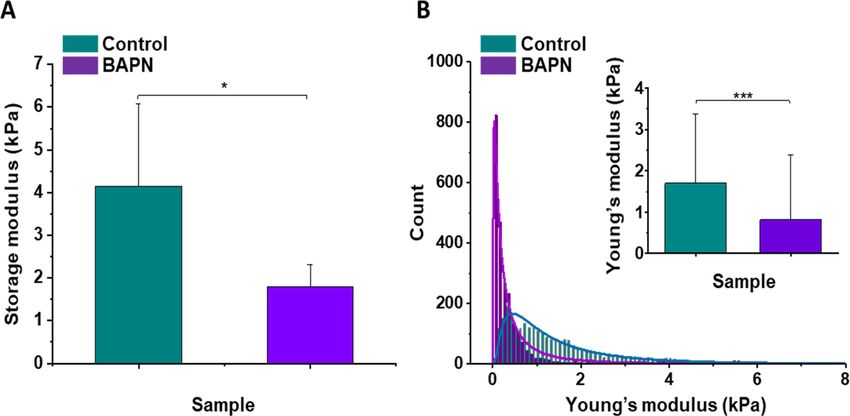
Research article                                                                                                         Cancer Biology

Figure 3. Effect of LOX inhibition on ECM architecture in EGI-1, KPC, MMTV-PyMT, and mPDAC tumor models. (A) Collagen fiber width distribution
measured from SHG images (***p-value
Research article                                                                                                                 Cancer Biology

Figure 3 continued
(***p-value
Research article Cancer Biology
(Plodinec et al., 2012). AFM measurements indicated that treatment of mice with BAPN leads to a
narrower Young’s modulus distributions shifted to lower values of elastic modulus in comparison to
the control samples (mean Young’s modulus of 0.82 ± 1.58 kPa versus 1.70 ± 1.66 kPa, respectively)
(Figure 4B). This confirms that the high heterogeneity in local tissue mechanical properties of KPC
tumor can be reduced upon treatment with a LOX inhibitor. Both local and global measurements
confirm the normalization of tumor tissue mechanical properties mediated by LOX inhibition with a
drastic reduction in the linearized tightly packed collagen fibers that contribute to tumor stiffness
heterogeneity and global enhancement in non-treated KPC tumors.
Overall, our results demonstrate the rationale of targeting LOX enzymatic activity for normalizing
tumor mechanical properties and ECM structure (mostly collagen fibers compaction, segregation,
and linearity) in tumors exhibiting high tumor stiffness together with mechanical and structural
heterogeneity.
LOX inhibition increased intratumoral T cell migration and infiltration
Previous studies performed in our group have proved that the density and orientation of the ECM
can have an important impact on T cell behavior and their displacement in fresh human lung and
ovarian tumor slices (Salmon et al., 2012; Bougherara et al., 2015). Motile T cells were mainly
found in loose ECM stromal regions, whereas fibrotic areas were devoid of lymphocytes. Based on
this, we hypothesized that LOX-dependent tumor stiffness could consequently affect T cell migration
in tumors and eventually predict the T cell behavior in the various ECM environments. To test this,
we performed dynamic imaging of T cell migration on fresh tumor slices from mice treated or not
with BAPN. The tumor slice assay that we have established preserves the original tissue microenvi-
ronment and permits monitoring with confocal microscopy the behavior of either ex vivo purified
and plated T cells or endogenous T cells labeled with directly coupled fluorescent antibodies
(Peranzoni et al., 2018). EGI-1 is a xenografted tumor model, with implantation of human carcinoma
cells into immune-suppressed mice that lack resident T cells. Thus, in order to evaluate T cell migra-
tion in this model we isolated human peripheral blood T cells (PBT) and activated them in vitro. We
then added the activated PBT onto fresh tumor slices and analyzed their migration using real-time
confocal microscopy. As the MMTV-PyMT tumor model is poorly infiltrated in host T cells
(Guerin et al., 2019), we investigated the migration of exogenously purified murine-activated PBTs
in the same manner as for the human EGI-1 model. In both mPDAC and KPC mice tumor models,
resident tumor-infiltrating T lymphocytes were monitored after staining with directly coupled anti-
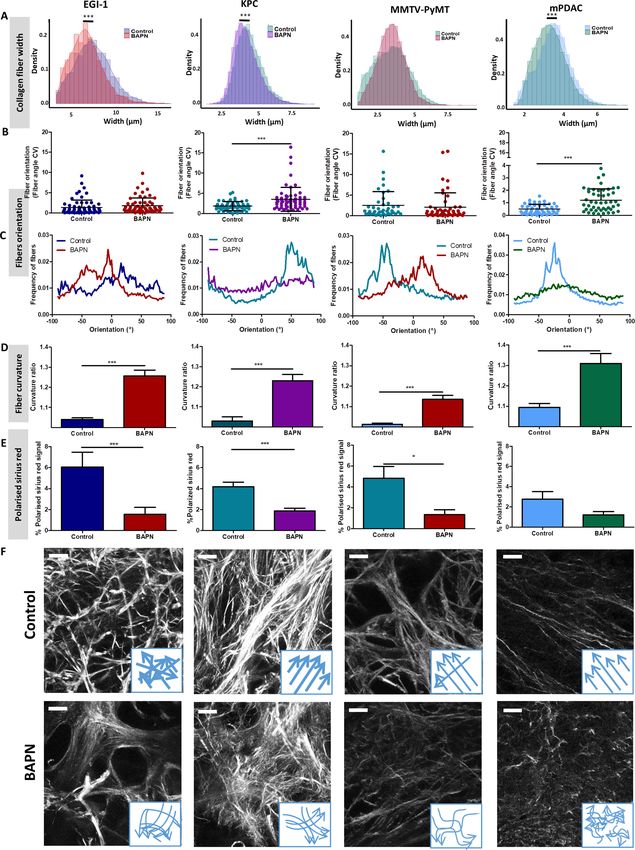
CD8 antibodies (Peranzoni et al., 2018). The three parameters analyzed to assess T cell migration
were cell migration speed (mean cell migration speed over 20 min), cell displacement (displacement
vector between starting and final position), and straightness (ratio of cell displacement to the total
length of the trajectory) of the migration trajectory (Figure 5 and Supplementary file 4).
In control untreated tumors, T cells migrated slowly with average velocities which were relatively
homogeneous in the different models except in the mPDAC model (Video 1). Average velocities
ranged from 2.3 mm/min in the EGI-1 model to 4.1 mm/min in the MMTV-PyMT model. These values
are in line with a number of studies including ours showing a poor migration of T cells in tumors as
compared to other organs (e.g. in lymph nodes) where T cells actively migrate (Peranzoni et al.,
2018). For example, the mean velocity of CD8 T cells in human lung tumors approaches 3 mm/min
(Peranzoni et al., 2018). Analysis of T cell track straightness gives indices close to 0.4 consistent
with previous reports on T cell displacements in tumors.
The mPDAC model differs from the others since T cells were almost static during the 20 min
recording (average speed of 1 mm/min and straightness of 0.1).
In every tested model, LOX inhibition resulted in an overall increase in T cell migration as com-
pared to control conditions (Figure 5, Supplementary file 4 and Video 2). However, different
parameters were altered in each model depending on the nature of the T cells that were monitored.
In EGI-1 BAPN-treated tumors, activated PBT cells displayed longer displacement lengths compared
to untreated tumors. This was also true for MMTV-PyMT tumors. Since activated PBT are not specific
to the tumor, the effects observed are due to LOX inhibition and not due to T cells engaging in sta-
ble conjugates with cancer cells through antigen recognition. In EGI-1 tumors, the trajectory straight-
ness of activated PBTs was also significantly increased upon LOX inhibition.
Effects of BAPN on the dynamics of endogenous T cells infiltrated into KPC and mPDAC tumors
were then evaluated (Figure 5 and Supplementary file 4). We found that in both models, LOX
Nicolas-Boluda et al. eLife 2021;10:e58688. DOI: https://doi.org/10.7554/eLife.58688 10 of 29Research article Cancer Biology
Figure 5. Impact of LOX inhibition on T cell migration in EGI-1, MMTV-PyMT, mPDAC, and KPC tumor models. Migration of activated PBT plated onto
fresh tumor slices was analyzed in EGI-1 and MMTV-PyMT tumor model, whilst resident tumor-infiltrating T lymphocytes were analyzed in mPDAC and
KPC tumor model. Illustrative images of T cell migration tracks in EGI-1, MMTV-PyMT, mPDAC, and KPC tumor models. Tumor stroma (fibronectin) in
red, tumor cells (EpCAM in EGI-1, MMTV-PyMT, and KPC tumor models, CD44 in mPDAC tumor models), in blue and T cells (CD8 in mPDAC and KPC,
Calcein in MMTV-PyMT, and EGI-1 tumor models) in green. Tracks are color-coded to illustrate track displacement. Scale bar = 100 mm. T cell migration
speed, T cell displacement, and trajectory straightness in all tumor models. ***p-value>0.001, p-value>0.05, Student’s t-test. Results are shown as
mean ± SD.
The online version of this article includes the following source data and figure supplement(s) for figure 5:
Source data 1. Source data file for Figure 5.
Figure supplement 1. BAPN treatment induces an increased infiltration of effector CD8+T cells in KPC tumors.
Figure supplement 1—source data 1. Source data file for Figure 5—figure supplement 1.
inhibition leads to an increase in the displacement of T cells with a fivefold increase in the mPDAC
model. In terms of cell speed, enhancements were observed only in the mPDAC model. Likewise,
the trajectory straightness was increased in mPDAC models, but not in KPC tumors. In addition, we
also evidenced an increased infiltration of resident T cells in KPC tumors when treated with BAPN. In
control conditions, an identical number of T cells (around 100 per mm2) were found in the stroma
and tumor cell regions. By comparison, BAPN treatment resulted in a threefold to fourfold increase
of CD8+ T cells in both the stroma and tumor islets (Figure 5—figure supplement 1).
Results reported in Figure 5 have been obtained with data pooled from all mice either treated or
not with BAPN. We decided to extend our analysis at the level of individual mouse and investigated
the relationship between T cell motility (speed and displacement) and mean stiffness of control and
BAPN-treated tumors. Our data indicate that T cell motility was inversely correlated to tumor stiff-
ness (Figure 6) in line with Figure 5. However, in three out of the four models tested this correlation
is different if one compares control and BAPN-treated tumors. In BAPN-treated tumors, there is a
clear inverse linear correlation between T cell migration speed and mean tumor stiffness as
Nicolas-Boluda et al. eLife 2021;10:e58688. DOI: https://doi.org/10.7554/eLife.58688 11 of 29Research article Cancer Biology
evidenced by a steep slope. In comparison, such
correlation is less pronounced in control stiff
tumors. Similar results were observed when com-
paring T cell displacement and mean tumor stiff-
ness. These results suggest that above a stiffness
threshold that depends on the model, T cells are
mostly arrested. In contrast, as tumor stiffness
decreased by inhibition of LOX, T cell migration
was restored. Thus, T cell motility is highly influ-
enced by small variations in the stiffness of softer
tumors as is the case when LOX’s activity is
Video 1. T cell migration in the control EGI-1 tumor
inhibited.
model. The slices stained with calcein for the T cells
Overall, these results suggest that the exces-
(green), anti-EpCAM (blue), anti-fibronectin (red) were
imaged with a spinning disk confocal microscope. sive accumulation and linearization of collagen in
Tracks are color-coded according to T cell ECM limits T cell migration within several rigid
displacement length. Frame interval 30 s. The tumors with desmoplastic evolution and that
animations represent 3D reconstructions of sequential z LOX-inhibiting BAPN treatment can both reverse
series. A still image is shown in Supplementary file 4. tumor stiffening and improve T cell infiltration
https://elifesciences.org/articles/58688#video1 and migration to tumor cells. We also identify
SWE tissue stiffness as a predictive physical
marker of T cell motility and infiltration in desmo-
plastic tumors.
LOX inhibition improves response to anti-PD-1 therapy
Even though the inhibition of LOX was followed by an increase in CD8 T cell number and migration,
this finding was not accompanied by major effects on tumor growth in four of the five tumor models
tested (Figure 2—figure supplements 2–6). In different settings, an increase in intratumoral T cell
motility is not sufficient to reduce tumor growth if T cells are still impaired in their capacity to
respond to tumor antigens (Peranzoni et al., 2018). Consequently, we decided to assess whether
LOX inhibition could improve the response to immune checkpoint inhibitors. The KPC model was
chosen for these experiments as tumors are stiff, respond to LOX inhibition in terms of ECM normali-
zation, and are infiltrated with T cells. KPC tumor-bearing mice were treated with BAPN combined
with anti-PD-1 antibodies. Mice were treated or not with BAPN from tumor cell injection up to their
sacrifice and were treated with anti-PD-1 antibodies when the tumor volume was around 80–150
mm3. At this point, the mice received four doses i.p. injection of anti-PD-1 or isotype control anti-
body at 4 days intervals (i.p. injection). Unlike
BAPN, PD-1 blockade did not affect tumor stiff-
ness (Figure 7—figure supplement 1A,B) nor
collagen organization including fiber orientation
and curvature (Figure 7—figure supplement
1C–E). Moreover, the combination therapy was
similar to that of BAPN alone on all of these
parameters. We then investigated the conse-
quences of these treatments on tumor growth.
As shown in Figure 7A, while treatment with sin-
gle agents alone only shows non-significant
reduction in tumor growth, the combination of
BAPN with the checkpoint inhibitor significantly
Video 2. T cell migration in the LOX inhibited EGI-1
delays tumor progression. We then profiled the
tumor model. The slices stained with calcein for the T
immune cell population in these tumors using
cells (green), anti-EpCAM (blue), and anti-fibronectin
(red) were imaged with a spinning disk confocal
flow cytometry and a gating strategy shown in
microscope. Tracks are color-coded according to T cell Figure 7—figure supplement 2. We found that
displacement length. Frame interval 30 s. The BAPN treatment alone significantly decreases
animations represent 3D reconstructions of sequential z the number of polymorphonuclear neutrophils
series. A still image is shown in Supplementary file 4. (Figure 7B), but increases the presence of
https://elifesciences.org/articles/58688#video2 MHCII+ tumor-associated macrophages (TAMs)
Nicolas-Boluda et al. eLife 2021;10:e58688. DOI: https://doi.org/10.7554/eLife.58688 12 of 29Research article Cancer Biology
Figure 6. Correlation between mean tumor stiffness and T cell migration parameters in EGI-1, KPC, MMTV-PyMT, and mPDAC tumor models. (A)
Correlation between mean tumor stiffness and mean T cell velocity. (B) Correlation between mean tumor stiffness and mean T cell displacement.
Averaged T cell velocity and displacement were calculated from at least 50 individual cells. Each point represents values from an individual mouse. EGI-
1 (n = 8 mice/group); KPC (n = 4 mice/group); MMTV-PyMT (n = 6–7 mice/group); and mPDAC (n = 4 mice/group) from two to three experiments.
The online version of this article includes the following source data for figure 6:
Source data 1. Source data file for Figure 6.
(Figure 7C), while the combination therapy expanded the percentage of GrzmB CD8+ T cells
(Figure 7D) and the ratio of CD8+ to Treg cells (Figure 7E). We also analyzed the amount of cyto-
kines in supernatants of whole-tumor slices derived from these experiments. Results show that the
combination therapy led to an increase in TNFa and RANTES, supporting further the increase of T
cell activation and infiltration and activation in this condition (Figure 7F–G). In both BAPN and
BAPN combined with anti-PD-1 conditions, we observed an increase of GrzmB+ levels compared to
the control condition (Figure 7H). Of note, BAPN and anti-PD-1 alone also showed a similar ten-
dency for an increase in TNFa and RANTES, which prompted us to study the consequences of these
treatments on the intratumoral T cell motility. Consistent with the data in Figure 5, LOX inhibition
leads to an increase in T cell displacement within the KPC tumor (Figure 7—figure supplement 1F).
We also found that PD-1 blockade alone produced a similar increase in T cell motility, whereas the
combination therapy showed the same effects as treatments alone (Figure 7—figure supplement
1F).
Overall, while ECM and stiffness normalization achieved through LOX inhibition increases T cell
infiltration and migration, this strategy also improves the efficacy of anti-PD-1 blockade on tumor
growth.
Discussion
Despite the success of targeting the stromal compartment in tumors (Mariathasan et al., 2018;
Salmon et al., 2012; Caruana et al., 2015; Chen et al., 2019; Incio et al., 2015; Elahi-
Gedwillo et al., 2019), in particular tumor ECM, there are still a series of challenges that remain to
be addressed. In the first part of this study, we tackle two of these challenges. One of them is find-
ing ways to accurately assess the architecture of the stroma. In this paper, we propose a thorough
analysis combining non-invasive imaging techniques for a macroscopic characterization of tumor
stiffness with advanced microscopy techniques to elucidate the collagen network structure, one of
the most important components of the tumor ECM. Previous studies had already explored the link
between tumor stiffness and collagen architecture (Venkatesh et al., 2008; Samani et al., 2007;
Nicolas-Boluda et al. eLife 2021;10:e58688. DOI: https://doi.org/10.7554/eLife.58688 13 of 29Research article Cancer Biology Figure 7. LOX inhibition increases the efficiency of anti-PD-1 therapy in KPC tumor model. (A) Tumor volume fold change after combination therapy of BAPN with anti-PD-1. n = 8 mice/group from two independent experiments. (B) CD11b+, Ly6G+, Ly6C+PMN/mg of tissue. (C) CD64+F4/80+MHCII +TAMs/mg of tissue. (D) CD8+ T cells/mg tissue. (E) CD8+ to FoxP3+Treg ratio. (F–H) Multiplex analysis of inflammatory chemokines (TNFa, RANTES, and GrzmB) produced by fresh KPC tumor slices kept in culture for 18 hr (*** p-value
Research article                                                                                                 Cancer Biology

                                   tumor model (EGI-1) has an extensive stromal compartment well separated from tumor islets, which
                                   is a typical feature of desmoplastic tumors. Likewise, the KPC tumor model has also typical segrega-
                                   tion of ECM and tumor nests and reproduces many of the key features observed in human PDAC
                                   including a stiff tumor and an exclusion of T cells from tumor islets. The orthotopic mPDAC model
                                   also contains very few T cells, although tumors are less stiff than the previous two models. The spon-
                                   taneous MMTV-PyMT model is relevant with respect to human breast carcinoma as tumors devel-
                                   oped in four stages (hyperplasia, adenoma/mammary intraepithelial neoplasia, and early and late
                                   carcinoma) (Lin et al., 2003). As a result, the architecture of MMTV-PyMT tumors resembles that of
                                   human breast cancers. On the other hand, the MET-1 model only contains thin stromal compart-
                                   ments and unlike the previous models, tumors are not very stiff, probably reflecting a specific sub-
                                   type of human breast cancers. Once the tumor structure and mechanical properties of each model
                                   were characterized, an ECM-targeting therapy dependent on LOX inhibition with BAPN was tested.
                                   Previous studies performed by Levantal et al. in a spontaneous mouse model of breast carcinoma
                                   showed that LOX inhibition induces structural changes in the collagen network (Levental et al.,
                                   2009). Here, we confirm and extend these results in other models and provide multiscale insights
                                   about different effects of LOX inhibition from model to model, including stiffness measurements at
                                   the tissue level. Whilst for cholangiocarcinoma (EGI-1) and pancreatic adenocarcinoma models (KPC
                                   and mPDAC), LOX inhibition drastically decreases tumor stiffness, this effect is less marked in the
                                   breast adenocarcinoma model (MMTV-PyMT). Although collagen fiber curvature was affected in all
                                   models, changes in fiber orientation were only significant in KPC and mPDAC models. These
                                   changes can be explained by the fact that the tumor microenvironment and thus the basal collagen
                                   structure in each tumor model is different; hence, the inhibition of collagen crosslinking modifies the
                                   tumor collagen network to different extents. This emphasizes the need of developing reliable diag-
                                   nostic markers, such as SWE stiffness mapping, based on a clear understanding of the tumor colla-
                                   gen network, in order to predict the response to ECM-targeting strategies.
                                       In this study, LOX inhibition was performed in a preventive setting. We assume that it is during
                                   early tumor stages and the construction of fibrous stroma that LOX activity is the highest. In estab-
                                   lished tumors, with stroma having a significant level of crosslinked collagen, LOX inhibition would
                                   have a more marginal effect. Although not dealing with anti-PD-1 treatment, several articles are con-
                                   sistent with the notion that LOX inhibition is more effective in early tumor stages (Nilsson et al.,
                                   2016; Miller et al., 2015). For example, blocking LOX in combination with gemcitabine reduced
                                   metastases and increased survival of the mice when treatment was started in the early stages of the
                                   disease, but not at later stages (Miller et al., 2015).
                                       It is well established that the number of T cells found within a tumor as well as their ability to
                                   migrate and reach cancer cells is key for an effective antitumoral response. These last few years a lot
                                   of efforts have been made in identifying cells and factors controlling the migration of T cells within
                                   tumors. The notion that prevailed is that growing tumors are composed of cells and factors, such as
                                   macrophages and hypoxia, hostile for T cells to migrate (Peranzoni et al., 2018; Manaster et al.,
                                   2019). The importance of the ECM in controlling the distribution and migration of T cells in tumors
                                   has also emerged. In human lung and ovarian tumors we found that T cells preferentially accumulate
                                   and migrate in stromal regions that exhibited a loose matrix architecture but not in dense regions
                                   (Salmon et al., 2012; Bougherara et al., 2015). Likewise, in aged skin, dermal fibroblasts harbor a
                                   phenotype similar to CAFs and produce ECM matrices that limit T cell displacements (Kaur et al.,
                                   2019). However, in triple-negative breast cancers and in pancreatic tumors, T cells were still found in
                                   dense networks of collagen fibers (Li et al., 2019; Carstens et al., 2017). Since most of the afore-
                                   mentioned studies were correlative, we decided in this study to specifically alter the ECM network
                                   by LOX inhibition and investigated the consequences on T cell motile behavior. Our results con-
                                   firmed the importance of the ECM and tissue stiffness in controlling the migration of T cells in
                                   tumors. In particular, enhancements of T cell displacements were noticed in all tumor models under
                                   LOX inhibition. When we extended our analysis at the level of the individual mouse, we found that T
                                   cell intratumoral motility was inversely correlated to tumor stiffness as measured non-invasively using
                                   SWE (Figure 6), and this was true in all tested models. However, this relationship is not linear. In
                                   most models, T cells strongly decelerate when a threshold in stiffness is reached. In soft tumors such
                                   as those induced by LOX inhibition, T cells manage to migrate. Conversely, in stiff non-treated con-
                                   trol tumors, T cell migration is impeded. These data fit well with results obtained in vitro in a range
                                   of 3D collagen matrices showing that T lymphocytes have the ability to adapt their morphology to

Nicolas-Boluda et al. eLife 2021;10:e58688. DOI: https://doi.org/10.7554/eLife.58688                                              15 of 29
Research article Cancer Biology
the structure of the tissue up to a certain limit (Wolf et al., 2013). In dense collagen matrices, T cell
motility is halted. Our analysis supports the idea that elastography measurements could provide
valuable companion markers to evaluate the need for anti-stromal strategy in order to normalize
tumor stiffness and consequently improve T cell migration.
In this study, we did not take into consideration the possible effects of LOX inhibition on other
determinants that could either positively or negatively regulate T cell migration. Along with tumor
ECM, other cells and factors play important roles in controlling T cell migration. Hence, PD-1 block-
ade that does not affect collagen structure increases T cell migration within tumors (Figure 7—fig-
ure supplement 1F). It is well established that anti-PD-1 treatment is associated with the production
of IFNg and inflammatory chemokines (e.g. CXCL10) that are presumably responsible for enhancing
T cell motility in tumors (Peng et al., 2012). A number of studies have shown that fibrotic tumors
are, at the same time, enriched in cells and factors that are known to impede T cells from migrating
(e.g. hypoxia and tumor-associated macrophages) (Manaster et al., 2019; Maller et al., 2021;
Deligne et al., 2020). Therefore, a reduction in ECM content might normalize the tumor stroma ren-
dering it more prone to stimulate T cell migration. The data in Figure 7 showing a decrease in PMN
and Treg and an increase in MHC class II + macrophages upon BAPN treatment support this
assumption.
As for possible effects of LOX inhibition on tumor blood vessels, previous studies have reported
reduced angiogenesis after LOX and LOX-like protein inhibition and an increased perfused vessel
density in the case of overexpression of LOX (Baker et al., 2013; Zaffryar-Eilot et al., 2013). This
could partly explain why we observe a significant increase in T cell infiltration in KPC tumors upon
BAPN treatment. However, other recent studies argue the opposite as an increase in collagen cross-
linking and matrix stiffness resulted in an increase in angiogenic sprouting. Conversely, the inhibition
of collagen crosslinking in tumors resulted in reduced vascular density and permeability
(Bordeleau et al., 2017).
Given the low efficacy of T cell-based immunotherapies in solid tumors, any method to increase
its effect on tumor regression is of interest. With the exception of desmoplastic melanomas
(Eroglu et al., 2018), features of wound healing and fibrosis are usually detrimental to anti-PD-1
responses (Hugo et al., 2016). Accordingly, a number of anti-fibrotic strategies have been recently
implemented in combination with immune checkpoint inhibitors (Jiang et al., 2017). One of the
most promising targets appears to be TGFb. In preclinical mouse tumor models, TGFb inhibition
with immune checkpoint blockade induces complete and durable responses in otherwise unrespon-
sive tumors (Mariathasan et al., 2018; Tauriello et al., 2018). However, due to TGFb pleiotropic
effects, concerns regarding the blockade of this cytokine arose.
Our study indicates that LOX represents another valuable target as its inhibition in the trans-
planted KPC model increases the efficacy of anti-PD-1 treatment, while monotherapy with either
agent alone is ineffective. Moreover, the combination treatment was associated with a tumor micro-
environment shifted toward antitumoral effector cells and components, whereas immunosuppressive
cells were reduced.
Although the clinical use of BAPN has been impeded by concerns regarding toxicities, other strat-
egies to inhibit LOX in cancer and fibrotic disease patients are currently ongoing (Lampi and Rein-
hart-King, 2018). Our work confirms LOX as a molecular target to improve T cell migration
dynamics as well as to ameliorate the immunosuppressive microenvironment. It paves the way for
clinical trials combining LOX inhibitors with PD-1/PD-L1 blockade, possibly in biomarker-selected
cohorts of patients with high tumor stiffness evaluated with non-invasive imaging approaches such
as SWE.
Materials and methods
Key resources table
Reagent type
(species) or Source or Additional
resource Designation reference Identifiers information
Continued on next page
Nicolas-Boluda et al. eLife 2021;10:e58688. DOI: https://doi.org/10.7554/eLife.58688 16 of 29Research article Cancer Biology
Continued
Reagent type
(species) or Source or Additional
resource Designation reference Identifiers information
Strain, strain FVB/N Janvier Labs FVB/N
background
(M. musculus)
Strain, strain C57Bl/6J Janvier Labs C57Bl/6J
background
(M. musculus)
Strain, strain MMTV-PyMT Guy et al., 1992 Spontaneous
background mammary carcinoma
(M. musculus) mouse model
Strain, strain NMRI-nu (nu/nu) Envigo NMRI nude HsdCpb:NMRI-Foxn1nu
background
(M. musculus)
Cell line EGI-1 German Collection of ACC385 Human bile duct
(Homo-sapiens) Microorganisms and carcinoma cell line
Cell Cultures
Cell line KPC Kind gift from Corinne Cell line derived from
(M. musculus) Bousquet, Université a pancreatic tumor
Toulouse III obtained
from KrasLSL_G12D,
Trp53R172H/+ mice.
Cell line mPDAC Kind gift from Cell line derived from
(M. musculus) Douglas Hanahan, a pancreatic tumor
Swiss Institute for obtained from
Experimental KrasLSL_G12D;
Cancer Research Trp53R172H/+,
Cdkn2a /+mice.
Cell line MET-1 Kind gift from Robert Cell line derived
(M. musculus) Cardiff, the University from a mammary
of California carcinoma
Research in FVB/N-Tg (MMTV-PymT).
(Borowsky et al., 2005)
Antibody Anti-CD11b (monoclonal Biolegend 101201 (10 mg/mL)
rat anti-mouse/human, RRID:AB_312784
clone M1/70)
Antibody Anti-CD11c (monoclonal Biolegend 117333 (10 mg/mL)
rat anti-mouse, clone RRID:AB_11204262
N418)
Antibody Anti-CD45 (monoclonal Biolegend 103127 (10 mg/mL)
rat anti-mouse, RRID:AB_493714
clone 30-F11)
Antibody Anti-Ly6C (monoclonal Biolegend 128025 (10 mg/mL)
rat anti-mouse, clone RRID:AB_10643867
HK1.4)
Antibody Anti-Ly6G (monoclonal Biolegend 127633 (10 mg/mL)
rat anti-mouse, 1A8) RRID:AB_2562937
Antibody Anti-CD4 (monoclonal BD Biosciences 563050 (10 mg/mL)
rat anti-mouse, RRID:AB_2737973
clone GK1.5)
Antibody Anti-CD8a (monoclonal eBioscience 46-0081-82 (10 mg/mL)
rat anti-mouse, RRID:AB_1834433
clone 53–6.7)
Antibody Anti- TCRb (monoclonal BD Biosciences 562840 (10 mg/mL)
hamster anti-mouse, RRID:AB_2687544
clone H57-597)
Antibody Anti-Nkp46 (monoclonal eBioscience 50-3351-82 (10 mg/mL)
rat anti-mouse, RRID:AB_10598664
clone 29A1.4)
Continued on next page
Nicolas-Boluda et al. eLife 2021;10:e58688. DOI: https://doi.org/10.7554/eLife.58688 17 of 29Research article Cancer Biology
Continued
Reagent type
(species) or Source or Additional
resource Designation reference Identifiers information
Antibody Anti-PD-1 (monoclonal Biolegend 135221 (10 mg/mL)
rat anti-mouse, RRID:AB_2562568
clone 29F.1A12)
Antibody Anti-MHC II Biolegend 107645 (10 mg/mL)
(monoclonal rat RRID:AB_2565977
anti-mouse, clone
M5/114.15.2)
Antibody Anti-CD80 (monoclonal Biolegend 104705 (10 mg/mL)
hamster anti-mouse, RRID:AB_313126
clone 16-10A1)
Antibody Anti-CD64 (monoclonal Biolegend 139303 (10 mg/mL)
mouse anti-mouse, RRID:AB_10613467
clone X54-5/7.1)
Antibody Anti-CD206 (monoclonal Biolegend 141721 (10 mg/mL)
rat anti-mouse, RRID:AB_2562340
clone CO68C2)
Antibody Anti-F4/80 (monoclonal BIO-RAD MCA497SBV670 (10 mg/mL)
rat anti-mouse, clone RRID:AB_323806
CI:A3-1)
Antibody Anti-FoxP3 (monoclonal Biolegend 126405 (10 mg/mL)
rat anti-mouse, clone MF-14) RRID:AB_1089114
Antibody Anti-GrzmB (monoclonal Biolegend 372207 (10 mg/mL)
rat anti-mouse, RRID:AB_2687031
clone QA16A02)
Antibody Anti-Fibronectin Acris Antibodies AM00389AF-N (10 mg/mL)
(monoclonal mouse RRID:AB_981328
anti-human/mouse,
clone HFN7.1)
Antibody Anti-Podoplanin Biolegend 127407 (10 mg/mL)
(monoclonal Hamster RRID:AB_2161929
anti- mouse, clone 8.1.1)
Antibody Anti-EpCAM Biolegend 324219 (10 mg/mL)
(monoclonal mouse RRID:AB_11124342
anti-human, clone 9C4)
Antibody Anti-EpCAM (monoclonal Biolegend 118225 (10 mg/mL)
rat anti-mouse, clone G8.8) RRID:AB_2563983
Antibody Anti-PD-1 (monoclonal BioXcell BE0146 (200 mg)
rat anti-mouse, RRID:AB_10949053
clone RMP1-14)
Peptide, Human IL-7 Miltenyi Biotec 130-095-361
recombinant
protein
Peptide, Human IL-15 Miltenyi Biotec 130-095-762
recombinant
protein
Commercial Milliplex map Mouse Merck Millipore MCYTOMAG-70K
assay or kit cytokine/chemokine
detection
Commercial Human CD8 + T Cell Stemcell 17953
assay or kit Isolation Kit technologies
Commercial CD8a + T Cell Isolation Miltenyi Biotec 130-104-075
assay or kit Kit, mouse
Commercial Human T cell Miltenyi Biotec 130-111-160
assay or kit activation kit,
TransAct
Continued on next page
Nicolas-Boluda et al. eLife 2021;10:e58688. DOI: https://doi.org/10.7554/eLife.58688 18 of 29You can also read