Unlocking the potential of Google Earth as a tool in invasion science
←
→
Page content transcription
If your browser does not render page correctly, please read the page content below
Biol Invasions (2014) 16:513–534
DOI 10.1007/s10530-013-0604-y

 ORIGINAL PAPER

Unlocking the potential of Google Earth as a tool in invasion
science
Vernon Visser • Barbara Langdon •
Anı́bal Pauchard • David M. Richardson

Received: 22 January 2012 / Accepted: 14 September 2013 / Published online: 8 December 2013
Ó Springer Science+Business Media Dordrecht 2013

Abstract Distribution data are central to many                  for gathering data on the distribution and abundance of
invasion science applications. The shortage of good             invasive alien trees using visual interpretation of
information on the distribution of alien species and            Google Earth imagery, and propose how these data
their spatial dynamics is largely attributable to the           may be used for a number of purposes, including
cost, effort and expertise required to monitor these            calculating useful metrics of invasions, prioritising
species over large areas. Virtual globes, particularly          species or areas for management and predicting
Google Earth, are free and user-friendly software               potential distributions of species. We also suggest
which provide high-resolution aerial imagery for the            various practical uses of Google Earth, such as
entire globe. We suggest this has enormous potential            providing a tool for early detection of emerging
for invasion science. We provide suggestions and tools          invasions, monitoring invasions over time, and to help
                                                                researchers and managers identify suitable field study
                                                                sites. Virtual globes such as Google Earth are not
                                                                without limitations and we provide guidance on how
                                                                some of these can be overcome, or when imagery from
                                                                Google Earth may not be fit for invasion science
Electronic supplementary material The online version of         purposes. Because of Google Earth’s huge popularity
this article (doi:10.1007/s10530-013-0604-y) contains supple-   and ease of use, we also highlight possibilities for
mentary material, which is available to authorized users.
                                                                awareness-raising and information sharing that it
V. Visser (&)  D. M. Richardson                                provides. Finally, we provide the foundations and
Department of Botany and Zoology, Centre for Invasion           guidelines for a virtual global network of sentinel sites
Biology, Stellenbosch University, Matieland 7602, South
                                                                for early detection, monitoring and data gathering of
Africa
e-mail: vernonvisser@sun.ac.za                                  invasive alien trees, which we propose should be
                                                                developed as part of a ‘‘citizen science’’ effort. There
B. Langdon  A. Pauchard                                        has been limited use of virtual globes by invasion
Facultad de Ciencias Forestales, Universidad de
                                                                scientists and managers; it is our hope that this paper
Concepción, Concepción, Chile
                                                                will stimulate their greater use, both within the field of
B. Langdon  A. Pauchard                                        invasion science and within ecology generally.
Institute of Ecology and Biodiversity (IEB), Casilla, Chile
                                                                Keywords Early detection  Biological
B. Langdon
Bioforest S.A., Camino a Coronel km 15 s/n, Coronel,            invasions  Google Earth  Monitoring  Remote
Chile                                                           sensing  Tree invasions  Sentinel sites

                                                                                                               123
514 V. Visser et al.
Introduction there is no systematic, low-cost protocol for measuring
the distribution and spatial arrangement of tree
An ever increasing number of species are being invasions at different scales that managers and scien-
moved, both intentionally and unintentionally, by tists can use (Wilson et al. 2014). Field observations
humans from their natural ranges to distant locations are time-consuming and expensive and are therefore
(Levine and D’Antonio 2003). Species that success- usually only practical over small geographical areas
fully establish in these new locations can be problem- (Mumby et al. 1999; Kotzé et al. 2010). Aerial
atic because they can alter the structure and photographs and remote-sensing products (obtained
functioning of ecosystems (van Wilgen et al. 2008). directly from the satellite data providers) have the
Some invasive species lead to a loss of biodiversity benefits of being able to cover much larger areas,
and ecosystem services (Perrings et al. 2005), and being more easily repeatable, and much cheaper than
ultimately to substantial economic costs (Pimentel field observations. However, if aerial photographs are
et al. 2000; Le Maitre et al. 2002). Trees represent a obtained from flight surveys for specific research
special case of invasive alien species for a number of projects or obtained from government or commercial
reasons: alien trees were often intentionally intro- institutions that fly aerial surveys, or if remote-sensing
duced for horticultural or forestry purposes (Richard- products are obtained directly from the satellite data
son and Rejmánek 2011); there are often major providers, they are often expensive to purchase,
conflicts of interest in the growing of alien trees e.g. require a high level of expertise to format and analyse,
many commercially important species are also inva- and sometimes require software and hardware that are
sive species (Richardson and Rejmánek 2011; van beyond the budgets of managers and scientists,
Wilgen and Richardson 2012); and alien tree invasions especially in developing countries (Underwood et al.
are among the most costly invaders to manage because 2007). Invasion scientists, managers and organisations
trees generally produce high biomass and they impact with limited resources and technical expertise, there-
on ecosystem services such as water provision where fore, would benefit from a simple and cheap method to
they invade grasslands and shrublands (Richardson conduct assessments of IAT distributions and aspects
1998; van Wilgen et al. 2001; Le Maitre et al. 2002; of their spatial ecology. Knowledge of IAT distribu-
van Wilgen and Richardson 2012). tions and abundance can be useful for measuring
There is therefore considerable interest in being ecosystem impacts, determining areas with a high risk
able to assess the distribution of invasive alien trees of invasion, planning IAT management, monitoring
(IATs). Distribution data are crucial for many aspects invasions over time, early detection of new alien tree
of invasion science including the prioritisation of areas invasions and for raising public awareness of IAT
and species for management (e.g. Roura-Pascual et al. impacts.
2010), identifying areas that are most vulnerable to Virtual globes provide free aerial imagery (aerial
invasion (Thuiller et al. 2005), calculating rates of photography and/or satellite imagery), which is
spread and detailing distribution patterns to under- formatted and stitched together to build a 3D model
stand invasion dynamics and plan effective interven- of the world that users can navigate in ‘‘virtual reality’’
tions (Higgins et al. 2001; Osunkoya et al. 2012), and (Butler 2006; Yu and Gong 2012). Virtual globes have
identifying environmental and anthropogenic factors several advantages over most traditional 2D GIS
associated with invasions (Castro-Dı́ez et al. 2011; software, including the fact that they are generally
Gallagher et al. 2011). Because of their size, trees are free, their ease of use, their limited need for local data
generally easier to map than most other groups of storage, better visualisation of geographic data (par-
invasive species, especially when they invade (as they ticularly of large datasets), and their capacity to
often do; Rundel et al. 2014) previously treeless communicate and share information with the public
vegetation. Despite this advantage, accurate distribu- and the scientific community (Stensgaard et al. 2009;
tion data for invasive trees are difficult to acquire Goodchild et al. 2012; Yu and Gong 2012). Most
because, to date, they have either been sourced from virtual globes share a number of other features,
field observations (e.g. Chytrý et al. 2009) or from including the capacity for users to add and share their
aerial products such as photographs or remote-sensing own data, tools for distance and area measurement,
products (Huang and Asner 2009). Unfortunately, visualising topography, etc. (Yu and Gong 2012).
123Unlocking the potential of Google Earth 515
A number of virtual globes currently exist, including way of three case studies. We also address some of the
Google Earth (http://www.google.com/earth/index. limitations of GE for mapping and monitoring tree
html), NASA World Wind (http://worldwind.arc. invasions, and suggest how they might be overcome.
nasa.gov), ArcGIS Explorer (http://www.esri.com/ We expect that by promoting this low-cost, simple
software/arcgis/explorer/index.html) and many oth- approach to tree-invasion mapping, managers and
ers (see references in Yu and Gong 2012). Google scientist across the globe will be able to start collecting
Earth (GE), launched in June 2005, is by far the most data of invasion processes that would otherwise have
widely-used virtual globe (Yu and Gong 2012) and, not been spatially and quantitatively assessed.
consequently, will be the focus of this paper. However,
it should be noted that many of the features of GE
highlighted in this paper will equally apply to other A brief note on Google Earth imagery
virtual globes. The popularity of GE is probably due to
its ease of use (Stensgaard et al. 2009; Goodchild et al. Google Earth, as commercial software, is ‘‘targeted for
2012; Yu and Gong 2012), stability (Aurambout and a mass market audience, and the key drivers are
Pettit 2008), and the ability to import, overlay and market share and advertising revenue, rather than to
visualise geographic data by converting to Keyhole advance research’’ (Yu and Gong 2012). Probably as a
Markup Language (KML) file format (Stensgaard result, very little documentation is provided for almost
et al. 2009; Goodchild et al. 2012; Yu and Gong 2012). all aspects of imagery acquisition and manipulation
KML has become the standard format for virtual (e.g. who provides images and for where, how often
globes, with conversion to this format possible in images are updated, how images are manipulated,
software such as ArcGIS (ESRI 2009) and the R sta- etc.), often making it more difficult for scientists to use
tistical package (R Development Core Team 2013). GE as a scientific tool. Below we discuss a number of
The popularity and utility of GE is possibly also due to important features of GE imagery that we feel a
the availability of high-resolution imagery (0.5 m scientific user should be aware of. Firstly, georefer-
GeoEye and 4 m IKONOS; http://www.geoeye.com; encing or orthorectification of images in GE is
although many regions of the world only have imagery currently not entirely accurate, which causes posi-
with a resolution of 15 m; Landsat; http://landsat.usgs. tional accuracy errors (Potere 2008; Benker et al.
gov; Potere 2008), and because there are often images 2011; Yu and Gong 2012). Coordinates obtained from
for multiple dates available for any given location (GE imagery in GE have been found to be as far as 171.6 m
provides images from a number of data providers, and away from their actual location (in the horizontal
many of these are continuously-updated satellite plane), although horizontal positional accuracies were
images; Table S1). GE has been widely used by found to be much better in developed countries
ecologists, geographers, social scientists, palaeontol- (24.1 m root-mean-squared error) than in developing
ogists and geologists for a wide range of tasks (e.g. countries (44.4 m root-mean-squared error; Potere
mapping bird nests (Hughes et al. 2011), assessing the 2008), and have been found to be as accurate as 2.64 m
magnetic alignment of cattle and deer (Begall et al. root-mean-squared error in the Big Bend region of
2008), verifying a global map of rain-fed croplands Texas, USA (Benker et al. 2011). Secondly, the spatial
(Biradar et al. 2009), measuring the quality of public resolution of images is not only dependent on the
parks (Taylor et al. 2011), mapping landslides after spatial resolution of the original image, but also on the
earthquakes (Sato and Harp 2009) and for disaster zoom level i.e. the altitude from which one views an
management and response (e.g. http://giscorps.org)), image. Currently GE limits the maximum number of
but its potential as part of a toolbox for studying the pixels a user can download to 1000 pixels (Google
full suite of spatial dimensions of phenomena such as Earth User Guide 2013). This means that only when a
biological invasions has yet to realized. user is zoomed into a relatively small area will they be
The aim of this paper is to illustrate the utility of GE able to save an image at the resolution of the original
as a tool in invasion science, particularly for under- image. Thirdly, GE images only have three spectral
standing the dynamics of tree invasions. We highlight bands (red, green and blue), even if the original
a number of the possible uses of GE as a tool for imagery had more bands (e.g. GeoEye, which also has
studying tree invasions and illustrate these uses by a near-infrared band), and these bands have also been
123516 V. Visser et al.
manipulated to improve the appearance of the image, world). This suggests that it might be possible to
but the manner in which this is done is unknown and delineate the presence of IATs using GE imagery, as
unpublished (Google Earth Blog 2009). Fourthly, very we discuss below in relation to the resolution of the
little metadata, other than the name of the image imagery available.
provider and the date the image was taken, are Two approaches for delineating IAT presence using
available for GE images. Metadata for SPOT and high spatial resolution imagery are possible: using
DigitalGlobe images can be found using the informa- classification algorithms or visual interpretation. Clas-
tion from the layers provided in the ‘‘Layers panel’’ sification algorithms rely on spectral and pattern
under the section labelled ‘‘More’’. SPOT metadata information to group pixels into different categories,
are provided in a balloon for each image, and for one or some of which will hopefully correspond to the
DigitalGlobe imagery taken between 2002 and 2010 alien species one is trying to detect (Lass et al. 2005),
one can obtain the ‘‘Catalog ID’’ for an image and However, even the original, unformatted imagery
consult the DigitalGlobe ImageFinder (https://browse. often only provides limited success for automatic
digitalglobe.com/imagefinder/main.jsp?) to obtain all detection of IATs (Huang and Asner 2009), or is only
the metadata. Alternatively, for DigitalGlobe images successful when the species of interest occurs in large
taken before 2002 or after 2010, one can use the stands, has unique phenological patterns, and has high
DigitalGlobe Google Earth Search Service (http:// spatial and spectral resolution (Huang and Asner
geofuse.geoeye.com/landing/google-earth/) to find 2009). For these reasons, and because the imagery
images and their associated metadata. Finally, the currently available in GE has been manipulated (as
availability of GE imagery for different dates, and the described earlier, imagery has low spectral resolution,
spatial resolution of these images, varies considerably and due to GE’s limitations on the number of pixels
around the world. For the 11 sites from Supplementary one can save in an image, it is difficult to acquire high
files 1 and 3 with alien tree invasions that are visible in spatial resolution imagery for large areas), GE imag-
GE, we found that all sites had a minimum of three ery is of limited value for delineating the presence of
images of different dates, and image spatial resolution IATs using classification algorithms.
generally improved over time, with most sites having Visual interpretation relates visual characteristics
1.65 m spatial resolution GeoEye-1 imagery (Table of images, such as colour, texture, shape, size, shadow,
S1). However, sites in the developed world (USA and pattern, site, height and association, to real-world
Australia) generally had more images than sites in the objects on the ground (Joseph 2005). Although visual
developing world, and spatial resolution of images interpretation is time-consuming, and interpretation
was often as good for the oldest images as the newest can vary between individuals, humans are able to
images, because these were aerial photographs (Table integrate all the above-mentioned visual characteris-
S1). These issues have important implications for the tics and make deductions in ways that are currently
possible uses of GE for studying and monitoring tree impossible for any algorithm (Joseph 2005). Visual
invasions, as we discuss in the sections below. interpretation to delineate the presence of IATs can be
aided by plant phenology (e.g. bright flowers at a time
of year when other species are not flowering), unique
Possible uses of GE imagery for the study of tree spatial patterns of how an IAT occupies the landscape,
invasions and large monospecific stands of an IAT (Huang and
Asner 2009). Visual interpretation of GE imagery can
Mapping tree invasions be enhanced by a number of tools. For example, the
polygon tool allows users to manually delineate
Several efforts have been made to delineate the canopy boundaries and save these in Keyhole Markup
presence of IATs using moderate (10–100 m) and Language (KML) format, the native format of GE.
high (\10 m) spatial resolution imagery (see Huang Alternatively, the placemark tool allows users to
and Asner 2009 for a recent review), some of which pinpoint the coordinates of individual trees, also with
are also available in a formatted form in GE (see Table the ability to save these in KML format. The capability
S1 for a census of imagery sources and spatial of viewing imagery from different dates also aids
resolution at notable tree invasion sites around the in IAT canopy delineation. Trees are generally
123Unlocking the potential of Google Earth 517
long-lived and the same individuals will consequently trees or stands of alien trees difficult when these co-
often be visible in images acquired on a different date. occur with other vegetation types. As a rule of thumb,
Therefore, a tree that is indistinct in one image (e.g. users might reliably only attempt visual interpretation
due to shadows or poor image resolution), may be when imagery is provided by DigitalGlobe or one of
more visible in an image acquired on a different day. the other high-resolution imagery providers to GE (see
While moderate spatial resolution imagery (e.g. Table S1). GE is continuously updating its image
Landsat, SPOT and ASTER) is of too low resolution to coverage, slowly reducing low-resolution gaps. Other
delineate individual trees, it can be used to map IAT issues, such as cloud cover and plant phenology
canopy cover in certain circumstances. Canopy cover (seasonality of image capture), may also limit tree
is defined as ‘‘the proportion of the forest floor covered recognition and mapping, and may be more problem-
by the vertical projection of the tree crowns’’ i.e. for an atic in certain regions. Field verification of IAT
individual tree, canopy cover is the area on the ground presence will be necessary when using visual inter-
that is encompassed by the boundaries that are pretation of GE imagery, at least for a subset of the
vertically below the outer edge of the tree canopy area(s) studied, and will logically be required for all of
(Jennings et al. 1999). Moderate spatial resolution the other applications of GE that we suggest below
imagery (including free Landsat imagery) has been (other than #5, ‘‘Sharing information online with other
successfully used to map landscape-scale changes in users and promoting global networking’’), as they are
tree (not necessarily alien) canopy using a variety of all dependent on IAT distribution information.
indices calculated using information from different Delineating the distribution of individual IATs and
spectral bands (e.g. Breshears et al. 2005; Bradley and mapping IAT canopy cover can have a number of
Fleishman 2008; Huang et al. 2009; Becker et al. important applications. Canopy cover is a good
2013), suggesting that similar approaches could work estimate of species abundance and biomass and,
with the same or similar-resolution imagery from GE. therefore, it can also be used as a crude metric for
However, the low spectral resolution of GE imagery, indicating the magnitude of ecosystem impacts for
and the lack of information on how the spectral species recognized as ecosystem engineers such as
information has been manipulated, probably limits Acacia species and pines (Richardson and Rejmánek
opportunities for using such approaches. Visual inter- 2011). Such data are increasingly required to prioritize
pretation, therefore, seems to be the more appropriate areas for management intervention (Roura-Pascual
approach for estimating IAT canopy cover with et al. 2009). Spatial information about IATs can have
moderate spatial resolution imagery from GE. Using other useful applications for science and management.
visual interpretation of GE imagery, canopy cover can Locations of individual IATs can be used to extract
either be estimated by the area of the polygon used to data for hypothesised drivers of IAT presence from
delineate the canopy boundary, or if canopy bound- spatially-referenced layers within a GIS environment.
aries are indistinct, a grid with a resolution smaller These can be used to test whether the presence of an
than the average canopy size can be projected onto a invasive species is associated with any environmental
GE image and canopy cover can be estimated by the or anthropogenic factors (e.g. Alston and Richardson
number of grid cells the canopy is seen to occupy. 2006). Alternatively, these can be used to make
Stand canopy cover would logically be the sum of predictions of habitat suitability for an IAT species,
individual tree canopy covers within a predefined area. including niche modelling, which can be used for
We have suggested how one might use visual locating areas with a high risk of invasion or priori-
interpretation to delineate individual IATs or IAT tising management of IATs (Richardson and Thuiller
canopies from moderate and high spatial resolution 2007). It should, however, be noted that due to the
GE imagery. However, visual interpretation is not positional errors of GE imagery described earlier, the
always an easy task, especially when trees are visually exact locations of polygons and placemarks repre-
similar to the natural, dominant vegetation (e.g. alien senting IATs may not be entirely accurate. This is not
trees in a temperate, broadleaf forest (Boschetti et al. necessarily problematic for the applications men-
2007), or Acacia trees in a low shrubland (Stow et al. tioned above, as IAT canopy cover is a relative
2000). Furthermore, image resolution and quality is measure, and the other applications (e.g. niche mod-
highly variable in GE making detection of individual elling) generally rely on coarse resolution
123518 V. Visser et al.
environmental datasets, which have resolutions far distance tool in GE, or by exporting the polygons or
greater than the positional inaccuracies of GE imagery placemarks representing identified IAT individuals,
(e.g. kilometres for the former, but hundreds of metres and using tools available in a GIS environment. The
for the latter). However, if the intended use of the IAT relative abundance of an alien species and spatial
location data generated using visual interpretation of pattern metrics such as the degree of aggregation will
GE imagery requires high spatial accuracy, one could require the exporting of polygons representing iden-
attempt to manually georeference the GE image in GIS tified individual IATs to software such as (R Devel-
software beforehand. One can use objects with known opment Core Team 2013). We illustrate how this
locations (e.g. roads) to georeference an image, but might be achieved in our case studies. All of the
this will require having enough locations with precise abovementioned metrics are, however, dependent on
coordinates (which may not always be possible), and the positional accuracy of GE imagery, as described
having such points evenly distributed across the area earlier, and manual georeferencing of the imagery
of interest. We illustrate how this might be done in our may be necessary.
second case study.
Monitoring tree invasions
Measuring specific metrics of invasions
With the availability of imagery for different dates,
A number of useful metrics rely on knowing either the and the promise of future imagery in GE (from
distribution or abundance of an alien species (Wilson satellites such as GeoEye-1), tree invasions can be
et al. 2014). The distance an alien species has spread spatially monitored over time. The rate of change in
from a source population can be useful for determining IAT canopy cover can be used for prioritising
whether the invasion process has progressed to a stage management efforts (Maxwell et al. 2009) and for
at which recruitment is occurring outside of the parent understanding the factors contributing to invasiveness
population, at which time the invasion process is (Rouget and Richardson 2003), and is easily estimated
increasingly driven by propagule pressure of invading if suitable imagery is available for more than one date
metapopulations (Rouget and Richardson 2003) and in GE. Spread distances measured for more than one
becomes much more difficult to manage (Higgins et al. date can be used to calculate rates of spread, and this
2000; Langdon et al. 2010). The relative abundance of can be related to various characteristics of the invasive
an alien species has been proposed as a useful metric species, such as its residence time and morphological
for identifying dominant alien species, environments traits, to develop predictions of problematic species in
that are heavily invaded and/or susceptible to invasion, the future (Ahern et al. 2010). It may also be possible,
and for predicting the progress of an invasion (Catford in some instances, to identify combinations of envi-
et al. 2012). In addition to abundance, the spatial ronmental factors that trigger particular invasion
pattern of invasive plant populations has been shown events by observing when an IAT species first spreads
to influence invasion progress (Higgins et al. 2001); beyond the boundaries of its source population
metrics such as the degree of aggregation, which can (Becker et al. 2013; Robinson et al. 2008). Multiple
be calculated from mapping individual trees, have observations, like this, for a given species at different
much potential in this regard. localities is useful for identifying key drivers of
By visually interpreting the imagery available in invasion (Richardson et al. 2004).
GE (when this is of high enough spatial resolution), When viewing images obtained on different dates it
and thereby identifying individual IATs and/or calcu- is sometimes apparent that there is a shift in the
lating canopy cover of these species, all of the metrics location of fixed objects (e.g. buildings, roads, moun-
we described above can be estimated. Spread distances tains), which is related to the inaccuracies in geore-
can be estimated using GE imagery by identifying the ferencing or orthorectification of images in GE,
source population of an IAT species (e.g. a plantation) resulting in positional inaccuracies, as described
and measuring the distance between the source earlier. We suggest that these spatial errors can be
population and individuals that have spread into accounted for, to some extent, by manually georefer-
neighbouring vegetation (identified using visual inter- encing images obtained on different dates in GIS
pretation). This can either be done manually, using the software using objects identifiable in all images and
123Unlocking the potential of Google Earth 519
known to have fixed locations (e.g. roads, large types of data, although this is currently beyond the
boulders or trees), although this does increase the scope of the aims of this manuscript.
amount of time required to do these types of analyses
considerably. Sharing information online with other users
and promoting global networking
Early detection and locating field sites
GE has been widely used to disseminate information
Early detection of newly-emerging invasions is often in a visually-appealing, informative and educational
more cost effective and ensures a much greater chance manner. For example, Conroy et al. (2008) illustrate
of eliminating an invader than waiting for an alien how GE can be used for sharing paleontological
species to become highly abundant (Rejmánek and spatial information with people who have no back-
Pitcairn 2002; Hulme 2006; Mehta et al. 2007). ground or familiarity with GIS. Spatial data layers can
Remote sensing has long been proposed and used as be exported in KML format and easily opened by
an early detection tool (Hulme 2006). However, anyone with GE on their computer, negating the need
remote sensing may have limited utility if a species for complicated GIS software (Conroy et al. 2008).
is ‘‘cryptic, small, scattered or highly mobile’’ (Hulme While there are nice examples of invasive species
2006). Invading trees are less likely to be difficult to distributions mapped onto GE imagery (e.g. http://
detect in this regard than other plant life-forms calweedmapper.calflora.org/), the use of GE itself for
because of their large size. Most tree species are sharing invasive species spatial data, to the best of our
relatively slow-growing and slow to mature and so knowledge, has only had limited applications to date.
should become visible in aerial imagery before they We suggest that GE could be used much more widely
start producing many propagules. Undoubtedly, field- used for invasion science applications.
truthing should complement GE observations, espe- First and foremost it could be used for educational
cially when new invasions are being reported. There is or awareness-raising purposes to highlight the often
always a risk of false positives, especially in areas dramatic changes effected by tree invasions. There are
where native species have similar visual characteris- numerous examples around the world where the
tics to the IAT species. spread of IATs is quite clearly visible in the aerial
GE imagery may also be useful to invasion imagery provided by GE. We have created a KML file
scientists for identifying potential field sites. with some notable invasion sites to highlight the utility
Researchers may want, for example, to conduct a of GE in this regard (Supplementary file 1).
study using sites where the full spectrum of IAT Secondly, GE provides an excellent platform for
relative abundance is represented. GE provides the invasion scientists and managers to network and share
opportunity to remotely and cheaply characterise a their results and data in the form of KML files. We
number of potential study sites in terms of the metric know of only a very few papers providing supporting
the researcher is interested in (relative abundance in information in this format, but that number should
this example), and select only the ones that match the increase, given that this is such an easy and effective
desired criteria. IAT managers may wish to identify way of visualising data and results. Global networks of
field sites for the purposes of management prioritisa- researchers and managers can benefit from the direct
tion e.g. selecting either sites that are the most or least transfer of data and results (see Pauchard et al. 2009,
invaded for urgent clearing operations. All of this can Sagarin and Pauchard 2010), especially with the use of
be done using GE imagery in a much more cost- and an interactive platform such as GE. For example,
time-effective manner than by either conducting field scientists studying tree invasions into treeless ecosys-
assessments or purchasing aerial imagery. Scientists tems can compare a number of environmental attri-
can also share the locations of their study sites in a butes across global sites if they have accurate positions
much more accurate and straightforward manner by for such invasions, while managers can learn from
uploading their field sites onto GE e.g. as placemarks other regions where management actions have already
or in KML format. In the long-term it would be most been conducted (see e.g. Kueffer et al. 2013). To
useful to have a central online repository for these highlight the effectiveness of using the KML format,
123520 V. Visser et al.
we have provided supplementary KML files for all of trees have been a major source of IAT invasions
our case studies. (Richardson and Rejmánek 2011; Dodet and Collet
Thirdly, monitoring and/or sharing of information 2012), and should form part of any proposed sentinel
on IATs can be achieved using cloud-based GIS site network. Other areas that are likely to act as
servers (e.g. ArcGIS server, GeoServer) that integrate sources of propagules and sites of entry for new
the capabilities of virtual earth applications such as GE invasions are areas of human habitation where gardens
with more advanced GIS tools, all accessible online. have been established (Alston and Richardson 2006),
This sort of approach has been used, for example, for and experimental plantings, arboreta or botanical
developing an online monitoring system for transmis- gardens containing alien species (Hulme 2011).
sible diseases (Yang et al. 2012). This approach holds Google Earth provides us with the perfect tool to set
great promise for gathering and sharing information up such a global sentinel site network for IATs,
on alien species in general, but requires a high level of because imagery is continuously being updated, it is
technical expertise and an in-depth review of this free and low-tech and, as shown in this paper, is a
approach is beyond the scope of this paper. useful tool for detecting IAT invasion and provides
valuable information on the ecology of IATs. In
Sentinel sites addition, the popularity of GE could enable monitor-
ing of this network of sentinel sites as part of a ‘‘citizen
We have already established the utility of GE in science’’ effort (Silvertown 2009). As described
detecting newly-emerging tree invasions and moni- earlier, data sharing via KML files is simple and
toring IAT spread over time. We propose that these would allow for easy sharing of locations of sentinel
capabilities allow for the establishment of a global sites. In addition, GE already has the capacity for users
network of ‘‘sentinel sites’’ for detecting invasions of to upload photographs (via Panoramio; www.
IATs at an early stage of the invasion process and panoramio.com), which would allow for more accu-
monitoring the spread of IATs. The idea of having a rate species identification and verification. The other
network of sentinel sites for monitoring or detecting useful tool in GE which could be used in some
biological changes or phenomena is not new and has instances for verification and identification purposes is
been most widely applied to monitoring the spread of Google Street View, which gives on-the-ground
infectious diseases (e.g. Freedman et al. 2008; Sserw- imagery for sites close to roads, although this is only
anga et al. 2011), but has also been used for detecting available for a limited number of countries, and most
the spread or arrival of alien species (Meyerson and extensively in urban areas. Up-to-date monitoring of
Mooney 2007) and a national system for detecting sites can also be achieved by signing up to receive
emerging plant invasions in the United States was updates from Google as to when new imagery
proposed (Westbrooks 2003), but never enacted. The becomes available in GE for registered locations
idea behind most sentinel networks is to have a (https://followyourworld.appspot.com/dashboard).
relatively small number of sites spread across a broad, Such a global network would obviously be limited by
but defined geographical area, at which detailed the biases in the availability of high resolution imagery
analyses can be made in order to detect the biological in GE, but as previously mentioned, continuous
change or phenomenon in question or to indicate updates from satellites such as GeoEye-1 should lead
changing trends which could trigger management to ever greater availability of high spatial resolution
interventions. Such a network, at the global scale, has imagery for all parts of the globe.
previously been proposed ‘‘to monitor reproduction We believe that such a sentinel site network will
and regeneration dynamics of alien species’’, espe- help to: (1) identify emerging trends in IAT invasions;
cially alien tree species growing in plantations or (2) provide valuable locality information for particular
arboreta (Richardson and Rejmánek 2004). IAT species; (3) monitor changes in IAT species
The amount of introduction effort, which ultimately abundance and distribution over time; (4) help ensure
contributes to the amount of propagule pressure, has legislative compliance of land managers and planta-
been identified as a principal driver of new invasions tion owners; and (5) track management efforts over
(Huang et al. 2012) as have sites of likely entry for an time. Such a network of sentinel sites might be
invasive species (Hulme 2006). Plantations of alien established by identifying sites close to alien-tree
123Unlocking the potential of Google Earth 521
propagules within a GIS framework using, for exam- with the horizontal positional accuracy of GE images
ple, land-cover classifications, which include catego- (as described earlier), we were unable to ascertain the
ries for alien tree plantations and urban areas (see case exact location of these transects in GE. We therefore
study 3). Alternatively or complimentarily, the net- adopted a different approach, creating 32 ‘‘virtual’’
work might be grown over time from sites suggested transects around the presumed location of the original
by GE users. field transects (i.e. 16 9 3 m wide transects either side
of each straight line joining the GPS measurements
representing the three transects laid out by Langdon
Case studies for illustrating the utility of Google et al. (2010)). Our virtual transects were created in R
Earth in invasion science (R Development Core Team 2013) using 150 m long
polylines perpendicular to the edge of the P. contorta
Case study 1: Pinus contorta invasions in southern plantation, with the transects further subdivided into
Chile subtransects 10 m long (which is the same distance
Langdon et al. (2010) used for their subtransects;
Afforestation using alien tree species has rapidly Supplementary file 2). Within the area encompassed
expanded in the last century (Sedjo 1999), with pine by these ‘‘virtual’’ transects, we used GE imagery
(Pinus) species being among the most commonly taken on 28 February 2010 (the date closest to January
planted species (Richardson 1998; Sedjo 1999; Rich- 2009 when the field measurements were obtained;
ardson and Rejmánek 2011). A number of pine species Image supplied by DigitalGlobe, IKONOS-2; 4 m
have become highly successful invaders in many parts spatial resolution) for visual interpretation in order to
of the globe (Richardson 1998; Richardson and identify P. contorta individuals. Trees were generally
Rejmánek 2011), have a wide range of impacts (e.g. identifiable against the native grassland matrix by
Richardson and van Wilgen 2004), and have been the circular patches with a slightly different colour to the
target of substantial control efforts (e.g. van Wilgen surrounding vegetation, and a shadow on the SW side
et al. 2012). Pinus contorta is one of the most invasive of these patches. Using the polygon tool in GE, we
pine species, being recorded as invasive in Argentina, outlined what we identified as the canopy boundary of
Chile, Australia, New Zealand and Sweden (Langdon P. contorta trees and saved these in KML format
et al. 2010). P. contorta was only introduced relatively (Supplementary file 2). In Quantum GIS (QGIS;
recently into Chile as a plantation species (*1970s) Quantum GIS Development Team 2012) we used the
and therefore little is known about the spread of this ‘‘Join attributes by location’’ tool to calculate the
species into native grassland and steppe vegetation numbers of polygons (i.e. P. contorta individuals) in
(Gundale et al. 2014). Invasions of this species and each subtransect.
other conifers have lagged behind such invasions in The mean number of GE-delineated trees per
many other parts of the southern hemisphere because transect (i.e. the mean of the 32 virtual transects for
of the shorter history of plantings for forestry (Rich- each 10 m subtransect) exhibited a positive associa-
ardson et al. 2008). Langdon et al. (2010) conducted tion with the field-counted number of trees of Langdon
field surveys next to five different plantations of P. et al. (2010) (Fig. 1a, b). However, for higher densities
contorta in southern Chile in order to determine of trees, we under-estimated the actual number of trees
whether first-generation invaders (i.e. recruits from in the field (Fig. 1a, b). These high density subtran-
plantations) were reproducing and thus contributing to sects appear to be those close to the plantation edge
the spread of the species, or whether recruitment was (point size is proportional to distance from plantation
still predominantly from plantation trees. We compare edge in Fig. 1a) and those with tall trees (point size is
the numbers of P. contorta individuals recorded at one proportional to tree height in Fig. 1b; height of the
of the Langdon et al. (2010) study sites, near the city of tallest tree in each subtransect was recorded by
Coyhaique in southern Chile, with those obtained Langdon et al. (2010)). This suggests that we were
using GE imagery. unable to detect smaller trees beneath the canopies of
Langdon et al. (2010) originally laid out three larger trees close to the plantation edge. However, we
150 m transects at this study site, but due to the found a similar decline in tree numbers towards the
inaccuracies associated with GPS measurements and end of the 150 m transects using GE imagery as was
123522 V. Visser et al.
(a) (b)
(c) (d)
Fig. 1 a, b A comparison of the number of trees counted in the linear fit: y = -0.062x ? 8.514; rr = 0.78; p \ 0.001) and of
field around Coyhaique city, Chile, by Langdon et al. (2010) and the virtual transects conducted in GE (closed symbols are means
those identified using GE imagery. Point size in a is proportional per substransect of the 96 virtual transects; solid line is the linear
to the distance from the plantation edge and in b to the height of fit: y = -0.005x ? 1.956; r2 = 0.23; p = 0.07). Error bars
the tallest tree per substransect. The solid line in a and represent 95 % confidence intervals. d A comparison between
b represents the linear fit between the field- and GE-counted 2004 and 2010 of the numbers per subtransect of P. contorta
numbers of trees (y = 0.084x ? 1.251; r2 = 0.31; p \ 0.05) trees across the 150 m length of the field transects. Solid symbols
and the dotted line represents a 1:1 fit between these variables. and lines are as for c. Open circles are the 2004 means per
c Numbers per subtransect of Pinus contorta trees across the substransect and the dotted line is the 2004 linear fit (y =
150 m length of the field transects (open circles are means per -0.002 ? 0.558; r2 = 0.62; p \ 0.001)
subtransect of the three field-based transects; dotted line is the
found with the field transects (Fig. 1c). Inspection of but using neural network classification, it was found
the study area in GE indicates that there are very few that this method was unable to identify individuals or
P. contorta trees further than 150 m from the planta- stands of Melaleuca when canopy cover dropped
tion edge. These results suggest that using GE imagery below about 50 % of the pixel (Fuller 2005). Other
for counting individual trees will only work for studies using similar high-resolution imagery have had
counting large, mature trees that occur in low to similar results when canopy cover of the IAT under
intermediate densities, but will always underestimate study is less than 50 % of the pixel (Asner and Huang
the numbers of juveniles, especially when these occur 2011). This case study reiterates our earlier points
under the canopies of larger trees. It is also worth about ‘‘mapping tree invasions’’ (section ‘‘Introduc-
noting that the spatial resolution of the imagery for the tion’’) in that moderate spatial resolution GE imagery
study location was only 4 m and that higher resolution is probably better suited to measuring canopy cover,
imagery (e.g. from the GeoEye-1 satellite, with a rather than numbers of individual IATs. Visual
spatial resolution of 0.5 m; Table S1) would probably interpretation for counting the number of IAT indi-
enable us to make more accurate counts of tree viduals is, therefore, probably better attempted with
numbers. In a study of Melaleuca invasion in Florida, imagery of very high resolution (e.g. 0.5 m GeoEye-1
also using 4 m spatial resolution IKONOS imagery, imagery) and only when one is interested in the
123Unlocking the potential of Google Earth 523
e
on edg
Plantati 150 m
150 m
p3
ct grou
Transe
150 m
p1
Transect grou
2
Transect group
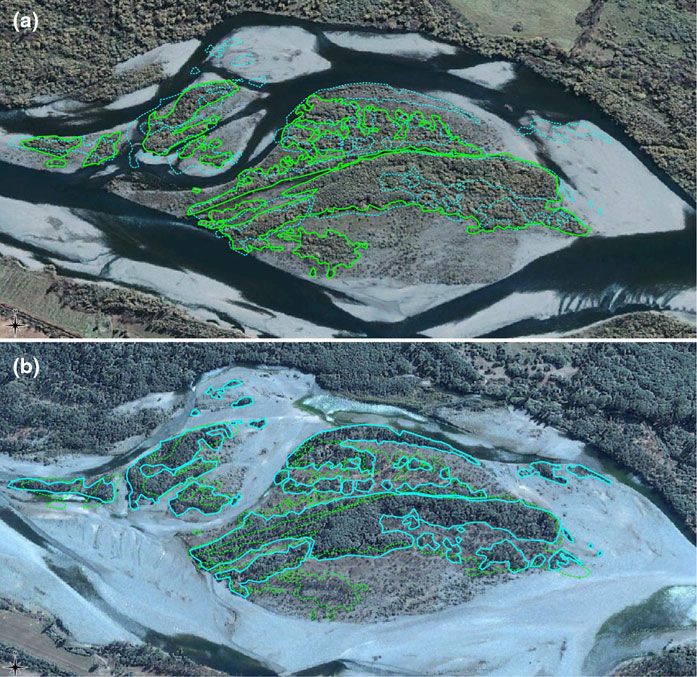
Fig. 2 The change in numbers of Pinus contorta trees around case study 2 for more details). This same figure (in colour) is
Coyhaique city, Chile, per 10 9 3 m subtransect between 2004 provided as a KML file in Supplementary file 2. Decreases
and 2010 determined by visual inspection of imagery from GE. between 2004 and 2010 in the number of trees identified in a
For each of the three field transects conducted by Langdon et al. 10 x 3 m subtransect are represented by white to light grey;
(2010), we created 32 virtual transects measuring 150 9 3 m increases by darker grey to black. White areas outside of each
starting at the plantation edge and heading outwards perpen- group of 32 transects were not included in this analysis
dicularly from the edge, resulting in three ‘‘transect groups’’ (see
number of mature trees i.e. not trees with a canopy contorta numbers occurred in the third transect in an
extent smaller than the image spatial resolution. area of obviously high tree abundance in 2010 (Fig. 2;
To demonstrate the utility of GE in monitoring Supplementary file 2). This visualisation shows how
invasions over time, we performed the same visual one can easily display results in an attractive format in
inspection of GE imagery and delineation of P. GE. Overall, this case study highlights the utility of
contorta trees for an image taken on 25 December GE for analysing trends in the abundance (numbers of
2004 (Image supplied by DigitalGlobe; IKONOS-2; individuals or canopy cover) of IATs over time,
4 m spatial resolution). It should be immediately although our results suggest that this approach works
obvious when viewing the study area in GE for this better for measuring IAT canopy cover, because we
date that objects are displaced further to the NE than in tended to underestimate numbers of individual IATs
the 2010 image. To correct for this, we georeferenced when these were small and/or when these occurred
the 2004 P. contorta polygons to the 2010 image in beneath larger trees. However, it also illustrates how
QGIS (Quantum GIS Development Team 2012) using much more easily one can remotely characterise an
trees that were identifiable in both images as reference invasion for a much broader area than would be pos-
points. A comparison of the numbers of P. contorta sible in the field, especially for remote regions with
trees in 2010 with those in 2004 reveals a large overall difficult access, such as Patagonia. Therefore, such a
increase in the mean numbers of these trees in the method could be adopted, as a first approach, by
intervening period (Fig. 1d). We visualised the change companies and NGOs to remotely assess levels of tree
in numbers of P. contorta trees per subtransect invasions, especially in areas certified under environ-
between 2004 and 2010 in GE as a KML file using mental standards such as the FSC (Forest Stewardship
the free software, shp2kml 2.0 (http://zonums.com/ Council).
shp2kml.html; Supplementary file 2), and provide it as
a figure in this paper (Fig. 2). This gives us a much Case study 2: Acacia dealbata invasions in central
clearer perspective of the patchy pattern of increasing Chile
abundance of P. contorta than Fig. 1d would suggest
(Fig. 2; Supplementary file 2). It also supports our Acacia dealbata (Silver wattle) is native to SW
hypothesis that we are unable to accurately count trees Australia and Tasmania and has been widely intro-
at high densities, because the largest decreases in P. duced into other parts of the world for forestry and
123524 V. Visser et al.
ornamental purposes, and has subsequently become However, we did not use the polygon tool in GE, but
invasive in California, Portugal, New Zealand, Mad- rather conducted this visual interpretation of the GE
agascar, South Africa and Chile (Underwood et al. image in QGIS. The reason for adopting this approach
2007; Richardson and Rejmánek 2011; Richardson was that we know of no easy method to georeference a
et al. 2011). A. dealbata produces abundant yellow vector type file, like the polygons created in GE. The
flowers mid-winter and this phenological characteris- disadvantage of this approach is that the saved GE
tic has been used to successfully identify and measure image will have its resolution fixed at the maximum
the canopy cover of this species in forest and riparian allowed by GE for saved images and not by the
habitats in Chile using very high resolution aerial resolution of the original imagery, as is the case if one
photography (Pauchard and Maheu-Giroux 2007). We were viewing the image in GE. Therefore, the saved
investigated whether it is possible to accurately assess image will have a coarser resolution if one zooms into
the canopy cover of this species using GE imagery, a smaller portion of the image and this approach will,
comparing our results with those obtained using aerial consequently, work much better for images with a
photos for a study site along the Rio Ñuble near the smaller spatial extent. Alternatively, a combined
city of Chillán in central Chile (Lab. de Invasiones approach could be used, in which areas with doubtful
Biológicas (LIB), unpublished data). photointerpretation can be zoomed into using GE, and
Using this colour aerial photography (with a the interpretation can be conducted using the fixed
1:20,000 resolution) and visual photointerpretation, image. For this reason, we focussed our analysis of GE
the presence or absence of A. dealbata trees in flower imagery to a number of islands in the Rio Ñuble,
was determined in 10 9 10 m cells of a 2 9 2 km representing a very local scale. We also focussed on
grid, with the ultimate finding that this species is this specific area because these islands appear to be
highly abundant along riverbanks in the study site. We highly dynamic over time and a cursory inspection of
include a correctly georeferenced KML file of these the historical imagery in GE suggested the distribution
unpublished results as a supplementary attachment, of A. dealbata on these islands has changed consid-
which, once opened in GE reveals that there is an erably over time. To study these temporal changes, we
obvious horizontal displacement of the imagery in GE georeferenced a GE image taken on 10 September
towards the south (Supplementary file 3). Unless this 2003 (Image provided by DigitalGlobe; IKONOS-2;
displacement is corrected, it would be impossible to 4 m spatial resolution) and performed the same
compare results obtained from GE imagery with those A. dealbata identification procedure using polygons
from the aerial photos. The approach we took to to delimit stands of this species. We then estimated the
address this issue was to save the GE image for 9 presence or absence of A. dealbata in each of the
March 2010 (the date closest to August 2009 when the 10 9 10 m grid cells using the QGIS ‘‘Join attributes
aerial photograph was taken; Image provided by by location’’ tool.
DigitalGlobe; IKONOS-2; 4 m spatial resolution) If we regard the image classification using the high-
and georeference this image in QGIS (Quantum GIS resolution aerial photography as a true estimate of the
Development Team 2012). We used four control cover of A. dealbata, the classification performed
points, as close as possible to the corners of the image, using the 2010 GE imagery shows a high level of
and the default thin plate spline transformation and accuracy (Accuracy = 84.4 %; Table 1) and low
nearest neighbour resampling method in the Georef- omission error (false absences; 4.49 %; Table 1).
erencer plugin of QGIS to georeference this image. However, there was high commission error (false
Rather than use a grid-based approach for identi- presences; 53.5 %; Table 1) and the Kappa statistic
fying the presence of A. dealbata trees as used with the indicated moderate agreement between the GE-based
aerial photos, we used a polygon method similar to classification and the high-resolution-aerial-photogra-
that described in the first case study (i.e. Pinus phy classification (j = 0.588; Table 1). The high
contorta in Chile) to identify stands of this species. commission error (831/1553 grid cells; i.e. a large
Because we were more interested in measuring canopy number of false positives) is as a result of us estimating
cover than numbers of individuals of this species, we a far greater number of grid cells to be occupied by
used polygons to define the boundaries of dense stands A. dealbata based on the 2010 GE image than that
of A. dealbata rather than of individual trees. estimated using the aerial photographs. We suggest
123Unlocking the potential of Google Earth 525
Table 1 Accuracy of Acacia dealbata presence/absence present, and as we suggested in the previous case
classification for a Google Earth image of a study site along the study, using GE imagery for mapping IAT distribu-
Rio Ñuble near the city of Chillán in central Chile compared to
tions is likely to be most useful in ‘‘treeless’’
presence/absence data obtained using a high-resolution aerial
photograph vegetation types such as grasslands, steppe, etc.
Time-series measurements of IAT canopy cover
GE classification High-resolution, aerial photograph
classification
change, however, possibly present a much more
successful use for GE imagery. For example, at our
Presence Absence Row total study site, a comparison of the 2003 GE image with
Presence 722 831 1,553 that of 2010 shows that there have been substantial
Absence 34 3,956 3,990 changes to the sizes and positions of some of the river
Column total 756 4,787 5,543 islands between 2003 and 2010 (Fig. 3a, b). Accord-
ing to our polygon delineations of stands of A.
Accuracy = 84.4 %; Omission error = 0.9 %; Commission
error = 53.4 %; Kappa = 0.588
dealbata in 2003 and 2010, we found that while the
overall area occupied by this species changed very
little from 2003 (0.114 km2) to 2010 (0.106 km2),
that this is because our classification perhaps more there was an increase in abundance of this species on
closely represents the area occupied by all tree species, the northern edges of a number of the islands and on
and not just of A. dealbata. It is almost impossible to some of the previously unoccupied sandbanks of 2003
distinguish between tree species using imagery, such (Fig. 3a, b). It appears as if this species is able to
as that available from GE, which has low spectral rapidly colonise areas in the river that have only
resolution but, as in this case, high spatial resolution recently stabilised, such as the sandbanks in the
unless the species one is trying to identify has a distinct northern branch of this river. We provide a KML file
flowering phenology and/or spatial pattern (Huang and showing the changes in the presence or absence of A.
Asner 2009; Asner and Huang 2011). A. dealbata does dealbata between 2003 and 2010 based on the
in fact have a distinct flowering phenology, with 10 9 10 m grid cells used with the aerial photographs,
abundant yellow flowers in winter, but the GE imagery which we georeferenced back to the 2010 GE image.
for 2010 was taken at the wrong time of year (March) White indicates stable presence between 2003 and
to see this. One may notice that the GE imagery 2010, blue indicates presence in 2003, but not 2010,
available for 10 September 2003 (in the austral spring) and red indicates presence in 2010, but not 2003
shows hints of the yellow flowers characteristic of A. (Supplementary file 3). Our results suggest that,
dealbata, but is not of high enough spatial resolution together with a priori knowledge of the presence of
to accurately delineate canopies of this species. The an IAT species invading native vegetation that
identification of A. dealbata in the high-resolution includes a considerable native tree component, time-
aerial photograph relied on the visibility of their series analysis of GE images can help to measure how
yellow flowers, but we argue that younger trees are and where change occurs over time.
unlikely to be identifiable in this manner because they
are smaller and produce no/fewer flowers, suggesting Case study 3: Designing a sentinel site network
that the estimated cover of this species obtained using for the Western Cape of South Africa
these images is an underestimate. We know from field
observations that A. dealbata is in fact the most In our proposal for the requirements of an IAT sentinel
abundant woody plant in this area, although there are site network, we suggested that sites in the network
also native riparian tree species. GE has clear advan- should be close to sites of alien tree propagules.
tages in terms of costs compared to the high-resolution Plantations of alien tree species are likely to act as a
aerial photography and, therefore, can serve to major source of new invasions (Richardson and Brown
estimate the cover of Acacia dealbata at local scales, 1986; Richardson and Rejmánek 2011; Dodet and
including some field-truthing to adjust for error or bias Collet 2012) and should therefore form a major part of
in the visual estimation. However, our results also any IAT sentinel site network. Of the alien species
highlight the difficulty of mapping canopy cover of used in commercial plantations, the most commonly
IATs invading areas where native trees are also planted species are from the genera Eucalyptus
123You can also read