WMO AIRBORNE DUST BULLETIN - World ...
←
→
Page content transcription
If your browser does not render page correctly, please read the page content below

WEATHER CLIMATE WATER

                 WMO AIRBORNE DUST
                 BULLETIN
                 No. 3 | May 2019

                 Sand and Dust Storm – Warning Advisory and                    and Assessment System (SDS-WAS) launched in 2007
ISSN 2520-2936

                 Assessment System                                             with the mission to enhance the ability of countries to
                                                                               deliver timely and quality sand and duststorm forecasts,
                 Sand and dust storm (SDS) is a meteorological hazard,         observations, information and knowledge to users through
                 which is related to the process of wind erosion of            an international partnership of research and operational
                 surface soil and the mineral dust aerosol emission to         communities (Nickovic et al., 2014, Terradellas et al., 2015).
                 the atmosphere. The frequent SDSs in Northern Africa,
                 Middle East and Europe, Arabian Peninsula, Central Asia,      The SDS-WAS works as an international hub of research,
                 northern India, northern, north-western China, southern       operational centres and end users, organized through
                 Mongolia and adjacent Asian countries; and in desert          regional nodes (Figure 2). Three nodes are currently in
                 regions of Australia and the USA seriously threaten human     operation:
                 health, agriculture, aviation, ground transportation, solar
                 energy industry, air quality, infrastructure and industry,    •   Regional Node for Asia, coordinated by a Regional Center
                 as well as aquatic and terrestrial ecological systems.            in Beijing, China, hosted by the China Meteorological
                 Dust aerosol can carry irritating spores, bacteria, viruses       Administration.
                 and persistent organic pollutants. It also transports
                 nutrients to the oceans and affects marine biomass            •   Regional Node for Northern Africa, Middle East and
                 production, which affects the changes of greenhouse               Europe (NAMEE), coordinated by a Regional Center in
                 gases in the marine environment. The Inter-governmental           Barcelona, Spain, hosted by the State Meteorological
                 Panel on Climate Change (IPCC) recognizes dust aerosol            Agency of Spain (AEMET) and the Barcelona
                 as a major component of atmospheric aerosol that is               Supercomputing Center (BSC).
                 an essential climate variable. More and more, dust
                 particles are considered by atmospheric researchers as an     •   Regional Node for Pan-America , coordinated by a
                 important factor influencing weather through feedback on          Regional Center in Bridgetown, Barbados, hosted by
                 atmospheric dynamics, clouds and precipitation formation.         the Caribbean Institute for Meteorology and Hydrology.
                 Understanding the processes that lead to SDS formation
                 and evolution, obtaining the relevant parameters for SDS      Overview of the atmospheric dust content in 2018
                 occurrence, development and change, providing the
                 observational basis for describing the weather conditions     The third Airborne Dust Bulletin reports on the global
                 associated with SDS, and carrying out numerical dust          surface dust concentration in 2018, as well as the
                 forecasts along with providing corresponding SDS early        observational and forecast results of representative
                 warnings are the urgent needs of effectively mitigating       severe sand and duststorms around the world. The
                 the impact of SDS and are also of great significance to the   analysis presented in this Bulletin relies on a very limited
                 national decision-making in combating the impact of SDS.

                 The WMO Sand and Dust Storm Project was initiated in
                 2004 with the Sand and Dust Storm Warning Advisory

                                                                                    Figure 2. Schematic structure of current SDS-WAS
                                                                                                     Regional Node
                 Figure 1. SDS over Bikaner, Rajasthan, India on 2 May 2018
observational database due to the paucity of suitable dust          Mauritania, Mali, Niger, Nigeria and Chad, Central Asia,
observations and the complexity of extracting specific dust         northern China and central-western Australia (Figure 4).
signals from satellite radiances. In addition, observations         Hot-spots with significantly higher dust concentration
from sensors working in visible channels are not available          include northern Ethiopia and Yemen, north-eastern Saudi
over bright surfaces such as deserts (Benedetti et al.,             Arabia, Pakistan, northern India, and north-western China.
2014). To support limited observational evidence this
report has been reinforced by the results of numerical              Several severe SDS events that occurred in these hot-
models which incorporate observations through data                  spots in 2018 and which are presented below, resulted in
assimilation, but uncertainties still persist.                      deaths and serious social and economic losses.

The spatial distribution of global surface concentration            Major SDS events over various regions in the world
of mineral dust in 2018 and its anomaly relative to the             during 2018
climatologically mean values (1981–2010) (Figure 3) are
derived based on the dust products from the Modern-Era
Retrospective Analysis for Research and Applications,               SEVERE SDS EVENT IN INDIA IN MAY 2018
Version 2 (MERRA-2) (Gelaro et al., 2017), which is the
latest atmospheric reanalysis version for the modern                In India as per Hindu/another local solar/moon calendar
satellite era produced by NASA’s Global Modelling and               (vary state wise), “Vaisakh/Vaisakha/Boishakh” season
Assimilation Office (GMAO). MERRA-2 includes an online              begins around mid-April that marks the beginning of
implementation of the Goddard Chemistry, Aerosol,                   the summer season. It is also known as notorious for
Radiation, and Transport model (GOCART) integrated into             SDSs that start as strong gusts from the north-western
the Goddard Earth Observing System Model Version 5                  direction, causing widespread destruction. This period
(GEOS-5). MERRA-2 provides the capability for simulating            with frequent duststorms covering from April to June
five types of aerosols. The results shown here are based            as per local calendar, is also known as “KalBaisakh”
on the parameter of dust surface concentration, which               (or Nor'wester) and the storms are known as “Kal
is different from the parameter of dust aerosol optical             Baisakhi” (or Kalboishakhi) since ancient times where
depth (AOD), and more relevant to ground air quality.               “Kal” refers to “Yam”, the god of death brought by SDSs
                                                                    and thunderstorms. In 2018, surface dust concentration
In 2018, a well-known dust belt composed of major                   is found significantly higher than the long-term average
dust sources including northern and Central Africa,                 (Figure 4) in Pakistan and northern India.
the Arabian Peninsula, northern India, Central Asia, the
deserts in north-western and northern China can be                  In Figure 5, a snapshot of the most devastating SDS event
clearly seen in the northern hemisphere (Figure 3). The             is presented. This event was one of the largest in the last
estimated peak concentration of dust can be found in some           three decades as per estimates of local residents. It struck
areas of Chad in Central Africa (~900–1000 μg/m3). High             north-western parts of India, including megacities like
concentrations of dust can also be seen in some regions             Jaipur, Delhi, Agra, Lucknow, on 2 and 3 May 2018. Most
in the Arabian Peninsula, Central Asia, and north-western           affected states, as per media reports, were Rajasthan,
China with mass concentrations of ~400–600 μg/m3. In                Delhi, Uttarakhand, Uttar Pradesh, and surrounding
addition, dust concentration can reach the highest level of         regions in the vast Indo-Gangetic (Ganga belt) plains.
~200 μg/m3 in the places of Central Australia in the southern       The death toll was reported to be around 35, 4, 73 in
hemisphere. From these sources, dust is transported to              Rajasthan, Uttarakhand, Uttar Pradesh respectively and
surrounding regions, such as the northern tropical Atlantic         more than 400 people were injured.
between West Africa and the Caribbean, South America,
the Caribbean Basin, the Mediterranean, the Arabian Sea,            The duststorm that struck India on Wednesday (2 May
and northern India or central-eastern China, Korea, Japan.          2018) was associated with very high wind speed, extremely
                                                                    low visibility along with scattered thunderstorms and
In the most dust plume affected areas, the surface dust             dangerous levels of PM10 and PM2.5 leading to respiratory
concentration in 2018 is higher than climatological mean            and allergy issues. High wind speed lead to injuries
(Figure 4), except the areas in Central Africa including            due to flying objects and zero visibility. Indian National

      Figure 3. Annual mean surface concentration of                 Figure 4. Anomaly of the annual mean surface concentra-
                   mineral dust in 2018                                  tion of dust in 2018 relative to mean of 1981–2010
                                                                2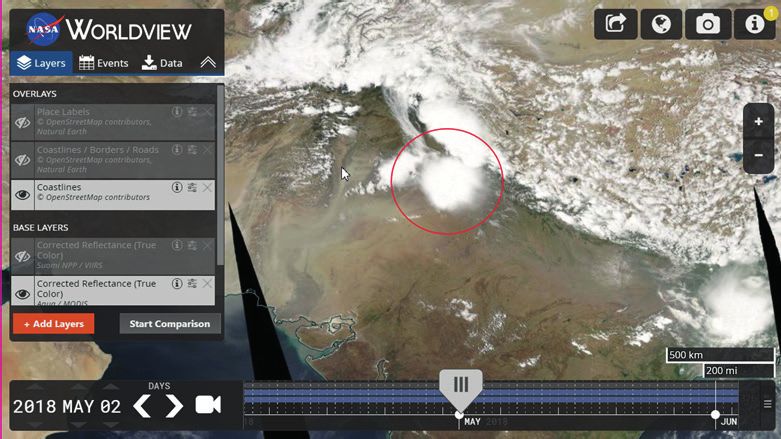
dust concentration in Figures 3 and 4. Khuzestan can be
                                                                    considered as one of the hotspots in this area. Khuzestan
                                                                    is an Iranian province located at the southwest of the
                                                                    country, bordering Iraq and the Persian Gulf. Duststorms
                                                                    have become a major environmental concern during the
                                                                    last decades in this oil- and gas-rich province. Zarasvandi
                                                                    et al. (2011) estimated an average occurrence of 47
                                                                    duststorm days per year with this figure increasing at a
                                                                    rate of two days per year. They also pointed out that the
                                                                    major dust sources affecting Khuzestan are dry lakebeds,
                                                                    alluvial deposits and deserts in neighbouring countries
 Figure 5. A high-speed SDS (Kal Baisakhi), marked as red           to the west. In particular, the Mesopotamian marshes are
 circle, over the north-western part of India as visible in a       suffering rapid land degradation, caused by natural and
near real-time satellite image taken on 2 May 2018 (down-           human-induced factors, and might vanish soon in the
  loaded from https://worldview.earthdata.nasa.gov). The            future, thus expanding the source area (Cao et al., 2015).
image was taken by MODIS sensor onboard Aqua satellite              On the other hand, local dust sources are also important.
          and provided in near-real time by NASA.                   They are associated with a desert climate and poor, often
                                                                    salty, river flows that leave bare soils exposed to erosion.

Disaster Management Authority (NDMA) reported that                  An SDS episode which occurred in February 2018 is
Agra was one of the worst hit districts where at least 36           described to illustrate the severity of SDSs in Khuzestan.
people died. Media reported deaths of approximately 43              On the morning of Sunday 18 February 2018, the frontal
people in a village near Agra alone. Over 150 animals also          type dust was activated in Kuwait and Iraq which affected
died during the duststorm. Down-to-Earth (https://www.              Khuzestan. The concentration of dust in the cities of
downtoearth.org.in) reported total casualty to be over              Abadan and Khorramshahr was about 66 times higher
400 people across 16 states during the 2018 duststorm               than the permitted limit, and the horizontal visibility in
season. The Asian Node Center provided a numerical                  these cities decreased to about 100 m which resulted in the
forecast of this severe SDS event in India on 2 May 2018            cancellation of two flights from the International Airport of
(Figure 6). Improving forecasts of very small-scale SDS             Abadan. The schools of the Mahshahr, Shadegan, Abadan
events is still an emerging research issue facing the world.        and Khorramshahr cities were closed due to the occurrence
                                                                    of dust phenomena in the afternoon. In addition, the
This severe SDS event resulted in widespread uprooting              wind speed measured ~50 km h –1 during the storm in
of hundreds of trees and electricity poles, trees falling           the morning of 18 February 2018, caused suspension of
on houses and high-speed winds resulted in collapse                 local dust in some parts of the province, including Ahvaz,
of mud walls of houses or roofs, and even AC fittings in            Abadan, Omidieh and Izeh, while horizontal visibility in
urban areas leading to no electricity and acute shortage            Ahwaz reduced to 500 m (Islamic Republic News Agency).
of water supply during the period. In anticipation of an            On 19 February 2018, the measured dust concentration
increase in the numbers of people killed or injured in the          within this dust event was higher than 983 ug/m3, which
duststorm, state governments also issued alerts for the             lead to the closure of all schools in 11 cities of this province
next 48 hours and started rescue and relief works to save           (ISNA News Agency).
people buried under the debris and restore power supply.
                                                                    The aerosol optical depth (AOD) product of the MODIS
                                                                    generated by the combination of dark target and deep
SDS EVENT IN WESTERN ASIA IN FEBRUARY 2018                          blue algorithms and the dust model output are shown in
                                                                    Figure 7. Due to the dense cloud cover in large parts of
From a global SDS perspective, West Asia has been                   the region, AOD is not retrieved homogenously, though
widely recognized as one of the regions heavily affected            high AOD is seen in Kuwait, North-eastern Saudi Arabia,
by SDS. This can be seen from the estimated surface                 Persian Gulf and Khuzestan province in southwestern Iran.
                                                                    The AOD output of the BSC_DREAM8b_V2 model from
                                                                    the NAMEE node of SDS-WAS (https://sds-was.aemet.
                                                                    es) is also shown in Figure 7. The results show that the
                                                                    pattern produced by the model is in good agreement
                                                                    with the MODIS AOD products.

                                                                    SEVERE DUST EVENT IN PHOENIX, ARIZONA, USA IN
                                                                    AUGUST 2018

                                                                    Central Arizona is located in the desert southwest region
                                                                    of the United States of America and is a region prone to
                                                                    blowing dust events. These events are common during the
                                                                    North American “monsoon season” which mainly spans
                                                                    from July to August and is characterized by thunderstorms
 Figure 6. The surface dust concentration output by the             occurring almost daily. SDS events are usually formed
CMA_CUACE/Dust model for 09UTC on 2 May 2018 (http://               by the outflow from thunderstorms and can travel long
             eng.nmc.cn/sds_was.asian_rc)                           distances wreaking havoc with increased visibility which

                                                                3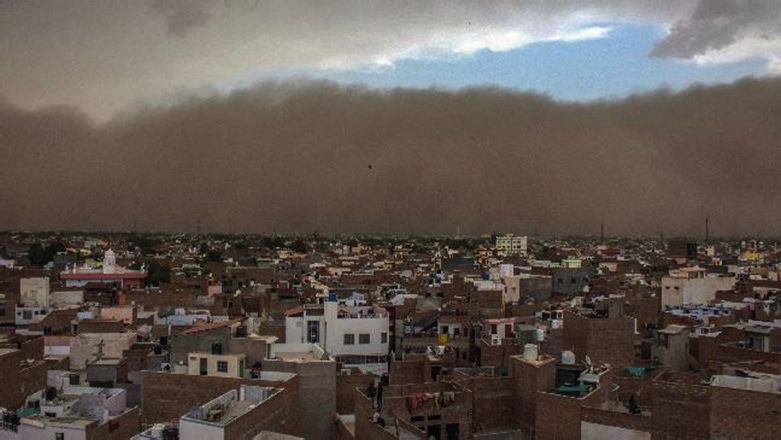
February 18, 2018               February 19, 2018

                                                                       This weakening was attributed to a lack of new dust
                                                                       to ingest and decreased intensity of the thunderstorm
                                                                       outflow. The duststorm caused significant disruptions in
                                                                       several activities in the city including knocking out power
                                                                       at Chase Field and disrupting play at Goodyear Ballpark.

       February 18, 2018 - 16UTC       February 19, 2018 - 16UTC
                                                                       SDS PROCESS IN HIGH LATITUDES OF THE NORTHERN
                                                                       HEMISPHERE

                                                                       WMO Airborne Dust Bulletin No. 2 reported on the
                                                                       high-latitude dust (HLD) which is a mineral aerosol with
                                                                       potentially important environment and climate impacts.
                                                                       Icelandic deserts, being the largest European source of
                                                                       mineral dust in the Arctic region, is of particular interest
                                                                       to general public and researchers. Emitted dust particles
Figure 7. The aerosol optical depth (AOD) product of MODIS             under strong wind conditions are mainly of volcanic
generated by the combination of dark target and deep blue              origin. Under favourable conditions, Icelandic dust can be
algorithms for 18-19 February 2018 (upper panel). The AOD              transported downwind up to a thousand km (Arnalds et al.,
  output of the BSC_DREAM8b_V2 model from https://sds-                 2016). More than a quarter of a year, there are dusty days
    was.aemet.es/ for 18-19 February 2018 (lower panel).               in Iceland during which air quality is often substantially
                                                                       reduced thus potentially affecting human health. Road
can lead to vehicle accidents. Major sources for duststorms            traffic is also affected due to reduced visibility under such
in central Arizona are the mountainous areas of north-                 conditions (Figure 9). Several car accidents are reported
central Mexico in Sonora, the mountainous regions of                   due to duststorms in South Iceland every year. This dust,
the Mogollon Rim in Arizona, and the Gulf of California.               having several times more iron oxides than for example
Locally, land use practices, wind patterns and ground                  Saharan dust, is likely an important primary nutrient of
moisture control dust loading in specific areas.                       the high-latitude marine environment. Finally, this kind
                                                                       of dust plays a role in the Earth climate system: when
A report published by the National Weather Service (NWS)               deposited over terrestrial surfaces, it changes the albedo
in 2016 states that “based on statistics from 1955 through             of snow and glacial areas, it also reduces the acidity of
2013, blowing dust is ranked as the 3rd deadliest weather              the high-latitude ocean where acidity has increased over
phenomenon in Arizona after flooding and extreme heat                  last decades due to climate change.
and cold”. Additionally, according to (Tong et al., 2017),
the frequency of duststorms is found to be correlated                  Several recent modelling studies have been performed to
with Valley fever incidences.                                          simulate transport of Islandic dust and its effects (Groot
                                                                       Zwaaftink et al., 2017; Beckett et al., 2017), but none of
On Thursday 2 August, what started as a typical warm                   those models had operational capabilities and appropriate
and humid summer day across Arizona turned out to be                   dust treatment.
more exciting than what was anticipated. According to
the preliminary storm report from the NWS Phoenix,                     The Republic Hydrometeorological Service of Serbia,
what was a little more unusual was a weak weather                      in collaboration with the Agricultural University of
feature moving west-to-east through the Mountain West,                 Iceland (AUI), has applied a version of the Dust Regional
the far southern tail of it dragging across Arizona. In                Atmospheric Model (DREAM) (Nickovic et al., 2014),
addition, other weak features across northern Mexico                   modified to function over the corresponding geographical
slowly moving east-to-west were present. This resulted                 domain. In this collaboration, AUI has provided detailed
in showers and thunderstorms developing during the                     data on dust sources in Iceland. The AUI Soil Erosion
afternoon hours, over western and northern Arizona and
then across southern Arizona. The storms to the south
developed into a cluster of strong storms and moved
northward into central Arizona.

The strong thunderstorm outflow winds caused a large
duststorm to develop and move south-to-north across
Maricopa and Pinal counties. The NWS Phoenix warned
that the duststorm was approaching (Figure 8). The
duststorm was expected to cause “near zero visibility
with damaging winds in excess of 60 mph” and could
also cause “dangerous life-threatening travel.” Drivers
were warned of impaired visibility across the county and
instructed to avoid being on the road or, if caught in the
storm, to pull off to the side of the road.

There were several reports of near zero visibility early
in the storm, though the intensity of the duststorm                       Figure 8. Duststorm moving into Phoenix, Arizona on
weakened as it moved northward into the Phoenix area.                           2 August 2018 (Source: Jason Ferguson)

                                                                   4
- -

       Figure 9. Reduced visibility and air quality in
               Iceland during an SDS event.

Database and a survey of dust hot-spots is described                Figure 11. The SDS-IDDI (Infrared Difference Dust Index)
in Arnalds et al., 2016. For the first time, operational                 retrieved from the China FY4A satellite for the
prediction of dust dispersion in high latitudes was made                          SDS event on 27 March 2018
available, see Figure 10 (http://www.seevccc.rs/?p=8;
select Dream8iceland). The new forecasting system thus             real-time retrieving system for the dust aerosols through
achieves the objective of SDS-WAS to deliver timely and            combining the separating-window and spectrum gathering
quality SDS forecasts to users for this particular region.         methods from the Asian Node Center of WMO SDS-WAS,
                                                                   derived by the National Satellite Meteorological Center
Tourists in Iceland exceed more than six times the number          (NSMC) of Chinese Meteorological Administration (CMA).
of local inhabitants. As one of the top cycle tourism              The updated IDDI data are based on FY4A satellite
destinations Icelandic authorities need to raise awareness         retrievals that are used in the Data Assimilation System
of duststorm danger (Figure 9). Dust forecasts are crucial         (DAS) associated with CUACE/Dust model utilized in this
for road safety in South and Northeast Iceland.                    Center. The retrieval methodology and reliability of IDDI
                                                                   was first tested using Chinese FY-2C remote sensing data
                                                                   described in Hu et al., 2008; the DAS utilization was first
SDS EVENT OVER EASTERN ASIA in MARCH 2018                          reported by Niu et al., 2008.

The influence of SDS on East Asia, originating from the            With the development of this SDS event, dust plumes
deserts of north-western, northern China and southern              were also observed in some areas of the Korean
of Mongolia peaks during the spring months. When a                 Peninsula and Japan. The Dust RGB image from the
severe SDS event occurred from 27 to 29 March 2018,                Himawari-8 satellite for 12 UTC on 27 March 2018 also
two geostationary meteorological satellites in the East            shows that dust was swept up over north-eastern China.
Asian region caught its occurrence and development                 Figure 12 shows the True Colour Reproduction (TCR)
(Figures 11 and 12). The dust was emitted firstly from the         image from Himawari-8 for 00 UTC on 29 March 2018.
desert regions of Mongolia, and then the dust plumes               Korea Meteorological Administration and the Japan
were observed in north-eastern China associated with the           Meteorological Agency have been providing SDS event
eastward moving of the Mongolian cyclone (Figure 11).              observation and forecast information in the SDS-WAS
The visibility decreased to less than 1 km in the heavy dust       Asian Node, for supporting measures against damage
area within Inner Mongolia. This SDS event influenced              due to SDS.
several provinces of China, including Xinjiang, Inner
Mongolia, Shanxi, Hebei, Beijing, Tianjin, Liaoning, Jilin,        This severe SDS event was well forecasted by the models
and Heilongjiang, affecting the area about 1.5 million             of the Asian Node Center. The dust surface concentration
square kilometres.                                                 from the ensemble models in the Asian Node Center
                                                                   from http://eng.nmc.cn/sds_was.asian_rc is shown in
The SDS-IDDI (Infrared Difference Dust Index) data are
obtained from operational automatic identification and

      Figure 10. Example of the operational Icelandic                 Figure 12. True Colour Reproduction image from the
                      dust forecast                                    Himawari-8 satellite for 00 UTC on 29 March 2018
                                                               5
Figure 13. The results show that the pattern reproduced            CHALLENGES IN DUST OBSERVATION IN REMOTE DESERT
by the models is in good agreement with the ground-                REGIONS
based observation of SDS events.
                                                                   Measuring atmospheric dust near the sources is not a
Capacity building                                                  trivial issue. Most of the desert regions where mineral
                                                                   dust is lifted and transported over long distances are very
                                                                   sparsely populated and poorly communicated remote
WARNING ADVISORY SYSTEM FOR SAND AND DUST STORM                    regions in which the deployment, maintenance, and
IN BURKINA FASO                                                    periodic calibration of instruments are complex tasks
                                                                   due to logistical limitations. Under the WMO SDS-WAS
Burkina Faso is a land-locked African country lying in             NAMEE Node Regional Center, and through the WMO
the transition zone between the Sahara to the north                CIMO Izaña Testbed for Aerosols and Water Vapour
and the humid equatorial region to the south. It has a             Remote Sensing instruments, some projects are currently
primarily tropical climate with a rainy season from May/           being developed to improve dust observation capacity in
June through September, a little shorter in the northern           these regions, and specifically, in the Sahara desert. The
part of the country, and a dry season, when a hot dry              most important parameter to characterize and monitor
wind called harmattan blows from the Sahara. During                atmospheric dust variations is AOD, together with the
the dry season, frequent duststorms are one of the                 derived Ångström Exponent parameter, with which dust
main meteorological hazards affecting the population.              predominance over total aerosols can be assessed. AOD
Outbreaks of meningococcal meningitis, a bacterial                 is also commonly used to evaluate dust observations
infection of the thin tissue layer that surrounds the brain        from satellite and modelled dust concentrations. Two
and spinal cord, occur worldwide, yet the highest incidence        different approaches have been followed. Firstly, a
is found in the “meningitis belt”, a part of sub-Saharan           new methodology based on the comparison of down-
Africa extending from Senegal to Ethiopia and including            welling zenith sky radiance observations performed
the entire territory of Burkina Faso.                              with a zenith-looking multichannel radiometer with a
                                                                   look-up table of computed zenith sky radiances is used
A warning advisory system for sand and duststorms                  to estimate AOD. This technique provided excellent
has been launched for the 13 administrative regions into           results compared to those from classic sun-photometers
which the territory of Burkina Faso is divided: https://sds-       (Almansa et al., 2017). It avoids the use of suntracking,
was.aemet.es/forecast-products/burkina-faso-warning-               making it more robust, automated, and available at a
advisory-system. Its core is a universally understood              lower cost. Secondly, within the frame of the Global
product based on colour-coded maps that indicate the               Learning and Observations to Benefit the Environment
risk of high dust concentrations during the next 48 hours          (GLOBE) Program, the capacity of low-cost handheld
(Figure 14). The warning levels are computed using the             photometers for dust-event observations and early
dust surface concentration predicted by the SDS-WAS                warning is being tested. Although these photometers
multi-model median, which is daily generated from twelve           were discarded decades ago by WMO for aerosol
numerical predictions released by different meteorological         monitoring under background conditions due to their
services and research centers around the world. The                poor accuracy and low long-term stability, their enormous
warning thresholds are set differently for each region             utility for dust-event detection in desert areas has
as they are based on the climatology of the prediction             been demonstrated (Guirado et al., 2014). Currently, the
product itself, using a percentile-based approach.                 possibility of using very low-cost handheld photometers
                                                                   to report quantitative column dust information every
This system has been designed and is operated by the               3 hours as part of SYNOP reports from many small
State Me-teorological Agency of Spain (AEMET) and the              aerodromes located in remote regions is a plausible
Barcelona Su-percomputing Center (BSC) in collaboration            option suitable for model data assimilation and AOD
with the Burkina Faso National Meteorological Agency.              satellite data evaluation.

Figure 13. Ensemble mean surface dust concentration from
Asian Node Center and observed SDS events at 00 UTC on                  Figure 14. Warning advisory product released on
                     29 March 2018                                           23 March 2018 valid for 25 March 2018
                                                               6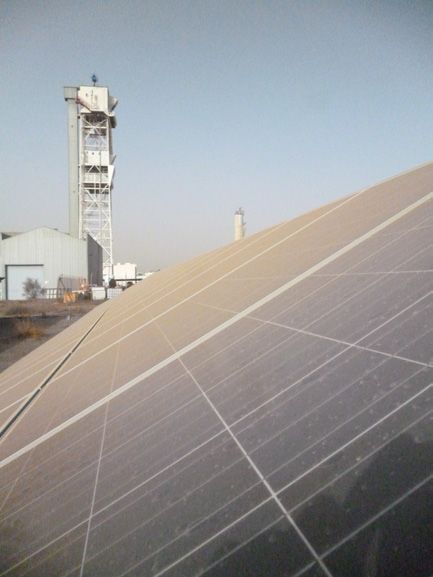
The cleaning operators have to find the best trade-off
                                                                   between reduced cleaning costs and increased optical
                                                                   solar plant efficiency. A parameter to describe the effect
                                                                   of soiling is the cleanliness of the mirror/PV module. The
                                                                   cleanliness is calculated by comparing the reflectivity/short
                                                                   circuit current of a soiled mirror/panel to its reflectivity/
                                                                   short circuit current in the clean state. The site and
                                                                   time-dependent soiling-rate is defined as the daily loss
                                                                   of cleanliness. CSP soiling rates are approx. 8–10 times
                                                                   higher than PV (for example, 0.35%/day and 0.04%/day at
                                                                   the Plataforma Solar de Almería, Spain) (Bellmann, 2017).
                                                                   Measuring, modelling and forecasting of soiling therefore
                                                                   helps to increase the plant output as well as decrease
                                                                   water consumption by optimizing cleaning strategies.
                                                                   Methods to measure and model site-dependent real-
                                                                   time soiling rates and methods for mitigation have been
   Figure 15. inDust participating countries. At present,          developed and validated (Wolfertstetter et al., 2012, 2018).
      the network includes 48 countries coloured in                In a recently started European project, the integration of a
                   orange on the map.                              soiling model to the NMMB-MONARCH atmospheric dust
                                                                   forecasting model run at the Barcelona Supercomputer
inDust – LOOKING FOR DUST SERVICES                                 center is foreseen. The aim of the activity is a 72 hour
                                                                   forecast of soiling rates as well as a soiling map that can
As a complement to the research mission of the WMO                 be used in CSP plant site selection.
SDS-WAS, the international consortium of the EU-COST
Action “International Network to Encourage the Use of              Airborne dust particles also affect the contribution
Monitoring and Forecasting dust Products” (inDust,                 of circumsolar radiation to direct normal irradiance.
www.cost-indust.eu) has been launched in 2017 to make              Depending on the atmospheric conditions, a considerable
better exploitation of dust information on the end user            fraction of solar radiation is scattered towards the
side. inDust is searching to identify the gaps in the dust         circumsolar region (Figure 17). Circumsolar radiation
research as well as to exploit dust observations and               is only partially used by concentrating collectors
forecast products best suited to be transferred/tailored           and therefore sunshape measurements have to be
to the needs of end users. Within these objectives, inDust         considered for performance evaluation of CSP plants.
is building capacity through the high-level training of            Not considering the correct contribution of circumsolar
end users (stakeholders from different socio-economic              radiation in plant yield simulations lead to under- or
sectors) to use delivered dust products efficiently, and to        overestimations in the annual yield of several percent
establish collaboration between project partners in the            (Wilbert et al., 2018).
inDust network through the organization, participation
and support of different events such as training schools,          The site- and time-dependent loss of radiation between
conferences and workshops.                                         the heliostat field and the receiver of a CSP tower
                                                                   plant due to atmospheric extinction also significantly
Because, airborne dust transport has diverse effects at            influences its efficiency (Figure 18).The absorption
local, regional and global scales, inDust network involves         and scattering processes in the atmosphere can cause
a multidisciplinary and international group of experts             higher losses than accounted for in standard plant
on aerosol measurements, regional aerosol modelling,               optimization tools (for example, several percent of
stakeholders and social scientists as well as potential end        the annual plant yield in desert regions). Different
users from different socio-economic sectors affected by            measurement methods and models suitable for CSP
the presence of high concentrations of airborne mineral            resource assessment have been developed recently
dust (e.g. health, energy and transportation) from 48              to enable a site- and time-dependent atmospheric
countries (see Figure 15).                                         attenuation evaluation and therefore to optimize CSP
                                                                   plants design (Hanrieder et al., 2017).

THE IMPACT OF DUST ON THE GENERATION OF SOLAR
ENERGY

Dust plays an important role in solar technologies,
especially in Concentrating Solar Power (CSP). Its influence
on optical losses at mirror surfaces, the incoming radiation
profile as well as on the atmospheric extinction is of
importance to project developers, plant owners and
operators.

The dust deposition (soiling) of Photovoltaic (PV) panels
or solar mirrors of CSP plants reduces the output of the
power plant and increases the cleaning costs as well as
water consumption which is especially an issue in desert
environments (see Figure 16).                                        Figure 16. Soiled PV panel (left) and CSP trough (right)

                                                               7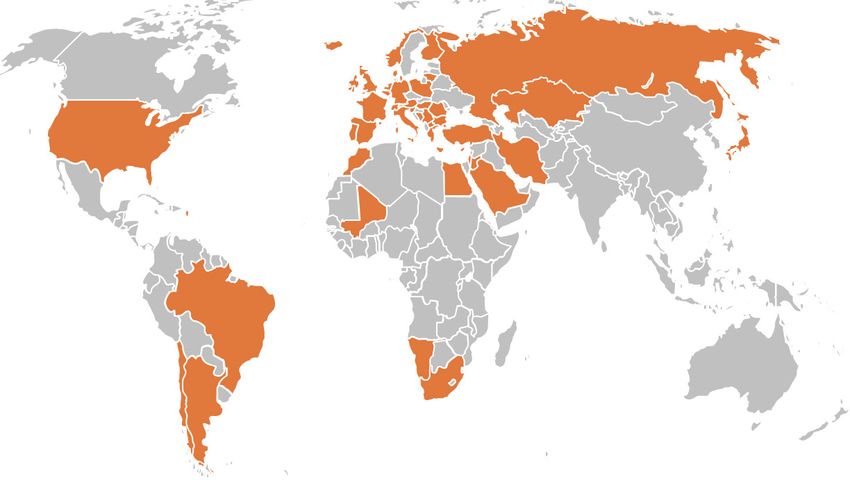
Figure 17. Circumsolar radiation is forward scattered                         Figure 18. CSP tower plant CESA1 at the Plataforma Solar
 solar radiation. Concentrating collectors use nearly the                            de Almería on a clear (left) and hazy (right) day.
  complete disk radiation and a smaller fraction of the
                   circumsolar radiation.

References                                                                     Wolfertstetter, F., et al., 2012: A Novel Method for Automatic Real-
                                                                                  Time Monitoring of Mirror Soiling Rates.
Almansa, A.F., et al., 2017: A new zenith-looking narrow-band                  Wolfer tstet ter, F., et al., 2018: Integration of Soiling- Rate
    radiometer-based system (ZEN) for dust aerosol optical depth                  Measurements and Cleaning Strategies in Yield Analysis of
    monitoring. Atmospheric Measurement Techniques, 10(2):                        Parabolic Trough Plants. Journal of Solar Energy Engineering,
    565-579.                                                                      140(4): 041008.
Arnalds, O., et al., 2016: The Icelandic volcanic aeolian environment:         Zarasvandi, A., et al., 2011: Spatio – temporal occurrences and
    Processes and impacts. Aeolian Research, Volume 20.                           mineralogical – geochemical characteristics of airborne
Beckett, F., et al., 2017: Quantifying the mass loading of particles              dusts in Khuzestan province, southwestern Iran. Journal of
    in an ash cloud remobilized from tephra deposits on Iceland.                  geochemical exploration, 111(3), 138-151. https://doi.org/10.1016/j.
    Atmospheric Chemistry and Physics, 17(7): 4401-4418.                          gexplo.2011.04.004
Bellmann, P., 2017: Investigation of soiling on mirror and glass
    samples with regard to power losses in CSP and PV technologies.
Benedetti, A., et al., 2014: Operational Dust Prediction. (P. Knippertz        Contacts
    and J.-B.W. Stuut eds.), In: Mineral Dust: A Key Player in the
                                                                               WMO SDS-WAS:
    Earth System. Springer Netherlands, Dordrecht, pp. 223-265.
Cao, H., et al., 2015: Identification of sand and dust storm source            http://www.wmo.int/sdswas
    areas in Iran. Journal of Arid Land, 7(5): 567-578.
                                                                               email: abaklanov@wmo.int
Gelaro, R., et al., 2017: The Modern-Era Retrospective Analysis for
    Research and Applications, Version 2 (MERRA-2). Journal of                 WMO SDS-WAS Regional Center for Northern Africa,
    Climate, 30(14): 5419-5454.                                                Middle East and Europe:
Groot Zwaaftink, C.D., et al., 2017: Temporal and spatial variability of
    Icelandic dust emissions and atmospheric transport. Atmospheric            http://sds-was.aemet.es
    Chemistry and Physics, 17(17): 10865-10878.                                email: sdswas@aemet.es
Guirado, C., et al., 2014: Aerosol characterization at the Saharan
    AERONET site Tamanrasset. Atmospheric Chemistry and Physics,               WMO SDS-WAS Regional Center for Asia:
    14(21): 11753-11773.
Hanrieder, N., et al., 2017: Atmospheric Extinction in Simulation              http://eng.nmc.cn/sds_was.asian_rc
                                                                               email: xiaoye@cma.gov.cn
    Tools for Solar Tower Plants. In: AIP Conference Proceedings,
    140011-1-140011-11. Elsevier. SolarPACES 2016, Abu Dhabi,                  WMO SDS-WAS Regional Center for the Americas:
    United Arab Emirates. DOI: 10.1063/1.4984519 ISSN 0094-243X
Hu, X.Q., et al., 2008: Operational retrieval of Asian sand and dust           http://sds-was.cimh.edu.bb/
    storm from FY-2C geostationary meteorological satellite and its            email: asealy@cimh.edu.bb
    application to real time forecast in Asia. Atmospheric Chemistry
    and Physics, 8(6): 1649-1659.                                              Editorial board
Nickovic, S., et al., 2014: SDS-WAS Science and Implementation
    Plan: 2011-2015. World Meteorological Organization, Geneva.                Xiaoye Zhang (Chinese Academy of Meteorological Sciences,
Niu, T., et al., 2008: Data assimilation of dust aerosol observations          CMA), Enric Terradellas (State Meteorological Agency of Spain),
    for the CUACE/dust forecasting system. Atmospheric Chemistry               Slobodan Nickovic (Republic Hydrometeorological Service of
    and Physics, 8(13): 3473-3482.                                             Serbia), Andrea Sealy (Caribbean Institute for Meteorology and
Terradellas, E., et al., 2015: Airborne dust: a hazard to human health,        Hydrology, Husbands, St. James, Barbados) and Alexander
    environment and society. World Meteorological Organization                 Baklanov (WMO)
    Bulletin, 64(2): 44-48.
Tong, D.Q., et al., 2017: Intensified dust storm activity and Valley           Other contributors to this issue
    fever infection in the southwestern United States. Geophysical
    Research Letters, 44(9): 4304-4312.                                        Emilio Cuevas, Ke Gui, Lin Chen, Sara Basart, Ernest Werner,
Wilbert, S., et al., 2018: Sunshape measurements with conventional             Natalie Hanrieder, Anup Prasad, Yaqiang Wang, Hailin Gui,
    rotating shadowband irradiometers. AIP Conference Proceedings,             Takashi Maki, Sang Boom Ryoo, Saviz Sehatkashani, Pavla
                                                                                                                                                         JN 19724

    2033(1): 190016.                                                           Dagsson-Waldhauserova, Olafur Arnalds, Sarah Karami, Mehdi
                                                                               Rahnama, Abbas Ranjbar.

                                                                           8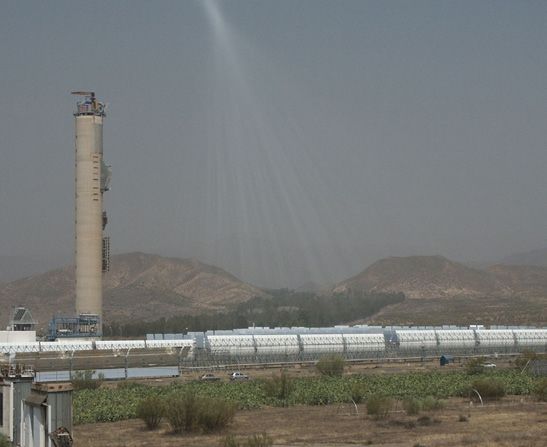

You can also read