World Heritage forests - Carbon sinks under pressure
←
→
Page content transcription
If your browser does not render page correctly, please read the page content below
World Heritage forests Carbon sinks under pressure

World Heritage forests
Carbon sinks under pressure
World Heritage forests Carbon sinks under pressure

Published in 2021 by the United Nations Educational, Scientific and
Cultural Organization (UNESCO), 7, place de Fontenoy, 75352 Paris 07 SP,
France, World Resources Institute (WRI), 10 G Street NE, Suite 800, 20002,
Washington DC, United States of America and the International Union for
Conservation of Nature (IUCN), Rue Mauverney 28, 1196 Gland, Switzerland

© UNESCO, WRI and IUCN, 2021

ISBN: 978-92-3-100480-3

This publication is available in Open Access under the Attribution
ShareAlike 3.0 IGO (CC-BY-SA 3.0 IGO) license (http://creativecommons.
org/licenses/by-sa/3.0/igo/). By using the content of this publication, the
users accept to be bound by the terms of use of the UNESCO Open Access
Repository (http://www.unesco.org/open-access/terms-use-ccbysa-en).

The designations employed and the presentation of material throughout
this publication do not imply the expression of any opinion whatsoever
on the part of UNESCO, WRI and IUCN concerning the legal status of
any country, territory, city or area or of its authorities, or concerning the
delimitation of its frontiers or boundaries.

The ideas and opinions expressed in this publication are those of the
authors; they are not necessarily those of UNESCO, WRI and IUCN and do
not commit the Organizations.

Suggested citation: UNESCO, WRI, IUCN, 2021: World Heritage forests:
Carbon sinks under pressure, Paris, UNESCO.

Images and figures marked with an asterisk (*) do not fall under the CC-BY-
SA license and may not be used or reproduced without the prior permission
of the copyright holder.

Authors: Tales Carvalho Resende (UNESCO), David Gibbs (WRI), Nancy
Harris (WRI), Elena Osipova (IUCN).

Peer reviewers: Andreas Brink, Robbert Casier, Olivia Crowe, Guy Debonnet,
Fanny Douvere, Tom Evans, Jason Funk, Oscar Guevara, Serena Heckler,
Susanna Kari, Cyril Kormos, Jim Perry, Peter Shadie, Michelle Sims, Martha-
Marie Vogel.

Acknowledgments: Gina Doubleday, Dorine Dubois, Rosie Ettenheim,
Andrea Lupi, Nolwazi Mjwara, Ernesto Ottone Ramirez, Mechtild Rössler,
Gregory Taff.

Graphic design: Scienseed SL.
World Heritage forests
Carbon sinks under pressure

World Heritage forests Carbon sinks under pressure

                                         Short summary

                                    Quantifying climate benefits
                                    from World Heritage forests
                                    Forests are some of the most biodiverse habitats on Earth and play a crucial role
                                    in climate regulation by absorbing carbon dioxide (CO2) from the atmosphere.
                                    Forests in UNESCO World Heritage sites cover 69 million hectares (roughly twice
                                    the size of Germany) and are collectively strong net carbon sinks responsible for
                                    absorbing approximately 190 million tonnes of CO2 from the atmosphere each
                                    year, equivalent to roughly half the United Kingdom’s annual CO2 emissions from

190 million
                                    fossil fuels.

                                    However, despite their global recognition and protection status at the national
  tonnes of carbon                  level, 10 World Heritage forests were net carbon sources between 2001 and
  dioxide absorbed                  2020 due to anthropogenic stressors, including land use and climate change.
from the atmosphere                 Resource use and more intense and increasingly frequent disturbances such as
      each year                     wildfires are likely to weaken World Heritage forest carbon sinks in the coming
                                    years.

                                    Ensuring strong and sustained protection of World Heritage forests and
                                    surrounding landscapes is crucial for maximizing their value as solutions
                                    to climate change mitigation, climate change adaptation and biodiversity
                                    conservation.

                                                                     “Since wars begin in
                                                                     the minds of men and
                                                                     women, it is in the minds
                                                                     of men and women that
                                                                     the defences of peace
                                                                     must be constructed.”
World Heritage forests Carbon sinks under pressure

     Contents

Highlights________________________________________________________________________ 2

Executive Summary ____________________________________________________________ 3

 1   World Heritage sites and their role in climate regulation ___________________ 5

     1.1 World Heritage sites: protecting the planet’s most iconic natural places _ 5

     1.2 Forests in the global carbon cycle ____________________________________ 6

     1.3 World Heritage forests are strong carbon sinks ______________________ 8

     1.4 World Heritage forests are major carbon stores _____________________ 12

 2    Carbon sinks and stores under threat ____________________________________ 15

     2.1 Unprecedented wildfires fueled by climate change cause emissions
     to spike ____________________________________________________________________ 18

     2.2 Increased land-use pressures from human activities weakens forest
     carbon sinks _______________________________________________________________ 20

 3    Pathways for action to protect World Heritage carbon sinks _____________ 23

     3.1 Rapid and effective responses can help prevent devastation from climate-
     related events _____________________________________________________________ 23

     3.2 Support mechanisms that maximize intactness and connectivity of
     forests ____________________________________________________________________ 25

     3.3 Integrate World Heritage sites into climate, biodiversity, and sustainable
     development agendas _____________________________________________________ 25

Conclusion _____________________________________________________________________ 26

References _____________________________________________________________________ 27

Relevant UNESCO policies, strategies and guidelines on World Heritage and
climate action _________________________________________________________________ 31

                                                                                                         1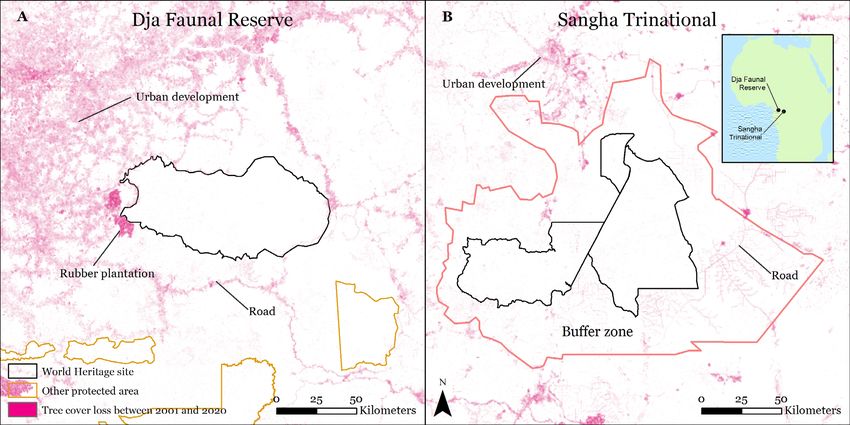
World Heritage forests Carbon sinks under pressure

                 Highlights
                 UNESCO’s 257 natural and mixed (natural and cultural) World Heritage sites contain 69 million hectares
                 of forests (roughly twice the size of Germany), but their climate benefits have not been quantified
                 before due to a lack of available data.

                 This report combines recently published maps of global forest carbon fluxes between 2001 and 2020
                 with site-level monitoring to estimate forests’ climate impacts and the climate consequences of threats
                 to UNESCO World Heritage forests.

                 World Heritage forests were collectively strong carbon sinks between 2001 and 2020, with net
                 absorption of approximately 190 million tonnes of carbon dioxide (CO2) from the atmosphere each
                 year, equivalent to roughly half the United Kingdom’s annual CO2 emissions from fossil fuels.

                 Long-term sequestration by World Heritage forests has resulted in total carbon storage of
                 approximately 13 billion tonnes, which exceeds the carbon in Kuwait’s proven oil reserves.

                 Despite their global recognition and protection status at the national level, 10 sites were net carbon
                 sources during the 2001-2020 period due to different stressors and disturbances. In the coming years,
                 heightened emissions from anthropogenic stressors including land-use pressures and climate change
                 are likely to occur at a growing number of sites worldwide. These disturbances could weaken the ability
                 of forests to absorb carbon from the atmosphere.

                 Strong and sustained protection of World Heritage forests and surrounding landscapes can contribute
                 to effective solutions for climate change mitigation, climate change adaptation and biodiversity
                 conservation.

2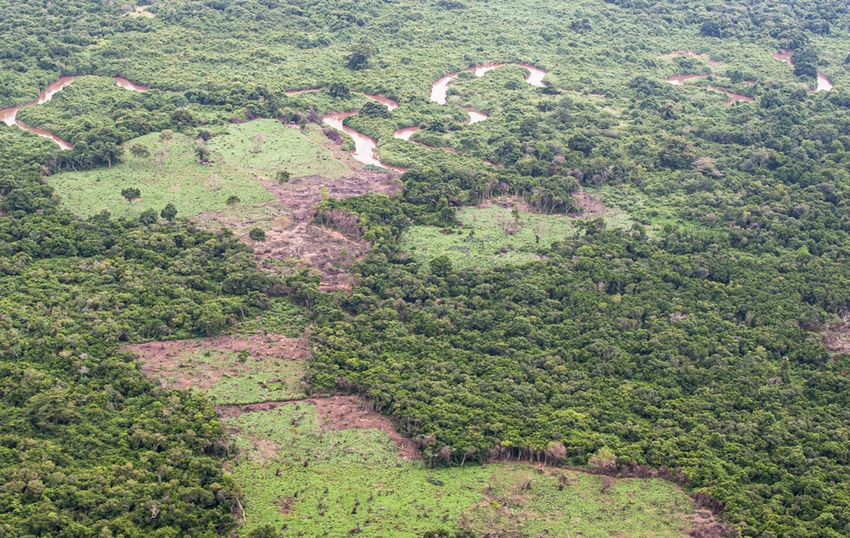
World Heritage forests Carbon sinks under pressure

Executive summary
While forests play an important role in the global carbon cycle, evaluating the climate impacts of
specific sites across diverse regions is often hampered by a lack of data. Around a quarter of the
more than one thousand sites on the UNESCO World Heritage List have been inscribed specifically for
their natural values, and many contain large tracts of forests1. Covering 69 million hectares2 (roughly
twice the size of Germany), World Heritage forests provide multiple goods and services, benefitting
nature and people. Despite having a general understanding of the climate benefits provided by these
forested sites, the degree to which they serve as sources or sinks for atmospheric CO2 had not been
quantified until now.

Combining global maps with site-level monitoring tells the carbon story. This report assesses for
the first time forest greenhouse gas (GHG) emissions, sequestration (CO2 removals), and carbon (C)
storage within all 257 natural and mixed (both natural and cultural) UNESCO World Heritage sites as
inscribed until 2021, using recently published global maps of forest carbon fluxes between 2001 and
2020 (Figure ES-1)3. Based on this analysis, several sites showed spikes in emissions and/or had
emissions exceed removals and were further investigated. These and other sites were cross-checked
against on-the-ground information compiled from the monitoring process of the World Heritage
Convention4 and the IUCN World Heritage Outlook of 20205, which helped to identify the specific
pressures that were most likely to have influenced a landscape’s local carbon budget over the last 20
years.

On average, forests in natural and mixed UNESCO World Heritage sites have absorbed
approximately 190 million tonnes of CO2 from the atmosphere annually since the year 2000. This
net CO2 removal by forests is equivalent to roughly half of the United Kingdom’s annual CO2 emissions
from fossil fuels in 20196. Sequestration over centuries or millennia by World Heritage forests has
resulted in total carbon storage of approximately 13 billion tonnes, which exceeds the carbon in
Kuwait’s proven oil reserves7. The sites with the largest net carbon sinks and stores were generally in
tropical and temperate regions.

World Heritage forests provide critical climate benefits only if safeguarded from threats. Despite
their globally recognized and protected status, forests in 10 World Heritage sites were net carbon
sources during the 2001-2020 period. In the future, ongoing removal of atmospheric CO2 by forests
at these sites is not guaranteed if threats to their conservation continue. Emissions due to forest loss
from land use pressures have increased at some sites, such as the Tropical Rainforest Heritage of
Sumatra in Indonesia and the Río Plátano Biosphere Reserve in Honduras. Others have experienced
natural and anthropogenic climate-related disturbances, such as intense wildfires. Some of the
wildfires released greenhouse gas emissions greater than 30 million tonnes CO2e in a single year,
higher than the national annual emissions from fossil fuels of more than half of the countries in the
world8. Both direct land use pressures and climate change endanger sites’ carbon stores and ongoing
sequestration.

1
    UNESCO World Heritage List available from https://whc.unesco.org/en/list/.
2
    Analysis of Hansen et al., 2013.
3
    Harris et al., 2021.
4
    Paragraph 169 of the Operational Guidelines for the Implementation of the World Heritage Convention: https://whc.unesco.org/en/guidelines/.
5
    Osipova et al., 2020.
6
    Global Carbon Project, 2021.
7
    US EIA, 2021.
8
    Using 2018 emissions according to CAIT data on Climate Watch (www.climatewatchdata.org).
                                                                                                                                              3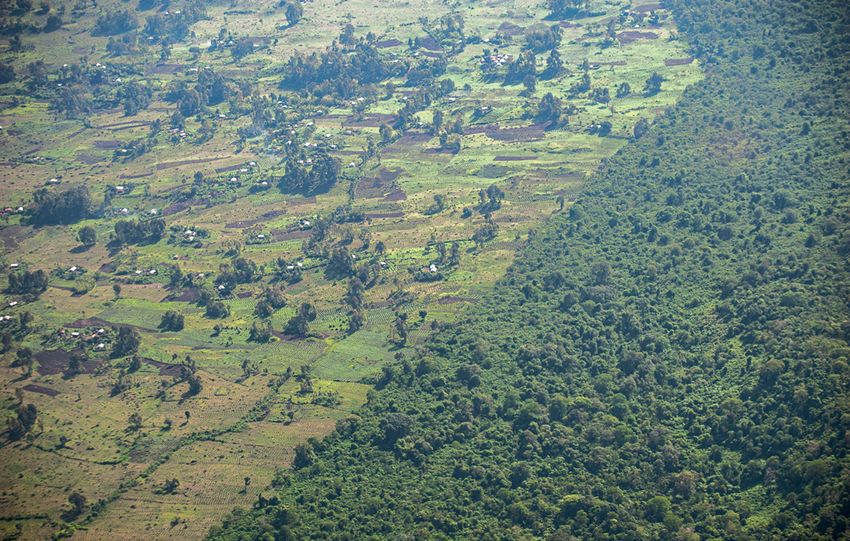
World Heritage forests Carbon sinks under pressure

                           World Heritage forests and their surrounding landscapes require strong and sustained protection
                           to maintain their roles as carbon sinks and stable carbon stores for future generations. Three
                           pathways for achieving this objective include rapidly and effectively responding to climate-related events
                           such as wildfires; maintaining and strengthening ecological connectivity through improved landscape
                           management; and integrating the continued protection of World Heritage sites into international, national
                           and local climate, biodiversity and sustainable development agendas. The successful implementation
                           of these pathways requires the use of best available knowledge generated through reliable data
                           and interdisciplinary decision-making, as well as the mobilization of public and political support for
                           sustainable financing and investments.

    Figure ES 1: Net forest carbon fluxes in natural and mixed UNESCO World Heritage sites. Values are annual averages
                 between 2001 and 2020.

    Source: Analysis (Box 1) of Harris et al. 2021 data in UNESCO natural and mixed World Heritage sites.
    Notes: CO2 equivalent (CO2e) is a measure used to aggregate the emissions from various greenhouse gases on the basis of their global warming
    potentials over 100 years, by equating non-CO2 greenhouse gases to the equivalent amount of CO2.

    69 million                                                                        13 billion
    hectares                                                                           tonnes
       of forest cover                                                              of carbon stored in
                                                                                       trees and soil
          (roughly twice the
           size of Germany)
                                          190 million                               (more carbon than Kuwait’s proven
                                                                                              oil reserves)

                                            tonnes                                                                        10 sites
                                           of carbon dioxide                                                               were net carbon
                                        absorbed (net) from the                                                         sources from 2001 to
                                         atmosphere each year                                                            2020 due to natural
                                         (equivalent to approximately half of the                                        and anthropogenic
                                         United Kingdom’s annual CO2 emissions                                              disturbances,
                                                    from fossil fuels)                                                    including climate
                                                                                                                               change

4
World Heritage forests Carbon sinks under pressure
                                                                                                                                                1
Central Highlands of Sri Lanka (Sri Lanka) © UNESCO

         World Heritage sites and their role in
         climate regulation
            1.1   World Heritage sites: protecting the planet’s most
                  iconic natural places

        Adopted in 1972, the Convention Concerning the Protection of the World Cultural and Natural Heritage
        (World Heritage Convention) unites 1949 countries in a shared objective to protect and cherish the world’s
        most outstanding natural and cultural heritage. Under this unique international Convention, more than
        a thousand natural, cultural and mixed (both natural and cultural) sites are currently recognized for their
        Outstanding Universal Value (OUV) – “cultural and/or natural significance which is so exceptional as to
        transcend national boundaries and to be of common importance for present and future generations of
        all humanity”10 – and inscribed on the UNESCO World Heritage List11. About a quarter of these World
        Heritage sites are inscribed on the List on the basis of their natural values. They are distributed across
        more than 110 countries and cover approximately 350 million hectares (Mha), roughly the surface area of
        India (Table 1). Collectively, they include almost 1% of the Earth’s land surface and 0.6% of the world’s oceans.

        Table 1: Number of sites and total area and forest area in natural and mixed UNESCO World Heritage sites

            Region                                          Number of sites              Site area (Mha)         Forest area in 2000 (Mha)

            Africa                                          44                           40                      13

            Arab states                                     8                            10                      0

            Asia-Pacific                                    79                           114                     16

            Europe, Canada and US                           80                           142                     22

            Latin America and Caribbean                     46                           43                      19

            Global Total                                    257                          349                     69

        Source: UNESCO World Heritage List
        Notes: Sites are as of October 2021. UNESCO organizes its Member States into five regional groups: Africa, Arab States, Asia and the Pacific,
        Europe and North America, and Latin America and the Caribbean. Within each site, forest area was estimated as the area with tree canopy
        density >30% in 2000, based on Hansen et al., 2013. Forest areas were identified in 223 sites.

        Natural and mixed UNESCO World Heritage sites12 cover diverse ecosystems such as caves, deserts,
        islands, lakes, wetlands, glaciers, mountains, volcanoes, coastal and marine areas, savannas, and
        forests. They include landscapes that harbour singular natural beauty, places representing major stages
        of Earth’s history, habitats where significant ecological and biological processes take place, as well
        as biodiversity hotspots that shelter unique and threatened species13. In addition to their Outstanding
        Universal Value and globally important contribution to biodiversity conservation, these sites also

        9
             Countries that have adhered to and have ratified the World Heritage Convention are known as State Parties.
        10
             Paragraph 49 of the Operational Guidelines for the Implementation of the World Heritage Convention: https://whc.unesco.org/en/guidelines/.
        11
           897 cultural, 218 natural and 39 mixed as of October 2021. Among the 257 natural and mixed sites, 50 have been inscribed for their marine
        values. Site list available from https://whc.unesco.org/en/list/.
        12
             The combination of natural and mixed sites is hereafter referred to as World Heritage sites.
        13
             Managing Natural World Heritage: https://whc.unesco.org/en/managing-natural-world-heritage/.
                                                                                                                                                        5
World Heritage forests Carbon sinks under pressure

                     contribute to the well-being of local communities and wider human society. They support the
                     heritage, livelihoods and traditional lifestyles of Indigenous Peoples, and play a key role in regional
                     and national socio-economic development by providing countless products and services to millions
                     of people. For example, over 90% of listed natural sites create jobs and provide income to local
                     communities from tourism and recreation14. World Heritage sites also provide crucial ecosystem
                     services, as two-thirds of sites are critical sources of fresh water, and about half help prevent hazards
                     such as floods or landslides15.

                     Many natural sites protect unique forest ecosystems, from the tropical rainforests of Salonga
                     National Park16 in the Democratic Republic of the Congo to the boreal landscapes of Pimachiowin
                     Aki17 in Canada (Figure 1). The integrity of these ecosystems is essential for maintaining the
                     ecological processes that underpin both their Outstanding Universal Value and their provisioning of
                     ecosystem services, including carbon sequestration and storage18.

    Figure 1: The tropical rainforests of Salonga National Park in the Democratic Republic of the Congo (left) and the
    boreal landscapes of Pimachiowin Aki in Canada (right)

      © Cody Pope                                                    © Pimachiowin Aki / Hidehiro Otake*

                      1.2     Forests in the global carbon cycle
                     Carbon dioxide (CO2) is constantly exchanged between terrestrial vegetation, the ocean, and the
                     atmosphere as part of the global carbon cycle (Figure 2). This transfer of carbon is sometimes
                     referred to as the “fast” carbon cycle, as carbon cycles through these systems several orders
                     of magnitude faster than the relatively “slow” carbon cycle, during which carbon moves among
                     rocks, soil, ocean and atmosphere and is buried underground or deep in the ocean19. The global
                     carbon cycle is balanced when the amount of carbon released into the atmosphere is equal to the
                     amount absorbed from the atmosphere by the ocean and land. By burning fossil fuels such as coal,
                     petroleum and natural gas, humans have been disrupting the “fast” carbon cycle by adding “old”
                     carbon from the “slow” carbon cycle to the atmosphere at a faster rate than terrestrial vegetation
                     and the ocean can absorb and store the excess carbon20. This leads to the buildup of CO2 in the
                     atmosphere, resulting in global climate change.

                     Over long time periods, forests naturally absorb more carbon from the atmosphere than they release
                     into it, making them carbon sinks even into very old age21,22. Under no or minimal human disturbance,
                     this results in forest ecosystems with large, stable carbon stocks strengthened by high ecosystem
                     integrity, that can store that carbon for millennia or longer23. In fact, more carbon is stored in the

                     14
                          Spenceley et al., 2021.                                 20 Intergovernmental Panel on Climate Change
                     ¹5   Osipova et al., 2014.                                   (IPCC), 2019.
                     16   https://whc.unesco.org/en/list/280/.                    21 Duque et al., 2021.
                     17   https://whc.unesco.org/en/list/1415/.                   22 Qie et al., 2017.
                     18   Osipova et al., 2014.                                   23
                                                                                       Barber et al., 2020.
                     19   NASA, 2011.
6
World Heritage forests Carbon sinks under pressure
world’s forests (roughly 861 gigatonnes of carbon (Gt C) or 3,160 Gt CO224,25) than in extractable
fossil fuel deposits (roughly 750 Gt C or 2,750 Gt CO226). Carbon in forests is mainly stored in trees
(aboveground biomass), roots (belowground biomass) and soils27.
The rate at which forests remove carbon from the atmosphere depends on the age and productivity
of the forest, as well as the composition of tree species and environmental conditions28. However,
human activity can turn forested areas into a net source of carbon. Dead trees that are burned or left
to decompose release a portion of their carbon into the atmosphere, while fires also produce other
potent greenhouse gases such as methane (CH4) and nitrous oxide (N2O). When forests are cleared,
degraded or burned, either as a management practice to clear land for a new land use, or due to
natural and human-driven forest disturbances, these gases are released into the atmosphere29,30. Over
the last few centuries, land use change, deforestation, forest degradation and agricultural expansion have
contributed (to a lesser degree than fossil fuels31) to higher concentrations of CO2 in the atmosphere32.
Figure 2: Simplified overview of the movement of carbon through the planet’s living (biotic) components, sometimes
referred to as the “fast” portion of the global carbon cycle.
Burning fossil fuels and Changing land use with Vegetation (forests) and The ocean and the
cement production releases deforestation, fires and soils absorb and release atmosphere exchange
extra carbon and GHG into agriculture can release carbon, but overall take gases at the surface
the atmosphere carbon to the atmosphere carbon out of the atmosphe- leading to net absorption
re. They form natural carbon by the ocean
sinks
CO2
CO2
CO2 CO2
CO2
Mangroves, seagrasses,
marshes (Blue carbon)
c c
c c c c
c cc c c c c c
c c c c c
c c
c c
Carbon sequestration
c c
into soil c
Source: UNESCO
The amount of carbon forests release and absorb over time depends on a few major factors. The
primary determinants affecting emissions are disturbance type and intensity, as well as the amount
of carbon stored in the forest and released into the atmosphere upon clearing33. Given that older,
more mature forests generally store more carbon per unit area than younger or recovering forests,
emissions are highest when these forests are completely and permanently cleared (Figure 3)34,35.
However, disturbances and associated emissions occur along a continuum. Low intensity disturbances,
such as understory fires, usually only release a small amount of the stored carbon, and can be
24
1 gigatonne of carbon (Gt C) released into the atmosphere 28
Cook-Patton et al., 2020. 33
Baccini et al., 2012.
corresponds to 3.67 gigatonnes of CO2 (Gt CO2). 29
IPCC, 2019. 34
IPCC, 2006.
25
Pan et al., 2013. 30
Janowiak et al., 2017. 35
Alexandrov, 2007.
26
Heede and Oreskes, 2016. 31
Blanco et al., 2014.
27
Pan et al., 2013. 32
IPCC, 2019.
7World Heritage forests Carbon sinks under pressure
beneficial to ecosystem functioning36, whereas high intensity disturbances, such as the complete
removal of trees for the expansion of agricultural land, can release all the carbon stored in trees, as
well as some of the carbon stored in soil37.
While deforestation and other major forest disturbances lead to a relatively fast rate of emissions,
forests remove carbon from the atmosphere more gradually as they grow. In general, younger
forests recovering from past disturbances capture carbon more quickly than do mature forests,
and lower latitude (tropical or subtropical) or wet forests capture carbon more quickly than higher
latitude (temperate or boreal) or dry forests38. Disturbances followed by forest recovery result in a
pulse of emissions followed by renewed carbon capture39. However, in cleared forests that have been
permanently deforested, or degraded forests where the degrading pressures are sustained, not only
has the stored carbon been emitted, but future carbon capture does not occur, as the forest carbon
capture “pump” is effectively shut off (Figure 3).
Figure 3: Carbon storage, emissions, and removals across different forest and land use profiles.
Old forests
Cleared or
Young, recovering forests degrading forests
Carbon sinks Carbon sinks Carbon sources
High carbon storage Lower carbon storage Minimal carbon storage
Lower carbon sequestration High carbon sequestration Minimal carbon sequestration
Source: World Resources Institute
1.3 World Heritage forests are strong carbon sinks
While scientific understanding of the role of forests in the global carbon cycle has improved thanks
to data synthesis efforts and large-scale monitoring40,41,42, evaluating forest climate impacts on a
local scale has often been hampered by a lack of available monitoring data, particularly in the many
countries that lack comprehensive and repeated forest inventories43. Recent research has combined
limited ground measurements with remote sensing observations, enabling forest-atmosphere carbon
fluxes to be assessed at higher spatial resolution over larger geographic areas44,45. Quantifying carbon
stocks and forest-atmosphere fluxes (the carbon stored in forests and the CO2 released into or
absorbed from the atmosphere, respectively) is crucial for assessing the contribution of World Heritage
sites to climate regulation and for understanding their potential role in climate change mitigation.
This report presents results derived from a new analysis of carbon fluxes occurring within World
Heritage sites (Box 1). The data indicate that, over the past 20 years, the 69 million hectares of forests46
(roughly twice the size of Germany) within these sites have collectively served as a net carbon sink of
36
Goetz et al. 2012. 42
FAO, 2020.
37
Zhou et al., 2013. 43
Nesha et al., 2021.
38
IPCC, 2006. 44
Baccini et al., 2017.
39
Williams et al., 2012. 45
Xu et al., 2021.
40
https://www.globalcarbonproject.org/. 46
Forest area is as of the year 2000, using Hansen et al., 2013. This value
41
Malhi et al., 2021. includes 2.9 Mha in terrestrial components of marine World Heritage sites.
8World Heritage forests Carbon sinks under pressure
approximately 190 million tonnes of CO2 equivalent per year (Mt CO2e/yr)47. This annual carbon sink
estimate is equivalent to about half of the United Kingdom’s annual CO2 emissions from fossil fuels in
201948 and reflects the balance between 230 Mt CO2/yr of carbon removals from forest growth and 42
Mt CO2e/yr of emissions from anthropogenic and natural forest disturbances.
In aggregate, World Heritage forests in all UNESCO geographic regions and climate domains were
net sinks. Despite relatively similar total forest areas distributed across sites in each UNESCO region,
Europe and North America and Asia and the Pacific were stronger net carbon sinks than Latin America
and the Caribbean and Africa (Figure 4a). When net carbon fluxes are summarized by broad climate
domain rather than geographic region, tropical and temperate sites were the strongest net sinks, with
subtropical sites closest to neutral (Figure 4b).
Figure 4: Forest greenhouse gas fluxes (average 2001-2020, Mt CO2e/yr) in natural and mixed UNESCO World
Heritage sites aggregated by (A) UNESCO region; and (B) climate domain.
Removals Emissions Net flux Removals Emissions Net flux
(A) By UNESCO region (B) By climate domain
Forest greenhouse gas fluxes in UNESCO World Heritage sites (Mt CO2e/yr) Forest greenhouse gas fluxes in UNESCO World Heritage sites (Mt CO2e/yr)
-80 -70 -60 -50 -40 -30 -20 -10 0 10 20 -110 -100 -90 -80 -70 -60 -50 -40 -30 -20 -10 0 10 20
AFRICA: 13 Mha of forest in 44 sites BOREAL: 16 Mha of forest in 17 sites
ASIA-PACIFIC: 16 Mha of forest in 79 sites TEMPERATE: 9 Mha of forest in 51 sites
EUROPE AND NORTH AMERICA: 22 Mha of forest in 80 sites SUBTROPICAL: 4.6 Mha of forest in 69 sites
LATIN AMERICA AND CARIBBEAN: 19 Mha of forest in 46 sites TROPICAL: 40 Mha of forest in 120 sites
Removals Emissions Net flux
Forest greenhouse
Source: gas fluxes
Analysis (Boxin1)UNESCO Worldet
of Harris Heritage sites (Mt
al., 2021 CO2e/yr)
data summarized for natural and mixed UNESCO World Heritage sites.
-110 -100 UNESCO
Notes: -90 -80 organizes
-70 -60 -50its-40 -30 -20States
Member -10 0into10five20regional groups: Africa, Arab States, Asia and the Pacific, Europe and North
America, andBOREAL:
Latin America andinthe
16 Mha of forest Caribbean. The Arab States region is not included in this graph because its forest fluxes are
17 sites
significantly lower than those of other regions. It is included in all other analyses.
TEMPERATE: 9 Mha of forest in 51 sites
Between 2001 and 2020,
SUBTROPICAL: 4.6 Mha out ofinthe
of forest 257 natural and mixed sites, 166 were net sinks and 10 were net
69 sites
sources, with the remaining 81 being nearly neutral, with very small estimated annual fluxes49 (Figure 5a).
The 10 net source sites
TROPICAL: 40 Mha ofwere
forest indistributed
120 sites across all UNESCO regions and climate domains. The net
sink was concentrated within just a few sites, the five largest being: Tasmanian Wilderness (Australia),
Te Wahipounamu (New Zealand), Central Amazon Conservation Complex (Brazil), Salonga National
Park (Democratic Republic of the Congo) and Canadian Rocky Mountain Parks (Canada) (Table 2).
Collectively, these five sites accounted for around one third of the total forest net carbon sink in the
World Heritage network, while just 10 sites accounted for half of the total sink.
47
CO2 equivalent (CO2e) is a measure used to compare the emissions from various greenhouse gases on the basis of their global warming
potentials over 100 years, by equating non-CO2 greenhouse gases to the equivalent amount of CO2. Throughout this report, we refer to
greenhouse gases for emissions (since estimates include CO2, CH4 and N2O emissions) and CO2 for carbon removals. For simplicity, the terms
“net carbon sink”, “net carbon source”, and “net carbon flux” are used as shorthand to reflect the difference between forest-related greenhouse
gas emissions and CO2 removals, despite the fact that net values are reported in units of CO2e.
48
Global Carbon Project, 2021.
49
Neutral sites had net fluxes between -5 and 5 tonnes CO2e/yr. Their fluxes are included in all other analyses.
9World Heritage forests Carbon sinks under pressure
The five sites with the largest total net sinks were not necessarily the strongest sinks per unit area
(Table 2), meaning that these sites may not be the most consequential in terms of ongoing carbon
capture per hectare of forest. Sites that are not large net sinks can still play a considerable role in
regional and local climate regulation if they have high rates of carbon sequestration per hectare. In fact,
55 sites had annual net carbon sequestration rates of more than 5 tonnes CO2e/ha/yr, i.e., an average
hectare of forest absorbed more carbon each year than a typical passenger vehicle emits50 (Figure 5b).
On average, the rate of carbon sequestered by a hectare of forest within the World Heritage network
was 50% higher than the global average within forests and similar to the average rate within global
protected forests51,52. The average net rate of carbon sequestration within forested portions of sites
that are primarily marine (-5.9 tonnes CO2e/ha/yr) is considerably higher as these sites contain highly
productive mangrove forests53.
Figure 5: (A) Net forest carbon fluxes and (B) flux densities (net carbon flux per hectare of forest) in natural
and mixed UNESCO World Heritage sites. Values are annual averages between 2001 and 2020.
(A) Net forest carbon fluxes in natural and mixed UNESCO World Heritage Sites
(B) Net forest carbon flux densities in natural and mixed UNESCO World Heritage sites
Source: Analysis (Box 1) of Harris et al., 2021 data in natural and mixed UNESCO World Heritage sites.
Notes: The classification of some sites as neutral, sinks (sequestration > emissions) and sources (emissions > sequestration) is different
between the two maps because of the cut-offs between categories. Forest cover is tree cover in 2000 from Hansen et al., 2013.
50
U.S. Environmental Protection Agency (US EPA), 2018.
51
-2.7 tonnes CO2e/ha/yr (World Heritage network), -1.8 tonnes CO2e/ha/yr (forests), -2.7 tonnes CO2e/ha/yr (protected forests).
52
Global and protected area net fluxes calculated from Harris et al., 2021. Protected areas are World Database of
Protected Areas categories Ia/b and II.
53
UNESCO, 2021.
10World Heritage forests Carbon sinks under pressure
Table 2: Top five natural and mixed UNESCO World Heritage sites ranked by the size of the net carbon sink
(total and per hectare)
Rank Net carbon sink (million tonnes CO2e/yr) Net carbon sink per unit area (tonnes CO2e/ha/yr)
1 Tasmanian Wilderness (Australia) (21) Los Glaciares National Park (Argentina) (16)
2 Te Wahipounamu (New Zealand) (13) Tasmanian Wilderness (Australia) (14)
3 Central Amazon Conservation Complex (Brazil) (10) Laurisilva of Madeira (Portugal) (13)
4 Salonga National Park (DRC) (9.3) Plitvice Lakes National Park (Croatia) (12)
Ancient and Primeval Beech Forests of the Carpathians
5 Canadian Rocky Mountain Parks (Canada) (8.3)
and Other Regions of Europe (18 countries) (11)
Source: Analysis (Box 1) of Harris et al., 2021 in natural and mixed UNESCO World Heritage sites.
Notes: Table includes sites that are not primarily marine, as including these sites would result in the top five sites by net carbon sink per unit
area being marine sites with highly productive mangrove forests
Box 1: Methodology used to assess forest carbon fluxes and stocks in World Heritage sites
This report uses data54 produced by combining Earth observation data with the Intergovernmental Panel on Climate Change
(IPCC) Guidelines for National Greenhouse Gas Inventories55 to estimate forest greenhouse gas emissions, carbon removals
and net fluxes between 2001 and 2020 at 30-m resolution globally. Emissions include all carbon pools (above- and belowground
biomass carbon, dead wood, litter, and soil carbon) and three major greenhouse gases (CO2, CH4, N2O). Emissions estimates are
based on maps of tree cover loss, carbon density maps, and contextual information such as drivers of tree cover loss and fire
extent. Emissions from peatlands were based on areas presumed drained and/or burned. Estimates of forest carbon removals
include accumulation in above- and belowground biomass and are based on benchmark tree cover extent maps and spatialized
removal factors derived from a variety of sources. Net flux is estimated as the difference between emissions and removals.
Emissions are calculated annually, but removals and net flux are calculated as annual averages due to limited geospatial data on
temporal trends in forest sinks.
Carbon stocks in aboveground live woody biomass in 2000 were derived from a combination of ground inventory measurements,
airborne and spaceborne light detection and ranging (LIDAR), and optical satellite imagery, which may underestimate carbon
storage at high densities56. Belowground biomass, dead wood and litter carbon values were derived from aboveground carbon
values. Soil carbon was estimated based on version 2 of the SoilGrids database57.
This is the first time that forest carbon fluxes have been estimated across all natural and mixed UNESCO World Heritage sites.
Shapefiles of sites’ boundaries were retrieved and adapted from the World Database on Protected Areas58. Emissions, removals
and net flux estimates were analysed over the study period within terrestrial areas of site boundaries to generate the statistics
presented in this report. Carbon stock estimates come from the same data source.
The carbon stock and flux data used in this report were produced as the first iteration of a flexible data integration framework
which permits updates to different input data layers. As Earth observation advances and geospatial data related to forests
improve, the accuracy and precision of the estimates will also improve. Three limitations of the data include: the underestimation
of emissions due to the omission of numerous small-scale disturbances and forest fragmentation impacts not captured by the
Landsat satellite sensor, which may result in significant emissions globally and in certain regions59; carbon removal estimates that
do not account for tree cover gain after the year 2012 and that are based on limited spatial information; and a lack of uncertainty
values around the estimates due to the lack of available data to calculate them at site level.
54
Harris et al., 2021. 57
Hengl et al., 2017.
55
IPCC, 2006. 58
UNEP-WCMC and IUCN, 2021.
56
Issa et al., 2020. 59
Pearson et al., 2017.
11World Heritage forests Carbon sinks under pressure
1.4 World Heritage forests are major carbon stores
World Heritage forests are intended to be ecosystems with high integrity that ensure stable, long-
term carbon storage. Although other methods have been used previously to estimate the amount
of carbon stored in World Heritage forest ecosystems60, the network of sites has expanded since
previous assessments. In addition to assessing carbon fluxes (Section 1.3), this report also presents
a new analysis of forest biomass and soil carbon stored across the entire network of World Heritage
sites (Box 1).
Forest carbon stock in 2000 in natural and mixed UNESCO World Heritage sites (Gt C)
Total
Figure 6: Total carbon stocks carbonand
in natural stored at sites:
mixed UNESCO 13 GtWorld
C Heritage sites,
by climate domain Tropical
40 Mha of forest in 120 sites
Forest carbon stock in 2000 in UNESCO World Heritage sites (billion tonnes (Gt) C)
Total carbon stored at sites: 13 Gt C 4.9
Temperate
9 Mha of forest in 51 sites
Boreal Subtropical
16 Mha of forest in 17 sites 4.6 Mha of forest in 69 sites
Aboveground 0.59
plant biomass
0.37
0.59
0.48
0.10
Root 0.13 Soil 0.15 0.33
biomass carbon
0.80
1.1
1.3
2.6
Source: Analysis (Box 1) of Harris et al., 2021 in natural and mixed UNESCO World Heritage sites.
Notes: Tropical aboveground and belowground carbon stocks are so much greater than other stocks that
breaks are shown in the figure to keep stocks in other domains visible.
60
Pandey, 2012 reported 10.5 Gt C (6.3 Gt C in biomass and 4.1 Gt C in soils) in 106 sites. Osipova et al., 2014 reported
5.7 Gt C of forest carbon biomass in 130 sites in the pantropical regions.
12World Heritage forests Carbon sinks under pressure
Forests in World Heritage sites held an estimated 13 billion tonnes of carbon (Gt C) in their
aboveground biomass (6.3 Gt C), root biomass (1.7 Gt C), and soil (4.8 Gt C). The carbon stored in
World Heritage forests exceeds the carbon contained in Kuwait’s proven oil reserves61. If entirely
released into the atmosphere as CO2, this would represent almost 1.3 times the global total annual
CO2 emissions from fossil fuels62. Forests in tropical sites contained almost 70% of the World
Heritage network’s total carbon store, while having about 60% of the forest cover (Figure 6). Across
all sites, carbon stored in tree biomass was two-thirds greater than that stored in soils, although sites
in boreal forests predominantly stored their carbon in soil.
As with carbon fluxes, carbon storage was concentrated in only a few sites. Five large tropical sites
collectively stored almost 30% of the forest carbon across the World Heritage network (Table 3),
while the 12 sites with the largest carbon stocks collectively stored over half of the carbon. All but
three of these twelve sites are in the tropics, further emphasizing the high proportion of forest carbon
stored within tropical World Heritage sites.
The average biomass carbon density (aboveground plus belowground) across World Heritage forests
was 116 tonnes C/ha, similar to the amount of carbon contained in 100 barrels of oil63 and 24 tonnes
C/ha greater than average forest carbon density globally64. Fully terrestrial sites with the highest
carbon densities are found in temperate and tropical regions (Table 3). The average soil carbon
density across World Heritage forests is 69 tonnes C/ha and fully terrestrial sites with the highest
soil carbon densities are Lorentz National Park (Indonesia), Te Wahipounamu - South West New
Zealand (New Zealand), Tasmanian Wilderness (Australia), Tongariro National Park (New Zealand),
and Rwenzori Mountains National Park (Uganda) (Table 3). Some marine and coastal sites also
store carbon (known as blue carbon) at very high densities, in seagrass meadows, tidal marshes, and
mangroves (Box 2).
Box 2: Marine UNESCO World Heritage sites: blue carbon assets
Beyond forests, coastal and marine ecosystems also play an important role in carbon sequestration by capturing significant
amounts of “blue carbon”. Blue carbon is organic carbon – mainly from decaying plant leaves, wood, roots and animals – that
is captured and stored by coastal and marine ecosystems. Blue carbon ecosystems include seagrass meadows, tidal marshes
and mangroves. Forming a narrow strip that fringes the world’s coastlines, blue carbon ecosystems are highly productive, playing
important ecological roles in nutrient and carbon cycling, as nurseries and habitat for a broad range of marine and terrestrial
species, in shoreline protection and in sustaining the livelihoods and well-being of local communities. Despite representing less
than 1% of the global ocean area, the 50 sites inscribed on the UNESCO World Heritage List for their unique marine values, and
their immediate surrounding areas for which data were available, comprise at least 15% of global blue carbon assets. These
carbon stores are estimated at around 1.4 Gt C, and the five sites with the highest blue carbon stocks are: Great Barrier Reef
(Australia) (502 Mt C), Everglades National Park (United States) (400 Mt C), Banc d’Arguin National Park (Mauritania) (110 Mt C),
The Sundarbans (Bangladesh) (110 Mt C) and Sundarbans National Park (India) (60 Mt C)65.
61
13 Gt C in World Heritage forests vs. 12 Gt C contained in 102 billion barrels of 63
At 0.118 tonnes C/barrel, from US EPA, 2021.
Kuwait’s crude oil reserves. Kuwait’s crude oil reserve estimate is from US EIA, 2021 and 64
Harris et al., 2021.
the carbon estimate per oil barrel (0.118 t C/barrel) is from US EPA, 2021. 65
UNESCO, 2021.
62
36.4 Gt CO2e from fossil fuels according to the Global Carbon Project, 2021,
versus 47 Gt CO2 (13 Gt C) stored at UNESCO natural and mixed World Heritage sites.
13World Heritage forests Carbon sinks under pressure
Table 3: Top five natural and mixed UNESCO World Heritage sites ranked by forest carbon storage metrics
Total carbon stored Biomass carbon storage density Soil carbon storage density
Rank
(million tonnes C) (tonnes C/ha) (tonnes C/ha)
1 Central Amazon Conservation Redwood National and State Parks Lorentz National Park (Indonesia)
Complex (Brazil) (1020) (USA) (302) (130)
2 Salonga National Park Olympic National Park Te Wahipounamu - South West (New
(DRC) (840) (USA) (280) Zealand) (130)
3 Tropical Rainforest Heritage of Yosemite National Park Tasmanian Wilderness (Australia)
Sumatra (Indonesia) (720) (USA) (250) (120)
4 Lorentz National Park Okapis Wildlife Reserve Tongariro National Park
(Indonesia) (670) (DRC) (220) (New Zealand) (120)
5 Chiribiquete National Park Sangha Trinational (Cameroon, Rwenzori Mountains National Park
(Colombia) (570) Central African Republic, Congo) (220) (Uganda) (110)
Source: Analysis (Box 1) of Harris et al., 2021 in natural and mixed UNESCO World Heritage sites.
Notes: Lists includes only sites that are not primarily marine, as including highly productive mangrove-rich sites would dominate the carbon
storage density metrics. Blue carbon in World Heritage sites was covered in more detail in UNESCO, 2021. Total carbon storage and biomass
carbon storage density may be underestimated due to limitations of satellites to estimate very high carbon densities66.
66
Issa et al., 2020
14Ivindo National Park (Gabon) © Lee White*
World Heritage forests Carbon sinks under pressure
2
Carbon sinks and stores
under threat
As some of the world’s best protected forests, it is alarming that World Heritage sites have lost 3.5
million hectares of forest (gross loss larger than the size of Belgium) since 200067. Emissions have
increased over the past 20 years (Figure 7), and 10 sites were estimated to be net carbon sources
between 2001 and 2020 (Table 4). However, these are not the only sites with concerning emissions.
Other sites, despite remaining net carbon sinks, showed spikes or clear upward trajectories in
emissions that threaten the strength of the future sink and the stability of the existing carbon stock.
Given that World Heritage forests are generally assumed to be net carbon sinks with relatively low
emissions and stable storage for carbon due to their protected status, it is important to understand
why some sites emitted more carbon than they captured and others had spikes or clear upward
trajectories in their annual emissions.
To better understand these dynamics, the impacts of the main threats to carbon sinks and stores
at World Heritage sites were evaluated using information from the reactive monitoring process of
the World Heritage Convention68 and the IUCN World Heritage Outlook of 202069 (Box 3). These two
sources of information reveal that the two most widespread threats to World Heritage sites are climate
change and associated severe weather (e.g. fires, storms, floods, droughts, temperature extremes,
and habitat shifting/alteration) and land-use pressures associated with various human activities
such as illegal logging, wood harvesting, and agricultural encroachment due to livestock farming/
grazing and crops. These types of pressures are each reported in about 60% of World Heritage sites.
The impacts of other threats, such as the presence of invasive species, tourism, management and
institutional factors were not evaluated in this report as data on them comes from field surveys or
institutional assessments, which do not lend themselves to analysis using the geospatial carbon flux
data presented here. The impacts of these two main threats on emissions were evaluated in the 10
net carbon source sites (Table 4) and in specific sites where they have been identified by the reactive
monitoring process of the World Heritage Convention and the IUCN World Heritage Outlook of 2020.
Figure 7: Estimated annual gross forest greenhouse gas emissions across natural and
mixed UNESCO World Heritage sites
120
100
GHG emissions (Mt CO2e)
80
60
40
20
0
2001 ‘02 ‘03 ‘04 ‘05 ‘06 ‘07 ‘08 ‘09 ‘10 ‘11 ‘12 ‘13 ‘14 ‘15 ‘16 ‘17 ‘18 ‘19 ‘20
Source: Analysis (Box 1) of Harris et al., 2021 data in natural and mixed UNESCO World Heritage sites.
Notes: Changes in the methodology and data sources between 2011 and 2015 may result in higher estimates for emissions in recent years compared
to earlier years. Collectively, these changes may overestimate the increase in emissions. For more about the methodology changes, see70.
67
According to Hansen et al., 2013. 69
Osipova et al., 2020.
68
State of Conservation Information System: 70
https://www.globalforestwatch.org/blog/data-and-research/
https://whc.unesco.org/en/soc/. tree-cover-loss-satellite-data-trend-analysis/
15World Heritage forests Carbon sinks under pressure
Box 3: Monitoring the state of conservation of natural and mixed UNESCO World Heritage sites
The World Heritage Convention aims to protect the globe’s most treasured places, recognized for their Outstanding Universal Value
(OUV). To this end, it has developed a mechanism to monitor the state of conservation for sites inscribed on the UNESCO World
Heritage List: the reactive monitoring process71. This process consists of reporting on the “state of conservation of specific World
Heritage properties that are under threat [ . . .]” and allows for the identification of emerging conservation issues - both within and
beyond the immediate boundaries of sites - that threaten their Outstanding Universal Value. Each year, about 60 reports on the most
threatened natural and mixed UNESCO World Heritage sites are prepared and submitted to the World Heritage Committee, the
governing body of the World Heritage Convention72. These reports allow the World Heritage Committee to assess the conditions at the
sites and, eventually, to decide on the necessity of adopting specific measures to resolve recurrent problems73. Since 1979, over 1,500
state of conservation reports have been prepared for more than 180 natural and mixed sites, and they continue to represent one of the
most comprehensive sources of documentation for tracking conservation issues of any international convention.
To monitor sites that are not that are not included in the reactive monitoring process of the World Heritage Convention and to
provide a comprehensive assessment of all natural and mixed sites at once, the technical Advisory Body to the Convention on
nature – the International Union for Conservation of Nature (IUCN) – has developed the IUCN World Heritage Outlook74. The
reactive monitoring process of the World Heritage Convention and the IUCN World Heritage Outlook apply a standard list of threats
that is based on the Open Standards for the Practice of Conservation threats classification75, a classification widely used in the
field of nature conservation. It comprises more than 10 broad categories of threats, each of which has sub-categories. The four
categories and respective sub-categories of threats considered in this analysis were:
• climate change and severe weather (including sub-categories storms/flooding, temperature extremes, droughts, habitat shifting/
alteration),
• natural system modification (including sub-categories fire/fire suppression),
• agriculture (including sub-categories livestock farming/grazing, crops, forestry/wood production),
• biological resources use (including sub-categories logging/wood harvesting),
Despite fires being part of natural ecological processes in many dry temperate/tropical and boreal forests, and often induced by
human activities76, they are considered climate-related threats in this analysis because intense fires that have considerable impacts
on emissions are usually associated with extreme temperatures and drought conditions that are driven by climate change77.
Additionally, the agriculture and biological resources use categories have been combined under the more general term “land-use
pressures” to reflect the fact that other land uses besides agriculture can encroach on World Heritage sites.
71
Paragraph 169 of the Operational Guidelines for the Implementation of the World Heritage Convention:
https://whc.unesco.org/en/guidelines/.
72
State of Conservation Information System: https://whc.unesco.org/en/soc/.
73
One of such measures could be the inscription of a property on the List of World Heritage in Danger.
74
Osipova et al., 2020.
75
https://conservationstandards.org/library-item/threats-and-actions-taxonomies/.
76
McLauchlan et al., 2020.
77
Pechony and Shindell, 2010.
16World Heritage forests Carbon sinks under pressure
Table 4: Natural and mixed UNESCO World Heritage sites with forests that were net greenhouse gas sources over the
past 20 years, ranked by net flux.
Net emissions Emissions Removals
(thousand (thousand (thousand
Rank Site (country) Primary threat(s)/factor(s)
tonnes CO2e/ tonnes CO2e/ tonnes CO2/
ha/yr) ha/yr) ha/yr)
1 Tropical Rainforest 3000 4200 1200 Logging/wood harvesting, crops
Heritage of Sumatra
(Indonesia)
2 Río Plátano Biosphere 1200 2600 1400 Logging/wood harvesting,
Reserve (Honduras) livestock farming/grazing, fire/fire
suppression
3 Yosemite National Park 700 990 300 Fire/Fire Suppression
(USA)
4 Waterton Glacier 280 1000 750 Temperature changes, fire/fire
International Peace Park suppression
(Canada, USA)
5 Barberton Makhonjwa 91 350 260 Crops, forestry/wood production,
Mountains (South Africa) livestock farming/grazing
6 Kinabalu Park (Malaysia) 85 99 14 Crops, Earthquake in 2015
7 Uvs Nuur Basin (Russian 46 91 45 Livestock farming/grazing, fire/
Federation, Mongolia) fire suppression
8 Grand Canyon National 36 85 50 Droughts
Park (USA)
9 Greater Blue Mountains 30 3200 3100 Habitat shifting/alteration,
Area (Australia) droughts, temperature extremes,
storms/flooding), fire/fire
Suppression
10 Morne Trois Pitons 9 32 22 Climate change and severe
National Park weather (Temperature extremes,
(Dominica) Storms/Flooding - including
Hurricane Maria in 2017)
Source: Analysis (Box 1) of Harris et al., 2021 in natural and mixed UNESCO World Heritage sites. Threats are directly taken from the standard
sub-categories of the reactive monitoring process of the World Heritage Convention and the IUCN World Heritage Outlook of 2020.
Note: Values are rounded to two significant digits, so net emissions may not be exactly equal to emissions minus removals.
17World Heritage forests Carbon sinks under pressure
2.1 Unprecedented wildfires fueled by climate change cause
emissions to spike
Since the mid-2010s, intense wildfires associated with extreme temperatures and drought
conditions78,79 have been a cause of high emissions at some sites. The most prominent examples are
wildfires in the Russian Federation’s Lake Baikal in 201680, and in Australia’s Tasmanian Wilderness81
and Greater Blue Mountains Area in 2019 and 202082. Each of these wildfires generated greenhouse
gases emissions above 30 Mt CO2e in a single year, higher than the national annual emissions from
fossil fuels of more than half of the countries in the world (Figure 8)83. Other recent fires have burned
tropical forest ecosystems where fire has historically been rare, such as in Bolivia’s Noel Kempff
Mercado National Park in the Amazon Basin.
Figure 8: Estimated annual gross forest greenhouse gas emissions among select natural and mixed UNESCO World
Heritage sites with substantial fire activity
35 Tasmanian
Lake Baikal Wilderness
30
Greater
25 Blue
GHG emissions (Mt CO2e)
Mountains
20
15
10
Noel Kempff
5
Mercado NP Pantanal
0
2001 ‘02 ‘03 ‘04 ‘05 ‘06 ‘07 ‘08 ‘09 ‘10 ‘11 ‘12 ‘13 ‘14 ‘15 ‘16 ‘17 ‘18 ‘19 ‘20
Source: Analysis (Box 1) of Harris et al., 2021 among selected World Heritage sites. Selection of sites with fire activity is based on the reactive
monitoring process of the World Heritage Convention and the IUCN World Heritage Outlook of 2020.
In some cases, wildfires are ignited outside World Heritage site boundaries, where effective fire
management is weaker, rather than inside84. Consequently, emissions from fires inside World
Heritage sites (as estimated in this report) likely represent only a small portion of total fire emissions
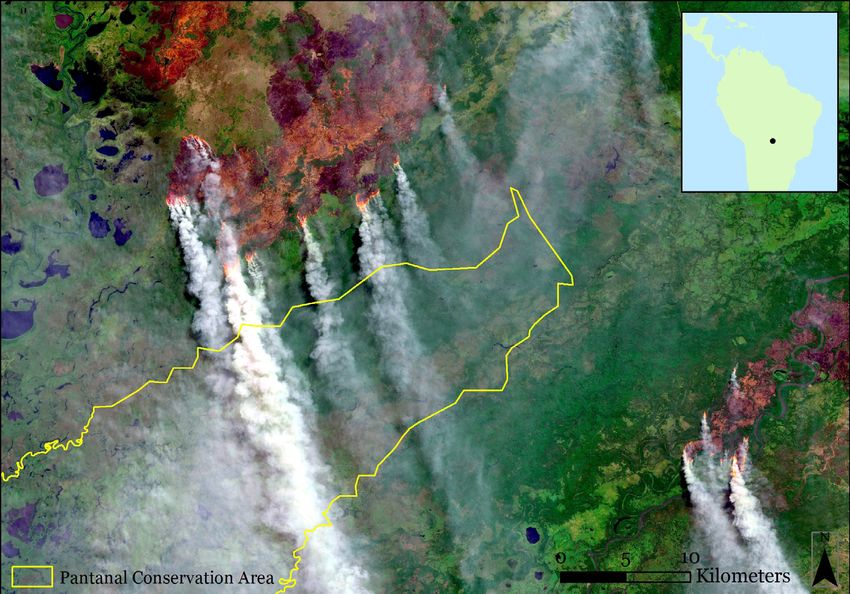
from the larger forest landscape that burned. For instance, emissions stemming from the 2020 fires
that affected the Pantanal Conservation Area World Heritage site in Brazil account for less than 5% of the
emissions that year from the broader biome located in the Pantanal Biosphere Reserve85 (Figure 9, Box 4).
78
Safronov, 2020.
79
van Oldernborgh et al., 2021.
80
State of Conservation Information System: https://whc.unesco.org/en/soc/3618.
81
State of Conservation Information System: https://whc.unesco.org/en/soc/4128.
82
State of Conservation Information System: https://whc.unesco.org/en/soc/4174.
83
Using 2018 emissions according to CAIT data on Climate Watch (www.climatewatchdata.org).
84
State of Conservation Information System: https://whc.unesco.org/en/soc/4263.
85
The Pantanal is the largest tropical wetland in the world and extends mainly into the Brazilian states of Mato Grosso
do Sul and Mato Grosso, and into national territories of the Plurinational State of Bolivia and of Paraguay. In 2000, part
of this ecoregion, the Pantanal Conservation Area, accounting for 1.3% of the Brazilian Pantanal, was inscribed on the
UNESCO World Heritage List. That same year, 26.4 million hectares were named a UNESCO Biosphere Reserve.
18World Heritage forests Carbon sinks under pressure
Figure 9: Satellite image showing wildfires close to the Pantanal Conservation Area World Heritage site in Brazil on
14 August 2020. By early October 2020, the wildfires had encroached on a small portion of the site.
Source: Copernicus. Imagery acquired by Copernicus Sentinel-2 satellites on August 14, 2020
As climate change causes warmer and drier conditions that lead wildfires to become more intense
and droughts more severe86, the ability of some forests to fully recover from such events may
become increasingly hampered, potentially exacerbated by past or present land management
practices. Recovery may be difficult even in areas where recurring wildfires constitute an integral part
of ecosystem dynamics because human-induced climate change impacts disrupt these dynamics.
More intense fires could lead to short-term emissions spikes and reduced capacity for sequestration
in the longer term, thus reducing overall carbon storage in sites that do not have a history of fires.
Some sites, such as the Greater Blue Mountains Area (Australia), Yosemite National Park (United
States), and Waterton Glacier International Peace Park (Canada/United States) have experienced
such intensification, frequency and elongation of fire seasons since 2000 that they have become net
carbon sources (Table 4, Figure 10)87.
Other climate-related events, such as storms, can also lead to considerable loss of tree cover, for
example, at Morne Trois Pitons National Park (Dominica) following Hurricane Maria in 2017. While forests
here are adapted to hurricanes and will slowly recover over time, the higher frequency and severity of
storms may reduce forests’ ability to permanently store the same amount of carbon as they did when
disturbances were less frequent and severe.
86
Seidl et al., 2017.
87
van Oldenborgh et al., 2021.
19You can also read