2023 Air Monitoring Network Plan for Minnesota - Air Quality June 2022
←
→
Page content transcription
If your browser does not render page correctly, please read the page content below
Air Quality

June 2022

2023 Air Monitoring Network Plan for
Minnesota
Federal Regulation
40 CFR § 58.10 Annual monitoring network plan and periodic network assessment.
(a)(1) Beginning July 1, 2007, the state, or where applicable local, agency shall submit to the Regional
Administrator an annual monitoring network plan which shall provide for the documentation of the
establishment and maintenance of an air quality surveillance system that consists of a network of SLAMS
monitoring stations that can include FRM, FEM, and ARM monitors that are part of SLAMS, NCore, CSN,
PAMS, and SPM stations. The plan shall include a statement of whether the operation of each monitor
meets the requirements of appendices A, B, C, D, and E of this part, where applicable. The Regional
Administrator may require additional information in support of this statement. The annual monitoring
network plan must be made available for public inspection and comment for at least 30 days prior to
submission to the EPA and the submitted plan shall include and address, as appropriate, any received
comments.

Authors                                                 Editing and graphic design
Kurt Anderson                                           Mary Blackstock
David Brown                                             Jennifer Holstad
Jerrod Eppen                                            Paul Andre
Kellie Gavin
Margaret McCourtney
Sanna Mairet
Ashley Olson
Kari Palmer
Katie Rinker
Michael Smith
Maria Takahashi
Matthew Taraldsen
Nicholas Witcraft

Contributors/acknowledgements
Jeff Laren
Binh Nguyen
Jacob Nelson
Nate Niebeling
Mike Schneider
Joseph Smith
Emma Squires-Sperling
Daniel Steltz
Ladislaus Strzok
David Wischnack

Minnesota Pollution Control Agency
520 Lafayette Road North | Saint Paul, MN 55155-4194 |
651-296-6300 | 800-657-3864 | Or use your preferred relay service | Info.pca@state.mn.us
This report is available in alternative formats upon request, and online at www.pca.state.mn.us.

Document number: aq10-21a
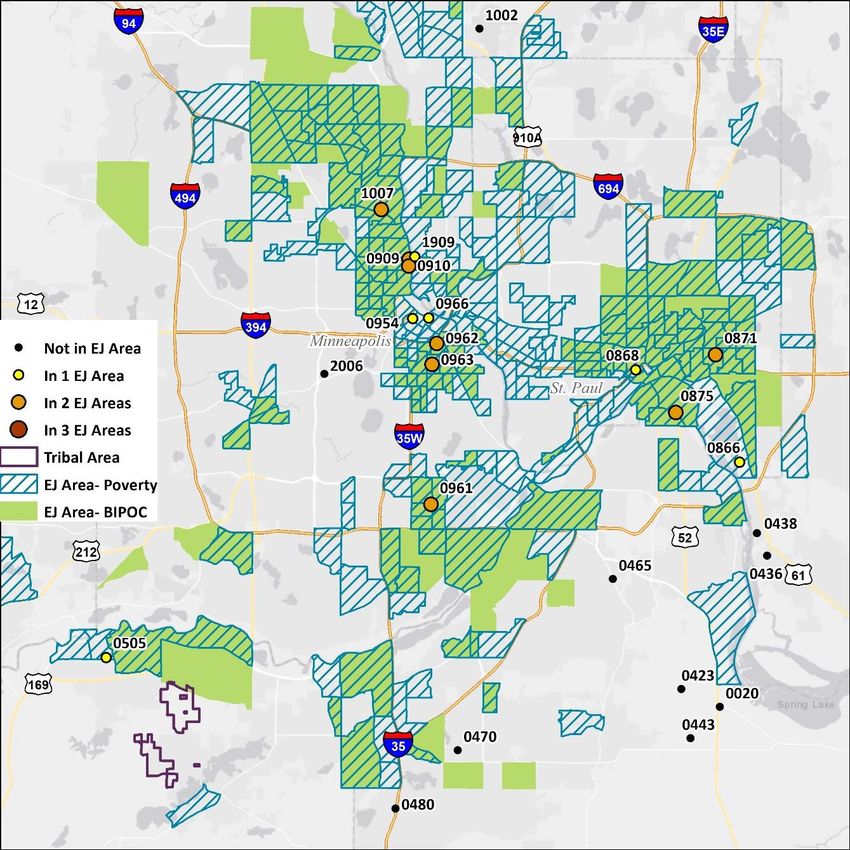
Table of contents
Table of contents ....................................................................................................................................... i
List of tables ............................................................................................................................................. ii
List of figures ........................................................................................................................................... iii
Acronyms, abbreviations, and definitions ................................................................................................. iv
1. Introduction ......................................................................................................................................... 1
2. Network overview ................................................................................................................................ 1
   2.1 Minimum monitoring requirements .......................................................................................................... 6
   2.2 Monitoring objectives................................................................................................................................. 6
   2.3 Site selection............................................................................................................................................... 6
   2.4 Network scales ........................................................................................................................................... 6
   2.5 Environmental Justice................................................................................................................................. 7
3. Quality Assurance/Quality Control program ........................................................................................ 10
4. Network assessments ......................................................................................................................... 11
   4.1 Regional network assessment .................................................................................................................. 11
   4.2 Statewide network assessment ................................................................................................................ 11
5. Types of networks .............................................................................................................................. 13
   5.1 Air Quality Index (AQI) .............................................................................................................................. 13
   5.2 State and Local Air Monitoring Stations (SLAMS) .................................................................................... 21
   5.3 Chemical Speciation Network (CSN) ......................................................................................................... 21
   5.4 Interagency Monitoring of Protected Visual Environments (IMPROVE) .................................................. 21
   5.5 National Air Toxics Trends Stations (NATTS) ............................................................................................ 22
   5.6 Near road monitoring ............................................................................................................................... 22
   5.7 National Core monitoring (NCore) ........................................................................................................... 22
   5.8 Photochemical Assessment Monitoring Stations (PAMS) ........................................................................ 24
   5.9 National Atmospheric Deposition Program (NADP) ................................................................................. 25
   5.10 Industrial networks ................................................................................................................................. 25
   5.11 Clean Air Status and Trends Network (CASTNET) ................................................................................... 26
6. Parameter networks and equipment................................................................................................... 26
    6.1 Methods and equipment .......................................................................................................................... 27
          Upcoming equipment changes ..........................................................................................................................28
   6.2 Site parameter networks .......................................................................................................................... 29
7. Criteria pollutants .............................................................................................................................. 32
          National Ambient Air Quality Standards ..................................................................................................................32
          Air quality design values ..........................................................................................................................................33
    7.1 Particulate matter .................................................................................................................................... 33
          PM2.5 - Fine particulate matter.................................................................................................................................33
          PM10-2.5 – Coarse particulate matter ........................................................................................................................38
          PM10 .........................................................................................................................................................................38
          Total Suspended Particulate matter (TSP) ...............................................................................................................39

2023 Annual Air Monitoring Network Plan • June 2022                                                                                     Minnesota Pollution Control Agency
                                                                                            i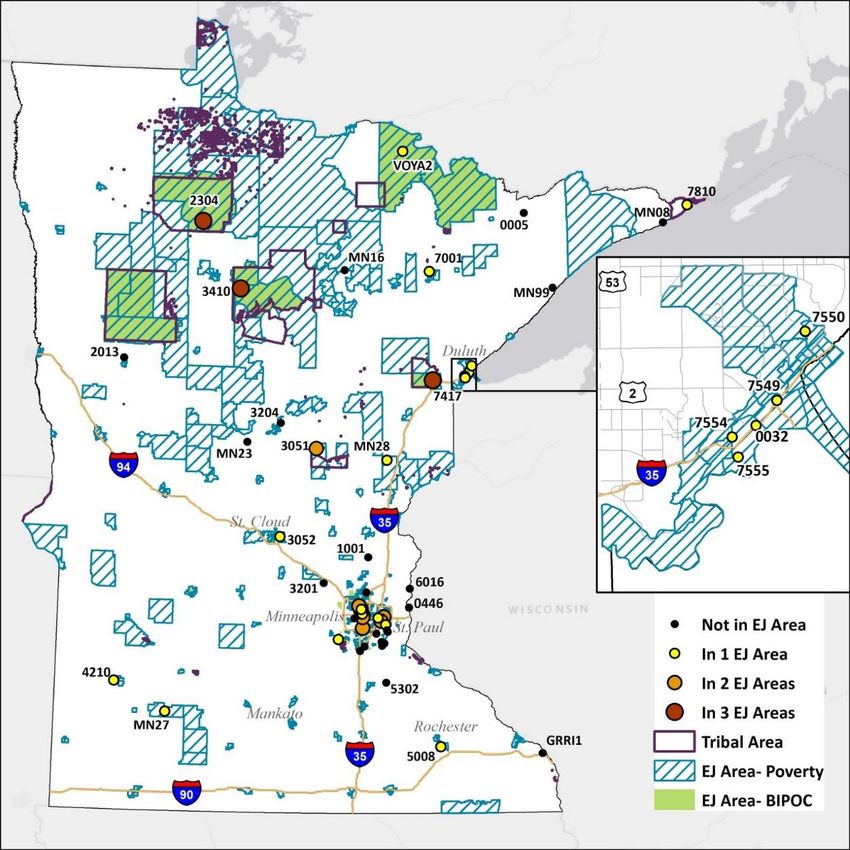
7.2 Lead (Pb) ................................................................................................................................................... 42
   7.2 Ozone (O3) ................................................................................................................................................ 43
   7.4 Carbon monoxide (CO) ............................................................................................................................. 45
   7.3 Oxides of nitrogen (NOX) .......................................................................................................................... 47
   7.5 Sulfur dioxide (SO2) ................................................................................................................................... 49
8. Air toxics ............................................................................................................................................ 50
   8.1 Metals ....................................................................................................................................................... 51
   8.2 Volatile organic compounds (VOCs) and carbonyls.................................................................................. 51
9. Other parameters ............................................................................................................................... 54
  9.1 Atmospheric deposition ........................................................................................................................... 54
  9.2 Hydrogen sulfide (H2S).............................................................................................................................. 55
  9.3 Total reduced sulfur (TRS) ........................................................................................................................ 55
  9.4 Meteorological data ................................................................................................................................. 56
  9.5 Visibility .................................................................................................................................................... 56
10. Network changes............................................................................................................................... 57
  10.1 Network changes in 2022 ....................................................................................................................... 58
  10.2 Proposed changes for 2023 .................................................................................................................... 58
11. Public inspection period .................................................................................................................... 59

List of tables
Table 1. Site information for Greater Minnesota sites active in 2022....................................................................................2
Table 2. Site information for Twin Cities metropolitan area sites active in 2022...................................................................4
Table 3. Monitoring objectives and appropriate siting scales. ...............................................................................................7
Table 4. Conclusions and Future Recommendations for Internal Network Assessment......................................................12
Table 5. Forecast locations and monitors utilized ................................................................................................................14
Table 6. Observed orange AQI days for ozone in Minnesota, 2021. ....................................................................................18
Table 7. Near-road monitoring parameters. ........................................................................................................................22
Table 8. NCore monitoring network site parameters. ..........................................................................................................23
Table 9: PAMS sampling schedules and instrumentation. ...................................................................................................24
Table 10. Methods and equipment used for parameter networks in Minnesota. ...............................................................27
Table 11: Equipment MPCA will purchase with ARP funding. ..............................................................................................28
Table 12. Number of sites per parameter network in 2022. ................................................................................................29
Table 13. 2022 Site parameters – Greater Minnesota. ........................................................................................................30
Table 14. 2022 Site parameters – Twin Cities metropolitan area. .......................................................................................31
Table 15. EPA National Ambient Air Quality Standards (NAAQS). ........................................................................................32
Table 16. Minnesota Ambient Air Quality Standards for TSP. ..............................................................................................39
Table 17. Metals monitored by MPCA in 2022. ....................................................................................................................52
Table 18. Carbonyls monitored by MPCA in 2022. ...............................................................................................................52
Table 19. VOCs monitored by MPCA in 2022. ......................................................................................................................53
Table 20. 2022 network changes. .........................................................................................................................................58
Table 21. Proposed changes for 2023. .................................................................................................................................58

2023 Annual Air Monitoring Network Plan • June 2022                                                                          Minnesota Pollution Control Agency
                                                                                     ii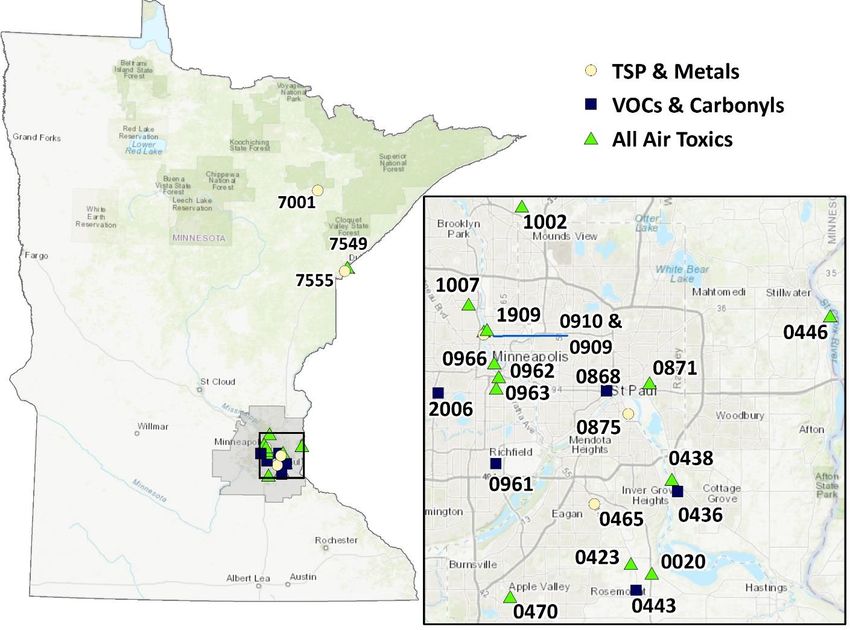
List of figures
Figure 1. 2022 air quality monitoring sites in Greater Minnesota ..........................................................................................3
Figure 2. 2022 air quality monitoring sites in the Twin Cities metropolitan area ..................................................................5
Figure 3: MPCA monitor locations in greater Minnesota showing environmental justice area status and environmental
justice areas of concern using 2016-2020 ACS 5-year census data by tract...........................................................................8
Figure 4: MPCA monitor locations in the Twin Cities Metro showing environmental justice area status and environmental
justice areas of concern using 2016-2020 ACS 5-year census data by tract...........................................................................9
Figure 5. 2022 fine particle (PM2.5) and ozone-monitoring network which serves the AQI forecast system. ......................13
Figure 6. The Air Quality Index categories and respective levels of health concern (from https://airnow.gov). ................15
Figure 7. 2021 daily observed AQI category counts for PM2.5 in Minnesota. .......................................................................16
Figure 8. 2021 daily observed AQI category counts for ozone in Minnesota. ......................................................................16
Figure 9. Annual statewide PM2.5 AQI category counts, 2001-2021. ....................................................................................17
Figure 10. Annual statewide ozone AQI category counts, 2001-2021..................................................................................17
Figure 11. Peak daily ozone AQI for Minnesota in 2021 .......................................................................................................18
Figure 12. Peak daily PM2.5 AQI for Minnesota in 2021 ........................................................................................................19
Figure 13. Maximum observed PM2.5 AQIs for 2021 ............................................................................................................19
Figure 14. Causes of air quality alerts issued in Minnesota counties, 2010-2021 ................................................................20
Figure 15. 2022 PM2.5 monitoring sites in Minnesota. .........................................................................................................34
Figure 16. Annual PM2.5 concentrations compared to the NAAQS, 2019-2021. ..................................................................35
Figure 17. 24-hour PM2.5 concentrations compared to the NAAQS, 2019-2021. .................................................................35
Figure 18. Daily average PM2.5 concentrations at several Minnesota sites, March 2021. ...................................................36
Figure 19. Hourly average PM2.5 concentrations at several Minnesota sites, weekdays in March 2021. ............................37
Figure 20. 2022 PM10 monitoring sites in Minnesota. ..........................................................................................................38
Figure 21. 24-hour PM10 concentrations compared to the NAAQS, 2019-2021...................................................................39
Figure 22. 2022 TSP monitoring sites in Minnesota. ............................................................................................................40
Figure 23. Annual average TSP concentrations compared to the primary and secondary MAAQS, 2021. ..........................41
Figure 24. 24-hour (daily) TSP concentrations compared to the primary and secondary MAAQS, 2021. ...........................41
Figure 25. 2022 lead monitoring sites in Minnesota. ...........................................................................................................42
Figure 26. Lead concentrations compared to the NAAQS, 2019-2021. ................................................................................43
Figure 27. 2022 ozone monitoring sites in Minnesota. ........................................................................................................44
Figure 28. 8-hour average ozone concentrations compared to the NAAQS, 2019-2021. ....................................................45
Figure 29. 2022 CO monitoring sites in Minnesota. .............................................................................................................45
Figure 30. 8-hour average CO concentrations compared to the NAAQS, 2020-2021. .........................................................46
Figure 31. 1-hour average CO concentrations compared to the NAAQS, 2020-2021. .........................................................46
Figure 32. 2022 NOx monitoring sites in Minnesota. ............................................................................................................47
Figure 33. Annual average NO2 concentrations compared to the NAAQS, 2021. ................................................................48
Figure 34. 1-hour NO2 concentrations compared to the NAAQS, 2019-2021. .....................................................................48
Figure 35. 2022 SO2 monitoring sites in Minnesota. ............................................................................................................49
Figure 36. 1-hour SO2 concentrations compared to the NAAQS, 2019-2021. ......................................................................50
Figure 37. 2022 Air toxics monitoring sites in Minnesota. ...................................................................................................51
Figure 38. Atmospheric deposition sites in Minnesota. .......................................................................................................54
Figure 39. Class I areas in Minnesota impacted by regional haze. .......................................................................................56
Figure 40. Visibility progress measured at Boundary Waters and Voyageurs (2004-2019) and the estimated interim
progress goal for 2018. .........................................................................................................................................................57

2023 Annual Air Monitoring Network Plan • June 2022                                                                                Minnesota Pollution Control Agency
                                                                                        iii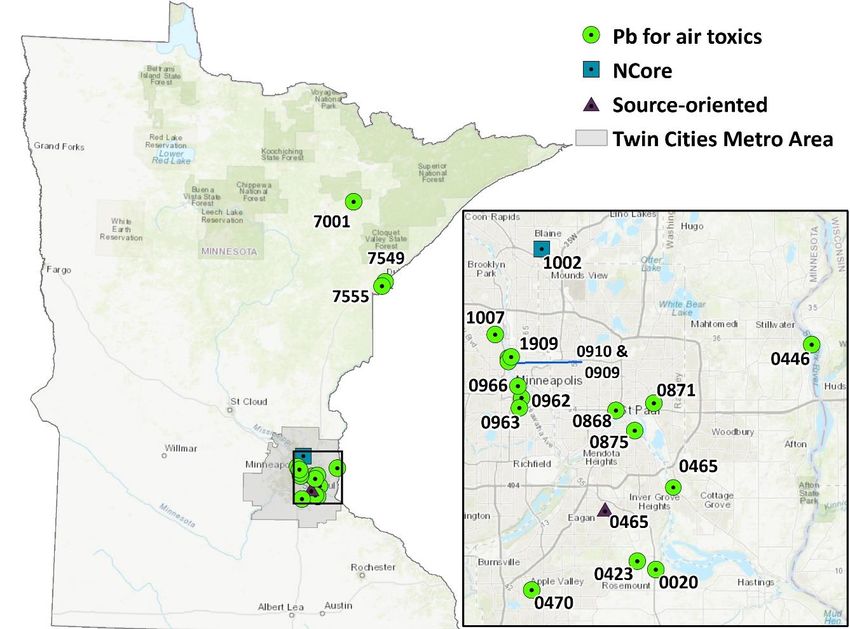
Acronyms, abbreviations, and definitions
AIRNow – air quality forecasting program
Air toxics – suite of parameters that includes VOCs, carbonyls, and metals
AQI – Air Quality Index
AQS – Air Quality System: EPA's repository of ambient air quality data
ARP – American Rescue Plan
BAM – Beta Attenuation Monitor
CAA – Clean Air Act
CAS – Chemical Abstracts Service
CASTNET – Clean Air Status and Trends Network
CBSA – Core Base Statistical Area
CFR – Code of Federal Regulations
Class I area – remote area with pristine air quality
CO – carbon monoxide
Criteria pollutants – the six pollutants regulated by the 1970 Clean Air Act (particulate matter, ozone,
nitrogen dioxide, sulfur dioxide, carbon monoxide, and lead)
CSN – Chemical Speciation Network
Design Value – a statistic that describes the air quality status of a given location relative to the level of the
National Ambient Air Quality Standards (NAAQS)
DNR – Department of Natural Resources
EPA – U.S. Environmental Protection Agency
FEM – Federal Equivalent Method
FRM – Federal Reference Method
GC/MS – Gas Chromatography/Mass Spectrometry
H2S – hydrogen sulfide
HAP – Hazardous Air Pollutant
Hg – mercury
HPLC – High Pressure Liquid Chromatography
ICP/MS – Inductively Coupled Plasma/Mass Spectrometry
IMPROVE – Interagency Monitoring of Protected Visual Environments
LADCO – Lake Michigan Air Directors Consortium
MAAQS – Minnesota Ambient Air Quality Standard
MDH – Minnesota Department of Health
MDN – Mercury Deposition Network
MOA – Memorandum of Agreement
MPCA – Minnesota Pollution Control Agency
MSA – Metropolitan Statistical Area
NAAQS – National Ambient Air Quality Standard
NADP – National Atmospheric Deposition Program
NCore – National Core Monitoring Network
NDDN – National Dry Deposition Network
NO – nitric oxide
NO2 – nitrogen dioxide
NOx – oxides of nitrogen
NOy – total reactive nitrogen
NTN – National Trends Network
O3 – ozone
PAH – Polycyclic Aromatic Hydrocarbon
PAMS – Photochemical Assessment Monitoring Stations

2023 Annual Air Monitoring Network Plan • June 2022                                  Minnesota Pollution Control Agency
                                                         iv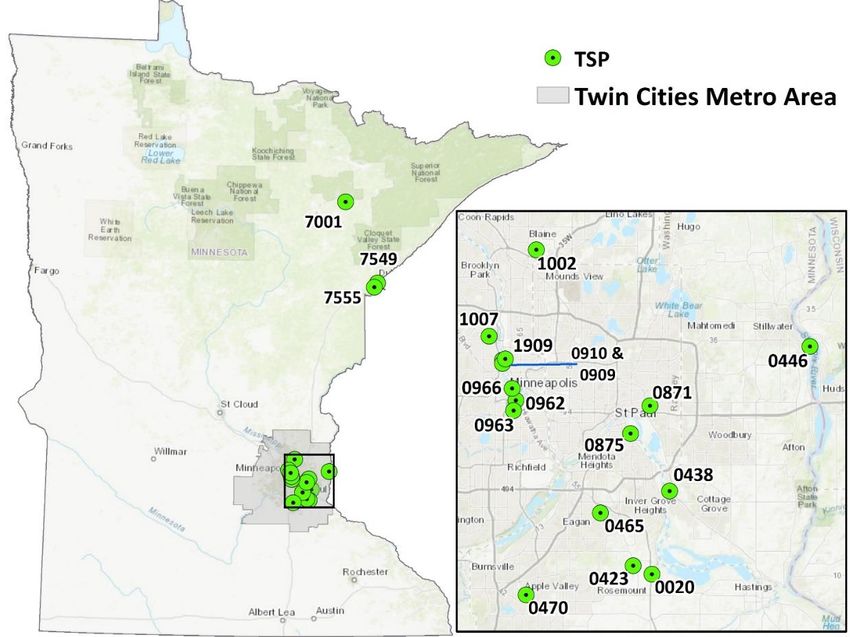
Pb – lead
PM4 – particulate matter less than 4 microns in diameter
PM2.5 – particulate matter less than 2.5 microns in diameter (fine particulate matter)
PM10-2.5 – particulate matter between 2.5 and 10 microns in diameter (coarse particulate matter)
PM10 – particulate matter less than 10 microns in diameter
ppb – parts per billion by volume
ppm – parts per million by volume
PQAO – Primary Quality Assurance Organization
Primary Standard - NAAQS set to protect public health
QAPP – Quality Assurance Project Plans
QA/QC – Quality Assurance/Quality Control
QMP – Quality Management Plan
Secondary Standard - NAAQS set to protect the environment and public welfare (i.e. visibility, crops, animals,
vegetation, and buildings)
SIP – State Implementation Plan
SLAMS – State and Local Air Monitoring Stations
SO2 – sulfur dioxide
SPM – special purpose monitoring
TO-11A – EPA method for analyzing carbonyls utilizing HPLC
TO-15 – EPA method for analyzing VOCs utilizing GC/MS
TPY – tons per year
TRS – total reduced sulfur
TSP – total suspended particulate matter
U of M – University of Minnesota
UFP – ultrafine particles (particulate matter less than 0.1 microns in diameter)
USDA – United States Department of Agriculture
USDOI – United States Department of the Interior
USG – unhealthy for sensitive groups
VOC – volatile organic compound

2023 Annual Air Monitoring Network Plan • June 2022                              Minnesota Pollution Control Agency
                                                      v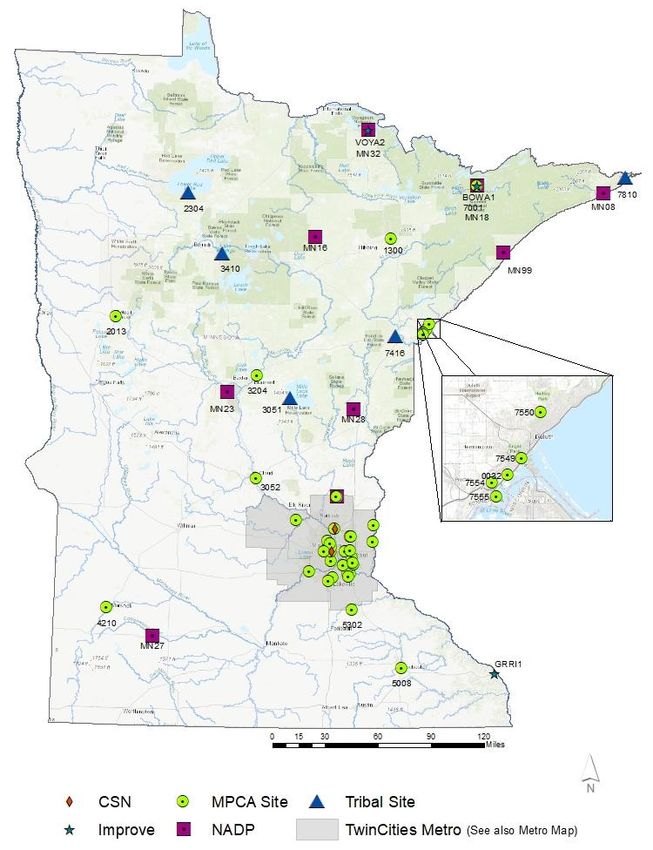
2023 Annual Air Monitoring Network Plan • June 2022        Minnesota Pollution Control Agency
                                                      vi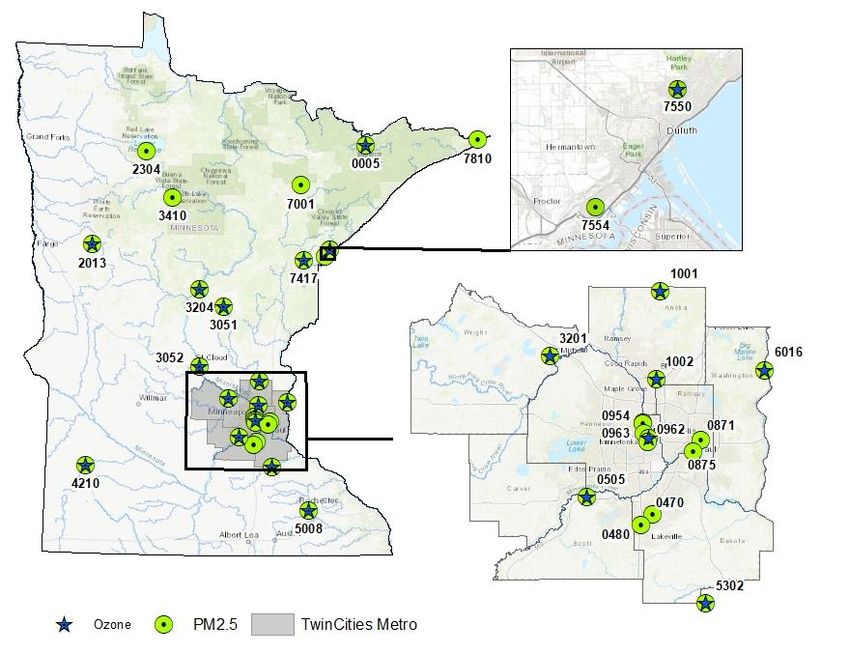
1. Introduction
The Minnesota Air Monitoring Network Plan is an annual report required under the Code of Federal
Regulations [40 CFR § 58.10(a)(1)]. The purpose of this plan is to provide evidence that the Minnesota
Pollution Control Agency (MPCA) air monitoring network meets current federal monitoring requirements, to
detail any changes proposed for the 18 months following publication, to provide specific information on
each of the MPCA's existing and proposed monitoring sites, and to provide the opportunity for the public to
comment on air monitoring activities conducted by the MPCA. The plan also includes information on known
industrial monitoring activities and other air monitoring projects occurring in the state.
The MPCA monitors outdoor air quality throughout Minnesota. The data collected by the MPCA are used for
a variety of purposes including monitoring compliance with the National Ambient Air Quality Standard
(NAAQS), public reporting of the Air Quality Index (AQI), air quality forecasting, assessing population
exposure and risk from air toxics, determining pollution trends, monitoring specific emissions sources,
investigating background conditions, and evaluating computer models. Data are also used to address ways
to reduce pollution levels.
The MPCA's air quality data are used to determine compliance with NAAQS and Minnesota Ambient Air
Quality Standards (MAAQS). In 1970, the Clean Air Act (CAA) established NAAQS for six pollutants known to
cause harm to human health and the environment. The CAA requires the MPCA to monitor these pollutants,
called criteria pollutants, and report the findings to the U.S. Environmental Protection Agency (EPA). The
criteria pollutants are particulate matter, lead, ozone, nitrogen dioxide, sulfur dioxide, and carbon
monoxide. The MPCA monitors criteria pollutants to comply with the CAA.
The MPCA also monitors Minnesota's air for other pollutants, called air toxics. Air toxics include a wide
range of chemicals that are known or suspected to affect human health. These pollutants do not have
federal standards; however, levels found in Minnesota are compared to health benchmarks established by
the Minnesota Department of Health (MDH), the EPA, and the State of California.
More information including current air quality, forecasts, tools to explore data from our monitoring
network, and this plan can be found on the MPCA website at https://www.pca.state.mn.us/air.
2. Network overview
There are 54 sites for ambient air quality monitoring in Minnesota (Figure 1). This includes monitoring at five
tribal sites, three Interagency Monitoring of Protected Visual Environments (IMPROVE) sites, two Chemical
Speciation Network (CSN) sites, one national multi-pollutant monitoring site (NCore), one ozone precursor
measurements site (PAMS), and nine National Atmospheric Deposition Program (NADP) sites. In addition to
these sites, there is a network of industrial air quality monitors that are owned and operated by the specific
industrial facility and adhere to their air permit requirements for monitoring ambient air.
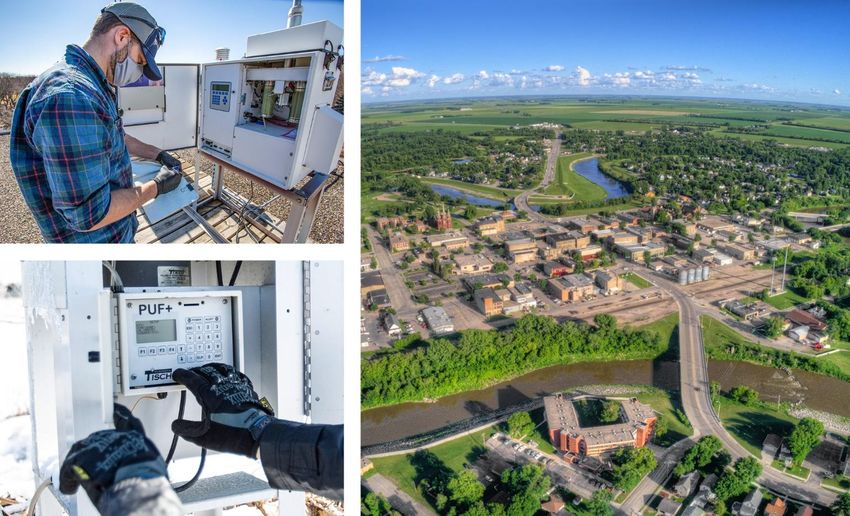
Site location is partly dependent upon population density; therefore, most sites are in the Twin Cities
metropolitan area. For the purposes of this report, any sites in the following eight counties considered the
Twin Cities metropolitan area: Hennepin, Ramsey, Wright, Anoka, Washington, Dakota, Scott, and Carver.
The area that lies outside the Twin Cities metropolitan area is commonly referred to as Greater Minnesota.
The maps included in this plan show sites labeled according to their MPCA, NADP, or IMPROVE site
identification numbers, in Greater Minnesota (Figure 1 and Table 2) and in the Twin Cities metropolitan area
(Figure 2 and Table 3). Throughout the report, sites are referred to using the site name or the city where the
site is located and the MPCA, NADP, or IMPROVE site identification number.
2023 Annual Air Monitoring Network Plan • June 2022 Minnesota Pollution Control Agency
1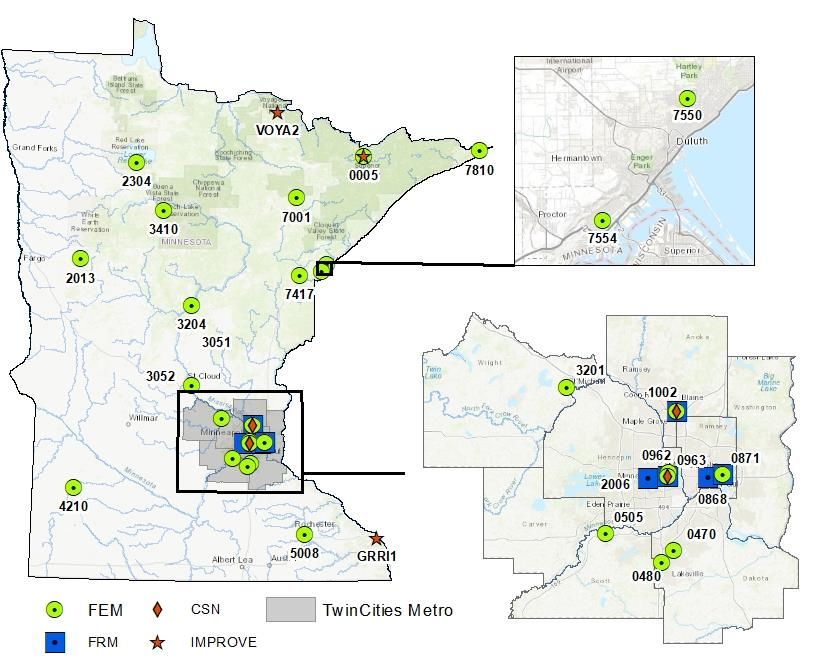
Table 1. Site information for Greater Minnesota sites active in 2022

                                                                                                                                 Year
 Site ID             City             Site name                     Address/location                  LAT         LONG          started
                     Detroit          FWS Wetland
 27-005-2013         Lakes            Management District           26624 N Tower Rd                  46.8499     -95.8463        2004
 27-007-2304***      Red Lake         Red Lake Nation               24760 Hospital Drive              47.8782     -95.0292        2014
 27-017-7417***      Cloquet          Fond du Lac Band              28 University Rd                  46.7137     -92.5117        2015
                                      Leech Lake Nation: Cass
 27-021-3410***      Cass Lake        Lake                          200 Sailstar Dr                   47.38443    34.60166        2018
                     Grand
 27-031-7810***      Portage          Grand Portage Band            27 Store Rd                       47.9701     -89.6910        2005
                                      Brainerd Lakes Regional
 27-035-3204         Brainerd         Airport                       16384 Airport Rd                  46.3921     -94.1444        2004
 27-049-5302         Stanton          Stanton Air Field             1235 Highway 17                   44.4719     -93.0126        2003
 27-075-0005
 MN18*
 BOWA1**             Ely              Boundary Waters               Fernberg Rd                       47.9466     -91.4956        1977

                                      Southwest Minnesota
 27-083-4210         Marshall         Regional Airport              West Highway 19                   44.4559     -95.8363        2004
 27-095-3051***      Onamia           Mille Lacs Band               43408 Oodena Dr                   46.2052     -93.7594        1997
 27-109-5008         Rochester        Ben Franklin School           1801 9th Ave SE                   43.9949     -92.4504        1997
 27-137-0032         Duluth           Oneota Street                 37th Ave W & Oneota St            46.7516     -92.1413        1985
 27-137-0034
 MN32*               International    Voyageurs NP –                Voyageurs National Park -
 VOYA2**             Falls            Sullivan Bay                  Sullivan Bay                      48.4128     -92.8292        2000
 27-137-7001         Virginia         Virginia City Hall            327 First St S                    47.5212     -92.5393        1968
 27-137-7549         Duluth           Michigan Street               1532 W Michigan St                46.7694     -92.1194        1994
 27-137-7550         Duluth           U of M - Duluth               1202 East University Circle       46.8182     -92.0894        1998

                                      Laura MacArthur
 27-137-7554         Duluth           School                        720 N Central Ave                 46.7437     -92.1660        2012
 27-137-7555         Duluth           Waseca Road                   Waseca Industrial Rd              46.7306     -92.1634        2001
 27-145-3052         Saint Cloud      Talahi School                 1321 University Ave SE            45.5497     -94.1335        1998
 27-169-9000
 GRRI1**             Winona           Great River Bluffs            43605 Kipp Dr                     43.9373     -91.4052        2002
 MN08*               Hovland          Hovland                       (open field)                      47.8472     -89.9625        1996
                                      Marcell Experimental
 MN16*               Balsam Lake      Forest                        Marcell Experimental Forest       47.5311     -93.4686        1978
 MN23*               Pillager         Camp Ripley                   (open field)                      46.2494     -94.4972        1983
                                                                    U of M SW Agricultural Research
 MN27*               Lamberton        Lamberton                     and Outreach Center               44.2369     -95.3010        1979
                                                                    Audubon Center of the North
 MN28*               Sandstone        Grindstone Lake               Woods                             46.1208     -93.0042        1996
 MN99*               Finland          Wolf Ridge                    6282 Cranberry Rd                 47.3875     -91.1958        1996
*NADP Site ID       **IMPROVE Site ID              ***Tribal Site

2023 Annual Air Monitoring Network Plan • June 2022                                                   Minnesota Pollution Control Agency
                                                                      2
Figure 1. 2022 air quality monitoring sites in Greater Minnesota
2023 Annual Air Monitoring Network Plan • June 2022 Minnesota Pollution Control Agency
3Table 2. Site information for Twin Cities metropolitan area sites active in 2022
Year
Site ID City Site name Address LAT LONG started
27-003-1001
MN01* East Bethel U of M - Cedar Creek 2660 Fawn Lake Drive NE 45.4018 -93.2031 1979
Anoka County
27-003-1002** Blaine Airport 2289 Co Rd J 45.1407 -93.2220 1979
Flint Hills Refinery
27-037-0020 Rosemount 420 12821 Pine Bend Tr 44.7632 -93.0325 1972
Flint Hills Refinery
27-037-0423 Rosemount 423 2142 120th St E 44.7730 -93.0627 1990
Flint Hills Refinery
27-037-0443 Rosemount 443 14035 Blaine Ave E 44.7457 -93.0554 2008
27-037-0465 Eagan Gopher Resources Hwy 149 & Yankee Doodle Rd 44.8343 -93.1163 2006
27-037-0470 Apple Valley Westview School 225 Garden View Dr 44.7387 -93.2373 2000
27-037-0480 Lakeville Near Road I-35 16750 Kenyon Ave 44.7061 -93.2858 2015
27-053-0909 Minneapolis Lowry Avenue 3104 N Pacific St 45.0121 -93.2767 2013
27-053-0910 Minneapolis Pacific Street 2710 N Pacific St 45.0083 -93.2770 2015
27-053-0954 Minneapolis Arts Center 528 Hennepin Ave 44.9790 -93.2737 1989
Richfield
27-053-0961 Richfield Intermediate School 7020 12th Ave S 44.8756 -93.2588 1999
Near Road
27-053-0962 Minneapolis I-35/I-94 1444 18th St E 44.9652 -93.2548 2013
27-053-0963 Minneapolis Andersen School 2727 10th Ave S 44.9535 -93.2583 2001
27-053-0966 Minneapolis City of Lakes Building 309 2nd Ave S 44.9793 -93.2611 2002
27-053-1007 Minneapolis Humboldt Avenue 4646 N Humboldt Ave 45.0397 -93.2987 1966
Bottineau / Marshall
27-053-1909 Minneapolis Terrace 2522 Marshall St NE 45.0136 -93.2721 2017
St. Louis Park City
27-053-2006 St Louis Park Hall 5005 Minnetonka Blvd 44.9481 -93.3429 1972
27-123-0866 St. Paul Red Rock Road 1450 Red Rock Rd 44.8994 -93.0171 1997
Ramsey Health
27-123-0868 St. Paul Center 555 Cedar St 44.9507 -93.0985 1998
27-123-0871 St. Paul Harding High School 1540 East 6th St 44.9593 -93.0359 1998
27-123-0875 St. Paul West Side 515 Concord St 44.9271 -93.0671 2020
27-139-0505 Shakopee B.F. Pearson School 917 Dakota St 44.7894 -93.5125 2000
St. Paul Park
27-163-0436 St. Paul Park Refinery 436 649 5th St 44.8473 -92.9956 1989
St. Paul Park
27-163-0438 Newport Refinery 438 4th Ave & 2nd St 44.8599 -93.0035 1995
27-163-0446 Bayport Point Road 22 Point Rd 45.0280 -92.7742 2007
Marine on St. St. Croix Watershed
27-163-6016 Croix Research Station St. Croix Trail N 45.1680 -92.7651 2012
St. Michael
27-171-3201 St. Michael Elementary School 101 Central Ave W 45.2092 -93.6690 2003
*NADP Site ID ** NCore site
2023 Annual Air Monitoring Network Plan • June 2022 Minnesota Pollution Control Agency
4Figure 2. 2022 air quality monitoring sites in the Twin Cities metropolitan area
2023 Annual Air Monitoring Network Plan • June 2022 Minnesota Pollution Control Agency
52.1 Minimum monitoring requirements
The EPA establishes the minimum number of monitoring sites required to meet national ambient monitoring
objectives. The minimum monitoring requirements are codified in Appendix D of 40 CFR Part 58. Minimum
monitoring requirements are specific to each individual pollutant (e.g. ozone, PM2.5) or are objective-based
monitoring networks (e.g. NCore, PAMs). Minimum monitoring requirements typically rely on population
and/or air pollution emissions data. Minnesota currently meets all minimum air monitoring requirements.
Appendix B provides a detailed description of these requirements.
2.2 Monitoring objectives
When designing an air monitoring network, one of the following six objectives should be considered:
1. Highest concentrations expected to occur in the area covered by the network
2. Representative concentrations in areas of high population density
3. Impact of specific sources on ambient pollutant concentrations
4. General background concentration levels
5. Extent of regional transport among populated areas and in support of secondary standards
6. Welfare-related impacts in the more rural and remote areas
2.3 Site selection
The selection of air monitoring sites is usually based on at least one of the following objectives:
• Determine representative concentrations and exposure in areas of high population density
• Determine highest concentrations in an area based on topography and/or wind patterns
• Judge compliance with and/or progress made towards meeting the NAAQS and MAAQS
• Track pollution trends
• Determine the highest concentrations of pollutants within the state based on the known
atmospheric chemistry of specific pollutants and wind patterns
• Determine the extent of regional pollutant transport to and from populated areas
• Determine to what extent major sources impact ambient pollution levels
• Validate control strategies designed to prevent or alleviate air pollution
• Provide a database for research and evaluation of air pollution effects
• Determine general background concentration levels
The exact location of a site is most often dependent on the logistics of the area chosen for monitoring, such
as site access, security, and power availability.
2.4 Network scales
The EPA developed a system which specifies an exclusive area, or spatial scale, that an air monitor
represents. The goal in establishing air monitoring sites is to correctly match the spatial scale that is most
appropriate for the monitoring objective of the site (Table 1). The representative measurement scales are:
• Micro Scale (10-100 m) – defines the concentrations in air volumes associated with area dimensions ranging
from several meters up to about 100 meters. Measurements on the micro scale typically include
concentrations in street canyons, intersections, and in areas next to major emission sources.
2023 Annual Air Monitoring Network Plan • June 2022 Minnesota Pollution Control Agency
6• Middle Scale (100-1,000 m) – defines the concentration typical of areas up to several city blocks in size, with
dimensions ranging from about 100 to 1,000 meters.
• Neighborhood Scale (1-4 km) – defines concentrations within some extended area of the city that has
relatively uniform land use with dimensions in the one to four kilometers range. Generally, these stations
represent areas with moderate to high population densities.
• Urban Scale (4-50 km) – defines the overall, citywide conditions with dimensions on the order of 4 to 50
kilometers. This scale represents conditions over an entire metropolitan area, and is useful in assessing
citywide trends in air quality.
• Regional Scale/Background (50-1,000 km) – usually represents a rural area of reasonably homogeneous
geography and extends from tens to hundreds of kilometers.
• National/Global – concentrations characterizing the nation and the globe as a whole.
Table 3. Monitoring objectives and appropriate siting scales.
Monitoring objective Appropriate siting scales
Highest concentration Micro, Middle, Neighborhood (sometimes Urban)
Population exposure Neighborhood, Urban
Source impact Micro, Middle, Neighborhood
General/Background Urban, Regional (sometimes Neighborhood)
Regional transport Urban, Regional
Welfare – related Urban, Regional
2.5 Environmental Justice
The Minnesota Pollution Control Agency defines environmental justice as the fair treatment and meaningful
involvement of all people regardless of race, color, national origin, or income with respect to the
development, implementation, and enforcement of environmental laws, regulations, and policies. This will
be achieved when everyone benefits from the same degree of environmental protection and has equal
access to the decision-making processes that contribute to a healthy environment.
The MPCA is striving to understand how air pollution may disproportionately affect some communities.
Current and continuing efforts to involve and inform communities include issuing several reports and
community focused websites with data portals.
• “Air We Breathe” report (https://www.pca.state.mn.us/air/air-we-breathe)
• “Life and Breath” report (https://www.pca.state.mn.us/air/life-and-breath-report)
• North Minneapolis air monitoring project webpage (https://www.pca.state.mn.us/air/north-
minneapolis-air-monitoring-project)
• Water Gremlin webpage (https://www.pca.state.mn.us/air/water-gremlin)
The MPCA’s website at https://www.pca.state.mn.us/about-mpca/mpca-and-environmental-justice shares
additional information on MPCA’s efforts around environmental justice.
Current efforts
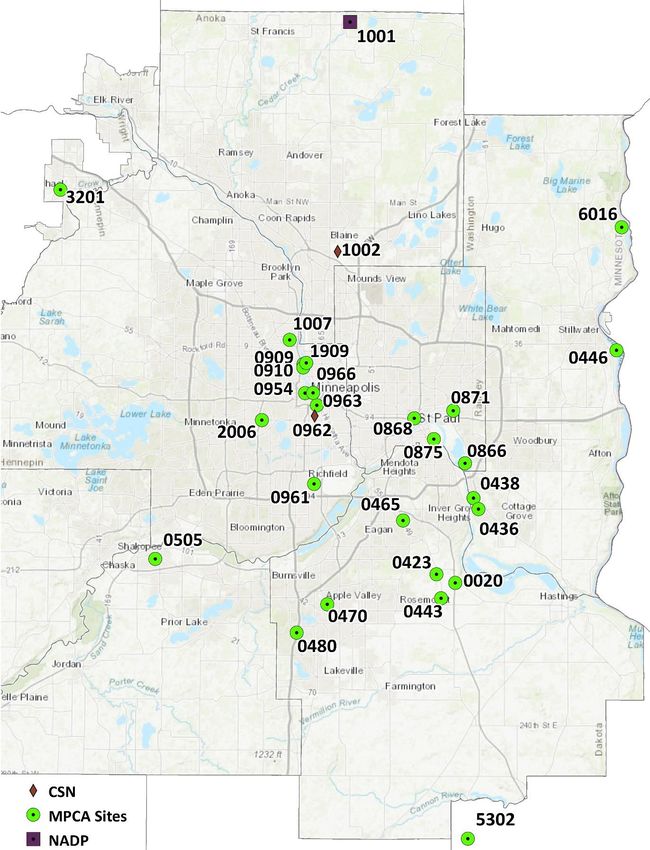
The MPCA considers tribal areas and census tracts with higher concentrations of low-income residents and
people of color as areas of increased concern for environmental justice. Three criteria are currently used to
define and environmental justice area:
• 50% or more people of color
• At least 40% of people reported income less than 185% of the federal poverty level
• Federally recognized tribal areas
2023 Annual Air Monitoring Network Plan • June 2022 Minnesota Pollution Control Agency
7Using this definition, out of 53 statewide monitors, 19 are within one area of environmental concern, 9 are
within two overlapping areas, and 3 fall within the boundaries of all three types of environmental justice
concern areas (Figure 3 and Figure 4). Overall, 31 of the 53 monitors are in environmental justice areas.
Figure 3: MPCA monitor locations in greater Minnesota showing environmental justice area status and
environmental justice areas of concern using 2016-2020 ACS 5-year census data by tract.
2023 Annual Air Monitoring Network Plan • June 2022 Minnesota Pollution Control Agency
8Figure 4: MPCA monitor locations in the Twin Cities Metro showing environmental justice area status and
environmental justice areas of concern using 2016-2020 ACS 5-year census data by tract.
Future work
As part of MPCA’s Assessing Urban Air Quality project (https://www.pca.state.mn.us/air/assessing-urban-air-quality-
project), the MPCA placed AQ Mesh air sensors in nearly every zip code in Minneapolis and St. Paul. These
sensors allow us to assess air pollution on smaller scales than possible with regulatory air monitors. We
continue to look for partnerships to continue to use networks of air sensor such as AQMESH and Purple Air
sensors to determine hot spots of air pollution and potentially place SENSIT SPOD VOC sensors to better
determine the VOC pollution in the Metro area. Additionally, Photochemical Assessment Monitoring
Stations (PAMS) hourly VOC data at our Blaine – Anoka County Airport (1002) monitoring site will be
compared to acute health benchmarks, assessing potential air pollution exposure in communities located
near these monitors. MNRISKS, MPCA’s risk-screening tool, or other similar tools, can also be incorporated
into future monitoring network assessments, including the air toxics monitoring network, to ensure
environmental justice factors are considered when removing or adding monitors.
2023 Annual Air Monitoring Network Plan • June 2022 Minnesota Pollution Control Agency
9Conclusion
The effects of historical and current structural inequities are made clear through the disparities of air
pollution health impacts. The MPCA is committed to reducing these disparities and reducing air pollution in
areas of environmental justice concern. Through strengthening and fully utilizing our community
relationships, increasing our outreach and communication, and being present in these communities, the
MPCA continues to work towards the meaningful involvement of those most impacted by air pollution.
Through our efforts to incorporate environmental justice in our air monitoring decisions, the MPCA
continues to strive for the fair treatment of all people. To explore the MPCA’s resources on environmental
justice and air pollution, visit the Environmental justice and air webpage at
https://www.pca.state.mn.us/air/environmental-justice-and-air.
3. Quality Assurance/Quality Control program
The purpose of the Quality Assurance/Quality Control (QA/QC) program is to assure the quality of data
obtained from the MPCA air monitoring network. The MPCA meets or exceeds the QA requirements defined
in 40 CFR Part 58 and all applicable appendices.
The QA/QC program includes, but is not limited to, the following activities:
• Instrument performance audits
• Monitor siting evaluations
• Precision and span checks
• Flow rate audits
• Leak checks
• Data validation
• Bias determinations
For independent quality assurance activities, the MPCA participates in the National Performance Audit
Program and the Performance Evaluation Program for criteria pollutant monitoring. Additional inter-
laboratory comparisons and proficiency tests are performed periodically for air toxics monitoring.
As the Primary Quality Assurance Organization (PQAO) for ambient air monitoring activities in Minnesota,
the MPCA operates under an EPA-approved Quality Management Plan (QMP) and utilizes Quality Assurance
Project Plans (QAPP) for each statewide monitoring network. The primary purpose of the QAPP is to provide
an overview of the project, describe the need for the measurements, and define QA/QC activities that apply
to the project. All other ambient air monitoring initiatives including state, tribal, and industrial projects must
have an MPCA-approved monitoring plan for each specific project.
As part of the instrument performance audit, each monitoring site is assessed to ensure that all applicable
EPA siting requirements are fully met. This also includes a safety inspection to assure a safe work
environment for site operators and staff.
To meet the minimum monitoring requirements for the Minneapolis-St. Paul MN-WI Metropolitan Statistical
Area (MSA) and the Lacrosse-Onalaska MN-WI MSA, the MPCA and Wisconsin Department of Natural
Resources (DNR) Bureau of Air Management entered into a Memorandum of Agreement (MOA) in January
2011. The MOA formalized the collective agreement between the two States per requirements of 40 CFR
Part 58 Appendix D, Section 2(e). The MPCA worked with Wisconsin DNR to update the MOA in 2020. The
MPCA reconfirmed with the Wisconsin DNR that all monitoring requirements are currently being met. MPCA
is currently working with Wisconsin DNR to complete the renewal.
2023 Annual Air Monitoring Network Plan • June 2022 Minnesota Pollution Control Agency
104. Network assessments
4.1 Regional network assessment
In addition to this air monitoring network plan, the EPA requires states to complete a network assessment
every five years. The network assessment provides a detailed evaluation of the regional air monitoring
network, including network history, a re-evaluation of the types of pollutants monitored, and an evaluation
of the network's objectives and costs. It also includes spatial analyses of ambient air monitoring data and a
reconsideration of monitor placement based on changes in land use and population. Under the direction of
the Lake Michigan Air Directors Consortium (LADCO), Minnesota has collaborated with other states in our
region to develop network assessments in 2010, 2015, and 2020. The results of the Network Assessments
can be found on LADCO’s website, at https://www.ladco.org/reports/monitoring-reports/.
Some key findings of the 2020 Network Assessment include:
• Criteria pollutant monitoring networks are adequate to meet EPA’s minimum monitoring criteria.
• Disinvestment or relocation of existing PM2.5 and ozone monitoring sites is very difficult due to
stringent EPA criteria for shutdown.
• Using these criteria, amongst all ozone and PM2.5 monitors in the state, 12 PM2.5 monitors and only
one ozone monitor is eligible for disinvestment. All of the PM2.5 monitors eligible for disinvestment
are outside of Minneapolis. The only ozone monitor eligible for disinvestment is in Duluth (27-137-
7550) where PM2.5 is also eligible for disinvestment. While these monitors are eligible for
disinvestment, we feel these monitors are valuable for spatial and temporal coverage and we do not
intend to shut down these monitors at this time.
• Minnesota’s criteria pollutant monitoring network is not dense enough to measure neighborhood
level disparities in air quality, but we are increasing our use of small air quality sensors to cover gaps
in our air monitoring network, especially in areas of environmental justice concern.
• Minnesota’s air toxics network is concentrated in the Twin Cities and Duluth due to logistical
challenges with transporting samples. Within those areas, the air toxics network is generally
representative of the air quality experienced in different neighborhoods. We are expanding our
capacity to identify potentially problematic facilities contributing to poor air quality and conduct
short-term air monitoring studies to determine if additional action is necessary in these areas.
4.2 Statewide network assessment
Although not required by the EPA or the federal regulations, in the 2022 Ambient Air Monitoring Network
Plan, the MPCA committed to re-evaluating Minnesota’s air monitoring network using the data from the
2020 Network Assessment. This re-evaluation aims to establish an in-house methodology to quantify
monitor values and assess whether there are obvious recommendations (removal, move, and addition) to
the existing network.
Methodology
The 2020 Regional Network Assessment outcome was used as input for the internal network assessment
analysis. The internal network assessment team members discussed and selected the results that should be
considered for the analysis. These results include:
• the types/number of pollutants monitored,
• the years monitored,
2023 Annual Air Monitoring Network Plan • June 2022 Minnesota Pollution Control Agency
11• the NAAQS exceedance probability (PM2.5 and ozone only),
• the correlation coefficients based on nearby monitors (PM2.5 and ozone only),
• the spatial analysis factors such as area coverage and population represented by the monitors (PM2.5
and ozone only).
The members agreed that some factors should have more weight over others. Each member had the
opportunity to experiment with different coefficients for factors contributing to the overall monitor value
score. The result of their exercise was captured in a qualitative reflection survey.
The internal air assessment team consisted of the air assessment section manager in addition to supervisors
and members of the ambient air monitoring (AMU), environmental data quality (EDQ), air data analysis
(ADA), risk evaluation and air modeling (REAM) units. This membership ensures that stakeholders affected
by collection, processing, quality assurance, and analysis are represented.
Preliminary results and opportunities for improvement
Based on the qualitative survey results taken by the internal network assessment members and group
discussions, Table 4 summarizes some of the key findings and conclusions of the 2022 internal network
assessment as well as recommendations for future analysis. The results of the future internal network
assessments are expected to inform future recommendations for upcoming network plans.
Table 4. Conclusions and Future Recommendations for Internal Network Assessment
Key conclusions/Findings Recommendations for future analysis
More value should be placed on the It may be appropriate to consider the monitoring duration in deciding
number of pollutants monitored rather removal suitability, but we may exclude this factor from overall site
than the duration of the monitor. evaluation as not to “penalize” new sites.
Probability of exceedance based on Future assessment could expand to other criteria pollutants. The values
design value relative to NAAQS is one of for PM2.5 and ozone were based on 2018 design values so the probability
the most important factors to consider. of exceedance should be based on most recent available data.
This type of assessment was limited to
considering PM2.5 and ozone.
Correlation values were only available Future assessment could expand to other criteria pollutants. Before
for PM2.5. Looking at redundancy and making a removal or consolidation change, a case-by-case comparison
possible removal or consolidation would against two or more sites would be required.
be helpful in planning for future For example, evaluations for consolidation may make sense for the
monitoring network. following due to their proximity:
• Michigan Street (27-137-7549) and Laura MacArthur School (27-
137-7554)
• Lowry Avenue (27-053-0909), Pacific Street (27-053-0910), and
Bottineau / Marshall Terrace (27-053-1909)
Correlation values as well as logistics may inform the possibility to
consolidate and remove one to gain efficiency without losing much
insight on ambient air concentration in the area.
Several other evaluation factors were Future assessment could include
identified but not available for analysis • Environmental Justice considerations,
in this network assessment.
• Resource constraints such as operational and human resource,
• Spatial consideration to support baseline data for modeling
efforts,
• AQI forecasting value,
• Sensor placements.
2023 Annual Air Monitoring Network Plan • June 2022 Minnesota Pollution Control Agency
125. Types of networks
Air monitoring networks are designed to satisfy a variety of purposes, including monitoring compliance with
the NAAQS, public reporting of the Air Quality Index (AQI), assessing population exposure and risk from air
toxics, determining pollution trends, monitoring specific emissions sources, investigating background
conditions, and evaluating computer models. Below are descriptions of the existing monitoring networks in
Minnesota.
5.1 Air Quality Index (AQI)
The AQI was developed by the EPA to provide a simple, uniform way to report daily air quality conditions.
Minnesota AQI numbers are determined by measurements of six pollutants: fine particles (PM2.5),
particulate matter (PM10), ground-level ozone (O3), sulfur dioxide (SO2), nitrogen dioxide (NO2), and carbon
monoxide (CO). The AQI values for each pollutant are calculated daily and apply to the respective averaging
period. The EPA’s NowCast AQI values are updated hourly, and posted on the MPCA’s website at
https://www.pca.state.mn.us/air/current-air-quality, to help inform the public of current air quality
conditions and trends.
The MPCA creates daily forecasts in AQI units for PM2.5 and ozone, centered at monitoring locations across
the state (Figure 5). There are currently 28 sites in the full AQI network in Minnesota. The Twin Cities
monitors are grouped into three forecast locations: Minneapolis-St. Paul, North Metro, and South Metro.
Overall, there are 18 forecast locations across the state (Table 5). Daily AQI values are generally the highest
for these two pollutants, and are responsible for most poor air quality events in Minnesota.
Figure 5. 2022 fine particle (PM2.5) and ozone-monitoring network which serves the AQI forecast system.
2023 Annual Air Monitoring Network Plan • June 2022 Minnesota Pollution Control Agency
13Table 5. Forecast locations and monitors utilized
State area Forecast location Monitoring location Pollutant measured
Metro Minneapolis-St. Paul Minneapolis (Near Road) PM2.5, Ozone
Minneapolis (Anderson School) PM2.5
St. Louis Park PM2.5
St. Paul (Harding High School) PM2.5
St. Paul (Ramsey Health Center) PM2.5
Metro North Metro Blaine PM2.5, Ozone
East Bethel Ozone
Marine on St. Croix Ozone
St. Michael PM2.5, Ozone
Metro South Metro Apple Valley PM2.5, Ozone
Lakeville PM2.5
Shakopee PM2.5, Ozone
Stanton Ozone
Northwest Detroit Lakes Detroit Lakes PM2.5, Ozone
Northwest Moorhead Fargo, ND PM2.5, Ozone
Northwest Red Lake Red Lake Nation PM2.5
Northeast Duluth Duluth (Univ Minn-Duluth) PM2.5, Ozone
Northeast Ely Ely PM2.5, Ozone
Northeast Fond du Lac Fond du Lac Band (Cloquet) PM2.5, Ozone
Northeast Grand Portage Grand Portage Band PM2.5
Northeast Virginia Virginia PM2.5
Central Brainerd Brainerd PM2.5, Ozone
Central Leech Lake Leech Lake Nation (Cass Lake) PM2.5
Central Mille Lacs Mille Lacs Band Ozone
Central St. Cloud St. Cloud PM2.5, Ozone
South Marshall Marshall PM2.5, Ozone
South Rochester Rochester PM2.5, Ozone
South Winona La Crosse, WI PM2.5, Ozone
The AQI categories developed by the EPA are green (good), yellow (moderate), orange (unhealthy for
sensitive groups or USG), red (unhealthy), purple (very unhealthy), and maroon (hazardous). Each category
is assigned a color and corresponds to a different level of health concern (Figure 6). In the past, MPCA
offered AQI forecasts for only the Twin Cities and Rochester. Starting June 1, 2017, the MPCA began issuing
daily forecasts for the majority of its AQI monitor locations through MPCA’s AQI website, the Minnesota Air
mobile app, Twitter, and to individuals who have signed up to receive e-mailed forecasts. If it is suspected
through forecasting or monitoring that the daily AQI will be over 100, the MPCA will issue an Air Quality
Alert to be disseminated by the National Weather Service, GovDelivery, the Minnesota Air mobile app,
Twitter, the media, and to individuals who have signed up to receive email alerts. Forecasts and alerts allow
the public to be proactive about protecting their health and reducing their own contributions to emissions
and exposure to air pollution. At no cost, the public can download the Minnesota Air mobile app and sign up
for emailed forecasts and alerts from MPCA’s AQI website (https://www.pca.state.mn.us/air/current-air-
quality).
2023 Annual Air Monitoring Network Plan • June 2022 Minnesota Pollution Control Agency
14You can also read