AMSR-2 Air-Sea Essential Climate Variables RSS Version 8.2
←
→
Page content transcription
If your browser does not render page correctly, please read the page content below
RSS Tech. Rpt. 05112021                                                                       May 11, 2021

                             AMSR-2 Air-Sea Essential Climate Variables
                                         RSS Version 8.2
                                                      Frank J. Wentz

 Remote Sensing Systems (RSS) has updated its AMSR-2 data processing from Version 8.0 to Version 8.2note 1.
 A mission-long (July 2012 to present) V8.2 dataset is now available. Version 8.2 is a major update, and we
 encourage all users, particularly those doing climate studies, to transition to the V8.2 dataset. Both V8.0
 and V8.2 datasets will be available for a short overlap period TBD.

 The two major changes for V8.2 are:
 1. Spurious drifts in the AMSR-2 retrievals (SST, wind, vapor, cloud, and rain) have been removed.
 2. The output data files are now in netCDF format.

 This document discusses the spurious drift problem and subsequent correction.

 Note 1: Version 8.1 was an in-house beta test not publicly released.

RSS Tech. Rpt. 05112021                                        1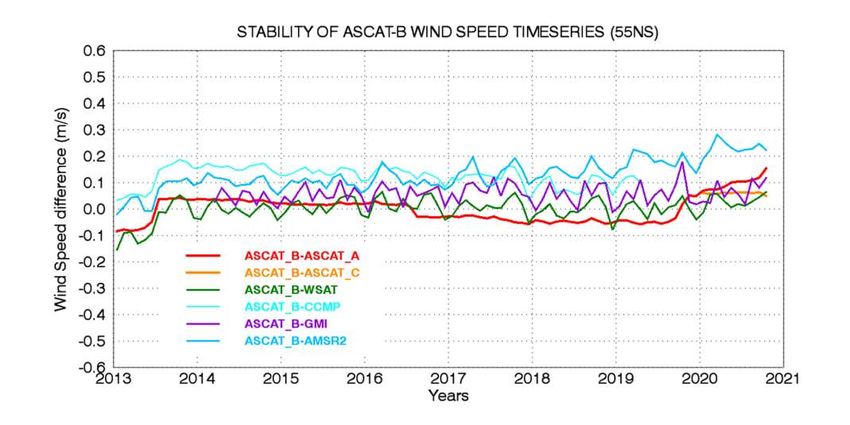
Drifts in the AMSR-2 Air-Sea Essential Climate Variables (AS-ECV)
                The AMSR-2 Air-Sea Essential Climate Variable (AS-ECV) Climate Record begins with the
                launch of AMSR-2 in July 2012 and is currently about 9 years in length. The climate
                variables that make up this record are:

                                  ➢   Sea-Surface Temperature (SST, C)
                                  ➢   Near-Surface Wind Speed (m/s)
                                  ➢   Atmospheric Columnar Water Vapor (mm)
                                  ➢   Atmospheric Columnar Cloud Water (mm)
                                  ➢   Sea-Surface Rain Rate (mm/hr)

                The RSS 2020 Assessment of operational satellite microwave radiometers (AMSR-2,
                WindSat, GMI, SSM/IS) revealed drifts in AMSR-2 AS-ECV timeseries.

                This document describes the characterization and removal of the these drifts. A
                complete reprocessing of the AMSR-2 mission data has been performed and will be
                distributed as Version 8.2.

RSS Tech. Rpt. 05112021                                 2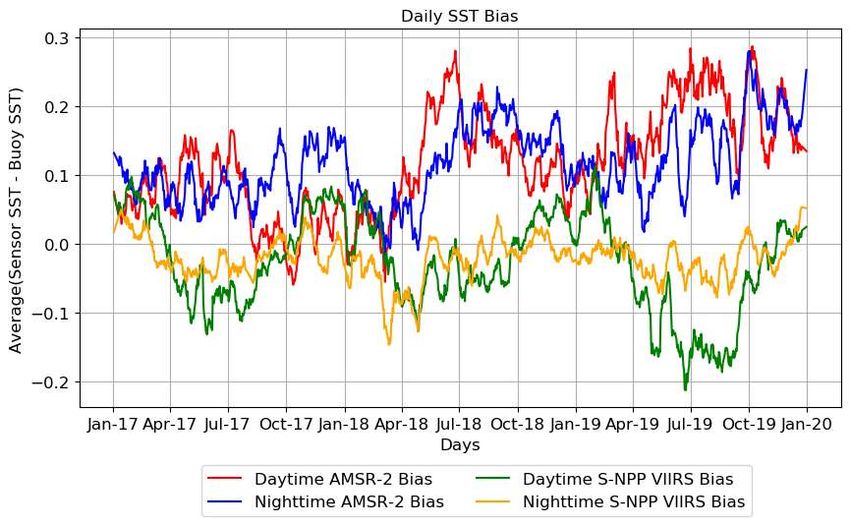
Characterization of Long-Term Drifts in V8.0 AMSR-2 AS-ECVs
The following slides show the drifts in the V8.0 AMSR-2 AS-ECVs.
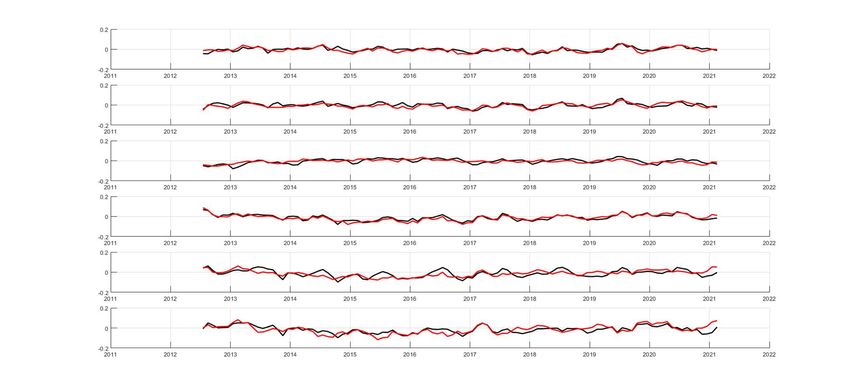
Figure 1 compares the AMSR-2 AS-ECVs with those from two other satellite microwave
radiometers: WindSat and GMI. The drift in SST and wind is obvious. The cloud water
also exhibits a drift relative to WindSat and GMI. Results are shown for both V8.0
(before drift correction) and the newly released Version 8.2.
Figure 2 shows the timeseries of the difference of the AMSR-2 SST minus the Reynolds
SST and the CMC SST. Results are shown for both V8.0 (before drift correction) and the
newly released Version 8.2.
Figure 3 shows the timeseries of the V8.0 AMSR-2 SST minus buoy SST.
Figure 4 shows the V8.0 AMSR-2 wind speed compared to wind retrievals from the
ASCAT-B satellite scatterometer.
Conclusion: There is no doubt that the V8.0 AMSR-2 AS-ECVs are drifting.
RSS Tech. Rpt. 05112021 3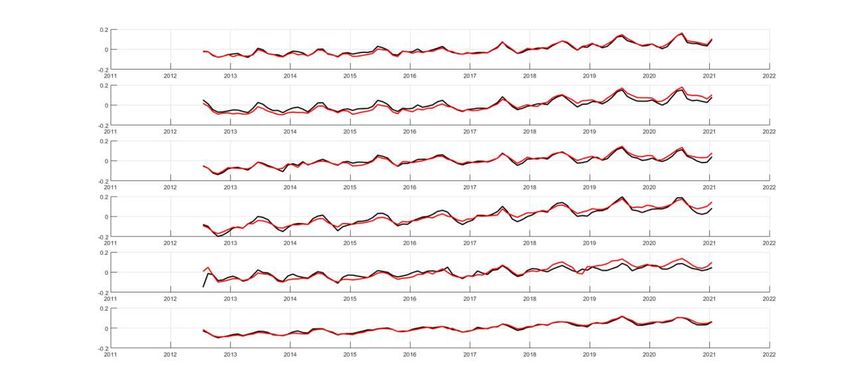
Fig. 1. Timeseries showing the difference of the AMSR-2 AS-ECVs minus similar retrievals from WindSat (green curve) and GMI (red curve).
 The left column shows the obvious drift in the V8.0 product and the right column shows the new V8.2 product with the drifts removed.
 Seasonal variations in AMSR2 – WindSat curves are probably due to the large difference in the local ascending node time between these
 two sensors.

RSS Tech. Rpt. 05112021                                             4
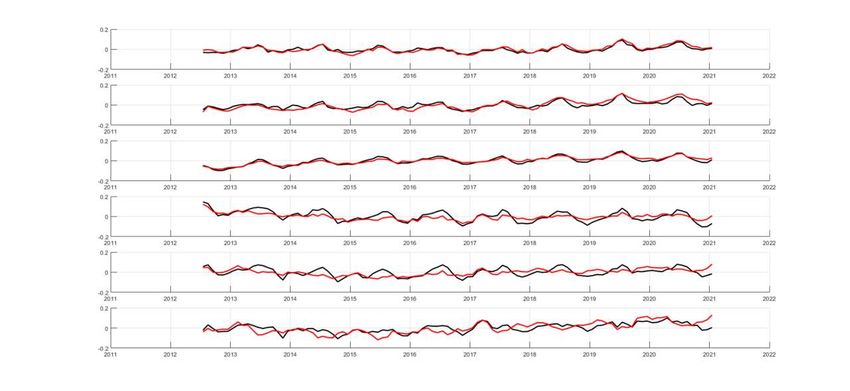
Fig. 2. Timeseries showing the difference of the AMSR-2 SST minus Reynolds SST (black curve) and CMC SST (red curve). The top frame
shows the obvious drift in the V8.0 product, and the bottom frame shows the new V8.2 product with the drifts removed.

RSS Tech. Rpt. 05112021                                          5
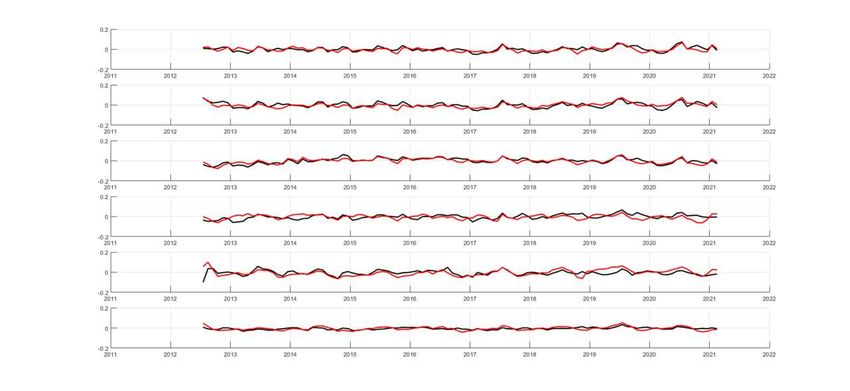
Fig. 3. These timeseries show the difference of the AMSR-2 SST minus buoy SST for both day and nighttime passes (red
        and blue curves, respectively). These results are for V8.0 before the drift correction.

RSS Tech. Rpt. 05112021                                           6
Fig. 4. These timeseries show the difference between the ASCAT-B wind speed and various other satellites. The difference
between ASCAT-B and AMSR-2 is shown by the cyan curve. These results are for V8.0 before the drift correction. This shows
the AMSR-2 wind speed decreasing with time over the 8-year period.
RSS Tech. Rpt. 05112021 7Relating Drifts in AMSR-2 AS-ECVs to Drifts in Antenna Temperatures
We used our Ocean Radiative Transfer Model (ORTM) to convert the drifts in the AS-ECVs to
drifts in the AMSR-2 Antenna Temperatures (TA). In doing this, we assume the AS-ECV drifts
are a linear function of time. Based on the results shown in Figure 1, we model the AS-ECV
drifts as linear functions of time with the following slopes:
SST: 0.28 C per decade
Wind: 0.14 m/s per decade
Vapor: 0.024 mm per decade
Cloud: 0.0029 mm per decade
Figures 5 and 6 show the timeseries of the difference of the AMSR-2 TA measurement minus
the ORTM TA for V-pol and H-pol, respectively. In computing the ORTM TA we use the AMSR-2
wind, vapor, and cloud retrievals after removing the spurious trends given above. For SST, we
use the Reynolds product.
The Measured − ORTM TA differences in Figures 5 and 6 are indicative of the spurious TA
trends that are producing the drifts in the V8.0 AMSR-2 AS-ECVs.
RSS Tech. Rpt. 05112021 8Fig. 5. V8.0 AMSR-2 Measured minus ORTM TA (K) for V-Pol channels. The black curves were created using ascending orbit
segments (1:30 pm), and the red curves were created using descending orbit segments (1:30 am). The 6 frames from top to
bottom are 6.9, 7.3, 10.7, 18.7 , 23.8, and 36.5 GHz. The 89 GHz channels are not shown. An upward drift is apparent.
RSS Tech. Rpt. 05112021 9Fig. 6. Same as Figure 5 except the H-Pol channels are shown. RSS Tech. Rpt. 05112021 10
Possible Explanations for the TA Drifts: Earth Incidence Angle
    We examined several possible explanations for the drifts in the AMSR-2 TAs. We first note that the
    drift in the V-Pol channels is positive and is larger than the H-Pol channels. This explains why the
    spurious SST trend is positive while the wind trend is negative.

    Two potential explanations for the V-Pol trend being larger than the H-pol trend are:
        1. An error in specifying the Earth incidence angle (EIA).
        2. An error in specifying the hot load temperature.
    We first examined the EIA hypothesis. A spurious drift in the reported EIA of -0.07 deg/decade
    would produce the observed trends in the V-Pol TA. An EIA error would also produce errors in the
    location of coastlines and islands. We did a detailed geolocation analysis looking at images of
    coastlines and islands from 2012 to 2020. This method can detect errors of 0.05 deg/decade in the
    EIA. We did not detect any geolocation errors in the TA imagery over the AMSR-2 mission.

    Another argument against the EIA hypothesis is that the H-Pol TA for the lower frequencies would
    show a decreasing trend (i.e., opposite of the V-Pol trend). In fact, the H-Pol trends at the lower
    frequencies are positive, like the V-Pol trends, but much lower in magnitude.

    We concluded that EIA is not the cause of the TA trends.

RSS Tech. Rpt. 05112021                                11
Possible Explanations for the TA Drifts: Hot Load An error in specifying the hot load temperature could explain part of the observed TA drifts. Nearly all channels show positive trends with V-Pol being greater than H-Pol. In general, this behavior is consistent with a spurious trend in hot load. However, when examining the TA trends of the 12 channels in detail, one sees a lot of variation that is not consistent with a simple hot load error. On average, the V-Pol TA trends indicate a hot-load drift error of about 0.30 K/decade, with the standard deviation among the 6 channels being 0.08 K/decade. However, the H-Pol TA trends are much smaller and indicate a hot-load drift error of 0.17 K/decade, with a large standard deviation of 0.18 K/decade. To explore the hot-load hypothesis further, we performed a detailed analysis of TA trends over the Amazon Rainforest. The V8.0 AMSR-2 TA trends were compared to GMI and WindSat TA trends and to models. The Amazon TA measurements average about 270K. Because of this, they are very sensitive to any error in specifying the hot load temperature. The Amazon analysis indicated a possible TA drift of about 0.1 K/decade: smaller than the ocean results but still significant. RSS Tech. Rpt. 05112021 12
Corrections to Hot Load Temperature Calculation
  Investigating the hot load issue in even more detail, Figure 7 shows timeseries of the 10 thermistors attached
  to the hot load. In V8.0, the temperature of the hot load was calculated by averaging these 10 thermistors.
  However, during the daytime portion of the orbit, thermistor #7 drifts upwards relative to the other
  thermistors and exhibits a strong seasonal oscillation. For V8.2, we decided to exclude thermistor #7 from
  the average due to its anomalous behavior.

  We also found another problem with the thermistor timeseries. Periodically, the AMSR-2 on-board Signal
  Processor Control unit (SPC) is switched from the A side to the B side. When this was last done in November
  2017, we incorrectly specified the SPC offset used in the counts-to-temperature equation. This produced a
  0.06 K spurious step in the timeseries. This is corrected in V8.2.

  The combined effect of removing thermistor #7 from the hot load average and correcting the SPC problem
  resulted in a 0.1 K/decade decrease in the hot load trends. This brought the AMSR-2 TAs into good
  agreement with WindSat and GMI over the Amazon Rainforest. However, over the colder oceans, this change
  has little effect. It only decreases the V-pol trends by 0.05 K/decade and the H-Pol trends by 0.02 K/decade.

  Correcting the way in which the hot-load temperature is calculated provided better agreement with
  WindSat and GMI over the Amazon Rainforest, but provided little improvement over the oceans.

RSS Tech. Rpt. 05112021                                13
Fig. 7. Timeseries of the 10 thermistors attached to the AMSR-2 hot load. Black curves correspond to ascending orbit segments
       (1:30 pm) and red curves correspond to descending orbit segments (1:30 am). Thermistor #7 is anomalous and is excluded in
       V8.2.

RSS Tech. Rpt. 05112021                                           14
Adjusting the Non-Linearity Coefficients of the AMSR-2 Receivers
One remaining explanation for the TA drifts over the ocean is that the non-linearity responses of the AMSR-2
receivers are drifting. The internal temperatures of the AMSR-2 Signal Processor Control Unit (SPC) have
been changing significantly over time. We hypothesize that the non-linear characteristics of the AMSR-2
receivers have slightly changed due to the changes in the SPC temperatures. We found two thermistors that
correlated well with the TA drifts shown in Figures 5 and 6: SPC Thermistor #3 (HTS control temperature 3)
and SPC Thermistor #17 (SPC A temperature).
The dTA timeseries in Figures 5 and 6 are regressed versus the T3 and T17 timeseries as follows:
dTA = a + b*T3 + c*T17
The a, b, and c coefficients are found for each of the 16 AMSR-2 channels. The non-linearity correction is
then applied as:
TAcorrected = TA – (TA-Tcold)(Thot-TA)*dTA/A
where Tcold is the temperature observed by the cold-space mirror and Thot is temperature of the hot load.
The term A is the average value of (TA-Tcold)(Thot-TA) over the oceans for a given channel.
RSS Tech. Rpt. 05112021 15Results After Applying the Non-Linearity Correction Figures 8 and 9 show the TA trends after applying the hot load and non-linearity correction. For reference, we have also inserted Figures 5 and 6 from above, which show the results before applying the corrections. Comparing the figures, one sees that in addition to removing the long-term drifts in the TAs, the corrections also remove the seasonal variations in the TA measured minus TA ORTM differences. Comparison with the GPM Microwave Imager (GMI) (not shown here) also show that these seasonal variations in V8.0 are spurious. RSS Tech. Rpt. 05112021 16
Fig. 5 (from above). V8.0 AMSR-2 Measured minus ORTM TA (K) for V-Pol channels. Black curves correspond to ascending orbit
       segments (1:30 pm) and red curves correspond to descending orbit segments (1:30 am). The 6 frames from top to bottom are
       6.9, 7.3, 10.7, 18.7, 23.8, and 36.5 GHz. The 89 GHz channels are not shown. An upward drift is apparent.

RSS Tech. Rpt. 05112021                                         17
Fig. 8. V8.2 AMSR-2 Measured minus ORTM TA (K) for V-Pol channels. Black curves correspond to ascending orbit segments (1:30 pm)
and red curves correspond to descending orbit segments (1:30 am). The 6 frames from top to bottom are 6.9, 7.3, 10.7, 18.7, 23.8, and
36.5 GHz. The upward drift is gone.
RSS Tech. Rpt. 05112021 18Fig. 6 (from above). V8.0 AMSR-2 Measured minus ORTM TA (K) for H-Pol channels. Black curves correspond to ascending orbit
segments (1:30 pm) and red curves correspond to descending orbit segments (1:30 am). The 6 frames from top to bottom are
6.9, 7.3, 10.7, 18.7, 23.8, and 36.5 GHz. The 89 GHz channels are not shown. Drifts and seasonal oscillations are apparent.
RSS Tech. Rpt. 05112021 19Fig. 9. V8.2 AMSR-2 Measured minus ORTM TA (K) for H-Pol channels. Black curves correspond to ascending orbit segments (1:30 pm)
and red curves correspond to descending orbit segments (1:30 am). The 6 frames from top to bottom are 6.9, 7.3, 10.7, 18.7, 23.8, and
36.5 GHz. Drifts are gone and seasonal oscillations are diminished.
RSS Tech. Rpt. 05112021 20Conclusions
The spurious drifts in the V8.0 AMSR-2 AS-ECVs have been removed by:
1. Correcting the way in which the hot-load temperature is calculated.
2. Making the non-linearity coefficients a function of the SPC temperatures.
In the future, we will carefully monitor the AMSR-2 performance relative to the GPM Microwave Imager
(GMI) to verify the V8.2 AS-ECVs remain stable over time.
RSS Tech. Rpt. 05112021 21You can also read