An Interface for User-Centred Process and Correlation Between Large Datasets
←
→
Page content transcription
If your browser does not render page correctly, please read the page content below
An Interface for User-Centred Process
             and Correlation Between Large Datasets

 Dimitris Spiliotopoulos1(B) , Theodoros Giannakopoulos2 , Costas Vassilakis2                ,
       Manolis Wallace2 , Marina Lantzouni3 , Vassilis Poulopoulos3 ,
                            and Dionisis Margaris3
    1 Department of Management Science and Technology, University of the Peloponnese,
                                      Tripoli, Greece
                                  dspiliot@uop.gr
    2 Department of Informatics and Telecommunications, University of the Peloponnese,
                                      Tripoli, Greece
    th.giannakopoulos@soda.dit.uop.gr, {costas,wallace}@uop.gr
      3 Department of Digital Systems, University of the Peloponnese, Sparta, Greece

          m.lantzouni@go.uop.gr, {vacilos,margaris}@uop.gr

       Abstract. Standard database query systems are designed to process data on a
       single installation only, and do not provide optimal solutions for cases that data
       from multiple sources need to be queried. In these cases, the sources may have
       different data schemata, data representations etc., necessitating extensive coding
       and data transformations to retrieve partial results and combine them to reach
       the desired outcome. Differences in schemata and representations may be subtle
       and remain unnoticed, leading to the production of erroneous results. The goal
       of this paper is to present an easy-to-use solution for the end users, enabling
       them to query data from a given set of databases through a single user interface.
       This user interface allows users to visualize database contents and query results,
       while facilities for uploading and validating the data are also accommodated. To
       demonstrate the applicability of our approach, a use case is presented where data
       from two different sources are uploaded into the system and thereafter the data
       from the two databases can be utilized in tandem. The usability evaluation involved
       software developers in free evaluation scenarios.

       Keywords: User interface · Usability · Query · Multiple data sources ·
       Visualisation · Big data

1 Introduction
Nowadays, services and data are offered by multiple providers and when a result must
be produced based on a combination of information found in different providers/DBs, a
substantial amount of work is required, either to develop custom solutions or appropri-
ately configure and tune software [1–4]. Examples of this phenomenon include shopping
(where a supermarket further away may have an offer on some merchandise we want to
buy, however this purchase incurs higher fuel consumption), everyday news or finding a

© Springer Nature Switzerland AG 2021
M. M. Soares et al. (Eds.): HCII 2021, LNCS 12779, pp. 477–494, 2021.
https://doi.org/10.1007/978-3-030-78221-4_32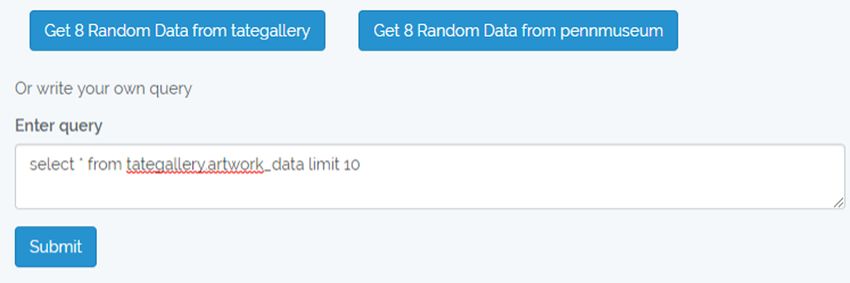
478     D. Spiliotopoulos et al.

vacation destination. To better demonstrate the motivation of this work, let us consider a
scenario where a newly married couple have a strict budget of 3,000 Euros to go on vaca-
tion in a European capital. The information required to plan this vacation is dispersed
across at least 4 different databases (living expenses, air travel, accommodation service
and car rental service) and therefore, the interested couple (or a mediating programmer)
would have to write a significant amount of code (multiple queries for a single result
or ranked results, followed by more code to combine the partial results). In the latter
case, the interested party must manually search for available rooms in the location(s)
of interest, mode of travel (e.g., plane, boat), possibly car rental, food costs/expenses,
etc. Even if it is done using software (e.g., programmatically invoking appropriate web
services), the overall task will be computationally expensive, since the solution space
that should be searched equals the Cartesian product accommodation × travel × car
rental, and the identification of the global minimum is a difficult task [5, 6]. If, however,
all the necessary information were on a single database, the overall task would be greatly
simplified, because a single query (e.g., SQL) would suffice to retrieve the desired result,
and the DBMS would appropriately optimize the query execution plan, exploiting the
physical organization of the data, index structures, histograms and other structures to
compute the results in an efficient fashion. However, as noted above, in real life scenarios
the information is dispersed across multiple sources/databases, each employing its own
data representation, and henceforth it is not possible to use a single query to gather the
results.
     The goal of this work is to present the implementation of an easy-to-use solution,
through which the end user can query data from a given set of databases through a user
interface (UI) [7]. The UI would also provide a graphical representation of the given
databases and the ability to upload data and validate the data via a GUI. To this end, the
solution was implemented as a web-based application, on top of the Laravel framework
[8, 9]. Before the implementation commenced, a survey was conducted to identify tools
providing the desired set of functionalities, however no such tools were identified.
     In order to be able to query an information repository (e.g. a database, data warehouse,
Google Cloud/S3 buckets, Google Big Query tables, etc.) specific access rights should
be given to the corresponding parties beforehand. Process-wise, this can be really time-
consuming and impractical, since it involves communication between parties entailing
access requests, examination of the relevant justifications to reach decisions whether
the requests will be honoured or denied, communicating the decisions to the requesting
parties and applying the decisions to the database authorization subsystem, and finally
querying the corresponding datasets. Furthermore, users should familiarize themselves
with diverse UIs, which raises usability considerations [10–13].
     Taking all the above into account, the tool presented in this paper provides a man-
ageable solution to facilitate users’ access to multiple resources under a unified process
and from within a single UI, allowing the end-user to query multiple given datasets.
To demonstrate our approach, a use case entailing data from two different sources is
presented. More specifically, both our data sources originate from art museums, namely
the Tate Gallery (https://www.penn.museum/collections/objects/data.php) and the Penn
Museum (https://github.com/tategallery/collection). In the presented use case, only the
CSV format files were used. The different data structures from our sources were mapped
An Interface for User-Centred Process and Correlation   479

to corresponding structures in the unified database, in order to store the data; addition-
ally, associations were established between data elements as appropriate, e.g., for the
data that originate from the tategallery collection, associations between artists and the
corresponding artwork were established based on the artist identifier; similarly, for the
data that originates from the penn.museum collection, associations between the origin
of the artworks and the artworks were established.
     The remainder of the paper is presented as follows: Sect. 2 overviews related work.
Section 3 presents the proposed application. In Sect. 4 we present the system adminis-
tration functionalities, and, finally, Sect. 5 concludes the paper and outlines the future
work.

2 Related Work

Although database query optimization and personalization are fields that have been
the subject of significant research efforts in the recent past [14–19], research in cross-
database query optimization and personalization is extremely less developed. Li et al.
[20] proposed a data querying integrated heterogeneous processing model containing
four components: data set, data source, data model, and analysis tool and introduced a
unified data model, and proposed the SimbaQL query language, for the description of
the data processing steps against the unified data model.
    Hu et al. [21] proposed three kinds of distributed storage and query of multi-source
heterogeneous data optimizations. These were based on secondary index, secondary
index based on hotscore, and cache strategy based on the Redis hot data. The afore-
mentioned schemes were analysed and evaluated. The query optimization of HBase
hot data, which was based on the Redis hot data caching strategy, was proven to yield
the best results. Wu et al. [22] focused on heterogeneous data management strategy of
multi-source culture and a data service method. They also proposed and established a
strategy for storing multi-source heterogeneous culture databases on MongoDB. Then,
they explored the sharing, indexing and query mechanisms for the culture database.
Finally, they constructed the prototype system for culture data management prototype
system.
    Liu et al. [23] proposed a versatile event-driven data model in HBase for multi-source
power grid, which was used to solve the multi-source data hereditary compatibility issues.
For query performance improvement, a Virtual Column Family mechanism was designed
and implemented. Chen et al. [24] proposed an intelligent search method that was multi-
database oriented. The aim of that approach was to mitigate the deficiencies of big data
storage, search and usage of power dispatching and control systems. Their work divided
the data into three tiers: model, runtime and real time analysis data. Then a unified
intelligent search, management, and storage method was constructed for multitudinous
control and dispatch of big data, in order to achieve performance improvement on diverse
analytics using big data search, application, display and storage.
    Miyamoto et al. [25] implemented a system of multiple databases. It was based on
MySQL and utilised the SPIDER storage engine, in order to overcome the data migration
problem between single storage units (databases) in the multi-database system. That
system was used to evaluate the incremental data migration technique. Daniel et al. [26]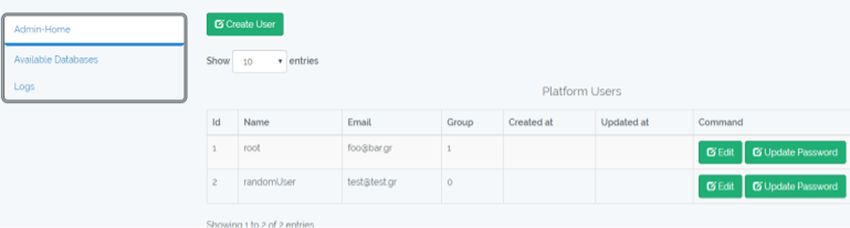
480     D. Spiliotopoulos et al.

presented a scalable model persistence framework based on a modular architecture that
enabled the modelling of storage into multiple data stores, termed as NEOEMF. The
framework provided three new model-to-database mappings. They were designed to
complement existing persistence methods and enable the storing of models in graph,
column, and key-value databases. NEOEMF provides two APIs. The first is a standard
API that ensures compatibility with the Eclipse Modelling Framework API and supports
the NEOEMF integration with existing modelling tools, requiring minimal code base
change. The second is an advanced API that ensures improved scalability for specific
modelling scenarios through support of special features that complement the standard
EMF API.
    Rachman and Saptawati [27] proposed an approach for intervolving linguistic-based
and constraint-based schema matching techniques into matched, hybrid combination
schemas. Hybrid combination matching results are used in the matching of individual
schemas to complement each other. The hybrid schemas can be applied in query rewriting
as multi-database query processing. Phungtua and Chittayasothorn [28] developed a
multi-database instance matching system that is used to retrieve data from separate
sources. The data may be references to different attribute details and unique identifiers.
The database instances are matched using entity resolution [29–31]. An ontology is used
to store the semantic relations between the identified entity instances that are matched.
The users may use queries to the ontology, which are then rewritten by the system to
create appropriate references to the original instances of the multiple databases.
    Naik [32] described a method for data retrieval from multiple heterogeneous dis-
tributed relational database management systems such as MS Access, MySQL, and
PostgreSQL into the Oracle RDBMS using the Heterogeneous Gateway Services by
Oracle. The method requires the developer to download and install the software, use
open database connectivity to create the data source names, modify the system param-
eters, check the connections, create synonyms for remote database tables into Oracle,
create database links and access data from non-Oracle databases. The approach neces-
sitates the manipulation of data from Oracle in remote databases via PL/SQL command
execution. Finally, troubleshooting is required to address the generated common errors.
    While some of the works listed above aim to provide access to users to multiple
resources under a unified process and within a single and comprehensive UI, some of
them require substantial IT staff contribution (e.g. [32]), while others target different
needs (e.g. [25] addresses the issue of data migration) or focus on a specific domain
only (e.g. [23]). This paper aims to fill this gap, providing a solution that enables the
end-user to query multiple datasets under a single UI, with no requirements for technical
expertise.

3 The Application
The following subsections elaborate on the functionality of the proposed system that
is available to the end-user, and more specifically (a) query formulation, (b) data
visualization and (c) data upload and validation.
An Interface for User-Centred Process and Correlation 481
3.1 Query the Database from the UI
The user is able to query different available databases from the interface. The interface
is illustrated in Fig. 1.
Fig. 1. User interface for queries.
Besides the main area of the UI that allows the user to enter the query, the structure
of the existing databases is made available to the end-user, via the “Available databases”
area on the left of the screen. Each database name functions as a dropdown, containing
information regarding the structure of the databases and number of the entries that they
contain. Figure 2 illustrates the content of the dropdown, when expanded.
Fig. 2. List of available data collections, as provided by the application (nb. the schema of the
artwork_data table is actually displayed below the schema of the artist_data table, but appears
here on the right for better page space management).
User queries must be syntactically correct, in order to be validated and executed.
To assist users in query formulation, relevant guidance and tips are provided on the
interface, as shown in Fig. 3.482 D. Spiliotopoulos et al.
Fig. 3. Instructions provided to the end-user regarding the query formulation syntax.
Fig. 4. Hierarchical visualization of a randomly selected item collection.An Interface for User-Centred Process and Correlation 483
3.2 Data Visualization
Besides being able to query the databases, the user is able to visualize the results. The
incorporation of visualization capabilities was deemed important, since it presents results
in a more easily perceivable format, promoting user insight, and discovery of trends and
patterns discovery [33].
Data visualization was implemented on top of the D3.js JavaScript library [34–36].
The impact that has the screen clutter on the user experience when the presented screen
is overload with information was taken into account, in order to tune the visualization
functionality. Therefore, when the user requests the visualization of the full contents
of a database table, only eight random data entries from the selected data source are
displayed, since the user typically wants to explore the schema and the extension of
the database table. However, when user queries are evaluated and displayed, the full
result set is visualized, considering that the user is interested in all records within the
query result; to alleviate clutter, the user may consider limiting the records in the result
using query language constructs. To present our data we have used a dendrogram [37,
38]. In the screenshots that follow, the hierarchical connection between the presented
objects is illustrated; the hierarchical connection is maintained both when the visualized
data corresponds to a random data selection (Fig. 4), as well as in the case when it has
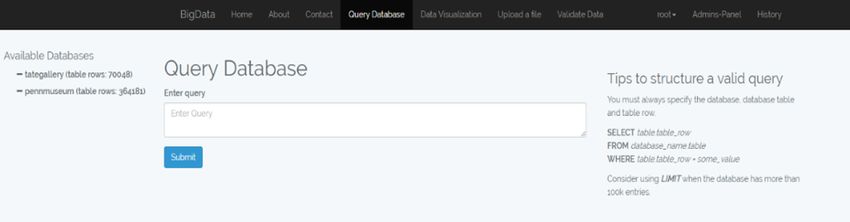
emerged as the result of a submitted query (Fig. 5). The query used to retrieve the dataset
depicted in Fig. 5 is shown in Fig. 6.
The realization of the visualization of a new dataset entails the following steps:
• Study of the structure of the new dataset, to gain insight on the most effective way to
present the information to the users.
• Design of how to form correctly a formatted string, so the D3 library can render the
visualization.
• Creation of an appropriate function in the visualization controller to handle the corre-
sponding request from the UI. In this step, the existing visualizations can be consulted,
reused and tailored as needed.
• Introduce appropriate controls at UI level, which will allow the visualization
implementation to be called.
• Add entry to the routes table to map the corresponding controller function and the UI.
Notably, these steps are carried out by IT staff, with the cooperation of the end-users,
who will provide the requirements for the visualization.484 D. Spiliotopoulos et al.
Fig. 5. Hierarchical visualization of the results of a user-provided query.
Fig. 6. User-provided query.
A sample format of a JSON string [39, 40] to be passed to the D3 visualization
library, in order for a hierarchical visualization to be rendered is shown in Fig. 7.An Interface for User-Centred Process and Correlation 485
{
"name": "responsedata",
"children": [
{
"name": "id5"
},
{
"name": "id6",
"children": [
{
"accession_number": "T07800"
},
{
"artist_role": "artist"
},
{
"artist_id": "202"
},
{
"title": "Landscape, Blasted tree"
}
]
},
{
"name": "id7"
}
]
}
Fig. 7. An excerpt from the JSON string passed to the D3 visualization library to render the tree
in Fig. 5.
3.3 Data Upload and Validation
The user may populate the databases with the corresponding data, by uploading appro-
priately formatted files to the system. The following preprocessing steps are initially
applied to the data file:
• redundant spaces from the entries are removed,
• non UTF-8 characters and character sequences are replaced with the corresponding
correct one in the UTF-8 character set: for instance, the character sequence é is
replaced by the é character; and
• all single quotes are replaced with double quotes.
When a file is uploaded, an ETL process [41–43] is triggered that extracts the data
from the given CSV file, transforms the data and then populates the corresponding
database table with the data. The current implementation accepts only CSV files, while
server settings regarding the maximum size of the uploaded file may be applicable.
Data uploaded to the system may have been validated to be correct and factual, or
may have been harvested from diverse sources, and be in need of inspection and valida-
tion before they are made available as production data. To this end, the data that users
upload is not directly inserted into the actual database but are staged into an intermedi-
ate one. Thereafter, the data validation part to is delegated to users, and performed as486 D. Spiliotopoulos et al.
a crowdsourcing task: users are presented with a data panel, containing random entries
from the intermediate database, and are able to vote whether the entries are factual and
accurate or not. If an entry receives a sufficient number of upvotes, it is moved from the
staging database to the production one, whereas if an entry is downvoted multiple times,
it is deleted. To avoid user bias and assess the trustworthiness of each user’s votes, some
of the entries in validation panel are sourced from the main database: if the user is found
to downvote entries from the main database, then the vote trustworthiness is reduced.
Provisions are also available for the administrator to admit or delete all entries in a bulk
fashion, should the whole of the data be deemed trustworthy/suitable (e.g. having been
obtained from a reliable source) or untrustworthy/unsuitable, respectively. The UI for
the file upload is shown in Fig. 8, while the UI for the data panel is illustrated in Fig. 9.
Fig. 8. User interface for file upload
Fig. 9. UI for dataset validation.
The schema of the tables in the staging database is identical to the schema of the
table in the production database with the exception of an extra column that is added to
the staging database table, to accommodate the validation votes from the users [44, 45].An Interface for User-Centred Process and Correlation 487
When a user uploads a CSV file, an ETL process is triggered to realize the data inges-
tion. Firstly, the content headers of the CSV file are checked against the schema of the
database table, and subsequently all input is sanitized, checked for schema compliance
and finally data are inserted in the staging database table. After the successful upload of
the data, users are able to go to corresponding validation screen within the UI and vote
for the presented entries. As noted above, entries in the validation panel are randomly
selected either from the main database or the staging one. When the user votes, after
examining whether the corresponding entry is correct or not, the following actions are
taken:
• if the entry has been sourced from the main database, then an upvote will increase the
user’s vote trustworthiness, while a downvote will have the opposite effect.
• if the entry has been sourced from the in the staging database, an upvote or downvote
will adjust the entry’s score; the adjustment value is moderated by the user’s vote
trustworthiness. When the entry’s score exceeds a predefined threshold, the entry is
moved from the staging database to the main one, while if the entry’s score falls below
some negative threshold, it is discarded from the database.
The system provides support for the cases that an administrator uploads a trusted
dataset and wants to release the data for immediate use, bypassing the validation stage.
In this case, the administrator selects the relevant functionality from the UI, and-after an
appropriate confirmation step- the system moves all the data from the staging database
to the main one. Internally, the system performs this step by issuing SQL statements that
perform bulk insertion of the staging database data to the main database, followed by
statements that delete the data from the staging database.
4 System Administration Functionalities
The application has two different user levels, namely the administrator user level and the
basic user level. Both user levels may submit queries to the available databases, upload
data to one of the databases and visualize sample database contents and query results,
using one of the available visualization methods.
Members of the administrator user class, however, have more functionalities available
within the application, in comparison to basic users.
4.1 User Management
Administrator users are able to manage system users, i.e. (a) create users, (b) update
users’ passwords and emails, (c) change user level and (d) delete users. Figure 10 depicts
the basic user management screen.488 D. Spiliotopoulos et al.
Fig. 10. User management.
4.2 Database Access Rights
The administrator is able to specify which databases users are able to query, by desig-
nating which databases are available to all users for querying, as depicted in Fig. 11.
Databases may be marked as “Private” or “Public”. “Private” databases are only avail-
able to administrators for curation and may be subsequently made available to the public.
Moreover, a database may be made available to the public for a limited time, and then
moved to private space, where it can be curated and then made again publicly available.
Fig. 11. Specifying database access permissions.An Interface for User-Centred Process and Correlation 489
4.3 Check Logs
Finally, administrators have the option to check the logs of the submitted queries from all
users, as Fig. 12 depicts, where erroneous, suspicious and malicious queries are marked
in red. Administrators may exploit this information to offer assistance and guidance
to users that submit erroneous queries, further analyze suspicious queries or ban users
that submit malicious queries. Especially for users that submit a high rate of erroneous
queries, the system could adapt itself by offering additional assistance through the UI,
or allow/use by default query-by-example features instead of SQL. Such amenities will
be considered in future releases of the system.
Fig. 12. Log examination by admin users.
5 Conclusion and Future Work
In this work an easy-to-use solution that gives the end-user the ability to query a set of
databases through a single and user-friendly UI was introduced. The UI provides access
to a number of functionalities, including the provision of a graphical representation
of the databases, the ability to upload the data to the platform and validate through a
graphical interface. In order to demonstrate the capabilities of the UI, a use case with two
databases (one from the Tate Gallery and one from the Penn Museum) was presented.
Furthermore, users are provided with facilities to query as well as validate the available
databases from the UI. We note here that there were no correlations between our two data490 D. Spiliotopoulos et al.
sources due to the high degree of dissimilarity between them, both in terms of structure
and in terms of content.
Our future work will focus on considering social media data for search enrichment
[46–50] and recommendation accuracy [51–54], as well as personalization techniques
for upgraded prediction accuracy [55–60] and personalized ranking [61–64].
References
1. Jia, F., Blome, C., Sun, H., Yang, Y., Zhi, B.: Towards an integrated conceptual framework of
supply chain finance: an information processing perspective. Int. J. Prod. Econ. 219, 18–30
(2020). https://doi.org/10.1016/j.ijpe.2019.05.013
2. Ortega, J.L.: Blogs and news sources coverage in altmetrics data providers: a comparative
analysis by country, language, and subject. Scientometrics 122, 555–572 (2020). https://doi.
org/10.1007/s11192-019-03299-2
3. Margaris, D., Vassilakis, C., Georgiadis, P.: An integrated framework for adapting WS-BPEL
scenario execution using QoS and collaborative filtering techniques. Sci. Comput. Program.
98 (2015). https://doi.org/10.1016/j.scico.2014.10.007
4. Margaris, D., Vassilakis, C., Georgiadis, P.: An integrated framework for QoS-based adap-
tation and exception resolution in WS-BPEL scenarios. In: Proceedings of the 28th Annual
ACM Symposium on Applied Computing - SAC 2013. p. 1900. ACM Press, New York, New
York, USA (2013). https://doi.org/10.1145/2480362.2480714
5. Yang, J., Chen, B., Xia, S.-T.: Mean-removed product quantization for approximate nearest
neighbor search. In: 2019 International Conference on Data Mining Workshops (ICDMW),
pp. 711–718. IEEE, Beijing, China (2019). https://doi.org/10.1109/ICDMW.2019.00107
6. Asadi, S., Mansouri, H., Darvay, Z., Zangiabadi, M., Mahdavi-Amiri, N.: Large-neighborhood
infeasible predictor-corrector algorithm for horizontal linear complementarity problems over
cartesian product of symmetric cones. J. Optim. Theory Appl. 180, 811–829 (2019). https://
doi.org/10.1007/s10957-018-1402-6
7. Margaris, D., Spiliotopoulos, D., Vassilakis, C., Karagiorgos, G.: A user interface for per-
sonalized web service selection in business processes. In: Stephanidis, C., et al. (eds.) HCII
2020. LNCS, vol. 12427, pp. 560–573. Springer, Cham (2020). https://doi.org/10.1007/978-
3-030-60152-2_41
8. Yadav, N., Rajpoot, D.S., Dhakad, S.K.: LARAVEL: a PHP framework for e-commerce
website. In: 2019 Fifth International Conference on Image Information Processing (ICIIP),
pp. 503–508. IEEE, Shimla, India (2019). https://doi.org/10.1109/ICIIP47207.2019.8985771
9. Mahmood, M.T., Ashour, O.I.A.: Web application based on MVC laravel architecture for
online shops. In: Proceedings of the 6th International Conference on Engineering & MIS
2020, pp. 1–7. ACM, Almaty Kazakhstan (2020). https://doi.org/10.1145/3410352.3410834
10. Spiliotopoulos, D., Kotis, K., Vassilakis, C., Margaris, D.: Semantics-driven conversational
interfaces for museum chatbots. In: Rauterberg, M. (ed.) Culture and Computing, pp. 255–266.
Springer International Publishing, Cham (2020). https://doi.org/10.1007/978-3-030-50267-
6_20
11. Varitimiadis, S., Kotis, K., Spiliotopoulos, D., Vassilakis, C., Margaris, D.: “Talking” triples
to museum chatbots. In: Rauterberg, M. (ed.) Culture and Computing, pp. 281–299. Springer
International Publishing, Cham (2020). https://doi.org/10.1007/978-3-030-50267-6_22
12. Koryzis, D., Fitsilis, F., Spiliotopoulos, D., Theocharopoulos, T., Margaris, D., Vassilakis,
C.: Policy making analysis and practitioner user experience. In: Stephanidis, C., Marcus, A.,
Rosenzweig, E., Rau, P.-P.L., Moallem, A., Rauterberg, M. (eds.) HCII 2020. LNCS, vol.
12423, pp. 415–431. Springer, Cham (2020). https://doi.org/10.1007/978-3-030-60114-0_29An Interface for User-Centred Process and Correlation 491
13. Kouroupetroglou, G., Spiliotopoulos, D.: Usability methodologies for real-life voice user
interfaces. Int. J. Inf. Technol. Web Eng. 4, 78–94 (2009). https://doi.org/10.4018/jitwe.200
9100105
14. Margaris, D., Vassilakis, C., Georgiadis, P.: Query personalization using social network infor-
mation and collaborative filtering techniques. Futur. Gener. Comput. Syst. 78, 440–450 (2018).
https://doi.org/10.1016/j.future.2017.03.015
15. Sharma, S., Rana, V.: Web search personalization using semantic similarity measure. In:
Singh, P.K., Kar, A.K., Singh, Y., Kolekar, M.H., Tanwar, S. (eds.) Proceedings of ICRIC
2019. LNEE, vol. 597, pp. 273–288. Springer, Cham (2020). https://doi.org/10.1007/978-3-
030-29407-6_21
16. Azhir, E., Jafari Navimipour, N., Hosseinzadeh, M., Sharifi, A., Darwesh, A.: Determinis-
tic and non-deterministic query optimization techniques in the cloud computing. Concurr.
Comput. Pract. Exp. 31, (2019). https://doi.org/10.1002/cpe.5240
17. Sharma, M., Singh, G., Singh, R.: A review of different cost-based distributed query
optimizers. Prog. Artif. Intell. 8, 45–62 (2019). https://doi.org/10.1007/s13748-018-0154-8
18. Demidova, E., et al.: Analysing and enriching focused semantic web archives for parliament
applications. Futur. Internet. 6, 433–456 (2014). https://doi.org/10.3390/fi6030433
19. Risse, T., et al.: The ARCOMEM architecture for social- and semantic-driven web archiving.
Futur. Internet. 6, 688–716 (2014). https://doi.org/10.3390/fi6040688
20. Li, Y., Shen, Z., Li, J.: SimbaQL: a query language for multi-source heterogeneous data. In: Li,
J., Meng, X., Zhang, Y., Cui, W., Du, Z. (eds.) Big Scientific Data Management, pp. 275–284.
Springer International Publishing, Cham (2019). https://doi.org/10.1007/978-3-030-28061-
1_27
21. Hu, X., Xu, H., Jia, J., Wang, X.: Research on distributed storage and query optimization of
multi-source heterogeneous meteorological data. In: Proceedings of the 2018 International
Conference on Cloud Computing and Internet of Things - CCIOT 2018, pp. 12–18. ACM
Press, Singapore, Singapore (2018). https://doi.org/10.1145/3291064.3291068
22. Wu, Q., Chen, C., Jiang, Y.: Multi-source heterogeneous Hakka culture heritage data manage-
ment based on MongoDB. In: 2016 Fifth International Conference on Agro-Geoinformatics
(Agro-Geoinformatics), pp. 1–6. IEEE, Tianjin, China (2016). https://doi.org/10.1109/Agro-
Geoinformatics.2016.7577628
23. Liu, B., et al.: A Versatile event-driven data model in HBase database for multi-source data of
power grid. In: 2016 IEEE International Conference on Smart Cloud (SmartCloud). pp. 208–
213. IEEE, New York, NY, USA (2016). https://doi.org/10.1109/SmartCloud.2016.28
24. Chen, Z., et al.: A multi-database hybrid storage method for big data of power dis-
patching and control. In: 2019 IEEE SmartWorld, Ubiquitous Intelligence & Com-
puting, Advanced & Trusted Computing, Scalable Computing & Communications,
Cloud & Big Data Computing, Internet of People and Smart City Innovation
(SmartWorld/SCALCOM/UIC/ATC/CBDCom/IOP/SCI), pp. 502–507. IEEE, Leicester,
United Kingdom (2019). https://doi.org/10.1109/SmartWorld-UIC-ATC-SCALCOM-IOP-
SCI.2019.00127
25. Miyamoto, N., Higuchi, K., Tsuji, T.: Incremental data migration for multi-database systems
based on MySQL with spider storage engine. In: 2014 IIAI 3rd International Conference on
Advanced Applied Informatics. pp. 745–750. IEEE, Kokura Kita-ku, Japan (2014). https://
doi.org/10.1109/IIAI-AAI.2014.151
26. Daniel, G., et al.: NeoEMF: a multi-database model persistence framework for very large
models. Sci. Comput. Program. 149, 9–14 (2017). https://doi.org/10.1016/j.scico.2017.08.002
27. Rachman, M.A.F., Saptawati, G.A.P.: Database integration based on combination schema
matching approach (case study: Multi-database of district health information system). In:
2017 2nd International conferences on Information Technology, Information Systems and492 D. Spiliotopoulos et al.
Electrical Engineering (ICITISEE), pp. 430–435. IEEE, Yogyakarta (2017). https://doi.org/
10.1109/ICITISEE.2017.8285544
28. Phungtua-Eng, T., Chittayasothorn, S.: A multi-database access system with instance match-
ing. In: Nguyen, N.T., Tojo, S., Nguyen, L.M., Trawiński, B. (eds.) Intelligent Information
and Database Systems, pp. 312–321. Springer International Publishing, Cham (2017). https://
doi.org/10.1007/978-3-319-54472-4_30
29. Xydas, G., Spiliotopoulos, D., Kouroupetroglou, G.: Modeling prosodic structures in linguis-
tically enriched environments. In: Sojka, P., Kopeček, I., Pala, K. (eds.) TSD 2004. LNCS
(LNAI), vol. 3206, pp. 521–528. Springer, Heidelberg (2004). https://doi.org/10.1007/978-
3-540-30120-2_66
30. Spiliotopoulos, D., Xydas, G., Kouroupetroglou, G., Argyropoulos, V., Ikospentaki, K.:
Auditory universal accessibility of data tables using naturally derived prosody specification.
Univers. Access Inf. Soc. 9(2), 169–183 (2010). https://doi.org/10.1007/s10209-009-0165-0
31. Xydas, G., Spiliotopoulos, D., Kouroupetroglou, G.: Modeling improved prosody generation
from high-level linguistically annotated corpora. IEICE Trans. Inf. Syst. E88-D, 510–518
(2005). https://doi.org/10.1093/ietisy/e88-d.3.510
32. Naik, S.T.: Accessing data from multiple heterogeneous distributed database systems. In:
Applying Integration Techniques and Methods in Distributed Systems and Technologies: IGI
Global (2019). https://doi.org/10.4018/978-1-5225-8295-3.ch008
33. Chen, C.: Information visualization. Wiley Interdiscip. Rev. Comput. Stat. 2, 387–403 (2010).
https://doi.org/10.1002/wics.89
34. Dasari, V., Allen, S., Brown, S.E.: Dynamic visualization of large scale tactical network
simulations. In: 2019 IEEE International Conference on Big Data (Big Data), pp. 3951–3954.
IEEE, Los Angeles, CA, USA (2019). https://doi.org/10.1109/BigData47090.2019.9005641
35. Sun, Y.: Third-party library integration. In: Practical Application Development with AppRun,
pp. 163–190. Apress, Berkeley, CA (2019)
36. Lu, T., Zhang, P., Li, H.: Practice teaching reform of discrete mathematics model based on
D3.js. In: 2019 14th International Conference on Computer Science & Education (ICCSE),
pp. 379–384. IEEE, Toronto, ON, Canada (2019). https://doi.org/10.1109/ICCSE.2019.884
5409
37. Urmela, S., Nandhini, M.: Collective dendrogram clustering with collaborative filtering for
distributed data mining on electronic health records. In: 2017 Second International Confer-
ence on Electrical, Computer and Communication Technologies (ICECCT), pp. 1–5. IEEE.
Coimbatore (2017). https://doi.org/10.1109/ICECCT.2017.8117876
38. Arief, V.N., DeLacy, I.H., Basford, K.E., Dieters, M.J.: Application of a dendrogram seriation
algorithm to extract pattern from plant breeding data. Euphytica 213, 85 (2017). https://doi.
org/10.1007/s10681-017-1870-z
39. Darmawan, I., Rahmatulloh, A., Nuralam, I.M.F., Gunawan, R.: Optimizing data storage
in handling dynamic input fields with JSON string compression. In: 2020 8th Interna-
tional Conference on Information and Communication Technology (ICoICT), pp. 1–5. IEEE,
Yogyakarta, Indonesia (2020). https://doi.org/10.1109/ICoICT49345.2020.9166458
40. Pezoa, F., Reutter, J.L., Suarez, F., Ugarte, M., Vrgoč, D.: Foundations of JSON schema.
In: Proceedings of the 25th International Conference on World Wide Web, pp. 263–273.
International World Wide Web Conferences Steering Committee, Montréal Québec Canada
(2016). https://doi.org/10.1145/2872427.2883029
41. Vyas, S., Vaishnav, P.: A comparative study of various ETL process and their testing techniques
in data warehouse. J. Stat. Manag. Syst. 20, 753–763 (2017). https://doi.org/10.1080/097
20510.2017.1395194
42. Biswas, N., Chattopadhyay, S., Mahapatra, G., Chatterjee, S., Mondal, K.C.: SysML based
conceptual ETL process modeling. In: Mandal, J.K., Dutta, P., Mukhopadhyay, S. (eds.)An Interface for User-Centred Process and Correlation 493
Computational Intelligence, Communications, and Business Analytics, pp. 242–255. Springer
Singapore, Singapore (2017). https://doi.org/10.1007/978-981-10-6430-2_19
43. Pereira, A.P., Cardoso, B.P., Laureano, R.M.S.: Business intelligence: performance and sus-
tainability measures in an ETL process. In: 2018 13th Iberian Conference on Information
Systems and Technologies (CISTI), pp. 1–7. IEEE, Caceres (2018). https://doi.org/10.23919/
CISTI.2018.8399473
44. Georgiou, M.A., Paphitis, A., Sirivianos, M., Herodotou, H.: Hihooi: A database replication
middleware for scaling transactional databases consistently. IEEE Trans. Knowl. Data Eng.
1 (2020). https://doi.org/10.1109/TKDE.2020.2987560
45. Dong, L., Liu, W., Li, R., Zhang, T., Zhao, W.: Replica-aware partitioning design in parallel
database systems. In: Rivera, F.F., Pena, T.F., Cabaleiro, J.C. (eds.) Euro-Par 2017: Parallel
Processing, pp. 303–316. Springer International Publishing, Cham (2017). https://doi.org/10.
1007/978-3-319-64203-1_22
46. Spiliotopoulos, D., Margaris, D., Vassilakis, C.: Data-assisted persona construction using
social media data. Big Data Cogn. Comput. 4, 21–21 (2020). https://doi.org/10.3390/bdcc40
30021
47. Margaris, D., Vassilakis, C., Spiliotopoulos, D.: Handling uncertainty in social media textual
information for improving venue recommendation formulation quality in social networks.
Soc. Netw. Anal. Min. 9, 64 (2019). https://doi.org/10.1007/s13278-019-0610-x
48. Preece, A., et al.: https://doi.org/10.1109/access.2020.2981567. IEEE Trans. Comput. Soc.
Syst. 5, 118–131 (2018). https://doi.org/10.1109/TCSS.2017.2763684
49. Aivazoglou, M., et al.: A fine-grained social network recommender system. Soc. Netw. Anal.
Min. 10, 8 (2020). https://doi.org/10.1007/s13278-019-0621-7
50. Margaris, D., Kobusinska, A., Spiliotopoulos, D., Vassilakis, C.: An adaptive social network-
aware collaborative filtering algorithm for improved rating prediction accuracy. IEEE Access.
8, 68301–68310 (2020). https://doi.org/10.1109/ACCESS.2020.2981567
51. Winter, S., Maslowska, E., Vos, A.L.: The effects of trait-based personalization in social media
advertising. Comput. Hum. Behav. 114, (2021). https://doi.org/10.1016/j.chb.2020.106525
52. Margaris, D., Vassilakis, C., Spiliotopoulos, D.: What makes a review a reliable rating in
recommender systems? Inf. Process. Manag. 57, (2020). https://doi.org/10.1016/j.ipm.2020.
102304
53. Margaris, D., Spiliotopoulos, D., Vassilakis, C.: Social relations versus near neighbours:
reliable recommenders in limited information social network collaborative filtering for online
advertising. In: Proceedings of the 2019 IEEE/ACM International Conference on Advances in
Social Networks Analysis and Mining (ASONAM 2019), pp. 1160–1167. ACM, Vancouver,
B.C., Canada (2019). https://doi.org/10.1145/3341161.3345620
54. Metz, M., Kruikemeier, S., Lecheler, S.: Personalization of politics on facebook: examin-
ing the content and effects of professional, emotional and private self-personalization. Inf.
Commun. Soc. 23, 1481–1498 (2020). https://doi.org/10.1080/1369118X.2019.1581244
55. Margaris, D., Vassilakis, C.: Improving collaborative filtering’s rating prediction quality in
dense datasets, by pruning old ratings. In: 2017 IEEE Symposium Computer Communication,
pp. 1168–1174 (2017). https://doi.org/10.1109/ISCC.2017.8024683
56. Margaris, D., Spiliotopoulos, D., Vassilakis, C., Vasilopoulos, D.: Improving collaborative
filtering’s rating prediction accuracy by introducing the experiencing period criterion. Neural
Comput. Appl. (2020). https://doi.org/10.1007/s00521-020-05460-y
57. Wang, L., Zhang, X., Wang, R., Yan, C., Kou, H., Qi, L.: Diversified service recommendation
with high accuracy and efficiency. Knowl.-Based Syst. 204, (2020). https://doi.org/10.1016/
j.knosys.2020.106196
58. Margaris, D., Vasilopoulos, D., Vassilakis, C., Spiliotopoulos, D.: Improving collaborative
filtering’s rating prediction accuracy by introducing the common item rating past criterion. In:494 D. Spiliotopoulos et al.
2019 10th International Conference on Information, Intelligence, Systems and Applications,
pp. 1–8 (2019). https://doi.org/10.1109/IISA.2019.8900758
59. Singh, P.K., Sinha, M., Das, S., Choudhury, P.: Enhancing recommendation accuracy of item-
based collaborative filtering using Bhattacharyya coefficient and most similar item. Appl.
Intell. 50, 4708–4731 (2020). https://doi.org/10.1007/s10489-020-01775-4
60. Margaris, D., Spiliotopoulos, D., Vassilakis, C.: Improving collaborative filtering’s rat-
ing prediction quality by exploiting the item adoption eagerness information. In: 2019
IEEE/WIC/ACM International Conference on Web Intelligence (WI) 2019, pp. 342–347
(2019). https://doi.org/10.1145/3350546.3352544
61. Lian, D., Liu, Q., Chen, E.: Personalized ranking with importance sampling. In: Proceedings
of The Web Conference 2020, pp. 1093–1103. ACM, Taipei Taiwan (2020). https://doi.org/
10.1145/3366423.3380187
62. Hu, Z., Wang, J., Yan, Y., Zhao, P., Chen, J., Huang, J.: Neural graph personalized ranking
for Top-N recommendation. Knowl.-Based Syst. 213, (2021). https://doi.org/10.1016/j.kno
sys.2020.106426
63. Wu, B., Ye, Y.: BSPR: basket-sensitive personalized ranking for product recommendation.
Inf. Sci. (Ny) 541, 185–206 (2020). https://doi.org/10.1016/j.ins.2020.06.046
64. Liu, B., Chen, T., Jia, P., Wang, L.: Effective public service delivery supported by time-
decayed Bayesian personalized ranking. Knowl.-Based Syst. 206, (2020). https://doi.org/10.
1016/j.knosys.2020.106376You can also read